intermodal freight transport — key statistical dataaei.pitt.edu/73705/1/1992-97.pdf · preface...
TRANSCRIPT

ζ
o
o
Ui
Oí
Intermodal freight transport key statistical data
1 D ζ J J C · 3 1 9 9 2 - 1 9 9 7
THEME 7 Transport

e u r o s t a t STATISTICAL OFFICE O F T H E EUROPEAN C O M M U N I T I E S
L-2920 Luxembourg — Tél. 4301-1 — Télex COMEUR LU 3423 B-1049 Bruxelles, rue de la Loi 200 — Tél. 299 11 11
A great deal of additional information on the European Union is available on the Internet. It can be accessed through the Europa server (http://europa.eu.int).
Cataloguing data can be found at the end of this publication.
Luxembourg: Office for Official Publications of the European Communities, 1999
ISBN 92-828-7307-2
© European Communities, 1999
Printed in Luxembourg
PRINTED ON WHITE CHLORINE-FREE PAPER

τ»
O κ C LU
σι σι Ci
Intermodal freight transport key statistical data
1 9 9 2 - 1 9 9 7
#
* E U R O P E A N Δ C O M M I S S I O N eurOStat l e ^ i i J Transport
THEME 7

Preface
This publication is the first step to publish existing non-harmonised statistical data on intermodal freight transport concerning the European Union. The publication will be progressively improved in the future when more data on intermodal transport becomes available.
All comments and suggestions to improve this publication are welcome and should be sent to the following address:
European Commission Statistical Office of the European Communities Unit OS/C/2 Jean Monnet Building, Rue Alcide de Gasperi L-2920 Luxembourg
e-mail: [email protected]


EU Intermodal Freight Transport Ξ £
eurostat
TABLE OF CONTENTS
Introduction 7
Executive summary 8
Intermodal transport key data 10
General situation and trends of transport in Europe 11 Table 1.1 Transportin EU-15 by kind of commodities 12 Table 1.2 External trade EU-15 13 Chart 1.3 Growth of transport, gross domestic product and industrial production 14 Table 1.4 Share of each mode in the total inland transport 14 Chart 1.5 Evolution of the modal split for goods transport in EU-15 (1980-1996) 15
Transport infrastructure 17 Table 2.1 Road network 18 Table 2.2 Rail network 19 Table 2.3 Inland waterway network 20 Table 2.4 Inland waterway main container ports 21 Table 2.5 Top container ports 22 Table 2.6 Extension of the European combined transport network:
main projects of new lines 23 Map 2.7.a Trans-European railway corridors and terminals 24 Map 2.7.b Trans-European railway corridors and terminals in Benelux-countries,
Germany, France and Austria 25 Map 2.7.C Trans-European railway corridors and terminals in Spain,
the United Kingdom, Ireland and Portugal 26 Map 2.7.d Trans-European railway corridors and terminals in Denmark,
Sweden and Finland 27 Map 2.7.e Trans-European railway corridors in Greece and Italy 28 Map 2.7.f Trans-European combined transport plan inland waterways 29
Transport chains 31 Table 3.1 Continental and intercontinental transport chains, by type 32 Table 3.2 Inland traffic of maritime containers, by country and by inland
transport mode 33 Table 3.3 Traffic of manufactured products by transport chain
between Cataluna / Ruhrgebiet 34
Unitised transport by country 35 Chart 4.1 Unitised transport of the European railway companies 36 Table 4.2.a Intermodal transport including railway transport 37 Table 4.2.b Intermodal transport including railway transport 38 Table 4.3 International rail traffic of large containers 39 Table 4.4 National and transit rail traffic of large containers 39 Table 4.5 Road-rail traffic 40 Table 4.6.a Intermodal transport including maritime transport 41 Table 4.6.b Intermodal transport including maritime transport 42 Table 4.7 Rail-sea and road-sea traffic 43 Table 4.8 Container traffic of maritime ports by country 44 Table 4.9.a International unitised traffic of the UIRR members 45 Table 4.9.b International unitised traffic of the UIRR members 46

m. eurostat EU Intermodal Freight Transport
Unitised transport by operator 47 Table 5.1 Intermodal transport main operators 48 Table 5.2 Intermodal rail traffic by operator 49 Table 5.3 Transit rail traffic by ICF members 50 Table 5.4 Unitised rail transport: import of large containers by kind of frontier point 51 Table 5.5 Unitised rail transport: export of large containers by kind of frontier point 52 Table 5.6 Unitised rail transport: transit of large containers by kind of frontier point 53 Table 5.7.a Traffic of ICF by origin and destination railway 54 Table 5.7.b Traffic of ICF by origin and destination railway 55 Table 5.8 Share of combined transport technologies (UIRR members) 56 Table 5.9 Top 20 container service maritime operators 57
Unitised transport by nodes and links 59 Table 6.1 Port traffic (major European sea ports) 60 Table 6.2 Container traffic in major European ports 61 Table 6.3 Inland origins and destinations for the port of Rotterdam (example) 62 Table 6.4 Inland ports : fluvial and fluvio-maritime traffic 63 Table 6.5.a & b Inland containers shipping /journey times on the Rhine 64 Table 6.6 Freight traffic of major airports 65
Freight traffic through the Alps 67 Table 7.1 Traffic through the Mont-Cenis - Brenner segment 68 Table 7.2 Traffic between Germany / Benelux and Italy (Mont Cenis - Brenner segment) 68
Key contacts 69
Appendix Abbreviations (countries) 72 Acronyms and abbreviations 73 Glossary 74
EU Intermodal Freight Transport eurostat
Τ
Introduction
he promotion and development of intermodal transport is an important element of the Common Transport
Policy.
The aim of intermodality is to combine the strong points of transport in the best possible way. Intermodality is
a characteristic of a transport system that allows different modes to be used in an integrated manner in a door
to door transport chain (COM (97) 243 dated 29th May 1997)1. This integrated approach focuses on the
interlinkages between modes. Road, inland waterway, rail and other modes have in the past in many cases
been developed independently. There is therefore a growing need for statistical data on intermodal transport.
This need is explicitly referred to in the 1997 Communication from the Commission entitled "Intermodality and
intermodal freight transport in the European Union".
Knowledge and understanding of mobility patterns, transport logistics and the evaluation of the impacts of
different policy options on transport demand have to be based on reliable statistical data.
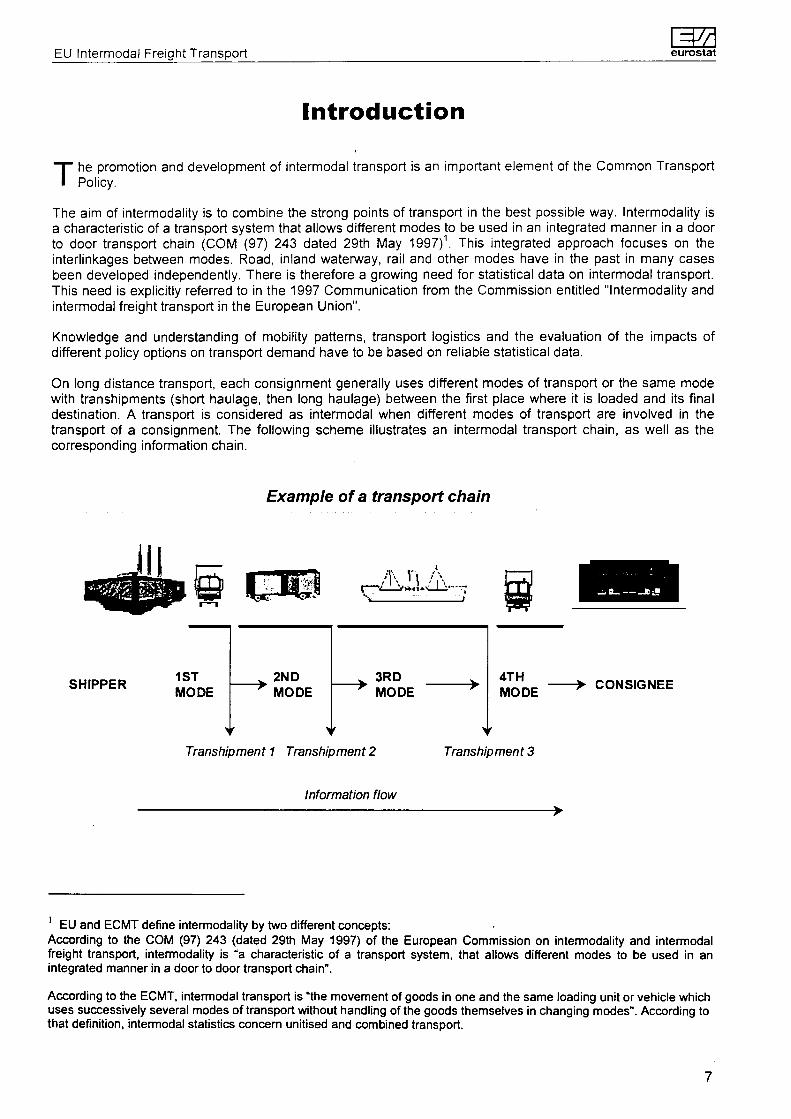
On long distance transport, each consignment generally uses different modes of transport or the same mode with transhipments (short haulage, then long haulage) between the first place where it is loaded and its final destination. A transport is considered as intermodal when different modes of transport are involved in the transport of a consignment. The following scheme illustrates an intermodal transport chain, as well as the corresponding information chain.
Example of a transport chain
Λ Π /Λ
SHIPPER 1ST
MODE 2ND
MODE
3RD
MODE
▼ y
Transhipment 1 Transhipment 2
4TH MODE
-> CONSIGNEE
Transhipment 3
Information flow
EU and ECMT define intermodality by two different concepts: According to the COM (97) 243 (dated 29th May 1997) of the European Commission on intermodality and intermodal freight transport, intermodality is "a characteristic of a transport system, that allows different modes to be used in an integrated manner in a door to door transport chain".
According to the ECMT, intermodal transport is "the movement of goods in one and the same loading unit or vehicle which uses successively several modes of transport without handling of the goods themselves in changing modes". According to that definition, intermodal statistics concern unitised and combined transport.

~m eurostat EU Intermodal Freight Transport
Executive summary
This is the first effort to collect existing intermodal data in one publication.
A difficult conceptual problem: The construction of intermodal transport statistics (according to the transport chain definition) raises a difficult conceptual problem because every single consignment is shipped by a specific transport chain. Moreover, the mix of transport modes and the various transhipment nodes makes it difficult to set-up intermodal transport statistics on a European scale. Statistical observation is also difficult because spatial aspects are often outweighted by economic considerations (trade between two adjacent regions is often routed via distant national hubs to consolidate dispersed flows in an efficient way). Due to the scarcity and weakness of existing transport chain statistics, the current publication focuses essentially on the unitised and combined transport, which is only one part of intermodal transport. However, in the long run, this publication will focus increasingly on data dealing with the transport chain concept.
Looking at the scheme of the previous page representing a typical transport chain, it is significant that most data currently available are dealing with only one link of each transport chain (eg one mode or one combination of modes as rail-road for example) or with one node (for example the containerised traffic from/to a port).
Main users: The main potential users of this publication are the policy makers and statisticians at EU and Member States level, as well as the thousands of operators involved in the intermodal transport and logistics operations in the EU15 (shippers, forwarders, transport operators).
Sources of information: Several sources were used to prepare this publication, the main ones being: European Commission Directorate-General VII, Eurostat, ECMT, UNO, UIC, UIRR, ICF (Intercontainer-Interfrigo), the Containerisation Yearbook, the Institute of Shipping Economics and Logistics (Germany), the "Direction des Ports et de la Navigation Maritime", various port authorities, the European Federation of Inland Ports (EFIP). Data from FP4 research projects (IQ, IMPULSE) were also used, as well as from private data providers (ΝΕΑ, MDS Transmodal). Details about all these sources are provided in appendix. Estimates have been used to a certain extent when no data has been available.
Transport chains: It is estimated that in 1992, the land-land transport chains represented 94% of the total continental freight traffic in Europe, with a strong predominance of unimodal road transport, which makes about 90% of all land - land transport. As far as intercontinental freight traffic is concerned, 88% of the total traffic was realised with sea-land transport chains.
Statistics on transport chains are more and more difficult to set up. The implementation of the internal free market within the European Union had major consequences on the transport statistical system. Concerning intra-community trade, the disappearance of the single administrative documents led to a loss of information. The introduction of the INTRASTAT system has led to the disappearance of the domestic mode of transport, of the nationality of the border-crossing mode and the mode of appearance at border, as well as the country of first origin or last destination.
Unitised rail transport: Unitised rail transport amounted to 8 million TEU in 1996. The total amount of unitised transport in that year was estimated to 140 -145 million tonnes and 50 billion tonne-kilometres.
The railway companies and their subsidiaries originally concentrated their efforts on the maritime container business. In addition to mainly domestic marketing companies such as Compagnie Nouvelle de Conteneurs (France) and Transfracht (Germany), the European railway companies jointly formed Intercontainer, which became later Intercontainer-lnterfrigo (ICF). Operating in competition with the hauliers and freight forwarders in the European inland transport, the container companies offer shippers the entire combined transport chain for land containers. The total traffic declared by ICF members of EU-15 and Swiss railways reached 1.35 Mio TEUs in 1996. Considering the railway of origin, D-Bahn, FS and SNCF performed almost 50% of the total ICF traffic (expressed in TEU).

Wñ EU Intermodal Freight Transport eurostat
Moreover, some combined transport companies structured on cooperative lines, that is freight forwarders, road hauliers and their organisations have come together in the "Union Internationale des sociétés de transport combiné Rail-Route" (UIRR). The UIRR companies organise and market terminal-to-terminal services by rail. Seven origins - destinations make 64% of this total, involving principally Germany, Italy, Austria, Greece and to a smaller extent Belgium, By country of origin, the share of Italy is 35%, Germany 29.8%, Austria 11.6%, Belgium 10.6% of the total tonne-kilometres.
There are also a number of other private hauliers who, in parallel with the groups of providers referred to above, operate combined-transport services on their own account either on certain routes or for specific categories of goods, eg chemicals and liquid products requiring tanker transport. Such operators also offer combined transport train capacities to third parties on the market. These private operators have increased significantly their market share during the last three years.
Combined transport: The most common form of combined transport is transport with containers, swap bodies and semi-trailers. This unaccompanied transport, in which only the loading units are transported by rail, has a market share of around 80%. If transport of maritime containers by inland rail is included, the share is as high as 90%. In 1997, the share of swap-bodies and containers reached 71% of all consignments carried by UIRR members. Conversely, the share of semi-trailers decreased from 18% in 1992 to 10% in 1997. The accompanied transport maintained its position.
Unitised transport by sea: The 31.2 million TEUs loaded and unloaded in EU ports represent 1/7 of the cargo handled in EU ports. The traffic of UK, Dutch and German ports accounted for 48% of the total EU traffic in 1996. Total container port-traffic in EU-15 increased by 45% between 1992 and 1996. The relative growth of container traffic was particularly impressive in the Spanish (+94%), Italian (+216%) and Finnish (+94%) ports during the period 1992/96. Rotterdam, Hamburg and Antwerp account for 1/3 of the containers transported in EU ports in the year 1997. The container transport of some Mediterranean container ports grew quickly during the three last years. The ports are Barcelona, Genoa, Algeciras and the new container port of Gioia Tauro (since 1997 the biggest container port of Italy with 1,4 Mio TEU).
Unitised transport on inland waterways: Around two million TEUs per year are transported on the EU inland waterways. The share of hinterland traffic of the ports of Rotterdam (Rhine corridor) and Antwerp as well as the Rotterdam-Antwerp feeder traffic is more than 90% of the total fluvial traffic in the EU. Container traffic on the Rhine increased annually by 20 % in the 1980s and by 7 % in the 1990s.
Unitised transport by air: The four main airport-platforms, Frankfurt, Schiphol, Heathrow and Charles de Gaulle, represented 35% of the freight tons transported by the 25 largest airports in the EU in the year 1996. The freight transport of East Midlans increased from 11 thousand to 105 thousand tons between the years 1992 and 1996. During this period the increase of the total transport of these airports was 40%. Freight transport of Luxembourg airport increased by 85%, London Stansted by 99% and Oostende by 113% between the years 1992 and 1996. Freight transport of the UK airports of Gatwick and Manchester grew between the years 1994 and 1996 due to the role of these airports in the decongestion of the airports of the the London area. The freight traffic of the airport of Milano Malpensa decreased by more than 20% during these years due to traffic congestion problems. As a whole, the freight traffic of the 25 largest airports increased by 14% between the years 1994 and 1996.
eurostat EU Intermodal Freight Transport
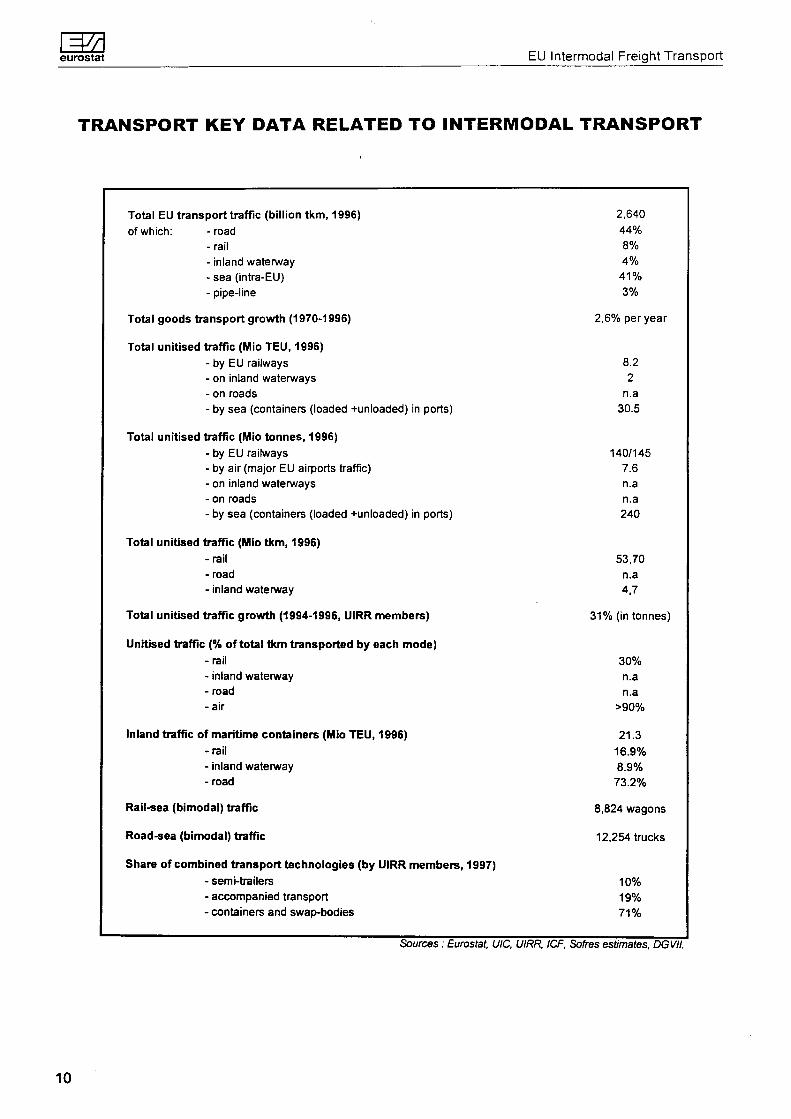
TRANSPORT KEY DATA RELATED TO INTERMODAL TRANSPORT
Total EU transport traffic (billion tkm, 1996) of which: -road
- rail - inland waterway - sea (intra-EU) - pipe-line
Total goods transport growth (1970-1996)
Total unitised traffic (Mio TEU, 1996) - by EU railways - on inland waterways - on roads - by sea (containers (loaded +unloaded) in ports)
Total unitised traffic (Mio tonnes, 1996) - by EU railways - by air (major EU airports traffic) - on inland waterways - on roads - by sea (containers (loaded +unloaded) in ports)
Total unitised traffic (Mio tkm, 1996) -rail -road - inland waterway
Total unitised traffic growth (1994-1996, UIRR members)
Unitised traffic (% of total tkm transported by each mode) -rail - inland waterway -road -air
Inland traffic of maritime containers (Mio TEU, 1996) -rail - inland waterway -road
Rail-sea (bimodal) traffic
Road-sea (bimodal) traffic
Share of combined transport technologies (by UIRR members, 1997) - semi-trailers - accompanied transport - containers and swap-bodies
2,640 44% 8% 4%
41% 3%
2,6% per year
8.2 2
n.a 30.5
140/145 7.6 n.a n.a 240
53,70 n.a 4,7
31 % (in tonnes)
30% n.a n.a
>90%
21.3 16.9% 8.9% 73.2%
8,824 wagons
12,254 trucks
10% 19% 71%
Sources : Eurostat. UIC, UIRR, ICF, Sotes estimates, DGVII.
10

EU Intermodal Freight Transport eurostat
GENERAL SITUATION AND TRENDS OF TRANSPORT IN EUROPE
11

=7¿ eurostat EU Intermodal Freight Transport
Table 1.1 Transport in EU-15 by kind of commodities Year 1997
Unit : % of tkm, except specifically indicated
Total EU-15 (billion tkm) %
(Breakdown in %) Agricultural products (0,1) *
Coal, other solid mineral fuels (2) *
Petroleum and petroleum products (3) *
Iron ore, steel, other metal products (4,5) *
Cement, building materials (6) *
Chemicals, fertilizers (7,8) *
Machinery, manufactured articles (9) *
All goods
Road
1,100
44%
29
1
5
8
19
9
29
100
Rail
220
8%
13 12 8
20 11
11
25 100
Inland Waterway
110
4%
13 12 19 18 25 10
3 100
Sea (intra-EU)
1070
4 1 %
n.a
n.a
n.a
n.a
n.a
n.a
n.a
-
Pipelines
90
3%
0%
0%
100%
0%
0%
0%
0%
100
Total
1,920
100%
25
4
6
11
18
10
26
100
(*) NST/R classification groups in brackets
(**) Data by groups of goods refer to EU12, 1992
Source : DG VII /Eurostat
The total number of freight transport tonne-kilometres was 1,920 billion in the EU15 in the year 1995. The share of road transport was 58%, while the share of rail transport was 11%.
Agricultural products and manufactured articles including machinery accounted for more than 50% of the total tonne-kilometres transported by inland modes of transport. Machinery and manufactured articles are partly transported by containers. Other kinds of commodities are mainly transported in bulk. The majority of freight tonnes are transported short distances. In 1992 60% of the freight transport in tonnes involved distances of less than 50 km and 81% less than 150 km. Thus, a majority of goods transported is far below the threshold of 300 to 400 km commonly admitted as the limit under which intermodal transport is not competitive. The current EU policy aims at supporting technological and logistical improvements in order to reduce this threshold.
12
EU Intermodal Freight Transport ΞΪ eurostat
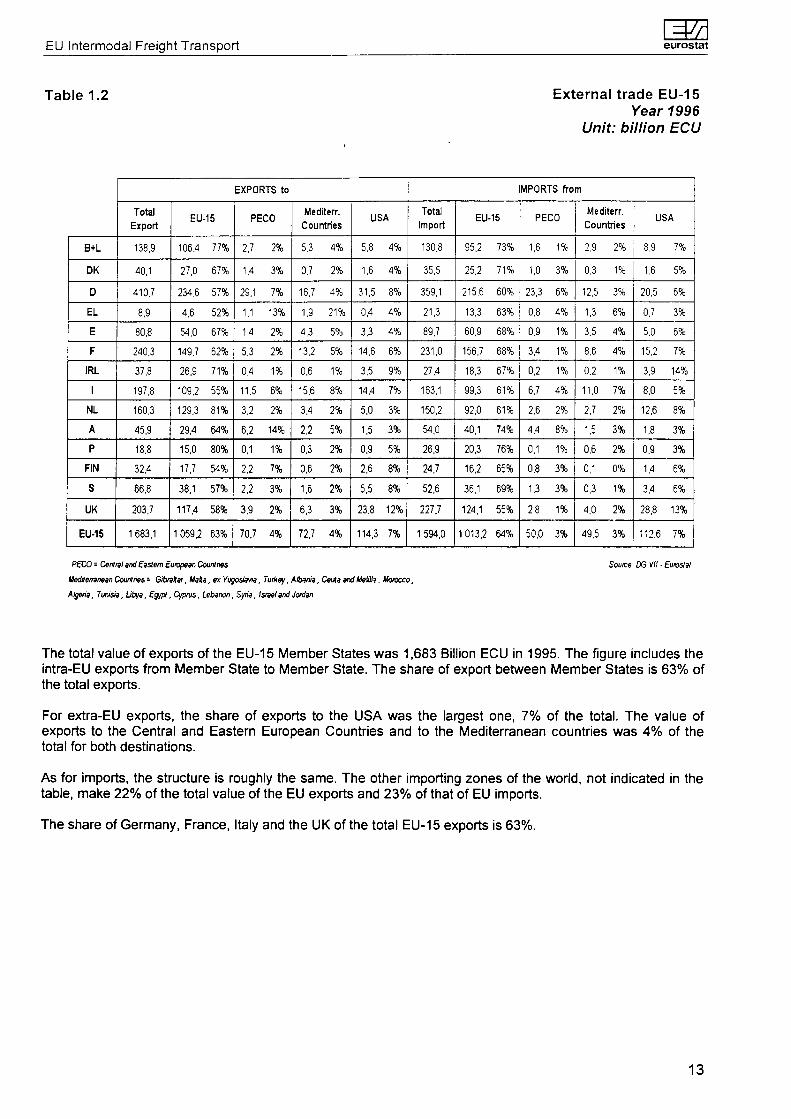
Table 1.2 External trade EU-15 Year 1996
Unit: billion ECU
B+L
DK
D
EL
E
F
IRL
I
NL
A
Ρ
FIN
S
UK
EU-15
EXPORTS to
Total
Export
138.9
40.1
410,7
8.9
80.8
240.3
37,8
197,8
160,3
45.9
18.8
32.4
66.8
203.7
1 683.1
EU-15
106.4
27,0
234,6
4,6
54,0
149.7
26.9
109,2
129.3
29.4
15,0
17,7
38,1
117,4
1 059,2
77%
67%
57%
52%
67%
62%
71%
55%
81%
64%
80%
54%
57%
58%
63%
PECO
2,7
1.4
29,1
1.1
1.4
5.3
0.4
11,5
3,2
6,2
0.1
2.2
2.2
3,9
70.7
2%
3%
7%
13%
2%
2%
1%
6%
2%
14%
1%
7%
3%
2%
4%
Meditere
Countries
5.3
0,7
16.7
1.9
4,3
13.2
0.6
15,6
3.4
2,2
0.3
0.6
1.6
6,3
72,7
4%
2%
4%
21%
5%
5%
1%
8%
2%
5%
2%
2%
2%
3%
4%
USA
5.8
1.6
31,5
0.4
3.3
14.6
3,5
14,4
5.0
1,5
0,9
2,6
5.5
23.8
114,3
4%
4%
8%
4%
4%
6%
9%
7%
3%
3%
5%
8%
8%
12%
7%
IMPORTS from
Total
Import
130,8
35.5
359.1
21,3
89,7
231,0
27.4
163,1
150.2
54,0
26.9
24,7
52,6
227.7
1594.0
EU-15
95.2
25,2
215,6
13.3
60,9
156.7
18,3
99,3
92,0
40,1
20,3
16,2
36.1
124.1
1013,2
73%
71%
60%
63%
68%
68%
67%
61%
61%
74%
76%
65%
69%
55%
64%
PECO
1,6
1.0
23,3
0.8
0.9
3.4
0.2
6,7
2,6
4.4
0.1
0.8
1.3
2,8
50,0
1%
3%
6%
4%
1%
1%
1%
4%
2%
8%
1%
3%
3%
1%
3%
Mediterr.
Countries
2,9
0.3
12.5
1,3
3,5
8,6
0,2
11.0
2.7
1,5
0,6
0,1
0,3
4.0
49.5
2%
1%
3%
6%
4%
4%
1%
7%
2%
3%
2%
0%
1%
2%
3%
USA
8,9
1.6
20.5
0.7
5.0
15.2
3,9
8,0
12.6
1.8
0.9
1,4
3,4
28,8
112,6
7%
5%
6%
3%
6%
7%
14%
5%
8%
3%
3%
6%
6%
13%
7%
PECO = Centrât and Eastern European Countries
mediterranean Countries - Gibraltar, Malta, ex Yugoslavia, Turkey. Albania, Ceuta and Melilla, Morocco,
Algeria, Tunisia, Libya, Egypt, Cyprus, Lebanon. Syria, Israel and Jordan
Source DG VII ■ Eurostat
The total value of exports of the EU-15 Member States was 1,683 Billion ECU in 1995. The figure includes the intra-EU exports from Member State to Member State. The share of export between Member States is 63% of the total exports.
For extra-EU exports, the share of exports to the USA was the largest one, 7% of the total. The value of exports to the Central and Eastern European Countries and to the Mediterranean countries was 4% of the total for both destinations.
As for imports, the structure is roughly the same. The other importing zones of the world, not indicated in the table, make 22% of the total value of the EU exports and 23% of that of EU imports.
The share of Germany, France, Italy and the UK of the total EU-15 exports is 63%.
13

eurostat EU Intermodal Freight Transport
Chart 1.3 Growth of transport, gross domestic product and industrial production 1970-1995
Unit: tkm and ECU
200
180 -
| 160 -
| 140 -
I 120 -τ
100 -j
B0 η
60 -j
40 -i
20 -f
0 -t-
70 71 72 73 74 75 76 77 78 79 80 81 82 83 84 85 B6 87 88 89 90 91 92 93 94 95
-goods (tkm) ■ GDP Industrial Production
Source: DO VII-Eurostat
The average growth rate of freight transport (in tkm) and GDP was 3.5% per year during the period 1970-1995.
Table 1.4 Share of each mode of the total inland transport
Year 1997 Unit: tkm in %
Β
DK*
D
EL*
E
F
IRL
I
L*
NL*
A
Ρ*
FIN
S
UK
EU-15
Road
70.4
73.2
67.1
98.1
84.2
74.4
91.3
85.1
68.7
47.0
38.2
85.7
71.0
63.4
84.8
73.2
Rail
14.6
8.1
16.1
1.9
10.1
16.9
8.7
9.4
20.5
3.6
37.0
14.3
27.6
36.6
9.1
14.4
Inland waterway
12.0
0.0
13.8
0.0
0.0
1.8
0.0
0.1
10.8
42.8
5.1
0.0
1.4
0.0
0.1
7.2
Pipelines
3.0
18.7
2.9
0.0
5.7
6.9
0.0
5.4
0.0
6.7
19.7
0.0
0.0
0.0
6.0
5.2
Π Modal Split based on national and international road traffic of vehicles registered in the country Source: DG VII - Eurostat
In all Member States; except Austria, the share of road transport of the total inland transport exceeds 50%.
14

EU Intermodal Freight Transport =7ί
eurostat
In Ireland and Greece the share of road transport is more than 90%. These countries have no inland waterways transport and the share of rail freight transport is small. In the Netherlands the use of inland waterway has been maximised and the share of this mode is 42.8%. Also in Germany inland waterway transport has a significant share. Luxembourg, Austria, Finland and Sweden are the EU countries where rail transport is important.
Chart 1.5 Evolution of the modal split for inland goods transport in EU-15 1980-1996 (Vooftkm)
D Road ■ Rail
: D Inland waterway!
1980 1990 1996
The share of road transport of the total inland freight transport has increased continuously - from 58% to 74% - during the last 16 years. This has led to road capacity and safety problems.
Intermodal transport policy is aiming essentially at promoting the use of combined and multimodal freight transport instead of the use of monomodal road transport.
15


EU Intermodal Freight Transport eurostat
Transport infrastructure
17

eurostat EU Intermodal Freight Transport
Table 2.1 Road network: length of motorways at the end of the year 1970-1996
Unit: km
1970
1980
1990
1991
1992
1993
1994
1995
1996
Β
488
1 192
1666
1650
1667
1686
1665
1666
1674
DK
184
516
601
653
706
747
786
830
880
D(-W)
4 461
7 538
8 959
10 955
11013
11 0B0
11 143
11 190
11300
D-Ε
1600
1687
1850
D
D
D
D
D
D
EL
11
91
190
225
280
330
380
420
470
E
387
1933
4 425
5 065
6 209
6 577
6485
6 962
7 293
F
1553
5 254
6 824
7 080
7408
7 614
7 956
8 275
8300
IRL
0
0
26
32
32
50
56
70
80
I
3913
5 900
6185
6 214
6 289
6401
6401
6401
6439
L
7
44
78
84
95
100
121
123
115
NL
1209
1773
2 092
2118
2 134
2150
2167
2 300
2360
A
439
869
1470
1532
1554
1567
1589
1596
1607
Ρ
66
132
318
474
519
579
587
687
710
FIN
108
204
225
249
318
334
388
394
431
S
403
850
939
968
1005
1044
1 141
1231
1330
UK
1073
2 573
3181
3211
3 246
3 252
3 286
3 308
3344
EU15
15902
30 566
39 029
40 510
42 475
43511
44151
45453
46333
index 1970=101
100
192
245
255
267
274
278
286
291
Estimates in bold italic D : included in D(-W) Sources: EUROSTAT, IRF, National Statistics
The construction of the main highway axes occurred during the period 1970-1990. In the 1990s more than 70% of the total EU motorways are in Germany, France, Spain and Italy.
After that the extension of the highway network has been rather slow with the exception of Spain and France. In Spain the length of motorways increased by almost 3000 kilometres during the 1990s. This explains a large part of the total EU-15 increase of the network during this period.
18

EU Intermodal Freight Transport eurostat
Table 2.2 Rail network: length of lines 1970- 1996
Unit: km
1970
1980
1990
1993
1994
1995
1996
Β
4 232
3 978
3 479
3 410
3 398
3368
3380
DK
2 352
2 015
2 344
2 349
2306
2 349
2349
D(-W)
29 527
28 517
26 950
40 369
41 355
41 719
40 826
D-E
14250
14 248
14 031
D
D
D
D
EL
2 571
2 461
2 484
2 484
2 464
2 474
2 474
E
13 668
13 542
12 560
12 601
12 646
12280
12 284
F
36 117
34 382
34 260
32 579
32 275
31939
31852
IRL
2 189
1 987
1 944
1 944
1 944
1 947
1945
I
16 069
16 133
16 086
15 942
16 002
15 998
16 014
L
271
270
271
275
275
275
274
NL
3 148
2 760
2 798
2 757
2 757
2 739
2 739
A
5 907
5 847
5 624
5600
5 636
5 672
5 672
Ρ
3 591
3 588
3 592
3 062
2 699
2 850
2 850
FIN
5 870
6 096
5 867
5 885
5880
5880
5 881
S
11 550
11 382
10 801
9 476
9 661
9 782
10 923
UK
19 691
18 490
17 406
16 996
16 998
17 026
17 128
EU-15
171 003
165 696
160 497
155 729
156 296
156 298
156 591
index 1970=100
100
97
94
91
91
91
92
of which, % electrified:
1996 73% 17% 45% D 0% 56% 45% 2% 64% 95% 73% 60% 22% 35% 68% 30% 47%
Main railway gauge and electric current used :
mm
dc volts
ac volts
1435
3000
1435
3000
25000 50Hz
1435
15000 16.7Hz
1435
15000 16.7Hz
1435 1668
3000
1435
1500
25000 50Hz
1600
1500
1435
3000
1435
25000 50Hz
1435
1500
1435
15000 16.7Hz
1668
25000 50Hz
1524
25000 50Hz
1435
15000 16.7Hz
1435
25000 50Hz
D : Included In D(-W) 1435 mm = standard gauge Source : UIC, data tor UIC member rait&ays
With 40,000 and 32,000 km of railway lines respectively, Germany and France have by far the most extended railway networks in the EU-15.
Contrary to the highway network, railway network has decreased during the 1970's and the 1980's. After that period the length of the UIC rail network in the EU has been around 156 000 km, of which 47% is electrified. Electrification of the railway lines is particularly high in the Benelux countries. The length of the railways of the non-UIC members is around 10 000 km.
The disparities of railway gauges and electric current used affect negatively the efficiency of international rail freight. Spain, Portugal, Finland and Ireland do not have the same gauge as the other EU countries. The electrification of lines is an important characteristic of the combined transport network. In some countries there are line sections used for combined transport which still remain unelectrified. This is problematic since it makes a change of the locomotive necessary. For example in Spain out of the 107 combined transport trains for 20 the locomotive has to be changed at least once during transport. The structure gauge is a major constraint in Ireland and Great Britain, where low platform wagons are needed to allow for units to be carried on trains. Greece has also small structure gauges. On the other hand, there are national networks with large structure gauges such as Finland, Sweden, Denmark, the Netherlands, most of Belgium, most of Germany and most of Austria.
19

eurostat EU Intermodal Freight Transport
Table 2.3 Inland waterway network: length in use of navigable canals, rivers and lakes 1970- 1996
Unit: km
1970
1980
1990
1991
1992
1993
1994
1995
Β
1553
1510
1513
1513
1513
1513
1513
1513
D(-W)
4 508
4 395
4 350
7341
7 341
7 681
7 681
7 343
D-E
2 300
2 302
2319
D
D
D
D
D
DK
-
-
-
-
-
-
-
-
E
-
-
-
-
-
-
-
-
F
7433
6 568
6197
5 951
5 867
5 825
5 703
5 962
EL
-
-
-
-
-
-
-
-
I
2 337
2 337
1366
1366
1466
1466
1466
1466
IRL
-
-
-
-
-
-
-
-
L
37
37
37
37
37
37
37
37
NL
5 599
4 843
5 046
5 046
5 046
5 046
5 046
5 046
A
350
350
351
351
351
351
351
351
Ρ
-
-
-
-
-
-
-
-
FIN
6 000
6 057
6160
6160
6120
6120
6120
6120
S
Π3
na
na
na
na
na
na
na
UK
2 351
2 351
2 351
2 353
2 353
2 353
2 353
2 353
EU-15
32 468
30750
29 690
30118
30094
30 392
30270
30191
index 1970=100
100
95
91
93
93
94
93
93
Estimates in bold italics
Underlined : change in time series
-: nil D : included in D(-W) Sweden: data not available (na) Source: EUROSTAT, UN
The total length of inland waterways remained quite stable during the last fifteen years in all countries, with a total of about 30,000 km.
The network is particularly developed in Germany, the Netherlands, France and Finland. However, it is only in the first two countries that the loading gauge is sufficiently high to allow very high annual tonnages to be transported. In Denmark, Ireland, Greece, Spain and Portugal there are no inland waterway networks with significant freight traffic.
20

EU Intermodal Freight Transport eurostat
Table 2.4 Inland waterway main container ports: classes of network and their characteristics
Waterway Danube (RMD canal) Danube (RMD canal) Danube (RMD canal) Danube (RMD canal) Maas / Meuse, Canal Albert Rhine Danube (RMD canal) Rhine Rhine Rhine Main Rhine Rhine Rhine Rhine Rhine Rhine Rhine Rhine Rhine Rhine Rhine Rhine Danube (RMD canal) Rhine Rhine Guadalquivir Saône Seine Saône Saône Seine Seine Rhine Saône Danube (RMD canal) Danube (RMD canal) Mass / Meuse Waal Mass / Meuse A'dam-Rhein-Kanal Danube (RMD canal) Danube (RMD canal) Danube (RMD canal)
Rhine
Port Krems . Linz Linz-Voest Wien Liège Bonn Deggendorf Duisburg-Ruhrort Düsseldorf Emmerich Frankfurt Germersheim Homberg Karlsruhe Kehl Koblenz Köln Krefeld Leverkusen Ludwigshafen Mainz Mannheim Neuss Regensburg Wesel Woerth Sevilla Chalons Le Havre Lyon Macon Paris (Genevilliers) Rouen Strasbourg Vülefranche Baja Budapest Born Nijmegen Oss Utrecht Reni Bratislava Komamo
Basel
Country A A A A B D D D D D D D D D D D D D D D D D D D D D
ES F F F F F F F F
HU HU NL NL NL NL RO Slo. Slo.
CH
Class VIVIVI· vi · v v
vivi v VI V v VI v v v v v v v v v v
V I ' VI v VI VI VI
' VI VI VI VI v VI VI VI v v v VI VI VI VI
V O Other sources indicate IV Source IMPULSE protect (FP4)
ECMT waterway class
0 la Ib II III IVa IVb V VI
Vessel characteristics (capacity In tonnes)
<250 250 300 600
1,000 1,500 2,700 3,200
> 10,000 Source SIMET "Technical Parameters tor Inland Containers"
Most of the large inland waterway container ports in the EU are located on the Rhine river.
They are accessible to large vessels (up to 10,000 tonnes capacity). There are in total 39 inland waterway container ports off classes V and VI in Europe (excluding sea ports). The breakdown by country is as follows: Germany: 27, France: 7, Austria: 5, the Netherlands: 4, Belgium: 1, Spain: 1.
21

eurostat EU Intermodal Freight Transport
Table 2.5 Top container ports: yard gantry cranes / straddle carrier distribution
Year 1997
Container port
Antwerp
S Bremerhaven / Bremen
'Felixstowe
: Genoa
Giaoa Tauro
Hamburg
Hamburg
La Spezia
Le Havre
Piraeus
Rotterdam
Rotterdam
Southampton
Thamesport
Country
Β
D
UK
I
I
D
D
I
F
EL
NL
NL
UK
UK
Type of equipment
Straddle carrier
Straddle carrier
RTG crane
RMG/OHB/crane
Straddle carrier
RMG / OHB / crane
Straddle carrier
RMG / OHB / crane
Straddle carrier
Straddle carrier
RMG / OHB / crane
Straddle carrier
Straddle carrier
RMG / OHB / crane
Number
166
90 ,
63 ¡
14 |
51 I
10
156
10
74
63
95
121
52
14
Source: Containerisation International- Hardware Market Analysis
Note : RTG = Rubber-tyred gantry crane
RMG = Rail mounted gantry crane
OHB = Overhead bridge
In total 979 handling cranes and carriers are in operation in the top twelve ports listed above. 78% of them are located in the Belgian, Dutch and German ports.
22
EU Intermodal Freight Transport eurostat
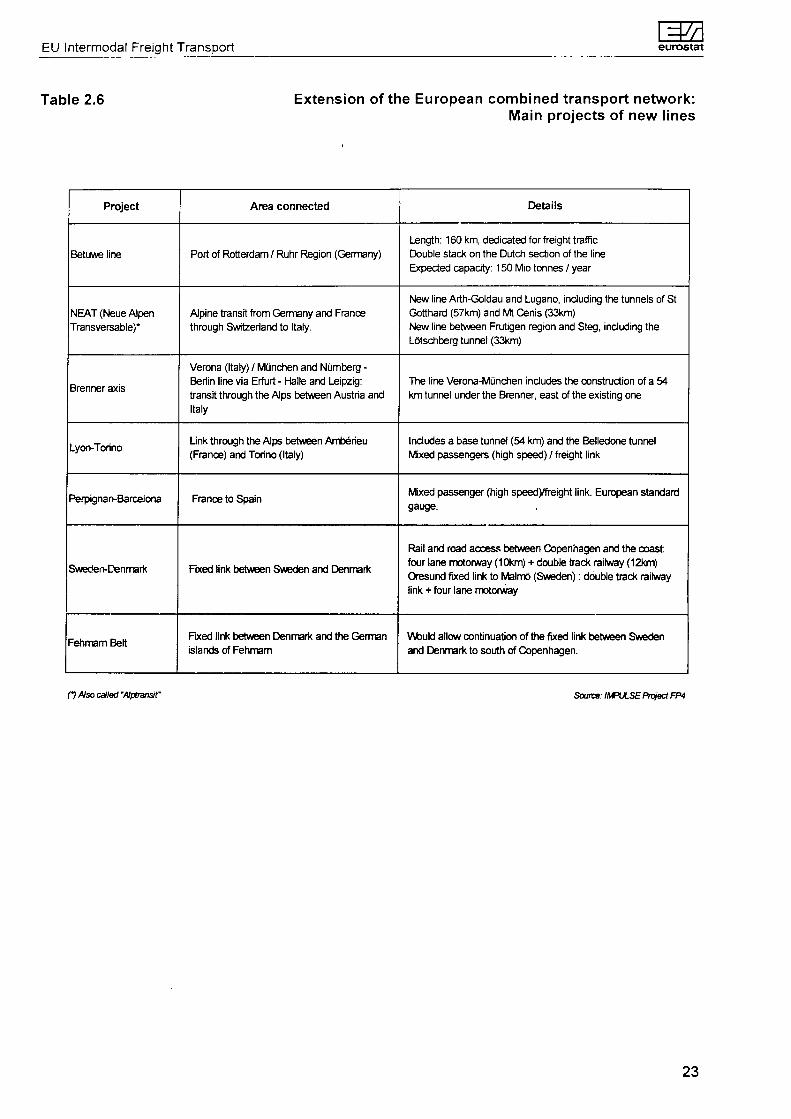
Table 2.6 Extension of the European combined transport network: Main projects of new lines
Project
Betuwe line
NEAT (Neue Alpen
Transversable)*
Brenner axis
Lyon-Torino
Perpignan-Barcelona
Sweden-Denmark
Fehmam Belt
Area connected
Port of Rotterdam / Ruhr Region (Germany)
Alpine transit from Germany and France
through Switzerland to Italy.
Verona (Italy) / München and Nürnberg -
Berlin line via Erfurt - Halle and Leipzig:
transit through the Alps between Austria and
Italy
Link through the Alps between Ambérieu
(France) and Torino (Italy)
France to Spain
Fixed link between Sweden and Denmark
Fixed link between Denmark and the German
islands of Fehmam
Details
Length: 160 km, dedicated for freight traffic
Double stack on the Dutch section of the line
Expected capacity: 150 Mio tonnes / year
New line Arth-Goldau and Lugano, including the tunnels of St
Gotthard (57km) and Mt Cenis (33km)
New line between Faltigen region and Steg, including the
Lötschberg tunnel (33km)
The line Verona-München includes the construction of a 54
km tunnel under the Brenner, east of the existing one
Includes a base tunnel (54 km) and the Belledone tunnel
Mixed passengers (high speed) / freight link
Mixed passenger (high speedyfreight link. European standard
gauge.
Rail and road access between Copenhagen and the coast:
four lane motorway (10km) + double track railway (12km)
Öresund fixed link to Malmö (Sweden) : double track railway
link + four lane motorway
Would allow continuation of the fixed link between Sweden
and Denmark to south of Copenhagen.
Π Also called "AJptransir Source: IMPULSE Project FP4
23

ΓΕΡΆ eurostat EU Intermodal Freight Transport
Map 2.7. Trans-European railway corridors and inland waterway network Time horizon: Year 2010
The maps of the following pages below illustrate the trans-European rail and inland waterways transport network outline plan for the time horizon 2010. They are included in the Commission proposal for the integration of ports and other interconnection points in the trans-European network (COM 681). The proposal has been adopted by the Commission and it is currently being examined by the other European institutions.
Map 2.7.a Trans-European rail network; railways corridors and terminals
7.1.0
LEITSCHEMA DES TRANSEUROPAISCHEN VERKEHRSNETZES (HORIZONT 2010) ABSCHNITT: KOMBINIERTER VERKEHR TRANSEUROPEAN TRANSPORT NETWORK OUTLINE PLAN (2010 HORIZON) SECTION: COMBINED TRANSPORT SCHEMA DU RESEAU TRANSEUROPEEN DE TRANSPORT (HORIZON 2010) SECTION' TRANSPORT COMBINE
SCHIENENKORRJDORE UNO TERMINALS RAILWAY CORRIDORS AND TERMINALS CORRIDORS FERROVIAIRES ET TERMINAUX
BESTEHENDE VERBINDUNGEN/EXISTING CONNECTION/CONNEXIONS EXISTANTES
VERBINDUNGEN MIT DRITTLANDERN (NUR HINWEISEND) THIRD COUNTRY CONNECTIONS (PURELY INDICATIVE) CONNEXIONS AVEC LES RAYS TIERS (PUREMENT INDICATIVES)
TERMINAL/STANDORTRAUM TERMINAL/TRANSHIPMENT AREA TERMINAL/ZONE DE TRANSBORDEMENt
Source: DG VII
24

EU Intermodal Freight Transport Ξ £
eurostat
Map2.7.b Trans-European railway corridors and terminals in
Benelux-countries, Germany, France and Austria
Time horizon: year 2010
The map below shows the trans-European combined transport rail corridors and terminals as well as the
planned extensions of the network plan for Belgium, Germany, France, the Netherlands, Austria and
Luxembourg. The time horizon is year 2010.
An extension is planned between Bremen through Groningen to Amsterdam.
LfJTSCHEMA DCS TRANSEUflOPAlSCHEN VERKEHRSNETZES
(HORIZONT 2010)
ABSCHNITT KOMBINIERTER VERKEHR
TRANSEUROPEAN TRANSPORT NETWORK OUTLINE PLAN
imo HORIZON; SECTION: COMBINED TRANSPORT SCHEMA DU RESEAU TRANSEUROPEEN X TRANSPORT [HORIZON 2O10) SECTION TRANSPORT COMBME
SOCNEMCORRDORE UNO TERM NAL S RMWAV COWflüORS ANDTEHMNAL3 CORRCORS FERROVUKE5 ET TERMWUJX
IBMNM/ST ANDOR TRAUM 1 TERMttAUTRAHSHlPMEKTAflEA
TOMNAUZONT. DE TRANSBORDEMENT
BELGIË/
BELGIQUE
2 Antwerpeo
3 ZeeOrugge
4 AJnus
6 Geik
7 üege-Renory-
Bressoui
β Gent
9 Mouscron
LUXEMBURG/
LUXEMBOURG 1 Bettembourg
NEDERLAND 1 Gronngen
2 Twente
3 A/nsterflam
4 Rotterdam
5 AmhenVr*)megen
fi Verto
7 BonVZufcWjrnburg
FRANCE 1 Dunkerque
2 Lie
3 Amiens
4 Le Havre
5 Rouen
6 Remes
7 LeMans
β Pant
9 Nancy/Metz
10 Strasbourg
11 Nantes-Mont»
12Angerj
13 Tour»
UCftjon
ISVeioU
16MuteuW
0*wsheen
17 Cognsc-AngoüèfTK
1B Cheton-sa-Saon*
«Macon
20 Lyon
21 Grenoble
22 Borte*«
23 Agen
24Toutouee
25 Montpewar/Sètt
26Avgnon
29 D n
»Henday·
31 Pen^gnen
DEUTSCHLAND * NeumuTster
2 Rostock
4 Bnsme'1
5 Hannover
6 Braunscfuíieg,'1
WofsöunjiSaCginer
7 Bertm
8 Rhen*
9 Osnabrück
10 Bielefeld
11 Duisburg
12 Hohenowdberg
t3 DússekJori-Neuss
14 Wanne/Heme
15 OortrrunoVBonen
16 Hagen
17 Wuppertal
Ι9ΚοΟβηι
20 Wetzlar
22lerjzç
23 Dresden
24 Paderborn
25 Dessau/Aker
26 Magdeburg
27 Kassei/Beiseiòrtn
26 Edun
29 Wûrzburg/
Scmvetrrfui
X MarrtwirV
LuOwiosnalen
31Tnw
32 Nürnberg
33 Regensburg
34 Saarbrücken
35 Karlsruhe
37 Stuttgart
3β Ingolstadt
39Landshul
40 Passau
41 Oftentxjrg
42 l im
43 Augsburg
44 Munchen
45 Freiburg
46 PfuUenoorf I
Ravensburg
Π Basel
OSTERREICH 1 Krems
3 A Polten
4 Lim
5 Weis
6 Sautxjrg
7 StM.ohaet
9 BWeru^vVofun
10 Hai m Trol
11 W a r t
25

eurostat EU Intermodal Freight Transport
Map 2.7.c Trans-European railway corridors and terminals in Spain The United Kingdom, Ireland and Portugal
Time horizon: year 2010
LEITSCHEMA DES TRANSEUROPAISCHEN VERKEHRSNETZES
(HORIZONT 2010)
ABSCHNITT: KOMBINIERTER VERKEHR
TRANSEUROPEAN TRANSPORT NETWORK OUTLINE PLAN
12010 HORIZON)
SECTION COMBINED TRANSPORT
SCHEMA DU RESEAU TRANSEUROPEEN DE TRANSPORT
(HORIZON 2010)
SECTION: TRANSPORT COMBINE
SCHIENENKORRIDORE UNO TERMINALS
RAILWAY CORRIDORS AND TERMINALS
CORRIDORS FERROVIAIRES ET TERMINAUX
SESTEHENOE VERBINOUNGENfEXISTING
CONNECTION/CONNEXIONS EXISTANTES
GEPLANTE AUSWEITUNGJPLANNED
EXTENSION/EXTENSION PLANIFIEE
VERBINDUNGEN ΜΓΓ DRITTLÄNDERN (NUR HINWEISEND)
TURD COUNTRY CONNECTIONS (PURELY INDICATIVE)
CONNEXIONS AVEC LES PAYS TIERS (PUREMENT INDICATIVES)
,6_îs »&£>--' -~f:~ ^-.jimmsm ié¿;h
TERMINAUSTANDORTRAUM
1 TERMINAUTRANSHIPMENTAREA
TERMINAL/ZONE DE TRANSSORDEMEN1
ESPANA 1 Bilbao
2 kun 3 Pamplana/Noan
4 Pod Bou
5 Vitola 6LWa 7 Barcelona
8 Zaragoza
9 Tarragona
invalidólo
11 Madiid
12Valenaa/Sina
13Afcante
14 Multai
Cartagena
15Unanj9
15 Cordoba
ITAJoeoras/
San Roque
igvigo
PORTUGAL 1 Lercoes/Porto
2 ValadoTejol ruaOioe
ÍS ■:\- " ' - - , . . ; ; « » s i f t *
ífCX&Víi
Ur·— >3t¿*
■\"Ν' ·
-N¿~: »^LaT^^
1L^V.7i^J\fc^Á, : ï = ^ , - r - W i
r
--",.iä..̂
"" 3 Lobo·
- r-Λ .'^--¿¿'.i*,'-
- ' -"-Í ," ; "νΏ » .- - :". =.·=«?£' ■■■■..■
^^»S&Wlf* ¡ f ^ ; ; : i , -
09/97
UNITED
KINGDOM 1 Stramayde
2 Betast
3 Cleveland
4 Leeds
5 Merseysde
6 Manchesier
7 Wakefield
8 Doncastar
9 West Midlines
10 DaventrylEast
Midlands
11 South Wales
12 London
13 HalYndi/T-eüxkme/
East of England
14 Soniti wast
IRELAND 1 Dunda!»
2 Dublin
3 Cot
26

EU Intermodal Freight Transport =ΊΔ
eurostat
Map 2.7.d Trans-European railway corridors and terminals in Denmark, Sweden and Finland
Time horizon: year 2010
7.1.3
Source: DG VII
27

eurostat EU Intermodal Freight Transport
Map 2.7.e Trans-European railway corridors in
Greece and Italy
Time horizon: year 2010
The map below illustrates the combined transport railway corridors and terminals in Greece and Italy. The existing connections are illustrated by a solid line. Extensions are planned in Greece.
HELLAS t Thessaloniki
2 Alhina
ITALIA 1 U i m
2 Cnesso
3 Tonno
4 Vercelli
5 Novara
6 Mlano
7 VefTX«
β Padova
9 Udre
10 Trieste
11 Alba
12 Rivatta Soma
13 Pozzo»
U Fiorefuuola
15Ρνπα
l6Mooena
17 Bologna
18 Ravenna
19 Genova
20 La Spezia
21 Livorno
22 Falconara
23 Roma
24 Pescara
25 Pómez»
26 La tina
27 Napoli
28 Bari
29 Brindei
30 Gioia Tauro
31 Palermo
32 Messina
33 Catania
34 Sassari
35 Cagliari
L E I T S C H E M A DES TRANSEUROPÀISCHEN VFRKEHRSNETZE.
(HORIZONT 2010)
ABSCHNITT: KOMBINIERTER VERKEHR
TRANSEUROPEAN TRANSPORT NETWORK OUTLINE PLAN
(2010 HORIZON)
SECTION: COMBINED TRANSPORT
SCHEMA DU RESEAU TRAMSEUROPEEN DE TRANSPORT
(HORIZON 2010)
SECTION. TRANSPORT COMBINE
SCHIENENKORRIDORE UNO TERMINALS
RAILWAY CORRIDORS AND TERMINALS
CORRIDORS FERROVIAIRES ET TERMINAUX
BESTEHENDE VERB1NOUNGENÆXIST1NG
CONNECnONXONNEXtONS EXISTANTES
GEPLANTE AUSWETTUNG/PIANNED
EXTENSION/EXTENSION PLANTEE
VERBINDUNGEN MTT DRITTLÄNDERN (NUR HINWEISEND) 1 THRO COUNTRY CONNECTIONS (PURELY INDICATIVE)
CONNEXIONS AVEC LES PAYS TIERS (PUREMENT INDtCATtVES)
TERMINAL / STANDORTRAUM
TERMINAL / TRANSHIPMENT AREA
TERMINAL ƒ ZONE DE TRANSBORDEMENT 09/97
3,i.-, :-, ' ".-::-,:■>--'·*>■-■- -. -.-*- - ■ : " _ ~~'-Λ*,ΐ&ίζ/ ¿i.*** .«·■·-.--,.· „. .-„ ir; . , . ; -J." -«h
■ V ;■;■-.■■;· ------ v í V ·;"¥ 31 . ¿ ¿ » - > ^ £ " s * r '■"'?-* ¿ r i _iiî-. ?■->*>-- ι,-: ■ :·-rgv-rtp
v,^v>>*-*;
¿-»?3*#5,»,^
fe . V -v r>
mr J t ' ^ Ï K ϊ-ίχ. f*'-: ■ ¡¿?mè;'
. ...^'hrí/íJf^'-rsiS'.'irf:-.
Source: DGVII
28
EU Intermodal Freight Transport eurostat
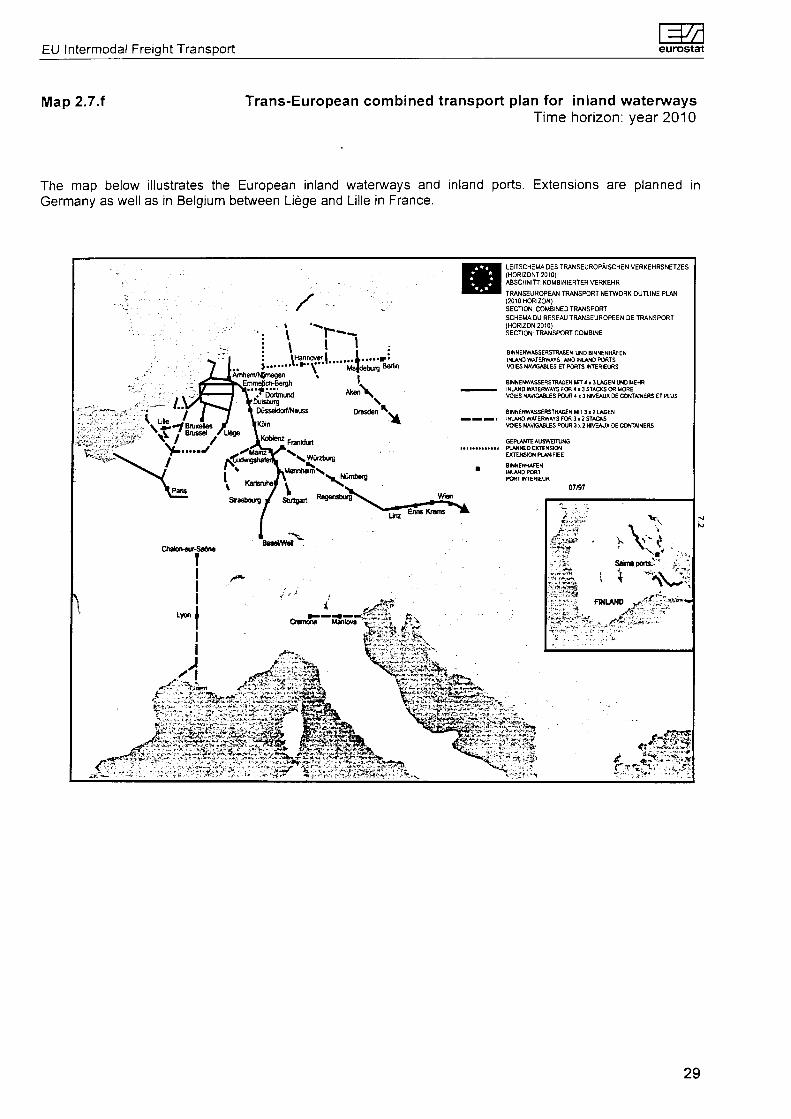
Map 2.7.f Trans-European combined transport plan for inland waterways
Time horizon: year 2010
The map below illustrates the European inland waterways and inland ports. Extensions are planned in
Germany as well as in Belgium between Liège and Lille in France.
/
LEITSCHEMA DES TRANSEUROPAISCHEN VERKEHRSNETZES
(HORIZONT 2010)
ABSCHNITT KOMBINIERTER VERKEHR
TRANSEUROPEAN TRANSPORT NETWORK OUTLINE PLAN
(2010 HORIZON)
SECTION: COMBINED TRANSPORT
SCHEMA DU RESEAU TRANSEUROPEEN DE TRANSPORT
(HORIZON 2010}
SECTION: TRANSPORT COMBINE
BINNENWASSERSTRAßEN UND BINNENHAFEN
INLAND WATERWAYS AND INLAND PORTS
VOIES NAVIGABLES ET PORTS INTERIEURS
BINNENWASSERSTRAßEN ΜΓΓ 4 * 3 LAGEN UNO MEHR
INLAND WATERWAYS FOR * 13 STACKS OR MORE
VOIES NAVIGABLES POUR * 13 «VEAUX DE CONTAINERS ET PLUS
BINNENWASSERSTRAßEN ΜΓΓ 3 χ 2 LAGEN
INLAND WATERWAYS FOR 3 χ 2 STACKS
VOIES NAVIGABLES POUR 3 χ 2 «VEAUX DE CONTAINERS
GEPLANTE AUSWEITUNG
PLANNED EXTENSION
EXTENSION PLANIFIEE
BINNENHAFEN
INLAND PORT
PORT INTERIEUR
'~^B
h
29


Ξ 2 EU Intermodal Freight Transport eurostat
Transport chains
31

eurostat EU Intermodal Freight Transport
Table 3.1 Continental and intercontinental transport chains by type 7992
Unit: Mio tonnes
Continental transport chains
Sea-Sea
Sea-Land
Sea-Road
Sea-Rail
Sea-Inland waterway
Unknown
Land-Land
Unimodal Road
Unimodal Rail
Unimodal Inland waterway
Multimodal
Total
%
Agriculture & Food
0,5
82,2
36,9
3.9
4,1
37.2
1.533,50
1.467,80
44,6
18,6
2,5
1.616,20
19,7
Solid fuel, Ores &
Minerals
0,3
126,8
22,8
8,7
12
83.3
3.423,10
3.031.50
236.5
150,4
4,7
3.550,20
43,4
Petrol products
0,05
123,1
30.4
5,6
13,4
73,7
417,1
314,6
56.2
45,7
0,6
540,2
6,6
Metal
0,1
37,1
9.7
3,8
4
19,6
372,8
275.9
88,6
6,7
1.6
410
5
Chemical
0,2
61,3
25,7
4,6
4,9
26,1
109,5
346,1
42.5
18,4
2,5
471
5,8
Manufactured good
0,5
74,3
22,1
2
0,4
49,8
1521,2
1446
72
2
1,2
1596
19,5
Tota l
1,65
504,8
147,6
28,6
38,8
289.7
7.677,30
6.881.90
540,4
241,8
13,1
8.183,60
100,00
%
0,02
6,2
1,8
0.3
0.4
3,5
93,8
84,1
6,6
3
0,2
100,00
Intercontinental transport chains
Sea-Sea
Sea-Land
Sea-Road
Sea-Rail
Sea-Inland waterway
Unknown
Land-Land
Total
•A
Agriculture & Food
6
119,4
53,1
3.9
14,1
48.3
15,1
140,5
22
Solid fuel, Ores 4
Minerals
0,8
241,5
24,3
28.8
53,1
135,3
16,1
258,4
40,4
Petrol products
0,8
92,7
21,9
3.2
5.5
62.1
9,6
103,1
16,1
Metal
1,5
21,9
5.1
1.9
4.2
10.7
3,7
27,1
4.2
Chemical
2,4
54,1
20,7
4,6
7.6
21,2
9,5
66
10,4
Manufactured good
3,9
33
14,8
2,4
2,2
13.6
7,4
44,3
6,9
Total
15,4
562,6
139.9
44,8
86,7
291,2
61,4
639,4
100
%
2,4
88
22
7
13,6
45,5
9,6
100
Source: ΝΕΑ Transport Research and Training
According to the estimate of ΝΕΑ, land-land transport (in 1992) represented 94% of total continental freight traffic in Europe, with a strong predominance of unimodal road transport, around 90% of all land - land transport.
As far as intercontinental freight traffic is concerned, sea-land transport chains account for 88% of the total intercontinental freight traffic.
The tables above illustrate the situation concerning the continental and intercontinental freight flows in 1992, broken down by group of products and by type of transport chain.
These tables reflect the situation which was prevailing in 1992 at the beginning of the Single Market. The implementation of the Single Market within the European Union had major consequences on the transport statistical system. Concerning intra-community trade, the disappearance of the single administrative document led to losses of information. The introduction of the INTRASTAT system has led to the disappearance of the domestic mode of transport, of the nationality of the border-crossing mode and the mode of appearance at border, as well as the country of first origin destination or last origin destination.
32

EU Intermodal Freight Transport eurostat
Table 3.2 Inland traffic of maritime containers, by country and by inland transport mode 1992 - 1996
Unit: 1000 TEU
Ports in:
B + L
DK
D
EL*
E
F
IRL
'
NL
Ρ
UK
TOTAL
1992
Road
1.115
273
1.609
n.a.
952
768
483
1.433
1.672
351
3.607
12.263
Rail
292
88
681
n.a.
152
331
84
307
322
23
590
2.870
Inland Waterways
292
0
40
n.a.
0
0
0
0
735
0
0
1.067
Total
1.699
361
2.330
n.a.
1.104
1.099
567
1.740
2.729
374
4.197
16.200
1996
Road
1.500
359
1.749
n.a.
1.544
1.063
665
2.694
1.807
420
3.829
15.630
Rail
513
42
942
n.a.
129
323
81
333
534
32
720
3.649
Inland Waterways
526
0
64
n.a.
0
18
0
0
1.342
0
0
1.950
Total
2.539
401
2.755
n.a.
1.673
1.404
746
3.027
3.683
452
4.549
21.229
* Daia not available because of change in definitions n.a. : not available
Source: MDS Transmodal
The above table highlights the inland modes used for transport chains having a maritime link. Between 1992 and 1996, the total inland traffic of maritime containers has increased by 31%, from 16.20 million TEU to 21.23 million TEU.
In 1996, road traffic accounted for 73.6% of the total inland traffic of maritime containers. Between the years 1992 and 1996 the transport of maritime containers by road and rail increased roughly 27% and by inland waterways 83%.
The share of rail transport of maritime containers of the total is 34% in Germany. The share of inland waterway transport of the total is 21% in Belgium and 36% in The Netherlands.
The publication "European Container Freight Market: container inland" has been published in 1983, 1988, 1994 and 1998 and contains data for 1982, 1986, 1992 and 1996. MDS provides data relating to the chain of transport by using an in-house econometric model.
33
eurostat EU Intermodal Freight Transport
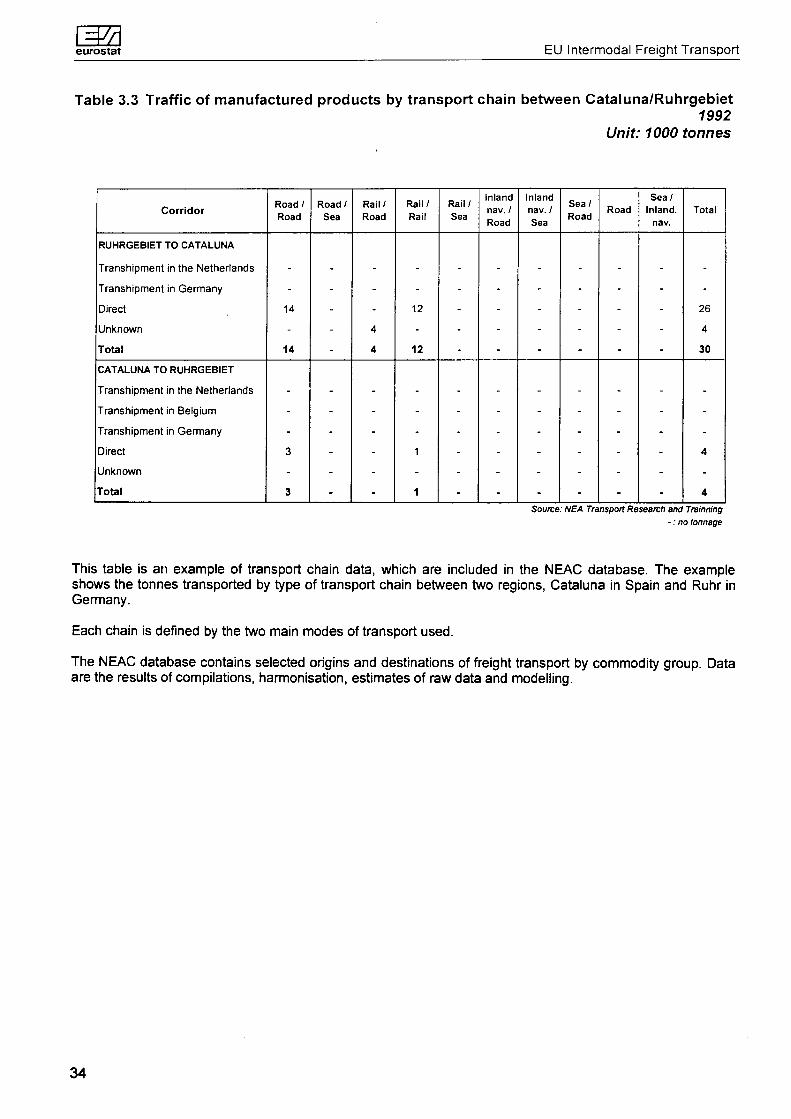
Table 3.3 Traffic of manufactured products by transport chain between Cataluna/Ruhrgebiet 1992
Unit: 1000 tonnes
Corr idor
RUHRGEBIET TO CATALUNA
Transhipment in the Netherlands
Transhipment in Germany
Direct
Unknown
Total
CATALUNA TO RUHRGEBIET
Transhipment in the Netherlands
Transhipment in Belgium
Transhipment in Germany
Direct
Unknown
Total
Road / Road
14
14
3
3
Road/ Sea
-
-
Rai l / Road
4
4
-
Rai l / Rail
12
12
1
1
Rai l / Sea
-
-
Inland nav. / Road
-
-
Inland nav. / Sea
-
-
Sea/ Road
-
-
Road
-
-
Sea/ Inland.
nav.
-
-
Total
26
4
30
4
4
Source: ΝΕΑ Transport Research and Trainning - : no tonnage
This table is an example of transport chain data, which are included in the NEAC database. The example shows the tonnes transported by type of transport chain between two regions, Cataluna in Spain and Ruhr in Germany.
Each chain is defined by the two main modes of transport used.
The NEAC database contains selected origins and destinations of freight transport by commodity group. Data are the results of compilations, harmonisation, estimates of raw data and modelling.
34

EU Intermodal Freight Transport eurostat
Unitised transport by country
35

eurostat EU Intermodal Freight Transport
Chart 4.1 Unitised transport of the European railway companies 1996
Unit: 1000 TEU (except specifically indicated)
Estimated total
New operators 400
National rail operators / vaasE
1 963/ ' ^Mm
1 24%
wB
Intercontainer λ ^^k m
joint ventures 527 ^ ^ ^ ^ B I 9 'W
Intercontainer ( I C F ) ^ ^ ^ ^ ^ ^ ^ ^ ^ ^
1 349
UIRR 3900
Sources: UIRR, UIC, ICF
8 million TEUs were transported by rail in EU-15 in the year 1996.
Based on the total tonnage published by the UIC (which covers around 90-95% of the total EU unitised market) the total unitised rail traffic can be estimated to 140-145 million tonnes (eg approximately 17 tonnes/TEU).
The railway companies and their subsidiaries originally concentrated their efforts on the maritime container business. In addition to mainly domestic marketing companies such as Compagnie Nouvelle de Conteneurs (France) and Transfracht (Germany), the European railway companies jointly formed the company called Intercontainer. This company merged in 1993 with the railway subsidiary for temperature-controlled freight transport and formed Intercontainer-lnterfrigo (ICF). Operating in competition with hauliers and freight forwarders in the European inland transport, the container companies offer shippers the entire combined transport chain for land containers.
As a result of the liberalisation of European transport markets and the internationalisation of transport demand patterns more and more railway companies are directly getting involved in international container transport, thus diminishing the role of ICF.
Moreover, some combined transport companies structured on cooperative lines, freight forwarders and road hauliers and their organisations formed the International Union of Combined Road-Rail Transport Companies, UIRR (Union Internationale des sociétés de transport combiné Rail-Route). The UIRR companies organise and market terminal-to-terminal services by rail.
There are also a number of other private hauliers who, in parallel with the groups mentioned above, operate combined-transport services on their own account either on certain routes or for specific categories of goods, for example chemicals and liquid products requiring tanker transport. Such operators also offer combined rail transport equipment to third parties on the market.
36

EU Intermodal Freight Transport eurostat
Table 4.2.a Intermodal transport including railway transport 1995-1996
1000 transport units
Number of intermodal transport units forwarded
Country
Goods Road Vehicles
Accompanied
Unaccompanied
Swap bodies
Loaded
Unloaded
Containers
Twenty-foot
Thirty-foot
Forty-foot
Total (1000 tonnes)
In goods road véhicules
In swap bodies
In containers
BE
1995
n.a.
n.a.
n.a.
575
450
125
n.a.
n.a
n.a.
n.a.
n.a.
n.a
n.a.
n.a
1996
n.a.
n.a.
n.a.
601
475
125
n.a.
n.a.
n.a.
n.a
n.a
n.a.
n.a.
n.a.
DK
1995
n.a.
n.a.
n.a.
n.a.
n.a.
n.a.
n.a.
n.a.
n.a.
n.a.
n.a.
n.a
n.a.
n.a.
1996
n.a.
n.a.
n.a.
n.a.
n.a.
n.a.
n.a.
n.a.
n.a.
n.a.
n.a.
n.a.
n.a
n.a.
D
1995
n.a.
200
n.a.
n.a.
n.a.
n.a.
2659
n.a.
n.a.
n.a.
n.a.
3469
n.a.
n.a.
1996
313
n.a.
n.a.
n.a.
n.a.
n.a.
2173
n.a.
n.a.
n.a.
n.a.
6173
n.a
n.a.
EL
1995
n.a.
n.a.
n.a.
n.a.
n.a.
n.a.
n.a.
n.a.
n.a.
n.a.
n.a.
n.a.
n.a
n.a.
1996
n.a.
n.a.
n.a.
n.a.
n.a.
n.a.
n.a.
n.a.
n.a.
n.a.
n.a.
n.a.
n.a.
n.a.
E
1995
n.a.
n.a.
n.a.
n.a.
n.a.
n.a.
n.a.
n.a.
n.a
n.a
n.a
n.a
n.a
n.a
1996
n.a.
n.a.
n.a.
n.a.
n.a.
n.a.
n.a.
n.a.
n.a.
n.a.
n.a.
n.a.
n.a.
n.a.
F
1995
42
-
42
495
n.a.
n.a.
665
n.a.
n.a.
n.a.
17556
1075
8637
7844
1996
46
-
46
545
n.a.
n.a.
716
n.a.
n.a.
n.a.
19062
1038
9026
'8998
IRL
1995
-
-
-
-
-
-
78
31
0
44
962
n.a.
n.a.
962
1996
-
-
-
-
-
-
83
34
0
45
951
n.a.
n.a.
951
I
1995
n.a.
n.a.
n.a.
n.a.
n.a.
n.a.
n.a.
n.a.
n.a.
n.a.
n.a.
n.a.
n.a.
n.a.
1996
n.a.
n.a.
n.a.
n.a.
n.a.
n.a.
n.a.
n.a.
n.a.
n.a.
n.a.
n.a.
n.a.
n.a.
Number of intermodal transport units forwarded
Country
Goods Road Vehicles
Accompanied
Unaccompanied
Swap bodies
Loaded
Unloaded
Containers
Twenty-foot
Thirty-foot
Forty-foot
Total (1000 tonnes)
In goods road véhicules
In swap bodies
In containers
L
1995
n.a
n.a
n.a
i t a
n.a
n.a
n.a
n.a
ita.
n.a
I L L
n.a
i t a
i t a
1996
n.a
n.a.
n.a
n.a
i t a
n.a
n.a
n.a.
n.a
i t a
n.a
i t a
i t a
i t a
NL
1995
n.a
n.a
n.a
n.a
n.a
n.a
n.a.
na.
n.a
n.a
n.a
i t a
i t a
i t a
1996
n.a
n.a
n.a
n.a
n.a
n.a.
n.a
n.a
n.a.
n.a
n.a
I U .
n.a
n.a
A
1995
188
n.a.
n.a
n.a
n.a
n.a
616
n.a
n.a
n.a
14799
6081
i t a
8718
1996
210
n.a
n.a.
n.a
n.a
n.a
646
n.a
n.a
n.a.
16528
7319
n.a
9209
Ρ
1995
n.a
n.a
n.a.
n.a
n.a.
n.a.
34
34
-
-
n.a.
n.a
n.a
332
1996
n.a
n.a
n.a
n.a.
n.a
n.a
40
40
-
-
n.a
n.a
n.a
439
FIN
1995
n.a
n.a
n.a
n.a
n.a
n.a
26
n.a
n.a
n.a
n.a
n.a
n.a
481
1996
n.a
n.a.
n.a.
n.a.
n.a.
n.a.
n.a
n.a.
n.a
n.a
n.a
n.a.
n.a
n.a
S
1995
n.a.
n.a.
n.a.
n.a.
n.a.
n.a.
n.a
n.a.
n.a.
n.a.
4.870
1.481
1.191
2.198
1996
n.a
n.a.
n.a.
n.a.
n.a.
n.a
n.a.
n.a.
n.a.
n.a.
n.a
n.a.
n.a.
n.a.
UK
1995
390
390
n.a.
n.a.
n.a.
n.a.
n.a.
n.a.
n.a.
n.a.
n.a.
n.a
n.a
n.a
1996
n.a.
n.a.
n.a.
n.a
n.a.
n.a
n.a
n.a.
n.a
n.a.
n.a
n.a.
n.a.
n.a
CH
1995
219
86
134
481
429
52
409
n.a.
n.a.
n.a
8881
2441
3429
3011
1996
208
89
119
471
423
48
380
n.a.
n.a.
n.a.
8417
2258
3430
2729
n.a. : not available
- « magnitude zero
0- magnitude less than half otthe unit employed
Source: UNiECE
37

^7λ eurostat
EU Intermodal Freight Transport
Table 4.2.b Intermodal transport including railway transport 7995- 7996
1000 transport units
Number of intermodal t ranspor t units forwarded
C o u n t r y
Goods Road Vehicles
Accompanied
Unaccompanied
Swap bodies
Loaded
Unloaded
Containers
Twenty-foot
Thirty-foot
Forty-foot
Total (1000 tonnes)
In goods road véhicules
In swap bodies
In containers
MD
1995
n.a.
n.a.
n.a.
n.a.
n.a.
n.a.
6
2
n.a.
n.a.
n.a.
n.a.
n.a.
44
1996
n.a.
n.a.
n.a.
n.a.
n.a.
n.a.
5
2
n.a.
n.a.
n.a.
n.a.
n.a.
45
RO
1995
1
1
-
2
2
-
96
82
0
14
1403
24
35
1344
1996
-
-
-
7
7
-
141
132
1
8
1726
-
104
1622
RU
1995
n.a.
n.a.
n.a.
n.a.
n.a.
n.a.
1.410
237
-
1.173
n.a.
n.a.
n.a.
8170
| SK
1996
n.a.
n.a.
n.a.
n.a.
n.a.
n.a.
n.a.
n.a.
n.a.
n.a.
n.a.
n.a.
n.a.
n.a.
1995
-
-
-
-
-
-
106
n.a.
n.a.
n.a.
578
-
-
578
1996
-
-
-
-
-
-
24
n.a.
n.a.
n.a.
381
-
-
381
SI
1995
15
15
0
3
2
1
53
40
2
11
1052
338
28
686
1996
20
20
0
3
2
1
49
38
2
10
1068
451
31
586
TR
1995
n.a.
n.a.
n.a.
-
-
-
10
7
2
0
n.a.
1
-
n.a.
1996
n.a.
n.a.
n.a.
-
-
-
10
8
1
1
n.a.
5
-
n.a.
AM
1995
-
-
-
-
-
-
1
1
-
0
19
-
-
19
1996
-
-
-
-
-
-
2
2
-
0
35
-
-
35
n.a. : not available
• = magnitude zero
0 = magnitude less than half of the unit employed
Source: UN/EC E
Number of intermodal transport units forwarded
Country
Goods Road Vehicles
Accompanied
Unaccompanied
Swap bodies
Loaded
Unloaded
Containers
Twenty-foot
Thirty-foot
Forty-foot
Total (1000 tonnes)
In goods road véhicules
In swap bodies
In containers
BG
1995
n.a.
n.a.
n.a.
n.a.
n.a.
n.a.
31
30
-
-
n.a.
n.a.
n.a.
305
1996
n.a.
n.a.
n.a.
n.a.
n.a.
n.a.
21
19
-
-
n.a.
n.a.
n.a.
160
PL
1995
3
-
3
0
0
0
76
n.a.
n.a.
n.a.
929
58
1
870
1996
6
-
6
0
0
0
96
n.a.
n.a.
n.a.
1229
140
2
1087
HR
1995
-
-
-
-
-
-
59
n.a.
n.a.
n.a.
805
-
-
805
1996
-
-
-
-
-
-
56
n.a.
n.a.
n.a.
763
-
-
763
CZ
1995
85
85
-
6
n.a.
n.a.
140
n.a.
n.a.
n.a.
n.a.
2557
n.a.
1366
1996
95
95
-
3
n.a.
n.a.
172
n.a.
n.a.
n.a.
4326
2686
36
1604
HU
1995
n.a.
n.a.
n.a.
n.a.
n.a.
n.a.
137
3
32
101
n.a.
n.a.
n.a.
1012
1996
n.a.
n.a.
n.a.
n.a.
n.a.
n.a.
133
3
32
98
n.a.
n.a.
n.a.
1018
US
1995
n.a.
n.a.
3
n.a.
n.a.
n.a.
4443
n.a.
n.a.
n.a.
n.a.
n.a.
n.a.
n.a.
1996
n.a.
n.a.
3
n.a.
n.a.
n.a.
4834
n.a.
n.a.
n.a.
n.a.
n.a.
n.a.
n.a.
CA
1995
n.a.
n.a.
n.a.
n.a.
n.a.
n.a.
n.a.
n.a.
n.a.
n.a.
2593
n.a.
15071
1996
n.a.
n.a.
n.a.
n.a.
n.a.
n.a.
n.a.
n.a.
n.a.
n.a.
n.a.
n.a.
n.a.
n.a. : noi available
- = magnitude zero
0 * magnitude less than half of the unit employed
. Not applicable
Source: UN/ECE
38

EU Intermodal Freight Transport Ξ3
eurostat
Table 4.3 International rail traffic of large containers 1992- 1996
Unit: Million gross tonnes by country
Country
: Loading
! Unloading
; Loading
I Unloading
¡Loading
1996 ¡ | Unloading
D
2.004
1.876
1.721
1.793
n.a.
n.a.
F I NL Β
880 i 4.349 Ί .003 741 :
804 ! 5.604 ί 1.036; 866 ;
n.a. j n.a. 11.176 205 i
n.a.
1.352
1.131
n.a.
5901
7398
1.232: 186 ;
n.a. ; 3.6371
n.a. i2.4391
L
59
2
n.a.
n.a.
n.a.
n.a.
UK
n.a.
n.a.
n.a.
n.a.
n.a.
n.a.
: IRL
; n.a.
: n.a.
i n.a.
| n.a. í i n.a.
n.a.
DK
600
397
n.a.
n.a.
n.a.
n.a.
EL
34
85
21
25
32
26
E
362
225
n.a.
n.a.
1016
973
Ρ
84
63
177
117
109
135
FIN
n.a
n.a.
n.a.
n.a.
n.a.
n.a.
A S
n.a n.a.
n.a. n.a.
: 766 n.a.
; 964 n.a.
M .040 n.a.
1.295 n.a.
(*) Prior 1993, EU 12, after EU 15 (Sweden, Finland and Austria joined the European Union in
the beginning of 1995).
tonnes = gross tonnes (weight of container or vehicle included)
Source: EUROSTAT
n.a. : not available
- = magnitude zero
0 - magnitude less than half of the unit employed
. Not applicable
Table 4.2.includes data on the tonnes transported by rail using large containers (20 feet or more) including the weight of the container or road vehicle.
This table shows the international rail traffic of loaded and empty large containers during the three years. As less and less countries are providing data for recent years, it is becoming more difficult to analyse the evolution of the number or tonnage of large containers loaded or unloaded in the EU. For the year 1992 data for ten countries were available. For these countries the total number of loaded large containers amounted to 483,291 corresponding to 10.1 million gross tonnes. Between the years 1992 and 1996, the percentage increase of tonnes loaded and unloaded was 34% for Italy, 48% for France, 66% for Portugal, 239 for Spain and 278% for Belgium. During the same period international transport of large containers decreased by 51% in Greece.
Table 4.4 National and transit rail traffic of large containers
1992 - 1996
Unit: Million gross tonnes by country
Country
1992
1994
1996
Loading
Transit
Loading
Transit
Loading
Transit
D
6.742
1.458
7.508
1.161
n.a.
n.a.
F
4.115
2.513
n.a.
n.a.
4.919
4.522
1
5.485
0,03
n.a.
n.a.
9.883
0
NL
1.404
n.a.
1.478
n.a.
n.a.
n.a.
Β
1.214
726
n.a.
n.a.
1.329
726
L
19
1.527
n.a.
n.a.
n.a.
n.a.
UK
5.146
-
n.a.
n.a.
n.a.
n.a.
IRL
1.490
-
1.240
-
n.a.
n.a.
DK
586
n.a.
n.a.
n.a.
n.a.
n.a.
EL
n.a.
n.a.
n.a.
n.a.
n.a.
n.a.
E
2.073
5
n.a.
n.a.
Ρ
15
-
n.a.
-
3.6951 182
0
FIN
n.a.
n.a.
n.a.
n.a.
A i S
n.a. i n.a.
n.a. ! n.a.
536 | n.a.
936 n.a.
n.a. i 809 j n.a. j
n.a. | 924 j n.a.
Π Prior 1995, EU 12, after EU 15 Source: EUROSTAT
tonnes = gross tonnes (weight of container or vehicle included) n.a. : not available
- = magnitude zero
0 = magnitude less than half of the unit employed
. Not applicable
For the countries which provided data for the years 1992 and 1996, the increase of national and transit rail traffic of large containers was 80% in Italy, 78% in Spain, 42% in France and 5,9% in Belgium. The increase of loadings of large containers in national transport was 19,5 % in France and 9,4 % in Belgium. Starting from a very low level, Portuguese national rail traffic of large containers increased during the same period strongly, from 15 tonnes to 182 tonnes.
39

eurostat EU Intermodal Freight Transport
Table 4.5 Road-rail traffic 7 9 9 2 - 7996
Unit: Million gross tonnes by country
Railway international traffic
Country
1992
1994
1996
Loading
Unloading
Loading
Unloading
Loading
Unloading
D
4.678
4.048
6.105
5.264
-
-
F
468
576
-
-
541
458
I
1.520
1.806
-
n.a.
n.a.
NL
299
190
387
288
n.a.
n.a.
Β
1.197
813
3.384
3.279
364
781
L
7
2
n.a.
na.
η a.
n.a.
UK
-
-
n.a.
n.a.
n.a
n.a.
IRL
-
-
-
-
-
-
DK
n.a.
2
-
-
n.a.
n.a.
EL
0
0
0
0
0
0
E
n.a.
n.a.
n.a.
n.a.
n.a.
n.a.
Ρ
n.a.
n.a.
0
0
0
0
FIN
n.a.
n.a.
n.a.
n.a.
n.a.
n.a.
A
n.a.
n.a.
n.a.
n.a.
n.a.
n.a.
S
n.a.
n.a.
n.a.
n.a.
n.a.
n.a.
Railway national and transit traffic
Country
1992
1994
1996
Loading
Transit
Loading
Transit
Loading
Transit
D
3.935
697
5.930
1.924
-
-
F
3.080
1.606
■
-
2.408
2.699
I
259
0
-
-
-
-
NL
•
-
n.a.
-
-
-
Β
18
12
1.286
1.010
1
3
L
-
194
-
-
-
-
UK
n.a.
n.a.
n.a.
n.a
n.a.
n.a.
IRL
n.a.
n.a.
n.a.
n.a.
n.a.
n.a.
DK
-
4
-
-
-
-
EL
-
-
-
-
-
-
E
-
-
-
-
-
-
Ρ
4
-
-
-
n.a.
-
FIN
n.a.
n.a.
n.a.
n.a.
n.a.
n.a.
A
-
-
n.a.
n.a.
n.a.
n.a.
S
n.a.
n.a.
n.a.
n.a.
n.a.
n.a.
Π Prior to the year 1993, EU-12, aller EU-15 (Streden, Finland and Austria
joined the EU in the beginning of 1995).
tonnes = gross tonnes (weight of container or vehicle included)
Source: Eurostat
n.a'.: not available
0 = magnitude less than half of the unitemployed
- - magnitude zero
The statistics above on road-rail transport refer to a limited number of countries and do not reflect the overall situation in EU-15.
40

EU Intermodal Freight Transport eurostart
Table 4.6.a Intermodal transport including maritime transport 1995- 1996
1000 intermodal transport units forwarded
C o u n t r y j
G o o d s r o a d veh i c l es
Accompanied
Loaded on ships
Unloaded from ships
Unaccompanied
Loaded on ships
Unloaded from ships
Containers with goods
Loaded on ships
Unloaded from ships
Empty containers
Loaded on ships
Unloaded from ships
G o o d s carried In Intermodal
t ransport unit (1000 tonnes)
In g o o d s road véhicules
Loaded on ships
Unloaded from ships
In containers
Loaded on ships
Unloaded from ships
1996
n a
η a
n.a
η a
η a
n.a
n.a.
132
56
76
37
14
23
n.a
2545
1043
1502
n.a.
n.a.
n a
D K
1995
n.a.
η a
n.a.
η a
η a
n.a.
n.a.
n.a.
n.a.
n.a
η a.
n.a.
n.a.
n.a.
n.a.
n.a.
n.a.
n.a.
n.a.
n.a.
1996
η a
η a
n.a.
η a
η a
n.a
n.a.
n.a.
n.a.
η a
η a.
n a .
n.a.
η a.
n.a.
n.a.
n.a.
n.a.
n.a.
n a
D
1995
1216
839
438
401
377
189
188
4018
2020
1.998
607
258
349.43
54979
14131
7198
6933
4 0 8 4 8
21624
19224
1996
1328
918
474
444
409
204
205
4.234
2.116
2 1 1 8
610
281
349
57875
16456
8417
8039
41419
21707
19713
EL
1995
1243
1243
612
631
---
615
258
357
197
151
45
17639
10182
5153
5029
7457
3365
4092
1996
η a
η a
n.a.
π a
η a
n.a.
η a.
600
250
351
214
162
52
7 1 2 5
n.a.
n.a.
n.a.
7126
3161
3964
ε
1995
n.a
η a
n.a
η a
1
0
0
2116
1121
996
763
343
4 1 9
45935
6 5 7 4
3535
3039
3 9 3 6 1
2116
18245
1996
n.a
η a
n.a
η a
1
0
0
2239
1208
1030
797
329
468
51182
8770
4152
4618
42412
23034
19378
F
1995
η a
η a
η a
η a
η a
η a
η a
η a
η a
η a
η a
η a
n a .
61719
4 4 5 5 8
23713
20845
17161
10150
7011
I IRL
1996
η a
η a
η a
η a
η a
η a
n.a
η a
n.a
n.a
η a
n.a.
n.a
6 1 4 8 6
4 3 4 1 8
23249
20169
18068
11033
7035
1995
326
η a
η a
η a
η a
η a
n.a
269
126
144
41
23
18
7917
3742
29447
8226
4175
1999
2176
1996
432
η a
π a
η a
η a
n.a
n.a
273
121
152
51
35
16
10052
5648
4 6 1 0 6
11870
4404
1989
2415
Count ry
I G o o d s road vehicles
Accompanied
Loaded on ships
Unloaded from ships
Unaccompanied
Loaded on ships
Unloaded from ships
Conta iners
Containers with goods
Loaded on ships
Unloaded from ships
Empty containers
Loaded on ships
Unloaded from ships
G o o d s carried In intermodal
t ransport unit (1000 tonnes)
In goods road véhicules
Loaded on ships
Unloaded from ships
In containers
Loaded on ships
Unloaded from ships
1996
663
n.a
n.a.
n.a.
η a.
n.a
n.a
3310
2888
1460
1428
4 2 2
160
262
n.a.
n a
n.a
n.a
4 2 6 4 2
23651
18991
Ρ
1995
n.a.
n.a
n.a.
n.a.
n.a
n a
n.a.
335
256
150
105
80
16
63
n.a.
n.a.
n a
n.a
3807
2253
1554
1996
n a
n.a.
n.a.
η a
n.a.
n a
n.a.
365
270
165
105
95
16
79
n.a.
η a.
n a .
n a
4039
2473
1566
FIN
1995
423
203
98
105
220
112
108
388
388
190
198
69
26
4 3
11562
6 4 3 0
3353
3077
6132
2827
2305
1996
458
212
105
107
246
123
123
427
427
209
218
102
56
46
12587
6934
3600
3334
5653
2926
2727
S
1995
1223
n.a
n.a
n.a
n a
n.a
n.a.
786
598
356
241
189
4 3
146
24982
18382
9739
8643
6600
4 1 9 3
2407
1996
1432
1432
715
717
---
7 5 2
548
326
221
195
4 4
151
2 5 9 4 7
19420
10023
9397
6 5 2 7
4 0 4 6
2481
U K
1995
4 1 1 7
2244
1104
1140
1873
927
946
3 5 8 6
3587
1777
1810
532
373
159
101
6 4 1 4 2
24382
29760
4 7 0 9 4
21857
25237
na. : not available
0 - magnitude lesa than half of the unit employed
• - magnitude zero
Source; UN/ECE
41

eurostat EU Intermodal Freight Transport
Table 4.6.b Intermodal transport including maritime transport 1995- 1996
1000 intermodal transport units forwarded
Country
Goods road vehicles
¡Accompanied
¡Loaded on ships
BG
1995 1996
n.a. n.a.
n.a. n.a.
n.a. n.a.
HR
1995 1996
¡Unloaded from ships n.a n.a.
CY
1995
3
3
2__
2
1996
3
EE
1995
n.a.
1996
LV
1995 1996
LT
1995
60
1996
84
n.a.
n.a.
n.a.
n.a.
n.a.
n.a.
n.a.
n.a.
26
12
29
13
14 16
Unaccompanied 34 55
Loaded on ships 17 ! 27
Unloaded from ships 17 27
I Containers with goods 15 11 12 243 351 104
17805 23.859
12 16
Loaded on ships 97 151 37
Unloaded from ships
Empty containers
146 ! 201
131 211
67
39
12
7
Loaded on ships 89 130 34
Unloaded from ships 43 81
Goods carried In intermodal
¡transport units (1000 tonnes)
In goods road véhicules
148 138 ! 2073 ; 3440
- —
32 "
723 1158 1283
26 586 662 1071
1315
1011
Loaded on ships 29 21 253 257 387 387
Unloaded from ships 333 405 684 624
I In containers 148 138 ; 2041 i 3414 137 496 1355 I 212 304
Loaded on ships 72 981 i 1460 38 140 511 39 74
Unloaded from ships 66 1460 1953 99 243 844 173 230
Country
Goods road vehicles
Accompanied
Loaded on ships
Unloaded from ships
Unaccompanied
Loaded on ships
Unloaded from ships
Containers
Containers with goods
Loaded on ships
Unloaded from ships
Empty containers
Loaded on ships
Unloaded from ships
Goods carried in intermodal
transport units (1000 tonnes)
In goods road véhicules
Loaded on ships
Unloaded from ships
In containers
Loaded on ships
Unloaded from ships
ML
1995
n.a.
n.a.
n.a
n.a.
n.a.
n.a.
n.a.
16
11
8
2
5
1
5
n.a.
n.a.
n.a.
n.a.
n.a.
n.a.
n.a.
1996
n.a.
n.a.
n.a.
n.a.
n.a.
n.a.
n.a.
16
10
8
PL
1995
-
-
-
-
-
-
-
104
75
37
1 | 3B
6
1
6
n.a.
n.a.
n.a.
n.a.
n.a.
n.a.
n.a.
29
18
10
1388
-
-
-
1388
692
696
1996
-
-
-
-
-
-
-
116
84
38
46
31
23
8
1613
-
-
-
1613
757
856
RO
1995
6
6
3
3
-
-
-
69
55
25
30
13
8
5
882
180
88
92
682
389
293
1996
5
5
2
3
-
-
-
86
65
24
41
21
19
3
805
150
66
84
655
33B
317
RU
1995
n.a.
n.a
n.a.
n.a
n.a.
η a
n.a.
n.a.
n.a.
n.a.
na .
n.a.
n.a
n a .
n.a.
n.a.
n.a.
n.a.
5121
n.a.
n.a.
1996
n.a.
n.a.
n.a.
n.a.
n.a.
n.a.
n.a.
n.a.
n.a.
n.a.
n.a.
n.a.
n.a.
n.a.
n.a.
n.a.
n.a.
n.a.
n.a.
n.a.
n.a.
SI
1995
55
11
7
4
43
1
42
58
43
25
18
16
6
10
891
255
120
135
636
357
279
I CA
1996
118
7
5
2
111
13
98
65
46
27
20
18
7
11
908
209
84
125
699
396
303
1995
n.a.
n.a.
n.a
n.a.
n.a.
n.a.
n.a.
1533
1385
797
567
149
25
124
n.a.
n.a.
n.a.
n.a.
15507
9183
6324
1998
n.a.
n.a.
n.a.
n.a.
n.a.
n.a.
n.a.
1715
1509
898
611
206
24
182
n.a.
n.a.
n.a.
n.a.
16864
10152
6712 i
n.a. : not available
0 = magnitude teas than half of the unit employe - = magnitude zero
Sow«. UN/ECE
42
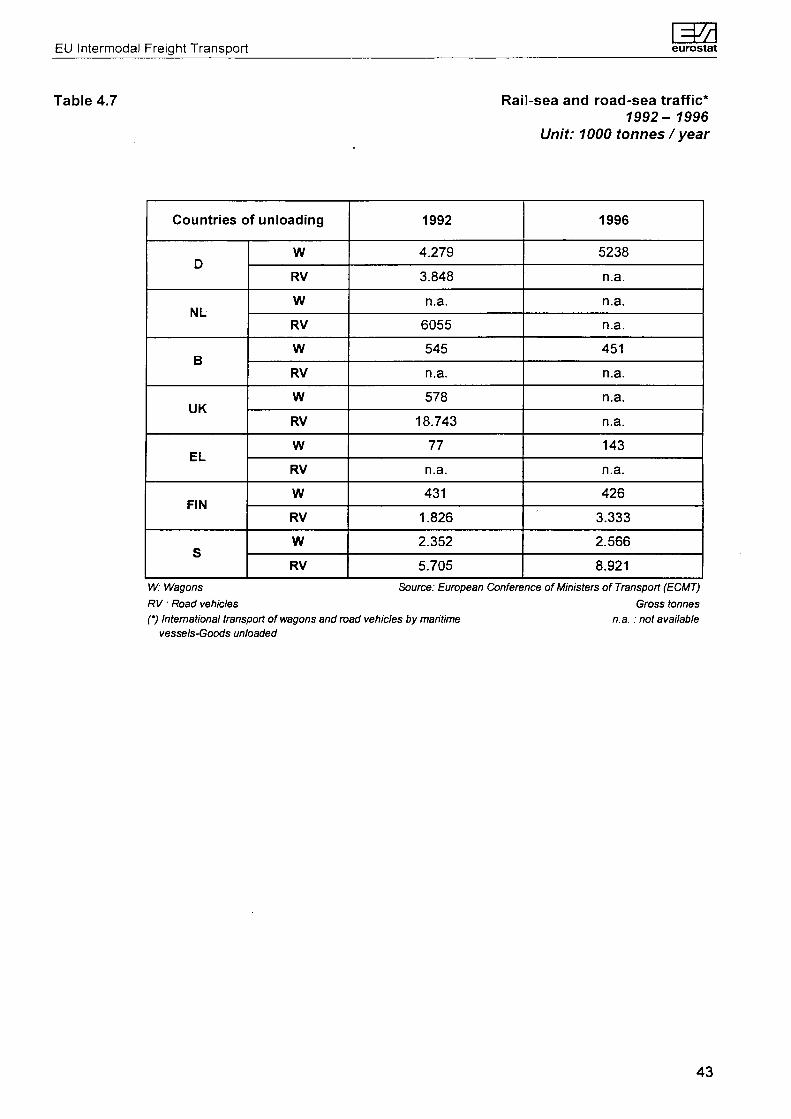
EU Intermodal Freight Transport eurostat
Table 4.7 Rail-sea and road-sea traffic* 7 9 9 2 - 1996
Unit: 1000 tonnes / year
Countries of unloading
D
NL
Β
UK
EL
FIN
S
W
RV
W
RV
W
RV
W
RV
W
RV
W
RV
W
RV
1992
4.279
3.848
n.a.
6055
545
n.a.
578
18.743
77
n.a.
431
1.826
2.352
5.705
1996
5238
n.a.
n.a.
n.a.
451
n.a.
n.a.
n.a.
143
n.a.
426
3.333
2.566
8.921 W: Wagons Source: European Conference of Ministers of Transport (ECMT) RV : Road vehicles Gross tonnes (') International transport of wagons and road vehicles by maritime n.a. : not available
vessels-Goods unloaded
43

[m eurostat
EU Intermodal Freight Transport
Table 4.8 Container traffic of maritime ports by country 7996
Unit: Mio TEU unloaded
Traffic by country
Belgium
Denmark
Germany
Greece
Spain
France
Ireland
Italy
Netherlands
Portugal
Finland
Sweden
United Kingdom
Norway
Β
DK
D
EL
E
F
IRL
I
NL
Ρ
FIN
S
UK
NO
TOTAL
1992
2,3
0,43
3,6
0,65
1,8
1,1
0,34
1,2
4,2
0,47
0,34
0,52
4,4
0,14
18,76
1996
3,2
0,48
4,7
0,81
3,5
1,8
0,52
3,8
5,1
0,49
0,66
0,77
5,1
0,25
27,5
Source: Containerisation Yearbook
The total EU container traffic in the maritime ports was 31.2 million TEUs loaded and unloaded in the year 1996. The share of container traffic was 1/7 of the total cargo handled in the EU ports (a TEU corresponds to 10-12 tonnes). The traffic of the UK, Dutch and German ports accounted for 48% of the total EU TEUs transported in 1996.
The total container traffic in the seaports of the EU increased by 45% from the year 1992 to the year 1996. It increased by 94% in Spain, 216% in Italy and 94% in Finland. The share of the UK, German, Dutch and Belgian maritime container transport decreased by 9% between these years and accounted for 58% of the total in 1996.
44

EU Intermodal Freight Transport Läad eurostat
Table 4.9.a Intermodal unitised traffic of the UIRR members Main origins and destinations
1992 - 1996 Unit: 1000 gross tonnes
Origin / destination
Germany - Italy
Italy - Germany
Germany - Austria
Austria - Germany
Greece - Austria
Austria - Greece
Belgium - Italy
Italy - Belgium
Italy - Netherlands
Netherlands - Italy
France · Italy
Italy - France
Italy - United kingdom
United Kingdom - Italy
Other O/D
TOTAL*
1992
2,674
2,593
2,586
2,717
-
-
622
546
160
165
280
241
-
71
3,846
16,501
1994
3,333
3,140
2,821
1,742
-
-
1,083
695
257
327
435
383
42
-
1,664
16,069
1996
3,659
3,272
2,530
2,314
1,265
1,249
1,139
891
551
471
428
411
346
328
2,132
20,986
* including traffic with extra E.U. countries Source: UIRR - = missing data
Notes: The O/D selected are those with more than 300 thousand tonnes of freight transport in 1996. These statistics concern the main journeys between two temtinals. According to UIRR, unitised traffic include the transport by rail of road vehicles, swap bodies, containers and trailers.
Table 4.7.a includes data on the gross freight tons transported by the UIRR members for the main international origin and destination countries within the EU. It covers the transport by rail of complete trucks, trailers, containers and swap-bodies.
The total unitised transport of the members of the UIRR remained roughly the same between the years 1992 and 1994. When comparing the same origin and destination countries the increase of unitised transport was 13% between the years 1994 and 1996. Unitised traffic increased clearly in most of the origin-destination countries considered between the years 1992 and 1996. The only main origins and destinations were unitised traffic decreased during this period were the ones between Germany and Austria.
45

eurostat EU Intermodal Freight Transport
Table 4.9.b Intermodal unitised traffic of the UIRR members Main origins and destinations
7992 - 1996 Unit : Mio tkm
Origin / Destination
Italy - Germany
Germany - Italy
Italy - Belgium
Germany - Austria
Austria - Germany
Belgium - Italy
Netherlands - Italy
Italy - Netherlands
Greece - Austria
Austria - Greece
United Kingdom - Italy
Italy - United Kingdom
France - Italy
Italy · France
Germany - Spain
Other .
TOTAL*
1992
2,140
1,939
546
1,312
1,401
622
189
213
-
-
89
-
281
244
56
4,174
13,206
1994
2,534
2,483
1,152
1,452
1,418
1,116
292
442
-
-
26
53
407
364
108
2,065
13,912
1996
2,708
2,669
1,444
1,370
1,178
1,076
695
630
569
560
519
476
397
362
309
2,247
17,201
* including traffic with extra EU countries Source: UIRR - = missing data
Notes:
The O/D selected are those of 300 thousand tonnes ormone in 1996.
These statistics concern the main journeys between two terminals.
According to UIRR, unitised traffic includes the transport by rail of road vehicles, swap bodies, containers and trailers.
The above table includes the tonne-kilometres between the countries. In 1996 the total international unitised traffic of the UIRR members increased by 23% compared to 1994. Seven origins - destinations account for 64% of this total, involving principally Germany, Italy, Austria, Greece and to a smaller extent Belgium.
By country of origin, Italy represented 35% of the total tonne-kilometres, Germany 29.8%, Austria 11.6% and Belgium 10.6%. The share of the other countries is less than 2.5%.
UIRR members in the year 1999 are Adria Kombi (SLO), Bohemiakombi (ZS), Cemat (I), Combiberia (E), CS Eurotrans (SK), C.T.L (UK), Hungarokombi (H), Hupac (CH), Kombiverkehr (D), Novatrans (F), Skan Kombi (DK), T.R.W (Β), Trailstar (NL), Polkombi (PL), Ökombi (A).
46
EU Intermodal Freight Transport eurostat
Unitised transport by operator
47

S3 eurostat EU Intermodal Freight Transport
Table 5.1 Intermodal transport main operators 7996
Unit: 1000 TEU
UIRR MEMBERS **
Combiberia
Cemat
C.T.L
Kombiverkehr
Novatrans
ökombi
Skan Kombi
Tra ilstar
T.R.W
ICF MEMBERS
ICF AFFILIATED MEMBERS
I talcontainer
Optimodal
Interferry
ACI
Intercontainer Austria
OTHER OPERATORS
CNC
ERS
NDX*
Transfesa
Transfracht - International
COUNTRY
E
I
UK
D
F
A
DK
NL
B
I
NL
B
UK
A
F
NL
E
D
NATIONAL
-1,631.6
-510,6
-614,1
372,6
117,3
13,8
-3,2
INTERNATIONAL
1,953.8
31
296,7
73,6
798,1
202,4
294,4
32,2
52,9
172,5
1349
527
282
112
71
41
16
- 5 0 0
- 2 0 0
100
n.a.
n.a.
n.a.
' The company ceased its activity in 1998 "on the basis of a ratio of 2.3 TEU / consignment
Sources: UIRR, ICF, UIC n.a. = not available
The European Rail Shuttle (ERS) is owned by three of the world's largest ocean carriers: Sea Land Service Inc., Maersk Lines and P&O Nedlloyd. It mainly runs services from Rotterdam through DB Cargo territory to the Rhine industrial region, northern Italy, the Czech Republic and Slovakia. ERS transported 117,000 boxes between its Rotterdam base and Germany and Italy in 1997. With 700,000 containers transported during the year 1997 Transfracht is the largest individual operator in Europe. NDX, a joint venture of CSX Corp. (25%), Deutsche Bahn (50%) and the Dutch operator NS (25%) is not active after September 1998. Its rail routes are taken over by Transfract (D), which is forming Rail Cargo Europe in partnership with NS Cargo (NL).
During the year 1997 the growth of the UIRR members national and international traffic growth was 9%. In international traffic the traffic growth was particularly positive on the routes to/from Great Britain, in trans-Alpine traffic and in the central European Countries.
On UIRR international traffic holds a dominant 61%. The average distance in national traffic is around 640 kilometres and 780 kilometres in international traffic. Altogether the UIRR operators shift 7500 lorries per day to rail.
48

EU Intermodal Freight Transport eurostat
Table 5.2 Intermodal rail traffic by operator 1994- 1996
Units: UTI, 1000 t
NETWORK
CFF / SBB /FFS
CFL
CH
CIE
CP
DB AG
DSB
FS
NS
ÖBB
RENFE
SJ
SNCB/NMBS
SNCF
VR
RFD
COUNTRY
CH
L
EL
IRL
Ρ
D
DK
I
NL
A
EL
S
Β
F
FIN
UK
1994
1000 UTI
1.081
210
-
-
29
-
-
1567
-
754
-
-
585
-
22
-
1000T
11.555
3.160
-
-
307
-
-
25.591
-
14.315
-
-
9.060
-
561
-
1995
1000 UTI
1.110
223
2
50
34
2.860
-
1.589
-
804
668
-
575
-
26
77
1000T
11.652
3.036
34
1.080
408
30.126
-
27.699
-
14.744
5.334
4.833
9.049
17.557
481
1.558
1996
1000 UTI
1.058
-
3
52
-
3.220
-
1.682
380
856
753
- '
601
1.306
-
-
1000T
11.058
3.159
58
1.059
-
26.354
-
29.115
6.215
15.835
6.017
4.511
9.632
19.061
-
-
1 000 000 TK
2.905
111 6
-
-
-
13.094
-
8.224
943
3.333
3.262
2.463
1.606
12.236
-
-
Statistics cover the traffic of the UIC members for their rail part (e. g. the
rail part of ICF traffic is included)
ITU: Unit of Intermodal transport: swap-body + containers + road vehicle on rail (empty
or loaded)
Source: Union internationale des Chemins de Fer (UIC)
- = missing data
As a whole, the total traffic declared by UIC reached 132 million tonnes in 1996 and 48.2 billion tonne-kilometres. D-Bahn, FS, SNCF, ÖBB and CFF/SBB represent 76% of the total (in tonnes) and 81% (in tkm).
Considering that UIC covers around 90 - 95% of the total rail freight activity in the EU15 the total unitized rail traffic including Switzerland is approximately 52.4 Bio tkm in 1996.
Data concerning loading units are indicative and not fully comparable because most of the reporting companies do not specify the kind of loading units used. Only the railway segment of the transport chain is known.
49

eurostat EU Intermodal Freight Transport
Table 5.3 Transit rail traffic by ICF members* 1992- 1996
Unit: TEU- 1000 TEU. Km
Railway Network
NAME
DB
SNCF
FS
SNCB
CFL
DSB
CH
RENFE
OBB
SJ
CFF/SBB
COUNTRY
D
F
I
B
L
DK
EL
S
A
s CH
1992 1994
TEU
166.781
219.518
19
103.515
194.219
77.622
n.a.
797
74.274
7.074
253.318
TEU. Km 1000
132.345
105.108
9
27.261
6.994
18.338
n.a.
534
15.967
3.550
72.963
TEU
196.539
294.814
9
112.675
264.964
104.823
40
545
95.353
9.955
292.629
TEU. Km 1000
166.521
134.447
6
30.779
9.538
24.884
9
530
23.864
4.862
86.311
1996
TEU
228.189
309.485
18
84.075
234.856
97.289
n.a.
689
101.662
7.538
242.345
TEU. Km 1000
191.043
173.523
10
23.098
8.407
22.971
n.a.
671
28.764
3535
71.868
C) ICF networks belonging to the EU + Switzerland Sourve: Intercontainer Interírigo ICF n.a. = not available
The total transit traffic of ICF in the EU Member States was 1.31 million TEUs in the year 1996. The share of D - Bahn, SNCF, CFL, RENFE and CFF / SBB is 85% of the total ICF transit traffic.
50

EU Intermodal Freight Transport eurostat
Table 5.4 Unitised rail transport: Import of large containers by kind of frontier point
7993 - 1995 Unit: 1000 gross tonnes by railway company and country
Railway
NAME
DB AG
SNCF
FS Spa
NS
SNCB/NMBS
CFL
RFD Ltd
BR
CIE
DSB
CH
RENFE
CP
VR
OBB
SJ
CFF/SBB/FFS
COUNTRY
D
F
I
NL
Β
L
UK
UK
IRL
DK
EL
E
Ρ
FIN
A
S
CH
1993
Via mainland frontier point
1.121
237
1.620
971
197
0
-n.a.
n.a.
631
52
-42
44
952
n.a.
438
Via sea or river point
1.570
746
775
n.a.
278
n.a.
-3.058
n.a.
n.a.
n.a.
-51
73
n.a.
n.a.
n.a.
1994
Via mainland frontier point
931
286
2.189
1.266
n.a.
6
-n.a.
n.a.
807
25
-66
n.a.
990
155
463
Via sea or river point
1.557
730
343
n.a.
n.a.
n.a.
-3.435
n.a.
n.a.
n.a.
-52
n.a.
n.a.
n.a.
n.a.
1995
Via mainland frontier point
7.435
936
9.284
-2.419
20
833
-
--
1.387
104
-4.340
556
1.398
Via sea or river point
-680
506
-286
n.a.
n.a.
-
---
641
84
-n.a.
n.a.
n.a.
Source: UIC n.a. - not available The statistics cover the UIC members for their rail part (e.g. the rail part of ICF and UIRR traine are included) - = missing data (') Unitised transpori includes the transport by rail of containers, swap bodies and road vehicles. The figures for 1993 and 1994 concern containerised transport only. From the year 1995 UIC uses Intermodal Transport Units (ITU).
Π The following UIC members have not provided data during the period 1993-1995: BLS (D), Eurotunnel (F), ATOC (UK), Raittrack (UK), MR (UK), CIE (IRL), JBV (Ν), NSB (Ν).
The statistics do not cover all UIC members. Moreover, some operators provide only partial data concerning the mainland frontier points but not the sea or river points (or conversely). However, the general trend is a strong increase of the import traffic via mainland frontier points for large containers: The tonnage imported has increased by 5.6 times between the years 1993 and 1995 for operators having provided data for both years.
51

eurostat EU Intermodal Freight Transport
Table 5.5 Unitised rail transport: Export of large containers by kind of frontier point 1993 - 1995
Unit: 1000 gross tonnes by railway company and country
Railway
NAME
DB AG
SNCF
FS Spa
NS
SNCB/NMBS
CFL
RFD Ltd
BR
DSB
CH
RENFE
CP
VR
0BB
SJ
CFF/SBB/FFS
COUNTRY
D
F
I
NL
Β
L
UK
UK
DK
EL
E
Ρ
FIN
A
S
CH
1993
Via mainland
frontier point
1.471
420
1.364
999
354
55
-
n.a.
852
26
n.a.
80
167
1.132
n.a.
453
Via sea or
river point
3.265
1.167
1.924
n.a.
674
n.a.
-
2.802
n.a.
n.a.
-
75
222
n.a.
n.a.
n.a.
1994
Via mainland
frontier point
1.292
735
2.095
1.216
n.a.
27
227.902
n.a.
1.016
21
-
88
n.a.
772
321
499
Via sea or
river point
3.812
1.143
871
n.a.
n.a.
n.a.
n.a.
3.148
n.a.
n.a.
-
89
n.a.
n.a.
n.a.
n.a.
1995
Via mainland
frontier point
8.135
1.227
7.689
-
3.140
34
725
-
-
-
795
118
-
4.254
683
1.232
Via sea or
river point
-
1.506
1.067
-
753
n.a.
n.a.
-
-
-
657
98
-
n.a.
n.a.
n.a.
The statistics cover the UIC members for their rail part (e.g. the rail part of ICF and UIRR traffìc are included)
ITU: Intermodal Transport Unit, including large containers (>=20), swap bodies, road vehicles
O Unitised transport includes the transport by rail of containers, swap bodies and road vehicles.
The figures for 1993 and 1994 concern containerised transport only. From 1995, UIC uses Intermodal
Transport Units (UTI).
O The following UIC members have not provided data during the period 1993-1995: BLS (D), Eurotunnel (F), A TOC (UK),
Railtrack (UK), MR (UK), CIE (IRL), JBV (N), NSB (N).
Source: UIC
: not available
- missing data
The general trend is a steady increase of traffic for the export of large containers via mainland frontier points. The tonnage has multiplied by 4.8 between the years 1993 and 1995 for operators having provided data for both years.
52

EU Intermodal Freight Transport \3Δ eurostat
Table 5.6 Unitised rail transport: Transit of large containers by kind of frontier point
1993 - 1995
Unit: 1000 gross tonnes
RAILWAY
NAME
DB AG
SNCF
FS Spa
NS
SNCBiNMBS
CFL
DSB
CH
VR
OBB
SJ
CFF/SBB/FFS
COUNTRY
D
F
I
NL
Β
L
DK
EL
FIN
A
S
CH
1993
Between 2
mainland frontier
points
1.240
2786
0
n.a.
837
2.134
531
n.a.
n.a
835
n.a.
2.217
Between
mainland
frontier i port
1065
494
n.a
414
n.a.
-
na.
0
n.a.
n.a
n.a
Between poil
& mainland
frontier pom!
754
247
n.a
83
n.a
-
n.a.
18
n.a
n.a
n.a
Between 2
sea or
Rivet points
565
209
n.a.
15
n.a.
n.a.
n.a.
0
n.a.
n.a.
n.a.
1994
Between 2
mainland
frontier points
1476
3.312
0
n.a
n.a.
3.104
625
n.a.
n.a.
914
n.a.
2428
Between
mainland
frontier i port
1219
422
n.a
n.a.
n.a.
-
n.a
n.a
n.a.
n.a
n.a
Between port 8.
mainland
frontier point
790
210
n.a.
n.a
n.a.
-
n.a
n.a
n.a
na
n.a
Between 2
sea οι
River points
472
140
n.a.
n.a.
n.a.
n.a.
n.a
n.a
n.a.
n.a.
n.a
1995
Between 2
mainland
frontier points
0
-
810
2.959
-
-
-
4.774
132
8.683
Between
mainland
frontier & port
-
297
-
624
n.a.
-
-
-
n.a.
n.a.
n.a
Between port
& mainland
frontier point
162
615
n.a.
-
-
n.a
η a
n.a
Between 2
sea or
River points
81
12
n.a.
•
n.a.
n.a.
n.a
The Satisfies ewer the UIC members lor then ml fari ¡eg the ml part at ICF and UIRR traffic are included)
ITU: Intermodal Transpor) Uni, including large containers (>=20J, svep bodies, road vehicles
Π Unitised transpon includes the transport by rail oí containers, svep bodies and road vehicles The ligures lor 1993 and 19êi concern containerised
transpon orty. From 1995, UIC uses Intermodal Transpon Unts (UT!)
Π The Ic&mng UK members have not provided data during lhe period 1993-1995 BIS fO], Eurotunnel (F¡, A TOC DIK), Raiiiack (UK), RFD ¡UK),
BR |UK), KIR (U/C), CIE (IRQ, REKFE (E), CP (P), KSB (It). JBV (K)
Source UIC
na = not available
■ = missing data
53

eurostat EU Intermodal Freight Transport
Table 5.7.a Traffic of ICF by origin and destination railway 1996
Unit: TEU
Railway of origin
BDZ
BR
CFF
CFL
CH
CP
CD
DB
DSB
FS
HZ
JZ
MAV
NS
NSB
OBB
PKP
RENFE
SJ
SNCB
SNCF
SNCFR
SZ
TCDD
VR
ZSR
Country
BG
UK
CH
L
EL
Ρ
cz D
DK
I
HR
Serbia
Η
NL
Ν
A
PL
EL
S
Β
F
RO
SLO
TR
FIN
SK
Total traffic received
%
Railway of destination
BDZ
0
0
3
0
30
0
5
360
0
214
0
0
627
26
0
150
1
0
0
108
28
17
0
7
0
2
1578
0,0012
BR
0
0
580
855
0
0
1
26
0
8625
0
0
0
2
0
608
0
99
0
0
297
1
0
28
0
0
11122
0.0083
CFF
0
538
935
24
92
4
137
9593
3139
7237
0
0
617
12922
33
1187
5
425
1659
8307
2629
0
4
123
197
10
49817
0.0374
CFL
0
510
96
0
0
0
0
30
0
1271
0
0
3
37
0
0
0
1
0
118
5
0
0
12
0
0
2083
0,0016
CH
137
0
26
0
0
0
203
603
2
3
0
0
407
92
0
288
3
0
0
209
14
8
5
0
0
0
2000
0.0015
CP
0
0
0
0
0
0
0
129
0
16
0
0
0
16
0
7
0
6015
8
31
56
0
0
0
1
4
6283
0.0047
CD
6
0
246
0
34
0
2
3398
0
537
14
0
846
11
16
1825
785
37
12
141
372
100
42
10
836
269
9539
0.0072
DB
579
42
10252
2
1054
119
4861
57675
37177
17123
71
0
13023
5588
737
49635
18792
41087
18076
12640
1511
2266
669
4356
2018
2091
301444
0,2260
DSB
0
0
411
0
0
0
0
26633
25481
27430
16
0
0
689
56
539
2
106
343
398
1184
48
0
0
2
61
83401
0.0625
FS
14
6766
11969
1251
0
225
1048
18460
22863
6
771
5
4132
13678
1846
20732
73
4766
14839
53443
21214
137
3315
56
615
1849
204073
0,1530
HZ
0
0
0
0
0
0
127
16
0
2313
3
0
2513
70
13
186
1
0
0
128
6
0
121
0
0
95
5592
0.0042
JZ
0
0
0
0
0
0
0
2
0
13
0
0
92
11
0
14
0
0
0
35
0
0
3
0
0
0
170
0,0001
MAV
300
0
470
0
132
0
488
18252
40
3799
2288
88
81
1426
35
4770
67
2
64
133
205
1660
4803
1567
3
361
41034
0,0308
NS
14
0
10891
53
95
12
0
3663
673
15632
44
2
2791
2
0
2292
266
1820
66
29605
8692
675
645
157
2
10
78102
0,0586
Note: SmaH muncSng-off dfferencma (of lass than 0,5% of total trame) may occur Source; Intercontainer Intertrigo ICF
This table is split into two parts: table 5.7.a and b.
54

EU Intermodal Freight Transport Ξ £
eurostat
Table 5.7.b Traffic of ICF by origin and destination railway 7996
Unit: TEU
Railway of
origin
BDZ (BG)
BR (UK)
CFF (CH)
CFL (L)
CH (EL)
CP (P)
CD (CZ)
DB (D)
DSB (DK)
FS (I)
HZ
JZ (Serbia)
MAV (Η)
NS (NL)
NSB (Ν)
OBB (A)
PKP (PL)
RENFE (E)
SJ (S)
SNCB (Β)
SNCF (F)
SNCFR (RO)
SZ (SLO)
TCDO
VR (FIN)
ZSR (SK)
Country
BG
UK
CH
L
EL
Ρ
CZ
DB
DK
1
HR
Η
NL
Ν
A
PL
E
S
Β
F
RO
SLO
TR
FIN
SK
Total traffic received
%
Rai lway of des t ina t ion
NSB
0
0
90
0
0
0
13
1.979
64
2160
0
0
0
0
0
123
8
28
6.541
26
38
1
20
0
54
49
11.194
0,8%
OBB
200
605
1.750
0
52
0
1737
36.364
225
8 759
143
7
3.503
26.128
27
7
605
26
8
17.273
4.002
486
2.786
472
617
1.918
107.700
8,1%
PKP
0
0
20
0
29
0
819
18.475
0
319
8
0
417
7.055
16
702
0
64
48
4.097
557
0
8
0
0
3
32.637
24%
RENFE
0
35
405
0
0
3.999
47
39.615
25
5.058
0
0
0
1.878
0
21
28
65
249
7.790
1.513
0
0
0
2
0
60.730
4,6%
SJ
56
0
4
0
0
0
13
13.805
553
17.347
0
0
13
25
4.004
66
57
236
0
23.979
139
36
0
0
87
50
60.470
4,5%
SNCB
137
0
10.321
105
49
9
323
9.976
421
52.419
2
29
974
28.675
19
1.337
201
5.403
23.916
0
13.770
650
26
40
6
0
148.808
11,2%
SNCF
98
325
3.844
43
6
49
385
1.918
704
29.040
3
0
207
13.227
4
3.999
121
2.560
365
19.506
2.323
71
0
55
541
20
79.414
6.0%
SNCFR
13
1
3
0
12
0
63
1.656
0
176
0
0
2335
248
0
301
0
0
2
816
57
0
11
39
0
0
5.733
0.4%
SZ
0
0
2
0
0
0
280
283
0
2.251
98
1
8551
342
0
4375
6
0
0
51
4
18
1
0
0
171
16.444
1,2%
TCDD
3
126
36
33
3
0
10
5.083
0
169
0
0
51
170
0
597
0
0
1
429
226
12
SO
3
0
0
7.002
0.5%
VR
0
0
82
0
0
0
106
1.845
12
127
0
0
0
0
.72
680
0
16
108
2
744
0
0
0
0
0
3.784
0,3%
ZSR
2
0
0
0
2
0
143
632
0
125
0
0
192
9
0
2112
4
0
12
14
20
0
167
11
62
6
3.513
0,3%
Total traffic
consigned
1.559
8 948
52.436
2366
1.590
4417
10.811
270.471
91.379
202.169
3.461
132
41.375
112.327
6.878
96.553
21.025
62.758
66.317
179.289
59.606
6.186
12.676
6 936
5.043
6 969
1.333.677
100.0%
%
0.12%
0.67%
3,93%
0.18%
0,12%
0.33%
0.81%
20.28%
6,9%
15,2%
0,3%
0,0%
3.1%
8,4%
0,5%
7.2%
1,6%
4.7%
5,0%
13.4%
4,5%
0,5%
1,0%
0.5%
0.4%
0.5%
100%
Mofe: SmaH roundmg-off differences (of less than 0.5% of total traffic) may occur Source: kttervontamar /nferfrjgo /CF
The total traffic declared by ICF members of EU-15 and the Swiss railways reached 1.35 million TEUs in 1996. Total traffic increased by 3 % compared to 1994. Considering the railway of origin, D-Bahn, FS and SNCF performed almost 50% of the total ICF traffic (expressed in TEU). Apart from these three railways, the railway companies with annual traffic flows over 20,000 TEUs were in 1996: NS-ÖBB, NS-SNCB, DSB-D-Bahn, SNCF-FS (and FS-SNCF), SJ-SNCB (and SNCB-SJ), ÖBB-D-Bahn, ÖBB-FS, RENFE-D-Bahn, SNCF-FS.
55

eurostat EU Intermodal Freight Transport
Table 5.8 Share of combined transport technologies (UIRR members)
1992 - 1997 %
Year
1992
1993
1994
1995
1996
1997
Semi-trailer
18%
16%
14%
14%
12%
10%
Accompanied transport (RoMo)
17%
16%
17%
19%
20%
19%
Containers and swap bodies
65%
68%
69%
67%
68%
71% Source: UIRR
In 1997, the share of swap-bodies and containers reached 71% of all consignments carried by UIRR members. Conversely, the share of semi-trailers decreased from 18% in the year 1992 to 10% in 1997. The accompanied transport maintained its position, with two leading roads: Dresden-Lovosice and Brenner-Manching (one departure every two hours for each way).
56

EU Intermodal Freight Transport eurostat
Table 5.9 Top 20 container service maritime operators Year 7997
Carrier
Maersk Line
Evergreen Line / Uniglory Marine Corp,
P&O / Nedlloyd
Sea-Land Service
Cosco
Hanjin Shipping Co
Neptune Orient Lines / APL
Mediterranean Shipping Co
NYK Line / TSK
Mitsui-OSK Lines
Hyundai Merchant Marine
Zim Israël Navigation Co
Yang Ming Marine Transport Corp
CMA-CGM
OOCL
CP Ships
K-Line
Hapag-Lloyd Container line
Cho Yang Shipping
SCL
Total (these operators)
Total fleet (world)
% of top 20 (in total world)
Country
Denmark
Taiwan
United Kingdom /the Netherlands
USA
China
Korea
Singapore / USA
Switzerland - Italy
Japan
Japan
Korea
Israel
Taïwan
France
Hong Kong
Canada
USA
Germany
Korea
South Africa
TEU in service
232,257
228,248
221,531
215,114
201,593
174,526
165,582
154,185
128,154
115,763
112,958
98,086
96,145
89,658
85,940
85,016
84,198
73,372
55,882
51,002
2,669,210
5,265,745
50,70%
TEU in order*
76,686
91,287
53,458
n.a.
30,756
37,125
21,868
17,000
37,150
11,700
6,522
3,400
n.a.
15,850
9,320
5,300
19,450
13,848
9,000
n.a.
459,720
996,710
46%
' Capacity of the ships ordered Source: Containerisation Yearbook 1998 n.a. : not available
The five largest container service maritime operators had 1,1 Mio TEUs in service in 1997. The share of the five largest operators is 21% of the total world fleet and 25% of the TEUs in order. Among the 20 largest operators in the world are five from the EU member states. The largest one in the world is the Danish Maersk Line with 232 thousand TEUs in service. P&O/Nedloyds of the UK/NL is the 3rd largest with 221 thousand TEUs in service. Other European operators are the Mediterranean Shipping Co, CMA-CGM and Hapag-lloyd Container line.
57


EU Intermodal Freight Transport eurostat
Unitised transport by nodes and links
59

=7¿ eurostat EU Intermodal Freight Transport
Table 6.1 Port traffic of the major European sea ports (loaded and unloaded) 7992-1997
Unit: Mio tonnes
Ports
Rotterdam
Antwerpen
Marseille
Hamburg
Le Havre
Amsterdam
London
Genoa
Forth Ports
Tees & Hartlepool
Trieste
Wilhelmshaven
Algeciras
Milford Haven
Dunkerque
Southampton
Bremen/B'haven
Tarragona
Liverpool
Bilbao
Zeebrugge
Gothenburg
Lisbon
Saloniki
Dublin
København
Helsinki
Total
Country
NL
Β
F
D
F
NL
UK
I
UK
UK
I
D
E
UK
F
UK
D
E
UK
E
Β
s
Ρ
EL
IRL
DK
FIN
1992
293
104
90
65
53
49
42
41
-
-
-
-
-
-
40
-
30
-
-
-
33
-
-
-
-
-
-
-
1995
291
108
87
72
54
-
51
46
47
45
38
34
34
32
39
32
31
28
30
25
31
27
14
13
10
11
10
1272
1996
284
107
91
71
56
55
53
46
46
45
42
37
37
37
35
34
32
31
31
29
28
28
13
13
11
10
10
1288
1997
303
112
94
77
60
57
56
43
43
51
46
36
40
35
37
33
34
31
31
-
32
30
-
-
-
-
-
• -
Change
96/95
%
-2,4
-1.4
+4,7
-1.7
+3,4
-
+2,9
+0.3
-2.5
+0,2
+9.7
+9,3
+8,3
+ 14,1
-10.4
+6,9
+ 1.6
+8,1
+2,4
+ 14,3
-8,1
+3.7
-8.9
+ 1.5
+ 11,7
-4,6
+4,0
+ 1,3
Change
97/96
%
+6,7 ·
+5.0
+3,9
+7.9
+6,3
+3,2
+5.4
-7,4
-5,4
+ 14,8
+ 11,9
-2,2
+8,7
-5,5
+4,6
-3,3
+8,0
+0,0
+0.1
-
+ 13.7
+8,4
-
-
-
-
-
-: missing data Source: Institute of Shipping Economics and Logistics, Bremen, 1997.
60

EU Intermodal Freight Transport eurostat
Table 6.2 Container traffic (loaded and unloaded) in major European ports 7992 - 1997
Unit: 1000 Gross tonnes (loaded and unloaded)
Ports
ALGECIRAS
ANTWERP
BARCELONA
BILBAO
BREMEN
DUBLIN
GENOVA
GIOIA TAURO
HAMBURG
LE HAVRE
LISBOA
LONDON
MARSEILLE
PIRAEUS
ROTTERDAM
VALENCIA
ZEEBRUGGE
TOTAL
Country
E
Β
E
E
D
IRL
I
I
D
F
Ρ
UK
F
EL
NL
E
Β
1992
6.869
19.599
5.489
2.134
12.562
1.080
3.210
-
22.497
6.863
2.944
3.344
3.919
n.a.
44.283
3.582
3.790
142.165
1994
9.403
24.336
6.097
2.779
14.867
2.648
4.244
-
27.980
8.262
2.821
3.459
4.698
4.620
50.034
4.592
7.397
178.237
1997
15.830
33.427
9.072
3.406
17.431
3.846
10.708
13000*
34.264
11.210
3.431
4.022
6.308
-
58.282
9.324
7.636
228.197
' Estimated data Source: Direction des Ports et de la Navigation Maritime, ISL, 1998. n.a. : not available
- = missing data
The share of the three biggest ports, Rotterdam, Hamburg and Antwerp, is one third of the total container traffic in the major European ports in the year 1997. The traffic of these ports has grown steadily during the recent years. Also some Mediterranean container ports traffic has increased rapidly, among these are Barcelona, Genova, Algeciras and the new container port of Gioia Tauro (since 1997 the biggest container port of Italy).
The DPNM publishes annually the statistics of European ports, used as reference by the European Sea Port Organisation (ESPO).
61

Ξ 3 eurostat EU Intermodal Freight Transport
Table 6.3 Inland origins and destinations for the port of Rotterdam Grouping of products: "vehicles, machinery and other products"
1994 Unit: 1000 Gross tonnes
Country of Inland
GERMANY
FRANCE
ITALY
BELGIUM
LUXEMBOURG
DENMARK
GREECE
SPAIN
PORTUGAL
FINLAND
AUSTRIA
SWEDEN
TOTAL
O/D
Ο
D
0
D
Ο
D
Ο
D
Ο
D
0
D
Ο
D
Ο
D
O
D
Ο
D
O
D
Ο
D
Ο
D
Road
1.270
543
520
179
100
9
646
247
n.a.
0
2
9
0
2
15
10
21
4
30
1
48
11
15
4
2.667
1.019
Rail
16
24
3
5
198
37
4
89
n.a.
n.a.
0
1
0
0
2
13
0
0
n.a.
1
73
43
4
0
300
213
Inland waterways
394
237
45
45
6
n.a.
245
725
n.a.
n.a.
0
0
n.a.
n.a.
1
0
0
0
0
n.a.
28
1
1
0
720
1.008
Total transit
1.680
804
568
229
304
46
895
1.061
n.a.
n.a.
2
10
n.a.
2
18
23
21
4
30
2
149
55
20
4
3.687
2.240
Note: Same statistics are available for other grouping of products NST1 Source: Port of Rotterdam n.a. : not available
- - missing data
Ports are essential nodal points of intermodal transport. Information exists on the maritime segment of the chain of transport. However there are no statistical links between the maritime and the terrestrial information systems concerning the chain of transport.
The estimated modal split - internationally - of maritime containers in Rotterdam is 60% by road, 25% by inland shipping and 15% by rail. The port of Rotterdam estimates that they will handle six million boxes or more in 2005, twice the 1995 figure.
From the Rotterdam rail container terminals at least 150 international shuttle trains are despatched each week.
62

EU Intermodal Freight Transport eurostat
Table 6.4 Inland ports: fluvial and fluvio-maritime traffic* 1992 - 1997
Unit: Mio tons
PORTS
Duisburg
Liège
Paris
Strasbourg
NV Zeekanaal, Brabant
Karlsruhe
Ludwigshafen
Mannheim
Köln
Mannheim
Dortmund
Heilbronn
Bruxelles / Brussel
Ports Rhinans Alsace
Neuss
Frankfurt am Main
Mulhouse
Saarlouls / Dillingen
Düsseldorf
Krefeld
Kehl
Magdebourg
Berlin
Vaste ras
Hanau
Wien
Arnhem
Köping
Mertert
Linz
Mantova
Varkaus
Basel
COUNTRY
D
B
F
F
B
D
D
D
D
D
D
D
B
F
D
D
F
D
D
D
D
D
D
S
D
A
NL
s L
A
1
FIN
CH
1992
45.1
n.a.
n.a
n.a.
n.a.
11.1
8.3
7.5
6.9
4.6
5.8
n.a.
na.
4.5
4.0
n.a.
3,9
2,5
3.6
2.7
na.
2.8
n.a.
1.7
n.a.
n.a.
n.a.
na
n.a.
na
n.a.
n.a
1995
48.4
14,9
20.3
9.7
8.5
10.3
8.2
7,7
6.8
7.7
5.4
4.9
5.1
0.4
4.9
3,6
3.9
2,5
3,0
3.4
3.1
2.5
3.4
2.4
2.2
1.4
1.3
1.6
1.6
1.1
0.5
0.3
8.0
1996
44.4
15.8
18.5
9.3
8.6
10.3
7,7
7,9
7.6
7.9
4,8
5.2
4.8
4.5
4.7
3,8
4,0
3,6
3.0
3.3
2.9
2,2
2.4
2.7
2.7
1.7
1.7
1.5
1.4
1.2
0.7
0.4
7.2
1997
49.3
17.5
17.0
9.3
8.7
8.4
8.0
7.8
7.9
7.8
5.4
4.9
4.9
4.8
4.4
3.7
n.a
3,3
3.2
3.1
2.9
2.8
2.3
2.1
1.7
1.7
1.5
1.4
1.0
0.5
0.4
7.8
Change 96/95 %
-8.3
5.8
-8.9
-4.3
1.2
-0.2
-5.9
3.1
11.1
2.6
-11.0
6.5
-5.8
1025.0
-4.5
6,1
3.9
42.7
0.7
-5.1
-6.0
-12.0
-30.4
9.2
23.6
22.1
27.4
-6.6
-14.8
6.8
33.4
26.0
-10.8
Change 97/96 %
11.1
11.2
-8.1
-0.3
1.2
-18.6
3.7
-1.7
4.4
-1.2
12.6
-5.3
1.0
5.4
-8.5
-1.6
-9,0
7.6
-6,3
-0.8
28.7
-2.0
-21.4
-5.3
0.0
3.6
4,8
-11.3
-20.4
-7.7
9.5
* Freight haded and unloaded Source European Federation of Inland Porta (EFIP)
n a - not available
63

[m eurostat
EU Intermodal Freight Transport
Table 6.5.a Inland containers shipping Unit: TEU
Liaison
Rhine
Rotterdam-Antwerp
Lille-Antwep
Seine
Rhône
Danube
Elbe
North Germany
Year
1975
1980
1985
1990
1996
1996
1996
(1997)
(1997)
1996
1996
1996
TEU
10.000
80.000
200.000
430.000
650.000
400.000
14.200
6600
4700
19.300
3000
64.000
Source: DG VII / Containerisation yearbook
Nearly 2 million TEUs in 1996 were transported on inland waterways.
The hinterland traffic of the ports of Rotterdam (Rhine corridor) and Antwerp and the feeder traffic between these ports account for more than 90% of the total inland waterways fluvial traffic in the European Union. Container traffic on the Rhine increased annually by 20 % in the 1980s and by 7 % in the 1990s.
Table 6.5.b Journey times on the Rhine Year 1997
From/to
Emmerich
Duisburg
Düsseldorf
Koblenz
Mainz
Ginsheim
Frankfurt
Ludwigshafen
Mannheim
Worth
Strasbourg
Basel
ARA
10-12 h
12-14 h
20-22 h
23-28 h
40-50 h
55-65 h
ROTTERDAM
10h
26 h
26 h
28 h
30 h
30 h
34 h
38 h
ANTWERP
16h
32 h
32 h
34h
36 h
36 h
40 h
44h
ARA: Amsterdam, Rotterdam, Antwerp Source: IMPULSE Project (FP4)
For upriver way, double journey times are necessary.
64

EU Intermodal Freight Transport eurostat
Table 6.6 Freight traffic of major airports 1992- 1996
Unit: 1000 tons
Airport
Frankfurt Rhein/Main
London Heathrow
Amsterdam Schiphol
Paris Charles de Gaulle
Bruxelles
Köln/Bonn
Luxembourg
London Gatwick
Madrid Barajas
Roma Fiumicino
Parie Orly
London Stansted
East Midlands
Milano Malpensa
Athens Hellenikon
Stockholm Arlanda
Wien Schwächst
Oostende
Lisbon
Munich
Manchester
Barcelona
Helsinki
Dublin
Dusseldorf
Milano Linate
Total of these airports
Country
D
UK
NL
F
Β
D
L
UK
E
I
F
UK
UK
1
EL
S
A
Β
Ρ
D
UK
E
FIN
IRL
D
I
1992
1.081
758
695
612
314
181
151
190
188
233
275
54
11
90
91
n.a.
68
43
79
54
81
72
52
51
n.a.
63
S 487
1994
1 246
967
838
787
380
236
242
224
213
256
295
88
56
111
95
93
83
60
81
64
56
59
74
54
n.a.
67
6 725
1995
1 297
1 043
978
824
427
276
286
232
230
257
276
93
83
126
98
104
93
82
89
65
51
68
78
60
56
68
7 340
1996
1 338
1 053
1 083
866
451
316
281
277
243
259
246
107
105
98
111
113
95
92
90
76
81
80
84
67
57
66
7 733
1997
1 373
1 170
1 161
951
518
374
339
270
266
243
223
131
127
123
120
114
107
106
100
96
95
81
85
85
69
61
8 388
Change 1996/1992
%
23.8
38.9
55.8
41,5
43,5
74.4
85.8
45,9
29,0
11,3
-10,4
98,5
851,8
8,9
22.0
n.a.
39,1
113,5
13,9
40,6
-0,1
11,3
60,6
32,0
n.a.
4,8
37,8
Source.' A Cl
n.a. : not available
The share of the four main airport-platforms, Frankfurt, Schiphol, Heathrow and Charles de Gaulle, of the total freight transport in 1996 was 35%. The freight transport of the UK airports of Gatwick and Manchester increased clearly from the year 1995 to the year 1996.
As a whole, the freight traffic of the major freight airports increased by 14% between the years 1994 and 1996 and by 37% from the year 1992 (excluding Arlanda and Dusseldorf).
65


Ξ £ EU Intermodal Freight Transport eurostat
Freight traffic through the Alps
67

sa eurostat EU Intermodal Freight Transport
Table 7.1 Traff ic th rough the Mont-Cenis / Brenner segment by cross ing point and by t ranspor t mode
7994 Unit: 1000 tonnes (except specifically indicated)
Country
France
Switzerland
Austria
Tunnel
Mont-Cenis
Mont-Blanc
Grand St Bernard
Simplón
St Gotthard
S. Bernardino
Reschen
Brenner
Total
%
Accompanied transport
----
1,000
--
2,000
3,000
3,4
Combined transport
3,000
--
800
5,500
--
2,700
12,000
14,1
Rail
4,600
--
3,900
6,700
600
-3,600
19,400
22,9
Road
12,200
14,400
400
-5,100
-800
17,600
50,500
59,6
Total Million tonnes 19,800
14,400
400
4,700
18,300
600
800
25,900
84,900
100
%
23,3
16,7
0,5
5,5
21,6
0,7
0,9
30,5
100
-Source: Département fédéral des transports, des communications et de l'énergie (DFTCE). Service d'étude des transports - Berne.
The figures are rounded up to the nearest hundred.
Table 7.2 Traffic between Germany/Benelux and Italy (Mont-Cenis / Brenner segment) 1994
Unit: Mio tonnes (except specifically indicated)
Transit country
France
Switzerland
Austria - Brenner - Brenner, Reschen
Total Million tons
%
Rail
1,900(1)
11,500(3)
6,300 (4)
19,700
43,9
Road
8,100 (2)
2,300 (3)
14,800 (5)
25,200
56,1
Total
Million tonnes
10,000
13,800
21,100
44,900
100
%
22,3
30,7
47
100
Source: Département fédéral des transports, des communications et de l'énergie (DFTCE). Service d'étude des transports - Berne.
(1): Mont-Cenis, St. Gotthard (2): Mont-Cenis / Fréjus, Mont-Blanc (3): Simplón, St. Gotthard, etc ... (4): Brenner (5): Brenner, Reschen
In 1994, the traffic from Benelux and Germany to Italy through the Mont-Cenis - Brenner segment of the Alps accounted for 82% of the total transit traffic through this segment.
68

=7Δ EU Intermodal Freight Transport eurostat
KEY CONTACTS
69

eurostat EU Intermodal Freight Transport
EUROPEAN COMMISSION Directorate-General VII - Transport Avenue de Beaulieu 31, B-1160 BRUXELLES, BELGIUM http://europa.eu.int/en/comm/dg07/tif/index.htm
EUROSTAT BECH Building, 5 rue Alphonse Weicker,
L-2721 LUXEMBOURG
Contact points : Eurostat data shops http://europa.eu.int/eurostat.html
Transport Annual Statistics
Air Transport
Maritime Transport
Carriage of Goods: Railways Carriage of Goods: Road Carriage of Goods: Inland Waterways
UNITED NATIONS UN-ECE
Palais des Nations, CH-1200 GENEVE, SWITZERLAND Tel: 41 22 917 2453 Fax: 41 22 917 0039 http://www.un.org
Annual Bulletin of Transport Statistics for Europe Statistics of Road Accidents in Europe
EUROPEAN CONFERENCE OF MINISTERS OF TRANSPORT (ECMT)
2, rue André Pascal, F-75775 PARIS Cedex 16, FRANCE Tel: 33 1 45 24 97 22
Fax: 33 1 45 24 97 42
http://www.oecd.org
Statistical Trends in Transport Trends in the Transport Sector
EUROPEAN FEDERATION OF INLAND PORTS (EFIP)
6, place des Armateurs, B-1000 BRUXELLES, BELGIUM Tel: 32 2 420 7037 Fax:32 2 420 6974
http://www.isl.org - [email protected]
Shipping Statistics Yearbook
INSTITUTE FOR SHIPPING ECONOMICS AND
LOGISTICS (ISL)
Universitätsallee G-W 1 Block A, D-28359 BREMEN, GERMANY Tel: 49 421 22096.0 Fax: 49 421 220 96 55
http://www.isl.org
Shipping statistics yearbook
INTERNATIONAL ROAD FEDERATION (IRF)
63, rue Lausanne, CH-1200 GENEVE, SWITZERLAND
Tel: 41 22 731 7150
Fax: 41 22 731 7158
http://www.is.eunet.ch/irf
World Road Statistics
INTERNATIONAL UNION OF RAILWAYS (UIC)
16, rue Jean Rey, F 75015 PARIS, FRANCE
Tel: 33 1 44 49 22 81 Fax: 33 1 44 49 20 39 http://www.uic.asso.fr
International Railway Statistics
UNION INTERNATIONALE DES SOCIETES DE
TRANSPORT COMBINE RAIL-ROUTE (UIRR)
Avenue du Port, 100, bte 3, B-1210 BRUXELLES,
BELGIUM
Tel: 32 2 425 4793
Fax: 32 2 425 3827
http://www.uirr.com
UIRR Report
INTERCONTAINER - INTERFRIGO
Margarethenstrasse 38, CH - 4008 BASEL,
SWITZERLAND Tel: 41 61 278 25 25
Fax: 41 61 278 24 45 http://www.icfonline.ch
ICF Report
EUROPEAN SEAPORT ORGANISATION (ESPO)
68 Avenue Michel Ange, B-1040 BRUXELLES, BELGIUM
Tel: 32 2 736 34 63
Fax: 32 2 736 63 25
FREIGHT FORWARD EUROPE (FFE) 204 Avenue Marcel Thery - Β -1200 BRUXELLES,
BELGIUM
Tel: 32 2 774 9639 Fax: 32 2 774 96 90
COMITE DE LIAISON EUROPEEN DES
COMMISSIONNAIRES ET AUXILIAIRES DE
TRANSPORT (CLECAT)
Rue de l'entrepôt 11, B4, Β -1020, BRUXELLES,
BELGIUM
Tel: 32 2 420 59 76
Fax: 32 2 420 59 79
ΝΕΑ TRANSPORT RESEARCH AND TRAINING
Polakweg 13, P.O. Box 1969 - 2280 DZ - RIJSWIJK - THE
NETHERLANDS
Tel: 31 70 39 88 388 Fax: 31 70 39 54 186
http://www.nea.nl
MDS TRANSMODAL
5-6 Hunters Walk, Canal Street, CH1 4EB CHESTER,
UNITED KINGDOM,
Tel: 244 348 301
Fax: 244 348 471
70

EU Intermodal freight transport eurostat
APPENDIX
71

>urostat EU Intermodal freight transport
Abbreviations (countries)
Β DK D D-W D-Ε EL E F IRL I L NL A Ρ FIN S UK
IS NO CH
AM BG HR CA CY CS CZ EE HU LT LV MT MD PL RU RO SI SK US TR
Belgium Denmark Germany Germany-West Germany-East Greece Spain France Ireland Italy Luxembourg the Netherlands Austria Portugal Finland Sweden United Kingdom
Iceland Norway Switzerland
Armenia Bulgaria Croatia Canada Cyprus Czechoslovakia Czech Republic Estonia Hungary Lithuania Latvia Malta Moldova, Republic of Poland Russian Federation Romania Slovenia Slovak Republic United States Turkey
72

EU Intermodal freight transport eurostat
ACRONYMS OF ORGANISATIONS
DG VII
ECMT
ESPO
EU
ICF
UIC
UIRR
UNO
Directorate General Transport
European Conference of Ministers of Transport
European Sea Ports Organisation
European Union
Intercontainer - Interfrigo
International Union of Railways (Union Internationale des Chemins de fer).
International Union of Combined Road-Rail Transport Companies (Union Internationale du Transport Combiné Rail-Route).
United Nations Organisation
ABBREVIATIONS OF VARIABLES
EDI
ETIS
FCL
FP4
GDP
ITU
tkm
IMEG
NST/R
NUTS
O/D
RoMo
TEN
TEU
Electronic Data Interchange (transfer of structured data from one computer system to another)
European Transport Policy Information System
Full container load (arrangement whereby a shipper utilises the whole space in a container)
Fourth Framework Programme
Gross Domestic Product
Intermodal Transport Unit
Tonne-Kilometre
Intermodal Transport Statistics Expert Group
Standard Goods Nomenclature for Transport Statistics
Nomenclature of territorial units for statistics (NUTS 2 = 206 Regions in Europe)
Origin and destination
Rolling Motorway Train
Trans-European Transport Network
Twenty feet Equivalent Unit. Standard unit of measure for containers. Equivalent to a 20 feet container, that is to say 20x8x8 feet or 33.3m3. A 40ft container is equivalent to 2 TEU.
73

eurostat EU Intermodal freight transport
GLOSSARY
Accompanied transport Transport of a complete goods road motor vehicle, accompanied by the driver, by another mode of transport (for example by ferry or train).
Bill of lading (maritime), consignment note (road and rail)
Bulk
Combined transport
Consignment
Acts as a receipt for goods. Contains the terms of the contract of carriage.
Good shipped loose (not in container or other packaging).
According to the rules of application of the ECE/FAL Recommendation No.19 "Code for Modes of Transport" the definition is : « Combination of means of transport where one (passive) transport means is carried by another (active) means which provides traction and consumes energy ».
The ECMT restricts the temn combined transport to: "Intermodal transport where the major part of the European journey is by rail, inland waterway or sea and any initial and/or final leg carried out by road are as short as possible".
Collection of goods transported under cover of the same transport document in accordance with regulations or tariffs in force where they exist.
Consignee
Container
Corridor
The person or the company which is the final destination of a consignment.
Special box to carry freight, strengthened and stackable and allowing horizontal or vertical transfers. Large container : 20', 40' or more.
Sequence of strongly interconnected regions. Determined by geography, economy or transport. Transport corridors are chosen on the basis of providing the best route from origin to destination in terms of costs, quality and strategies.
Forwarder
Freight
Gantry crane
General cargo
Gross weight
Handling
High cube container
Hub
Incoterms
Agent who organises the transport from origin to destination on behalf of the shipper.
The amount payable for the carriage of goods. Also used to describe the goods themselves.
Overhead crane comprising a horizontal gantry mounted on legs which are either fixed, run in fixed tracks or on rubber tyres with relatively limited manoeuvre in one plane.
Goods shipped in packaging, except containers.
Total weight of the goods, including all packaging, and tare-weight of the container, swap-body and pallets containing goods as well as road goods vehicles carried by rail.
Loading / unloading of goods or containers.
Container of standard ISO length and width but with extra height - 9'6" (2.9m) instead of 8' (2.44M). This applies only for the time being to 40' containers.
Central point for the collection, sorting and distribution for a particular region or area.
International rules for the interpretation of trade terms : list of standard terms for foreign trade contracts.
74

EU Intermodal freight transport eurostat
Intermodal transport
Intermodal unit (ITU)
Land container
Loading unit
Manifest
Maritime container
Maritime terminal
Modal data
Mode (of transport)
Multimodal transport
Nodal point, node
Piggyback transport
Rolling road
Stuffing/Stripping
Shipment
Shipper
Straddle- carrier
Super high cube container
Swap body
Tare
Tariff
Movement of goods (in one and the same loading unit or a vehicle) by successive modes of transport without handling of the goods themselves when changing modes (Glossary for Transport Statistics).
Intermodality is a characteristic of a transport system, that allows different modes to be used in an integrated manner in a door to door transport chain (European Commission, COM(97) 243 final dated 29th of May 1997).
Container, swap body or semi-trailer/goods road motor vehicle suitable for intermodal transport.
Standardized container according to the International Railways Unions norms (UIC), for an optimal use mainly in rail road combined transport.
Special box to carry freight in pallets or prepacked units (container, swap body, land container).
List of goods (or passengers) on a vessel.
A container conforming to standards that enable it to be used in a cellular ship. Most maritime containers conform to International Standards Organisation (ISO).
Port at which containers are loaded/unloaded onto/from container vessels.
Data related to one mode only. Traditional transport data are modal data.
The different modes of transport are road, rail, air, maritime, inland waterway. Combined transport is usually treated like an additional mode of transport.
Carriage by more than one mode of transport against one contract of carriage.
European Conference of Ministers of Transport (ECMT) defines multimodal transport as the "caniage of goods by at least two different modes of transport". Intenmodal transport is therefore a particular type of multimodal transport.
United Nations Convention on International Multimodal Transport of Goods defines international multimodal transport as "the caniage of goods by at least two different modes of transport on the basis of a multimodal transport contract from a place in one country at which the goods are taken in charge by the multimodal transport operator to a place designated for delivery in a different country".
Point of transhipment of goods (from one mode to another or on the same mode).
Combined transport by rail and road.
Transport of complete road vehicles on low-floor throughout wagons.
Loading and unloading of cargo into or from an ITU.
Set of goods sent using the same consignment note.
The person or the company tendering goods for carriage.
Fully mobile overhead lifting vehicle for moving containers.
Container of extra standard ISO length, width and height. These dimensions may fluctuate, reaching lengths of 45' (13.72m), 48' (14.64m) or 53' (16.10m).
Carrying unit strong enough for repeated use, but not enough to be top-lifted or stackable when loaded, designed for intenmodal transport of which one leg is road.
Weight of ITU of vehicle without cargo.
Terms, conditions and scale of charges.
75

eurostat EU Intermodal freight transport
Terminal
(inland or maritime)
Place at which containers are loaded/unloaded onto/from one mode of transport. Terminals can be stations or depots (rail transport), ports, combined transport platforms or logistic centres.
TEU
Tonne-kilometre
Transit
Transport chain
Twenty feet equivalent unit. Standard unit for counting containers of various capacities and for describing the capacities of container ships or terminals. One 20 Foot ISO container equals 1 TEU (one 40 foot ISO container equals two TEU).
Unit of measure of goods transport which represents the transport of one tonne over one kilometre.
Transport in the same vehicle through a country between two places (a place of loading and a place of unloading) both located in another country or in other countries.
Sequence of transport modes used to carry a certain good from its origin to its destination. Along the chain, one or several transhipments take place.
Unaccompanied transport Transport of goods road motor vehicles or trailers, not accompanied by the driver, by another mode of transport (for example by sea or rail).
Unitised transport Transport by loading unit (container, swap body) or trailer.
Sources: Glossary of the Common questionnaire Eurostat / UNO / ECMT, P&O Merchant guide Atlas of freight transport in Europe (ΝΕΑ).
76

European Commission
Intermodal freight transport — key statistical data — 1992-1997
Luxembourg: Office for Official Publications of the European Communities, 1999
1999 —76 p. —21 χ 29.7 cm
Theme 7: Transport
Collection: Studies and research
ISBN 92-828-7307-2
Price (excluding VAT) in Luxembourg: EUR 11.50


Venta · Salg · Verkauf · Πωλήσεις · Sales · Vente · Vendita · Verkoop · Venda · Myynti · Försäljning
BELGIQUE/BELGIE
Jean De Lannoy
Avenue du Roi 202/Koningslaan 202 B-1190 Bruxelles/Brussel Tél. (32-2) 538 43 08 Fax (32-2) 538 08 41 E-mail: [email protected] URL: http://www.jean-de-lannoy.be
La librairie européenne/ De Europese Boekhandel
Rue de la Loi 244/Wetstraat 244 B-1040 Bruxelles/Brussel Tél. (32-2) 295 26 39 Fax (32-2) 735 08 60 E-mail: mail θ libeurop.be URL: http://www.libeurop.be
Moniteur beige/Belgisch Staatsblad Rue de Louvain 40-42/Leuvenseweg 40-42 B-1000 Bruxelles/Brussel Tél. (32-2) 552 22 11 Fax (32-2) 511 01 84
DANMARK
J. H. Schultz Information A/S Herstedvang 10-12 DK-2620 Albertslund Tlf. (45) 43 63 23 00 Fax (45) 43 63 19 69 E-mail: [email protected] URL: http://www.schultz.dk
DEUTSCHLAND
Bundesanzeiger Verlag GmbH
Vertriebsabteilung Amsterdamer Straße 192 D-50735 Köln Tel. (49-221)97 66 80 Fax (49-221) 97 66 82 78 E-Mail: [email protected] URL: http://www.bundesanzeiger.de
ΕΛΛΑΔΑ/GREECE
G. C. Eleftheroudakis SA
International Bookstore Panepistimiou 17 GR-10564 Athina Tel. (30-1)331 41 80/1/2/3/4/5 Fax (30-1) 323 98 21 E-mail: [email protected]
ESPANA
Boletín Oficial del Estado
Trafalgar, 27 E-2B071 Madrid Tel. (34)915 38 21 11 (Libras),
913 84 17 15(Suscrip.) Fax (34) 915 38 21 21 (Libras),
913 84 17 14(Suscrip.) E-mail: [email protected] URL: http://www.boe.es
Mundi Prensa Libros, SA
Castellò, 37 E-28001 Madrid Tel. (34)914 36 37 00 Fax (34) 915 75 39 98 E-mail: [email protected] URL: http://www.mundiprensa.com
FRANCE
Journal officiel
Service des publications des CE 26, rue Desaix F-75727 Paris Cedex 15 Tél. (33) 140 58 77 31 Fax (33) 140 58 77 00 URL: http://www.joumal-officiel.gouv.fr
IRELAND
Government Supplies Agency
Publications Section 4-5 Harcourt Road Dublin 2 Tel. (353-1)661 31 11 Fax (353-1) 475 27 60
ITALIA
Licosa SpA
Via Duca di Calabria, 1/1 Casella postale 552 1-50125 Firenze Tel. (39) 055 64 83 1 Fax (39) 055 64 12 57 E-mail: [email protected] URL: http://www.ftbcc.lt/licosa
LUXEMBOURG
Messageries du livre SARL
5, rue Raifleisen L-2411 Luxembourg Tél. (352)40 10 20 Fax (352) 49 06 61 E-mail: [email protected] URL: http://www.mdl.lu
NEDERLAND
SDU Servicecentrum Uitgevers Christollel Plantijnstraal 2 Postbus 20014 2500 EA Den Haag Tel. (31-70)378 98 80 Fax (31-70) 378 97 83 E-mail: [email protected] URL: http://www.sdu.nl
ÖSTERREICH
Manz'sche Verlags- und Universitätsbuchhandlung GmbH Kohlmarkt 16 A-1014Wien Tel. (43-1)53 16 11 00 Fax (43-1) 53 16 11 67 E-Mail: bestellen©manz.co.at URL: http://www.manz.at/index.htm
PORTUGAL
Distribuidora de Livras Bertrand Ld.'
Grupo Bertrand, SA Rua das Terras dos Vales, 4-A Apartado 60037 P-2700 Amadora Tel. (351-1)495 90 50 Fax (351-1) 496 02 55
Imprensa Nacional-Casa da Moeda, EP
Rua Marquês Sá da Bandeira, 16-A P-1050 Lisboa Codex Tel. (351-1)353 03 99 Fax (351-1) 353 02 94 E-mail: [email protected] URL: http://www.incm.pt
SUOMI/FINLAND
Akateeminen Kirjakauppa/ Akademiska Bokhandeln
Keskuskatu 1/Centralgatan 1 PL/PB 128 FIN-00101 Helsinki/Helsingfors P./tfn (358-9) 121 44 18 F ./fax (358-9) 121 44 35 Sähköposti: akatilaus @ akateeminen.com URL: http://www.akateeminen.com
SVERIGE
BTJAB
Traktorvägen 11 S-221 82 Lund Tfn (46-46) 18 00 00 Fax (46-46) 30 79 47 E-post: [email protected] URL: http://www.btj.se
UNITED KINGDOM
The Stationery Office Ltd
International Sales Agency 51 Nine Elms Lane London SW8 5DR Tel. (44-171)873 90 90 Fax (44-171) 873 84 63 E-mail: ¡[email protected] URL: http://www.the-stationery-office.co.uk
ISLAND
Bokabud Larusar Blöndal
Skólavördustig, 2 IS-101 Reykjavik Tel. (354) 551 56 50 Fax(354) 552 55 60
NORGE
Swets Norge AS Østenjoveien 18 Boks 6512 Etterstad N-0606 Oslo Tel. (47-22) 97 45 00 Fax (47-22) 97 45 45
SCHWEIZ/SUISSE/SVIZZERA
Euro Info Center Schweiz
c/o OS EC Stampfenbachstraße 85 PF 492 CH-8035 Zürich Tel. (41-1)365 53 15 Fax (41-1) 365 54 11 E-mail: [email protected] URL: http://www.osec.ch/eics
BS>LGARIJA
Europress Euromedia Ltd
59, blvd Vitosha BG-1000 Sotia Tel. (359-2) 980 37 66 Fax (359-2) 980 42 30 E-mail: [email protected]
I ESKAREPUBLIKA
USIS NIS-prodejna Havelkova 22 CZ-130 00Praha3 Tel. (420-2)24 23 14 86 Fax (420-2) 24 23 11 14 E-mail: [email protected] URL: http://usiscr.cz
CYPRUS
Cyprus Chamber of Commerce and Industry
PO Box 1455 CY-1509 Nicosia Tel. (357-2) 66 95 00 Fax (357-2) 66 10 44 E-mail: [email protected]
EESTI
Eesti Kaubandus-Tööstuskoda (Estonian Chamber of Commerce and Industry) Toom-Kooli 17 EE-0001 Tallinn Tel. (372) 646 02 44 Fax(372) 646 02 45 E-mail: [email protected] URL: http://www.koda.ee
HRVATSKA
Mediatrade Ltd
Pavia Hatza 1 HR-10000 Zagreb Tel. (385-1)481 94 11 Fax (385-1) 481 94 11
MAGYARORSZAG
MALTA
Miller Distributors Ltd Malta International Airport PO Box 25 Luqa LQA 05 Tel. (356) 66 44 88 Fax (356) 67 67 99 E-mail: [email protected]
POLSKA
ROMANIA
Euromedia
Str. G-ral Berthelot Nr 41 RO-70749 Bucuresti Tel. (40-1)315 44 03 Fax (40-1) 314 22 86
ROSSIYA
CCEC
60-letiya Oktyabrya Av. 9 117312 Moscow Tel. (7-095) 135 52 27 Fax (7-095) 135 52 27
SLOVAKIA
SLOVENIJA
Gospodarskl Vestnik
Dunajska cesta 5 SLO-1000 Ljubljana Tel.(386)613 09 16 40 Fax (386) 613 09 16 45 E-mail: [email protected] URL: http://www.gvestnik.si
TURKIYE
AUSTRALIA
CANADA
ISRAEL
Euro Info Service
Europa Haz Margitsziget PO Box 475 H-1396 Budapest 62 Tel. (36-1)350 80 25 Fax (36-1) 350 90 32 E-mail: [email protected] URL: http://www.euroinfo.hu/index.htm
ROY International
41, Mishmar Hayarden Street PO Box 13056 61130 Tel Aviv Tel. (972-3) 649 94 69 Fax (972-3) 648 60 39 E-mail: [email protected] URL: http://www.royint.co.il
Sub-agent for the Palestinian Authority:
Index information Services
PO Box 19502 Jerusalem Tel. (972-2)627 16 34 Fax (972-2) 627 12 19
Ars Polona
Krakowskie Pr2edmiescie 7 Skr. pocztowa 1001 PL-00-950 Warszawa Tel. (48-22)826 12 01 Fax (48-22) 826 62 40 E-mail: [email protected]
PSI-Japan
Asahi Sanbancho Plaza #206 7-1 Sanbancho, Chiyoda-ku Tokyo 102 Tel. (81-3)32 34 69 21 Fax (81-3) 32 34 69 15 E-mail: [email protected] URL: http://www.psi-japan.com
MALAYSIA
EBIC Malaysia
Level 7, Wisma Hong Leong 18 Jalan Perak 50450 Kuala Lumpur Tel. (60-3) 262 62 98 Fax (60-3) 262 61 98 E-mail: [email protected]
MEXICO
Centrum VTI SR
Nam. Slobody, 19 SK-81223 Bratislava Tel. (421-7)54 41 83 64 Fax (421-7) 54 41 83 64 E-mail: [email protected] URL: http://www.sltk.stuba.sk
Dunya Infotel AS
100, Yil Mahallessl 34440 TR-80050 Bagcilar-lstanbul Tel. (90-212)629 46 89 Fax (90-212) 629 46 27 E-mail: [email protected]
Hunter Publications
PO Box 404 3067 Abbotsford, Victoria Tel. (61-3)94 17 53 61 Fax (61-3) 94 19 71 54 E-mail: [email protected]
Les éditions La Liberté Inc.
3020, chemin Sainte-Foy G1X 3V Sainte-Foy, Québec Tel. (1-418)658 37 63 Fax (1-800) 567 54 49 E-mail: liberte ©mediom.qc.ca
Renouf Publishing Co. Ltd
5369 Chemin Canotek Road Unit 1 KU 9J3 Ottawa, Ontario Tel. (1-613)745 26 65 Fax (1-613) 745 76 60 E-mail: order.dept @ renoufbooks.com URL: http://www.renoufbooks.com
EGYPT
The Middle East Observer
41 Sherif Street Cairo Tel. (20-2) 392 69 19 Fax (20-2) 393 97 32 E-mail: [email protected] URL: http://www.meobserver.com.eg
INDIA
EBIC India
3rd Floor, Υ. B. Chavan Centre Gen. J. Bhosale Marg. 400 021 Mumbai Tel. (91-22)282 60 64 Fax (91-22) 285 45 64 E-mail: ebic@giasbm01 .vsnl.net.in URL: http://www.ebicindia.com
Mundi Prensa Mexico, SA de CV
Rio Panuco No 141 Colonia Cuauhtemoc MX-06500 Mexico, OF Tel. (52-5) 533 56 58 Fax (52-5) 514 67 99 E-mail: 101545.2361 @ compuserve.com
PHILIPPINES
EBIC Philippines
19th Floor, PS Bank Tower Sen. Gil J. Puyat Ave. cor. Tindalo St. Makati City Metro Manilla Tel. (63-2) 759 66 80 Fax (63-2) 759 66 90 E-mail: eccpcom®globe.com.ph URL: http://www.eccp.com
EBIC Sri Lanka
Trans Asia Hotel 115 Sirchittampalam A. Gardiner Mawatha Colombo 2 Tel. (94-1)074 71 50 78 Fax (94-1) 44 87 79 E-mail: [email protected]
EBIC Thailand
29 Vanissa Building, 8th Floor Soi Chidlom Ploenchit 10330 Bangkok Tel. (66-2) 655 06 27 Fax (66-2) 655 06 28 E-mail: [email protected] URL: http:/www.ebicbkk.org
UNITED STATES OF AMERICA
Beman Associates
4611 -F Assembly Drive Lanham MD20706 Tel. (1-800) 274 44 47 (toll free telephone) Fax (1-800) 865 34 50 (toll free fax) E-mail: [email protected] URL: http://www.beman.com
ANDERE LANDER/OTHER COUNTRIES/ AUTRES PAYS
Bitte wenden Sie sich an ein Büro Ihrer Wahl/ Please contact the sales office of your choice/ Veuillez vous adresser au bureau de vente de votre choix
Office for Official Publications of the European Communities
2, rue Mercier L-2985 Luxembourg Tel. (352) 29 29-42455 Fax (352) 29 29-42758 E-mail: [email protected] URL: http://eur-op.eu.int

o > I
ro ω co CD
co σ>
m Ζ I
o
Price (excluding VAT) in Luxembourg: EUR 11.50
• * • •k EUR *
• O D *
* • *
OFFICE FOR OFFICIAL PUBLICATIONS OF THE EUROPEAN COMMUNITIES
L-2985 Luxembourg
ISBN ^B-ñ2a-73Q?-E
9 '789282"873076 >