interim report 2016 - first pacific · achieve profitability ongoing ... interim report 2016 5...
TRANSCRIPT

Interim Report 2016
Corporate Profile
First Pacific Company Limited
First Pacific is a Hong Kong-based investment management and holding company with operations located in Asia-Pacific. Our principal business interests relate to telecommunications, consumer food products, infrastructure and natural resources.
Within these sectors, our mission is to unlock value in our investee companies by:■ Delivering dividend returns to shareholders;■ Delivering share price/value appreciation of First Pacific
and the investee companies; and■ Making further investment in our businesses.
Our investment criteria are clear:■ Investments must be related to our areas of expertise
and experience (telecommunications, consumer food products, infrastructure and natural resources);
■ Investee companies must have a strong or dominant market position in their sectors;
■ They must possess the potential for significant cash flows; and
■ We must obtain management control or significant influence to ensure our goals can be met.
Our strategies are threefold:■ Identify undervalued or underperforming assets with
strong growth potential and possible synergies;■ Manage investments by setting strategic direction,
developing business plans and defining targets; and■ Raise standards to world-class levels at the investee
companies.
First Pacific portfolio has a balance of more mature assets in PLDT Inc. (“PLDT”) and PT Indofood Sukses Makmur Tbk (“Indofood”) which deliver steady dividend flows allowing investment for growth in Metro Pacific Investments Corporation (“MPIC”), Goodman Fielder Pty Limited (“Goodman Fielder”), Philex Mining Corporation (“Philex”), PacificLight Power Pte. Ltd. (“PLP”) and Roxas Holdings,
Inc. (“RHI”). PLDT is the dominant telecommunications provider in the Philippines and Indofood is the largest vertically integrated food company in Indonesia. MPIC is the Philippines’ largest infrastructure investment management and holding company with investments in the Philippines’ largest electricity distributor, toll road operator, water distributor, hospital group and rail, as well as the largest electricity generator in the Visayas region of the Philippines. Goodman Fielder is a leading food company in Australasia. Philex is one of the largest metal mining companies in the Philippines, producing gold, copper and silver. PLP is the operator of one of Singapore’s most efficient gas-fired power plants and RHI runs an integrated sugar and ethanol businesses in the Philippines.
Listed in Hong Kong, First Pacific’s shares are also available for trading in the United States through American Depositary Receipts.
As at 19 August 2016, First Pacific’s economic interest in PLDT is 25.6%, in Indofood 50.1%, in MPIC 41.9%, in FPW Singapore Holdings Pte. Ltd. (“FPW”) 50.0%, in Philex 31.2%(1), in FPM Power Holdings Limited (“FPM Power”) 67.8%(2) and in FP Natural Resources Limited (“FP Natural Resources”) 79.4%(3).
(1) Two Rivers Pacific Holdings Corporation (“Two Rivers”), a Philippine
affiliate of First Pacific, holds additional 15.0% and 7.7% economic
interests in Philex and PXP Energy Corporation (“PXP”), respectively.
(2) Includes a 7.8% effective economic interest in FPM Power held by
First Pacific through its indirect interests in Manila Electric Company
(“Meralco”).
(3) Includes a 9.4% effective economic interest in FP Natural Resources held
by First Pacific through its indirect interests in Indofood Agri Resources
Ltd. (“IndoAgri”). FP Natural Resources holds 26.8% in RHI, and its
Philippine affiliate First Agri Holdings Corporation (“FAHC”) holds an
additional 32.9% economic interest in RHI and a 100.0% economic
interest in First Coconut Manufacturing Inc. (“FCMI”).
First Pacific’s principal investments are summarized on pages 89 to 91.
Contents
Interim Report 2016 1
Inside front Corporate Profile
2 Half-Year Financial Highlights
3 2016 Goals: Half-Year Review
11 Review of Operations
37 Financial Review
45 Condensed Interim Consolidated Financial Statements
51 Notes to the Condensed Interim Consolidated Financial Statements
81 Review Statement of the Audit and Risk Management Committee
82 Corporate Governance Report
84 Interests of Directors and Substantial Shareholders
87 Purchase, Sale or Redemption of Listed Securities
88 Information for Investors
89 Summary of Principal Investments
92 Corporate Structure
2 First Pacific Company Limited
Half-Year Financial Highlights
Contribution from Operations
US$ millions
12 13 14 15 16
0
50
100
150
250
200
300
Recurring Profit
US$ millions
12 13 14 15 16
0
50
100
150
200
250
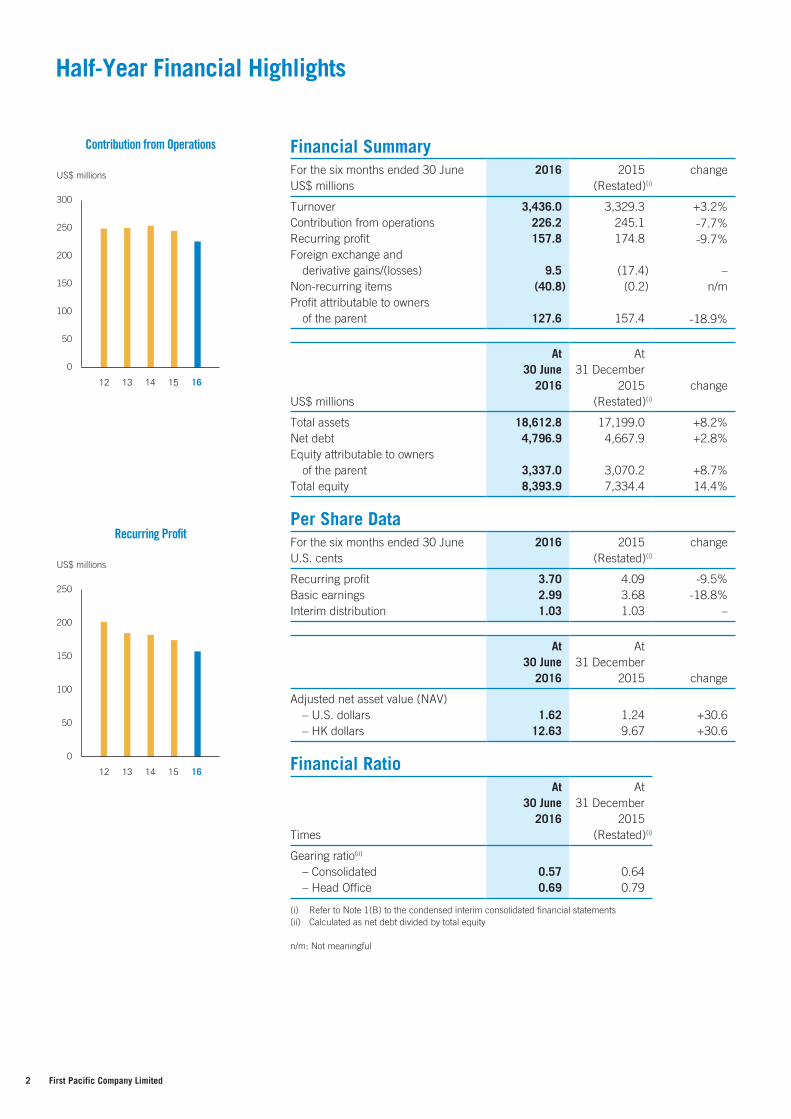
Financial Summary For the six months ended 30 June 2016 2015 changeUS$ millions (Restated)(i) Turnover 3,436.0 3,329.3 +3.2%Contribution from operations 226.2 245.1 -7.7%Recurring profit 157.8 174.8 -9.7%Foreign exchange and
derivative gains/(losses) 9.5 (17.4) –Non-recurring items (40.8) (0.2) n/mProfit attributable to owners
of the parent 127.6 157.4 -18.9%
At 30 June
2016
At 31 December
2015 changeUS$ millions (Restated)(i) Total assets 18,612.8 17,199.0 +8.2%Net debt 4,796.9 4,667.9 +2.8%Equity attributable to owners
of the parent 3,337.0 3,070.2 +8.7%Total equity 8,393.9 7,334.4 14.4%
Per Share Data For the six months ended 30 June 2016 2015 changeU.S. cents (Restated)(i) Recurring profit 3.70 4.09 -9.5%Basic earnings 2.99 3.68 -18.8%Interim distribution 1.03 1.03 –
At 30 June
2016
At 31 December
2015 change Adjusted net asset value (NAV)
– U.S. dollars 1.62 1.24 +30.6– HK dollars 12.63 9.67 +30.6
Financial Ratio At
30 June 2016
At 31 December
2015Times (Restated)(i) Gearing ratio(ii)
– Consolidated 0.57 0.64– Head Office 0.69 0.79
(i) Refer to Note 1(B) to the condensed interim consolidated financial statements(ii) Calculated as net debt divided by total equity
n/m: Not meaningful

Interim Report 2016 3
2016 Goals: Half-Year Review
Firs
t Pac
ific
Goal Achievement
Reduce significantly First Pacific’s Head Office net debt level
Partly achieved and ongoingOn 27 May 2016, Metro Pacific Holdings, Inc. (“MPHI”), a Philippine affiliate of First Pacific, sold 4.1% of diluted interest of MPIC to GT Capital Holdings, Inc. (“GT Capital”) for a net consideration of US$168.6 million. The proceeds will be used for debt reduction.
Continue to seek new investment opportunities when appropriate
Achieved and ongoingFirst Pacific Group, through MPIC, expanded its infrastructure portfolio by investing in: Global Business Power Corporation (“GBPC”) for electricity generation; Cebu-Cordova Bridge Project for toll roads; Metro Iloilo Water District for the supply of bulk treated water; Eco-System Technologies International, Inc. (“ESTII”) for wastewater and sewage treatment and Sacred Heart Hospital of Malolos Inc. (“SHHMI”) for hospital services.
Guide PLDT through its digital transformation
OngoingThe acquisition of further telecommunications spectrum during the period will strengthen PLDT’s service offerings for advanced mobile phone 4G technology. To this end, PLDT’s capital expenditure budget for 2016 has been increased to accommodate the new planned spending.
Execute turnaround in Australia and support Goodman Fielder’s export initiatives and expansion in Asia
OngoingManagement is executing a business turnaround in Australia to improve profit performance, driven by cost savings, operational efficiencies and new product launches. The China strategy is being implemented with an initial focus on dairy products such as UHT milk, whipping cream, yoghurts and cheese, while in ASEAN markets Goodman Fielder is building its distribution capabilities for the sale of high-quality Australian and New Zealand products.
Assist Philex to complete the definitive feasibility study for the Silangan project
OngoingThe project has secured all major permits including environmental compliance certification for surface mining and approval by the Department of Environment and Natural Resources of the amended Declaration of Mining Project Feasibility for surface mining. The project’s feasibility study is under peer review and further optimization by third-party consultants with completion targeted for early 2017.
Work with management of PLP to achieve profitability
OngoingThe electricity generation industry in Singapore is going through evolutionary changes influenced by the market participants themselves. PLP is fully engaged in working to change and adapt to market conditions to achieve profitability.
Work with management of RHI and First Coconut Manufacturing Inc. (“FCMI”) with the aim of developing these companies as major players in the Philippines’ sugar and coconut industries, respectively
OngoingBoth companies are focusing on securing reliable supplies of raw materials as an important part of laying down the foundation for their long-term growth.

4 First Pacific Company Limited
2016 Goals: Half-Year Review
Goal Achievement
Grow consolidated service revenues, excluding international long distance (“ILD”)/national long distance (“NLD”), by increasing wireless service revenues and sustaining double digit gains in the data and broadband businesses
Mostly achieved and ongoingConsolidated service revenues (excluding ILD and NLD) rose 2% to Pesos 72.1 billion (US$1.5 billion) as data, broadband and digital platform service revenues rose 23% to Pesos 29.5 billion (US$627.7 million) and accounted for 36% of consolidated service revenues. On a segment basis, fixed line service revenues (excluding ILD and NLD) rose 9% period-on-period, while wireless service revenues (excluding ILD and NLD) declined by 3% compared to the first half of 2015.
Meet core income guidance of Pesos 28 billion
OngoingCore income declined 6% to Pesos 17.7 billion (US$376.6 million) in the first half of 2016. With net gain from the sale of 25% interest in Beacon Electric offset by lower equity in earnings in Beacon Electric and taking into consideration lower EBITDA and higher financing costs due to higher capital expenditure, core income guidance was revised upward to Pesos 30 billion for the year as a whole.
Further establish the PLDT group’s fixed and wireless networks’ dominance and reliability to support the data and broadband businesses, with 2016 capital expenditure budget of Pesos 43 billion
OngoingDuring the period, data and broadband revenues rose 25% to Pesos 29.3 billion (US$623.4 million), accounting for 41% of consolidated service revenues (excluding ILD and NLD). 2016 capital expenditure was revised upward to Pesos 48 billion (US$1.0 billion), with the increase to finance utilization of newly acquired spectrum including the 700 MHz band from San Miguel Corporation (“SMC”).
Expand the PLDT group’s suite of offers in digital services, particularly via digital platforms and mobile financial services
Achieved and ongoingPLDT’s digital mobile and commerce arm Voyager Innovations, Inc. offers various consumer lending platforms; a mobile payments platform, PayMaya, as a prepaid wallet for e-commerce payments and remittances; and digital commerce solutions for B2B2C including TackThis! and Takatack, while freenet enables enterprises to reach digital consumers.

Interim Report 2016 5
Indo
food
Goal Achievement
Continue to accelerate growth, both organically and inorganically
Achieved and ongoingConsolidated net sales rose 4.4% to Rupiah 34.1 trillion (US$2.5 billion) mainly driven by higher sales contributions from Consumer Branded Products (“CBP”). CBP group’s total sales value grew 9.4%, driven by existing and new products. In the first half of 2016, this group launched more than 30 new products including new concepts such as Indomie Real Meat and Indomie Bite Mie.
Maintain a healthy balance sheet OngoingGross debt to equity ratio and net debt to equity ratio as of 30 June 2016 stood at 0.66 times and 0.39 times respectively, similar to the figures at the end of 2015.

6 First Pacific Company Limited
2016 Goals: Half-Year Review
Goal Achievement
Continue the development of major projects in light rail and roads which were won in 2015 bidding
Achieved and ongoingTo date, 14 light rail vehicles (“LRV”) were restored which increased the total number of LRVs in operation to 91, while projects for rail replacement, central station unification and facilities improvement are underway. The integration of toll collection systems for Subic Clark Tarlac Expressway (“SCTEX”) and North Luzon Expressway (“NLEX”) was completed in March 2016, while preparation and construction of other road projects are continuing as scheduled.
Bid on further public-private partnership (“PPP”) projects in the Philippines, expand MPIC’s regional presence and pursue opportunities in non- or less-regulated infrastructure businesses
OngoingMPIC is working on the resubmission of proposals for the Metro Rail Transit 3 (“MRT3”) rail line as requested by the new Administration of the Philippine Government. MPIC through MetroPac Water Investments Corporation (“MWIC”) invested in an unregulated business Eco-System Technologies International, Inc. (“ESTII”) which is involved in the wastewater management business.
Resolve tariff claims in the domestic toll road and water businesses as well as other disputes in light rail and electricity distribution
OngoingDelay in tariff adjustments at Meralco, Maynilad, NLEX and Manila-Cavite Toll Expressway (“CAVITEX”) are expected to make progress in the second half of 2016 with the instalment of a new Administration. The final hearing for arbitration filed by Maynilad is expected to take place in December 2016.
Establish specialty hospitals in the Philippines to improve patient outcomes while reducing costs to patients
OngoingThree joint ventures signed for specialty/non-hospital healthcare formats, further expand the scope of health service offerings from the Hospitals group.

Interim Report 2016 7
FPW
/Goo
dman
Fie
lder
Goal Achievement
Increase sales and profitability in South East Asia and China
OngoingSales in Fiji and China rose 15% and 5%, respectively. In South East Asia, Goodman Fielder is increasing its sales and distribution capabilities, including recent commencement of distributor partnerships in Vietnam and the Philippines. As a result, higher export volumes and sales are expected from the second half of this year, led by the sales of products in dairy, grocery and baking-related categories. Sales of UHT and flavored milk products continue to develop and the business will expand into higher margin dairy products such as dairy creams, yogurts and cheeses.
Improve sustainability and growth of profits for the bread business in Australia
OngoingVolume shortfalls across all categories were partly offset by stronger results in Home Baking. Cost-out and logistics improvements will also help to offset the shortfalls. Discussions continue with retailers on reducing wastage of unsold bread loaves. Material and logistics costs improved in the period, and related cost-out programs will continue to drive operational efficiencies and improve profitability of the baking division.
Refinance debt due in 2016 at a significantly lower net cost
OngoingDiscussion of refinancing of approximately A$200 million (US$149 million) is underway and is expected to be finalized in the fourth quarter of this year.
FPW /

8 First Pacific Company Limited
2016 Goals: Half-Year Review
Goal Achievement
Complete the definitive feasibility study of the Silangan project
OngoingThe project has secured all major permits including environmental compliance certification for surface mining and approval by the Department of Environment and Natural Resources of the amended Declaration of Mining Project Feasibility for surface mining. The project’s feasibility study is under peer review and further optimization by third-party consultants with targeted completion by early 2017.
Continuously improve productivity amidst weak metal prices
Achieved and ongoingTonnage milled rose 5% to 4.7 million tonnes and the operating cost per tonne of ore milled declined 11% to Pesos 741 (US$15.8) period-on-period.
Explore tenements around Padcal mine to extend the mine life
OngoingDrilling activities in Bumolo resulted in the estimation of a maiden inferred resource of 21.7 million tonnes at 0.2% copper and 0.3 gram/tonne gold at 0.274% copper equivalent cut-off. Additional drilling programs are ongoing to further identify the quality and quantity of the initial findings.
Interim Report 2016 9
FPM
Pow
er/P
LP
Goal Achievement
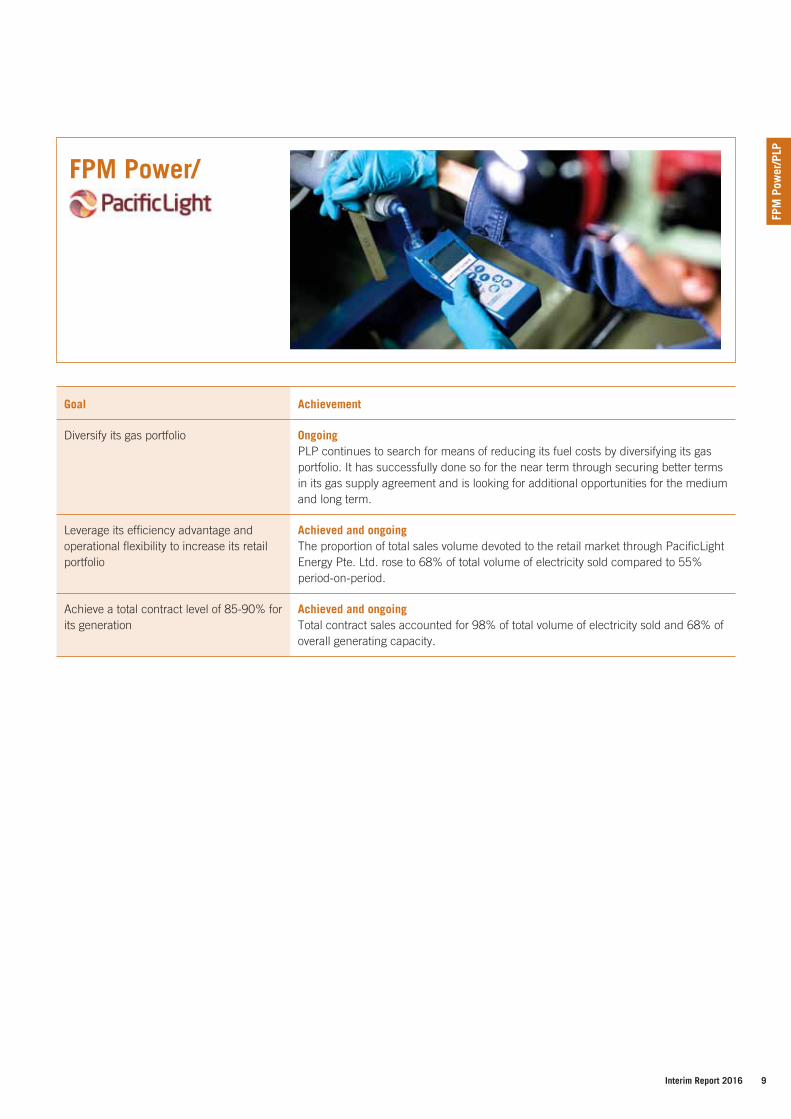
Diversify its gas portfolio OngoingPLP continues to search for means of reducing its fuel costs by diversifying its gas portfolio. It has successfully done so for the near term through securing better terms in its gas supply agreement and is looking for additional opportunities for the medium and long term.
Leverage its efficiency advantage and operational flexibility to increase its retail portfolio
Achieved and ongoingThe proportion of total sales volume devoted to the retail market through PacificLight Energy Pte. Ltd. rose to 68% of total volume of electricity sold compared to 55% period-on-period.
Achieve a total contract level of 85-90% for its generation
Achieved and ongoingTotal contract sales accounted for 98% of total volume of electricity sold and 68% of overall generating capacity.
FPM Power/

10 First Pacific Company Limited
2016 Goals: Half-Year Review
Goal Achievement
Increase reliability of cane supply OngoingShortage in supply of sugar cane in the Philippines worsened in the period due to the impact of El Niño. RHI improved its competitiveness by implementing a new cane purchase program and offering incentives to sugar cane planters. It was able to secure 1.8 million tonnes of sugar cane compared with 1.7 million tonnes in the first half of 2015.
Lift core net earnings OngoingCore net income in the period was adversely impacted by higher cost of sugar cane due to cane supply competition, extended facility upgrade of ethanol plants and higher interest expense. RHI is in discussions with sugar cane planters for securing additional supply of sugar cane, the completion of ethanol facilities expansion this year can also enhance production efficiency.
Increase ethanol production Achieved and ongoingSales volume of ethanol rose 32% to 39.0 million liters from 29.5 million liters in the first half of 2015 reflecting inclusion of San Carlo Bioenergy, Inc.’s (“SCBI”) six months of sales compared with two months in the first half of 2015.
Complete rights issue AchievedRHI completed its rights issue in May 2016, raised Pesos 1.1 billion (US$23.4 million) by issuing 266.8 million new common shares at Pesos 4.19 (US$0.089) per share. The fund raised will be primarily used for loan repayment and capital expenditure.
FP Natural Resources/
/

Interim Report 2016 11
Review of Operations
Firs
t Pac
ific
Contribution by Country
US$ millions
15 16 15 16Philippines Indonesia Others
(50)
0
50
100
150
200
15 16
Below is an analysis of results by individual company.
Contribution and Profit Summary
TurnoverContribution to Group profit(i)
For the six months ended 30 June 2016 2015 2016 2015US$ millions (Restated)(ii) PLDT(iii) – – 78.4 97.4Indofood 2,540.9 2,508.6 76.6 75.0MPIC 462.6 395.4 70.2 69.8FPW(iv) – – 7.2 6.4Philex(iii) – – 4.5 2.9FPM Power 259.3 325.1 (10.9) (7.5)FP Natural Resources 173.2 100.2 0.2 1.1 Contribution from Operations(v) 3,436.0 3,329.3 226.2 245.1 Head Office items:
– Corporate overhead (15.7) (16.0)– Net interest expense (48.4) (47.0)– Other expenses (4.3) (7.3)
Recurring Profit(vi) 157.8 174.8Foreign exchange and derivative gains/(losses)(vii) 9.5 (17.4)Gain on changes in fair value of biological assets 1.1 0.2Non-recurring items(viii) (40.8) (0.2) Profit Attributable to Owners of the Parent 127.6 157.4 (i) After taxation and non-controlling interests, where appropriate(ii) The Group has restated its 1H15 contribution from Indofood to US$75.0 million from US$78.4 million and
changes in fair value of biological assets to a gain of US$0.2 million from a loss of US$1.0 million following its adoption of the amendments to Hong Kong Accounting Standards (HKAS) 16 and 41 “Agriculture: Bearer Plants” with effect from 1 January 2016. Accordingly, the Group’s 1H2015 recurring profit has been restated to US$174.8 million from US$178.2 million and its 1H2015 profit attributable to owners of the parent has been restated to US$157.4 million from US$159.6 million. Details of the changes are set out in Note 1(B) to the condensed interim consolidated financial statements.
(iii) Associated companies(iv) Joint venture(v) Contribution from operations represents the recurring profit contributed to the Group by its operating
companies.(vi) Recurring profit represents the profit attributable to owners of the parent excluding the effects of foreign
exchange and derivative gains/losses, gain on changes in fair value of biological assets and non-recurring items.
(vii) Foreign exchange and derivative gains/losses represent the gains/losses on foreign exchange translation differences on the Group’s unhedged foreign currency denominated net borrowings and payables and the changes in the fair values of derivatives.
(viii) Non-recurring items represent certain items, through occurrence or size, which are not considered as usual operating items. 1H16’s non-recurring losses of US$40.8 million mainly represent PLDT’s impairment provision for its investment in Rocket Internet shares (US$29.3 million), MPIC’s project expenses (US$4.3 million) and PLP’s provision for onerous contracts (US$3.7 million).
12 First Pacific Company Limited
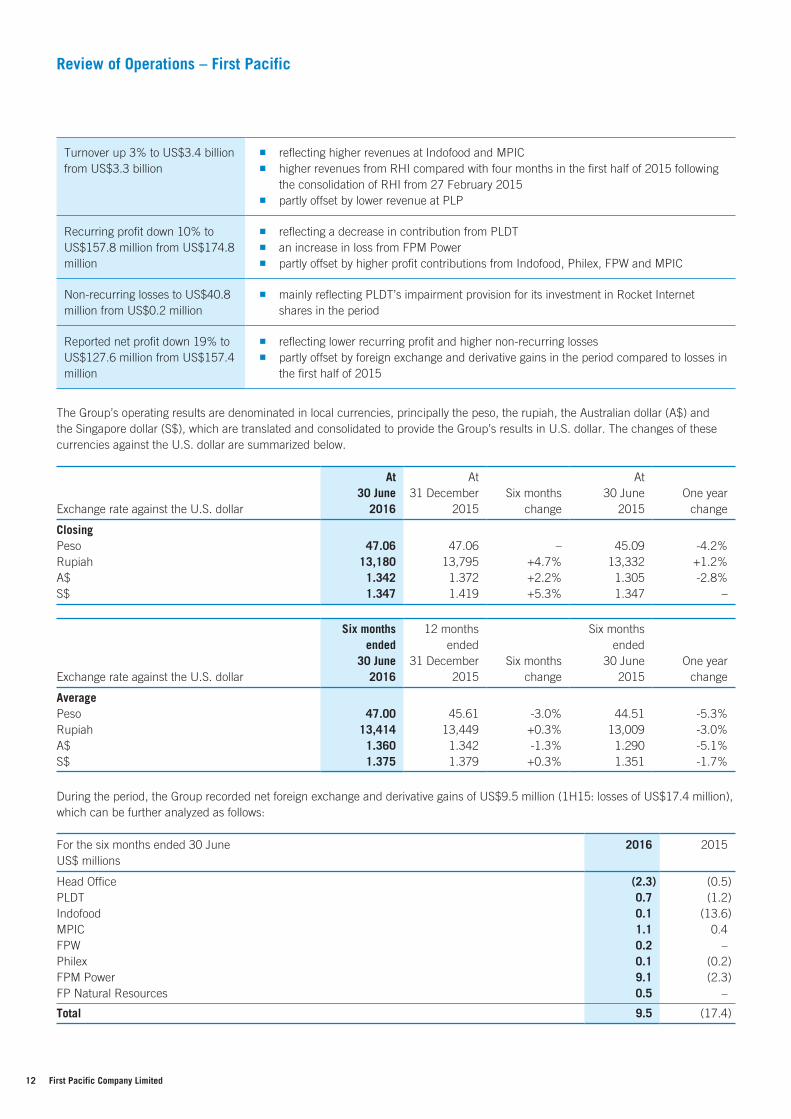
Review of Operations – First Pacific
Turnover up 3% to US$3.4 billion from US$3.3 billion
reflecting higher revenues at Indofood and MPIC higher revenues from RHI compared with four months in the first half of 2015 following
the consolidation of RHI from 27 February 2015 partly offset by lower revenue at PLP
Recurring profit down 10% to US$157.8 million from US$174.8 million
reflecting a decrease in contribution from PLDT an increase in loss from FPM Power partly offset by higher profit contributions from Indofood, Philex, FPW and MPIC
Non-recurring losses to US$40.8 million from US$0.2 million
mainly reflecting PLDT’s impairment provision for its investment in Rocket Internet shares in the period
Reported net profit down 19% to US$127.6 million from US$157.4 million
reflecting lower recurring profit and higher non-recurring losses partly offset by foreign exchange and derivative gains in the period compared to losses in
the first half of 2015
The Group’s operating results are denominated in local currencies, principally the peso, the rupiah, the Australian dollar (A$) and the Singapore dollar (S$), which are translated and consolidated to provide the Group’s results in U.S. dollar. The changes of these currencies against the U.S. dollar are summarized below.
Exchange rate against the U.S. dollar
At 30 June
2016
At 31 December
2015Six months
change
At 30 June
2015One year
change ClosingPeso 47.06 47.06 – 45.09 -4.2%Rupiah 13,180 13,795 +4.7% 13,332 +1.2%A$ 1.342 1.372 +2.2% 1.305 -2.8%S$ 1.347 1.419 +5.3% 1.347 –
Exchange rate against the U.S. dollar
Six monthsended
30 June2016
12 monthsended
31 December2015
Six monthschange
Six monthsended
30 June2015
One yearchange
AveragePeso 47.00 45.61 -3.0% 44.51 -5.3%Rupiah 13,414 13,449 +0.3% 13,009 -3.0%A$ 1.360 1.342 -1.3% 1.290 -5.1%S$ 1.375 1.379 +0.3% 1.351 -1.7%
During the period, the Group recorded net foreign exchange and derivative gains of US$9.5 million (1H15: losses of US$17.4 million), which can be further analyzed as follows: For the six months ended 30 June 2016 2015US$ millions Head Office (2.3) (0.5)PLDT 0.7 (1.2)Indofood 0.1 (13.6)MPIC 1.1 0.4FPW 0.2 –Philex 0.1 (0.2)FPM Power 9.1 (2.3)FP Natural Resources 0.5 – Total 9.5 (17.4)

Interim Report 2016 13
Firs
t Pac
ificDivestment
On 27 May 2016, MPHI, a Philippine affiliate of First Pacific, sold 4.1% diluted interest of MPIC to GT Capital for a net consideration of US$168.6 million. Post the transaction together with the dilution impact from MPIC’s share placement to GT Capital for Pesos 22.0 billion (US$467.2 million), MPHI’s economic interest in MPIC was reduced to approximately 42.0% from approximately 52.0%.
Interim DistributionFirst Pacific’s Board of Directors, taking into consideration cash flow trends and following consistent prudent risk management practices, declared an interim distribution of HK8 cents (U.S. 1.03 cents) per share, unchanged from a year earlier. The interim distribution represents a 28% payout of the Group’s 2016 first half recurring profit to shareholders, higher than the committed payout of 25%.
Debt ProfileAt 30 June 2016, net debt at the Head Office stood at US$1.5 billion while gross debt stood at US$1.8 billion with an average maturity of approximately 3.6 years. Approximately 18% of the Head Office borrowings were floating rate bank loans while fixed rate bonds comprised the remainder. Unsecured debts accounted for approximately 61% of Head Office borrowings. The blended interest rate was approximately 5.3% per annum.
Among the outstanding debts, plans are underway to partially refinance the US$300 million bonds issued in July 2010 due to mature in July 2017, taking into account the US$168.6 million net proceeds from the sale of MPIC shares.
There is no Head Office recourse for the borrowings of subsidiary and affiliate companies.
Interest CoverFor the first half of 2016, Head Office recurring operating cash inflow before interest expense was approximately US$120.1 million. Net cash interest expense declined 2% to approximately US$45.7 million reflecting a lower average debt level as the Company bought back approximately US$13.0 million of bonds which mature in 2023 during the period. For the 12 months ended 30 June 2016, the cash interest cover was above 2.0 times.
Foreign Currency HedgingThe Company actively reviews the potential benefits of hedging based on forecast dividend flows and enters into hedging arrangements (including the use of forward exchange contracts) for managing its foreign currency exposure in respect of dividend income and payments in foreign currencies on a transactional basis.
2016 OutlookThe First Pacific Group of companies continues to evolve as the units respond to changing market conditions. Most clearly at PLDT, market evolution is transforming the Philippines’ biggest telecommunications company into a digital service and content provider, repositioning itself to return to earnings growth. MPIC expects to record another year of record high earnings as demand for its products and services continues to grow. At Indofood, continuing growth and a focus on delivering high-quality food products at competitive prices are expected to result in strong financial results by year-end. For First Pacific, debt reduction is easing pressure on cash flow during a period of reduced dividend income. It is expected that a return to growth will begin following stabilization in 2016.

14 First Pacific Company Limited
Review of Operations – PLDT
PLDT contributed profit of US$78.4 million to the Group (1H15: US$97.4 million), representing approximately 35% (1H15: 40%) of First Pacific’s aggregate contribution from operations for the period. The 20% reduction in profit contribution principally reflecting the decline in prepaid cellular service revenues, higher handset subsidies and provisions, and a 5% depreciation of the peso against the U.S. dollar, partly offset by an increase in other income, higher fixed line service revenues and lower manpower reduction costs.
Consolidated core net income down 6% to Pesos 17.7 billion (US$376.6 million) from Pesos 18.9 billion (US$425.3 million)
principally reflecting the decline in prepaid cellular service revenues, higher costs in connection with growing the postpaid business and data usage, including handset subsidies and provisions
partly offset by an increase in other income in relation to the sale of the 25% interest in Beacon Electric to MPIC, higher fixed line service revenues and lower manpower reduction costs
Reported net income down 33% to Pesos 12.5 billion (US$265.2 million) from Pesos 18.7 billion (US$420.8 million)
reflecting lower core net income additional impairment of the investment in Rocket Internet due to the further decline in
its share price during the period
Consolidated service revenues down 1% to Pesos 80.6 billion (US$1.7 billion) from Pesos 81.2 billion (US$1.8 billion)
reflecting continued structural change in the revenue mix excluding revenue declines from international and national long distance businesses,
consolidated service revenues rose 2% owing mainly to higher revenues from data and broadband
revenues from data, broadband and digital platforms rose 23%, accounting for 36% of total consolidated service revenues
combined revenues from cellular SMS and domestic voice, accounting for 53% of total consolidated service revenues, decreased 9%
ILD and NLD revenues, accounting for 11% of total consolidated service revenues, declined 17%
for fixed line service revenues, increases in data and broadband revenues were partially offset by the decline in ILD and NLD revenues
for wireless service revenues, declines in SMS, domestic voice and ILD more than offset the rise in data and broadband revenues
EBITDA down 13% to Pesos 30.8 billion (US$655.3 million) from Pesos 35.5 billion (US$797.6 million)
principally due to higher subsidies of smartphones partly offset by lower selling and promotion expenses
higher provisions for receivables and inventory in relation to growing the postpaid business and encouraging data usage
EBITDA margin to 38% from 44% decrease is partly due to the impact of continuing structural change in the revenue mix where higher margin traditional businesses are replaced by lower margin data and broadband businesses, in line with industry trends
EBITDA margin for the fixed line segment at 39% and for the wireless segment at 32%

Interim Report 2016 15
PLDTCapital Expenditure
From 2006 to 2015, PLDT spent approximately Pesos 302 billion (US$6.7 billion) in capital expenditure. Capital expenditure for 2016 is estimated at Pesos 48 billion (US$1.0 billion) which includes Pesos 5 billion (US$106.2 million) to roll out network facilities that will utilize the spectrum acquired from SMC at end-May 2016, including the 700 MHz band. During the period, capital expenditure rose 44% to Pesos 20.0 billion (US$425.5 million) for expanding the PLDT group’s 3G and 4G/LTE coverage and capacity, additional fiber optic cabling to augment the fiber assets of the group, full integration on the Sun and Smart networks, and data center expansion. A sizeable amount of capital expenditure is to build out a superior network that will deliver the best data experience to PLDT’s customers.
Debt Profile As at 30 June 2016, PLDT’s consolidated net debt was US$2.8 billion compared with US$2.4 billion at 31 December 2015 as a result of higher level of capital expenditure. Total gross debt was unchanged at US$3.4 billion, of which 37% was denominated in U.S. dollars. Only 9% of the total debt was unhedged after taking into account U.S. dollar cash on hand and currency hedges in place. 67% of the total debts were due to mature beyond 2018. Post-interest rate swaps, 91% of total debt are fixed-rate loans. The average pre-tax interest cost increased to 4.4% from 4.2% in full year 2015. The debt profile remains healthy.
PLDT is rated investment grade by Fitch Ratings, Moody’s Investors Service and Standard and Poor’s Financial Services, unchanged from year-end 2015.
Capital ManagementInterim DividendConsidering the higher capital expenditure required to support increasing network traffic due to higher data usage by customers, PLDT’s Board of Directors revised the regular dividend payout to 60% of core net income from 75%, with a “look back” policy at year-end to assess the possibility of paying a special dividend.
The PLDT Board of Directors approved an interim dividend of Pesos 49 (US$1.04) per share payable on 1 September 2016 to shareholders on record as of 16 August 2016.
Share BuybackPLDT has not bought back shares since November 2010 under its share buyback program. In 2008, PLDT’s Board of Directors approved a program to buy back up to 5 million shares. So far in the program PLDT had bought back 2.7 million shares at an average cost of Pesos 2,388 (US$51) per share for a total consideration of Pesos 6.5 billion (US$138.3 million).
Additional Investment and Asset DivestmentOn 30 May 2016, PLDT and Globe Telecom, Inc. announced the acquisition of the telecommunications businesses of SMC for a total consideration of Pesos 70 billion (US$1.5 billion), consisting of Pesos 52.8 billion (US$1.1 billion) for the equity interest, and Pesos 17.2 billion (US$366.0 million) in assumed liabilities. Each of PLDT and Globe have a 50% equity interest in the acquired businesses. As part of the transaction, 85MHz of spectrum in various bands were returned to the government, while each of PLDT and Globe entered into co-use arrangements with the National Telecommunications Commission (“NTC”) for 140MHz each across various spectrum bands. PLDT’s share of the total consideration was Pesos 26.45 billion (US$562.8 million) in equity and Pesos 8.55 billion (US$181.9 million) in assumed liabilities. Half of the equity portion has been paid with the remaining to be paid in two equal portions in December 2016 and in May 2017. Post-closing financial due diligence is ongoing. On 12 July 2016, PLDT filed with the Court of Appeals of the Philippines a Petition for Certiorari and Prohibition with Urgent Application for Issuance of a Temporary Restraining Order and/or Writ of Preliminary Injunction against the Philippine Competition Commission’s view to protect the “deemed approved” status of the transaction.
On 30 May 2016, PLDT’s subsidiary PLDT Communications and Energy Ventures, Inc. (“PCEV”) sold a 25% interest in Beacon Electric Asset Holdings, Inc. (“Beacon Electric”) to Metro Pacific Investments Corporation (“MPIC”) for a consideration of Pesos 26.2 billion (US$557.4 million). PCEV had received Pesos 17.0 billion (US$361.7 million) in cash and the balance of Pesos 9.2 billion (US$195.7 million) is to be received in annual installments until June 2020.
Fixed LineGrowth in the fixed line businesses continues, with service revenues, net of interconnection costs, rising 7% to Pesos 30.9 billion (US$657.4 million), reflecting higher revenues from fixed line data and broadband, and domestic voice businesses, partly offset by lower ILD and NLD revenues.
Fixed line data and broadband, and domestic voice and others revenues, respectively, represented 59% and 31% of total fixed line service revenues and increased 12% and 4% during the period, while ILD and NLD revenues accounted for 10% of total fixed line service revenues and declined 7%.
The number of PLDT fixed line subscribers increased 5% to 2.4 million period-on-period, of which approximately 1.3 million or 57% had broadband subscriptions.

16 First Pacific Company Limited
Review of Operations – PLDT
WirelessWireless service revenues declined 5% to Pesos 52.7 billion (US$1.1 billion), reflecting decreases in SMS and voice revenues offsetting increases in revenues from wireless data and broadband. Revenues from wireless data, broadband and digital platforms; SMS and domestic voice; and ILD services represented 27%, 65% and 8% of total wireless service revenues, respectively. Wireless data, broadband and digital-related revenues rose 29%, reflecting higher smartphone penetration in the subscriber base, as well as increased data usage among those owning smartphones. SMS and domestic voice, and ILD revenues declined 12% and 23%, respectively, as more users switched to lower cost over-the-top services.
The PLDT group’s combined cellular subscriber base declined to 64.5 million (31 December 2015: 64.9 million), while wireless broadband subscribers grew to 4.0 million (31 December 2015: 3.9 million), bringing the group’s total wireless subscriber base to 68.5 million.
Prepaid subscribers accounted for 95% of the PLDT group’s total cellular subscriber base, while postpaid accounted for the remaining 5%.
Data and BroadbandAll of the PLDT group’s data and broadband businesses’ grew in the period, with total data and broadband revenues increasing 25% to Pesos 29.3 billion (US$623.4 million), accounting for 41% of consolidated service revenues (excluding ILD and NLD). The rise reflects increases of 55%, 22%, 16% and 12% in mobile internet, corporate data and data centers, fixed line broadband and wireless broadband revenues, respectively.
PLDT has the largest number of broadband subscribers in the Philippines. Its combined broadband subscriber base rose to 5.4 million (31 December 2015: 5.2 million) of which 75% were wireless broadband subscribers. The number of PLDT fixed broadband subscribers grew 7% to 1.3 million. As at the end of 30 June 2016, smartphone ownership rose to about 48% of PLDT’s cellular subscriber base, and mobile internet usage grew 24% in volume terms.
PLDT operates the largest data center business in the Philippines with seven data centers supporting the growth of Philippine corporates, the business process outsourcing industry and businesses of all sizes. Corporate data and data center revenues rose 22% to Pesos 6.5 billion (US$138.3 million) and accounted for 22% of total data and broadband revenues.
With the popularity of social networks and the growing availability of affordable data-capable devices, and the overall growth of Philippine businesses, including the BPO industry, the upward momentum in PLDT’s data and broadband businesses is expected to continue. The buildout of a superior data network, complemented by access to additional frequencies from the acquisition of SMC’s telecommunications businesses, will further enable PLDT to deliver a quality customer experience and offer a wide range of content offerings and affordable broadband services to the Philippine market.
MeralcoPLDT’s indirect subsidiary PCEV owns 25% of Beacon Electric. As at 30 June 2016, Beacon Electric owned approximately 34.96% of Meralco.
Meralco, the largest electricity distribution utility in the Philippines, has a franchise to distribute electricity in most of Luzon until 2028. The franchise area produces nearly half of the Philippines’ gross domestic product and Meralco accounts for over half of the total electricity sales in the Philippines.
Meralco’s performance in the first half of 2016 can be found in the MPIC section of this document.
2016 OutlookPLDT’s dominant market position places it in a unique position to lead in the development of the Philippines’ digital economy. It is presently undergoing a ‘digital pivot’, a transformational journey that is expected to take three years to complete, in order for PLDT to better position itself to serve the emerging digital native and digital enterprise. Progress is being made at different paces by the various businesses. The fixed line and enterprise businesses have gathered momentum in building their data and digital revenues. The wireless business is also gaining ground but has much further to go in an environment where competition remains keen. Nevertheless, PLDT is guiding for full-year core income of Pesos 30 billion.

Interim Report 2016 17
PLDTReconciliation of Reported Results Between PLDT and First Pacific
PLDT’s operations are principally denominated in peso, which averaged Pesos 47.00 (1H15: Pesos 44.51) to the U.S. dollar. Its financial results are prepared under Philippine Generally Accepted Accounting Principles (GAAP) and reported in peso. First Pacific’s financial results are prepared under Hong Kong GAAP and reported in U.S. dollars. Philippine GAAP and Hong Kong GAAP are largely based on International Financial Reporting Standards (IFRSs), however, certain adjustments need to be made to PLDT’s reported peso results to ensure full compliance with Hong Kong GAAP. An analysis of these adjustments follows. For the six months ended 30 June 2016 2015Peso millions Net income under Philippine GAAP 12,463 18,729Preference dividends(i) (30) (29) Net income attributable to common shareholders 12,433 18,700Differing accounting and presentational treatments(ii)
– Reclassification of non-recurring items 5,369 (8)– Others (3,258) (1,940)
Adjusted net income under Hong Kong GAAP 14,544 16,752Foreign exchange and derivative (gains)/losses(iii) (132) 207 PLDT’s net income as reported by First Pacific 14,412 16,959 US$ millions Net income at prevailing average rates for
1H16: Pesos 47.00 and 1H15: Pesos 44.51 306.6 381.0Contribution to First Pacific Group profit, at an average shareholding of
1H16: 25.6% and 1H15: 25.6% 78.4 97.4 (i) First Pacific presents net income after deduction of preference dividends.(ii) Differences in accounting treatment under Philippine GAAP, compared with Hong Kong GAAP, and other presentational differences. The principal adjustments include:
– Reclassification of non-recurring items: Certain items, through occurrence or size, are not considered usual operating items which are reallocated and presented separately. Adjustment for 1H16 of Pesos 5.4 billion mainly represents impairment provision for investment in Rocket Internet shares (1H15: Nil).
– Others: The adjustments principally relate to the elimination of unrealized gains arising from transactions between the Group and its associate/joint venture, the accrual of withholding tax on PLDT’s net income in accordance with the requirements of Hong Kong Accounting Standard (HKAS) 12 “Income Taxes”, and the recognition of amortization for certain intangible assets identified as a result of the Group’s acquisition of an additional 2.7% interest in PLDT in November 2011.
(iii) To illustrate the underlying operational results and profit contributions, foreign exchange and derivative gains/losses (net of related tax) are excluded and presented separately.
18 First Pacific Company Limited
Review of Operations – Indofood
Indofood’s contribution to the Group increased 2% to US$76.6 million (1H15: US$75.0 million) principally reflecting higher core net income, partly offset by a 3% depreciation of the average rupiah exchange rate against the U.S. dollar.
Core net income up 7% to Rupiah 2.2 trillion (US$165.6 million) from Rupiah 2.1 trillion (US$160.0 million)
reflecting a 4% rise in operating profit higher profitability from CBP, Bogasari and Distribution groups partly offset by weaker performance at the Agribusiness group and lower profit
contribution from China Minzhong Food Corporation Limited (“CMZ”)
Net income up 29% to Rupiah 2.2 trillion (US$166.3 million) from Rupiah 1.7 trillion (US$133.1 million)
mainly reflecting higher core net income recorded foreign exchange gains in 2016 compared to losses in 2015
Consolidated net sales up 4% to Rupiah 34.1 trillion (US$2.5 billion) from Rupiah 32.6 trillion (US$2.5 billion)
driven by higher sales contributions from CBP, Bogasari and Distribution groups partly offset by a decrease at the Agribusiness group sales contribution from CBP, Bogasari, Agribusiness and Distribution groups amounted
to 52%, 23%, 17% and 8% of the total, respectively
Gross profit margin to 28.8% from 27.4%
mainly on lower key raw material costs
Consolidated operating expenses up 6% to Rupiah 5.6 trillion (US$417.5 million) from Rupiah 5.3 trillion (US$407.4 million)
due mainly to higher salaries, wages and employee benefits and advertising and promotion expenses
EBIT margin remained at 11.8%
Net gearing at 0.39 times from 0.34 times at the end of 2015
Debt ProfileAs at 30 June 2016, Indofood recorded gross debt of Rupiah 28.6 trillion (US$2.2 billion), up 4% from Rupiah 27.6 trillion (US$2.0 billion) as at 31 December 2015. Of this total, 44% matures within one year and the remainder matures between July 2017 and June 2022, while 51% was denominated in rupiah and 49% was denominated in foreign currencies.

Interim Report 2016 19
Indo
foodAdditional Investment and Asset Held for Sale
On 29 February 2016, PT Wushan Hijau Lestari, a 65%-owned subsidiary of PT Perusahaan Perkebunan London Sumatra Indonesia Tbk (“Lonsum”), acquired a 100% interest in PT Pasir Luhur (“PL”) for a total consideration of Rupiah 55 billion (US$4.1 million). PL owns approximately 900 hectares of tea plantation located at West Java, Indonesia.
On 31 December 2014, Indofood received a letter of intent from China Minzhong Holdings Limited (“CMZ BVI”) to purchase approximately 52.94% of the issued share capital of CMZ at S$1.2 (US$0.89) per share. On 14 October 2015, Indofood and CMZ BVI entered into a binding memorandum of understanding (“MOU”). As at 30 December 2015, Indofood received earnest payments of S$40.0 million (US$29.4 million) from CMZ BVI, one of the principal terms of the MOU. Indofood and CMZ BVI will continue to discuss and work towards the finalization of a definitive sale and purchase agreement. Following the completion of the proposed transaction, Indofood’s interest in CMZ will be reduced to 29.94%.
CBPThe CBP group comprises the following divisions: Noodles, Dairy, Snack Foods, Food Seasonings, Nutrition & Special Foods, and Beverages.
Indofood’s Noodles division is one of the world’s largest producers of instant noodles with annual production capacity of over 17 billion packs. During the period, CBP launched Indomie Real Meat in two flavors: Chicken Mushroom and Beef Rendang, Indomie Bite Mie in three flavors: Seaweed, Shrimp Tempura and BBQ Pizza, and Sarimi Tongseng Ayam in single pack and Isi 2 (one pack consisting of two noodle blocks).
PT Indolakto, the dairy operating subsidiary, has an annual production capacity of more than 600,000 tonnes. It is one of the largest dairy products manufacturers in Indonesia, producing sweetened condensed milk, creamer, UHT milk, sterilized bottled milk, pasteurized liquid milk, lactic acid beverages, powdered milk, ice cream and butter. During the period, it introduced flavor extensions for Indomilk UHT milk, namely Banana Milk and Strawberry Milk.
The Snack Foods division has an annual production capacity of around 45,000 tonnes, producing flavored and salted chips using potatoes, cassavas, soybeans and sweet potatoes, as well as extruded snacks and biscuits. The division also continued to focus on innovation and during the period it introduced popular products such as Chitato Indomie Goreng, Chitato Foodie and Qtela Opak.
The Food Seasonings division has an annual production capacity of more than 135,000 tonnes, manufacturing a wide range of products, including instant seasonings, chili sauces, soy sauces, tomato sauces and other condiments.
The Nutrition & Special Foods division has an annual production capacity of around 25,000 tonnes, producing and marketing baby cereal, biscuits and puddings for babies and children, milk for expectant and lactating mothers, cereal snacks and cereal drinks.
The Beverages division’s product portfolio includes ready-to-drink teas, ready-to-drink coffees, packaged water, carbonated soft drinks and fruit flavored drinks with a combined annual production capacity of around 3 billion liters.
Sales by the CBP group rose 9% to Rupiah 17.8 trillion (US$1.3 billion), driven by both volume growth and higher average selling prices.
The EBIT margin improved to 14.9% from 13.1% primarily due to improved gross profit margins.
Overall market conditions in the first half of 2016 were better than last year, with demand for most fast-moving consumer goods increasing from last year. Indofood expects this condition to be sustained for the remainder of the year.
BogasariBogasari produces wheat flour and pasta for domestic and international markets. Its sales rose 4% to Rupiah 10.0 trillion (US$746.7 million) on higher sales. The EBIT margin increased to 8.9% from 7.9%.
The flour industry is expected to benefit from the improving fast-moving consumer goods industry and an increasing preference by younger people for flour-based foods.

20 First Pacific Company Limited
Review of Operations – Indofood
AgribusinessThe Agribusiness group consists of two divisions: Plantations and Edible Oils & Fats (“EOF”), which operate through IndoAgri and its main operating subsidiaries PT Salim Ivomas Pratama Tbk (“SIMP”) and Lonsum in Indonesia. The Agribusiness group is one of Indonesia’s largest palm oil producers with leading businesses in Indonesia’s branded cooking oil segment. It also has equity investments in sugar production in Companhia Mineira de Açúcar e Álcool Participacoes (“CMAA”) in Brazil and in RHI in the Philippines.
For facilities expansion projects, the construction of two new milling facilities, one each in South Sumatra and in Kalimantan, is expected to be completed within this year as planned. The construction of another new mill in Kalimantan and the expansion of the refinery at Surabaya are expected to be completed in 2017.
PlantationsSIMP and Lonsum have a total planted area of 299,497 hectares. Oil palm is the dominant crop, with 24% of oil palms younger than seven years and an average age of approximately 14 years. Total planted area of oil palm was 246,345 hectares, compared to 246,359 hectares as of December 2015. This division has a total annual processing capacity of 6.4 million tonnes of fresh fruit bunches (“FFB”). In the first half of 2016, crude palm oil (“CPO”) production decreased 21% to 353 million tonnes due to the effect of El Niño during the second half of 2015. As at 30 June 2016, RSPO and ISPO certified CPO production were approximately 377,000 and approximately 180,000 tonnes, respectively.
In Indonesia, total planted area of sugar cane decreased 4% from the end of 2015 to 12,835 hectares in South Sumatra. Sugar production rose 16% to approximately 18,000 tonnes in the first half of 2016.
In Brazil, the planted area of sugar cane decreased 0.4% to 52,640 hectares. The reduction in the sugar cane planted area was mainly due to replanting in progress. CMAA’s performance was adversely impacted by lower selling prices of electricity generation and losses related to Brazilian currency fluctuation. Indofood’s 50% share of CMAA’s loss was Rupiah 118 billion (US$8.8 million).
EOFThis division manufactures cooking oils, margarines and shortenings with an annual refinery capacity of 1.4 million tonnes of CPO. Approximately 59% of this division’s input needs are sourced from the Plantations division’s CPO production.
Agribusiness sales declined 1% to Rupiah 6.7 trillion (US$499.4 million), reflecting lower average selling prices and sales volumes of CPO and rubber, partly offset by higher sugar and palm kernel related product sales. The EBIT margin declined to 7.5% from 9.6%. For sales volume, CPO declined 10% to approximately 388,000 tonnes, palm kernel related products declined 13% to approximately 89,000 tonnes, rubber down 28% to approximately 6,000 tonnes, and sugar rose 16% to approximately 18,000 tonnes.
As a diversified and vertically integrated agribusiness with a dominant presence in Indonesia, Indofood’s operations continue to be supported by positive market factors that include good demographics, strong economic fundamentals, and a fast-growing middle class with rising discretionary incomes.
The outlook for the agribusiness remains optimistic but they are cautiously managing their activities during this challenging period to mitigate risks and exposures. It will place a stronger emphasis on extracting the optimum from its value chain, and proactively improve operations, increase yields, raise productivity and control costs.
DistributionThe Distribution group is a major component of Indofood’s Total Food Solutions chain of operations as it has the most extensive distribution network of stock points in Indonesia among domestic consumer food producers.
Distribution’s sales rose 4% to Rupiah 2.7 trillion (US$203.5 million) mainly benefiting from higher sales by CBP businesses. The EBIT margin rose to 4.0% from 3.3%.
The Distribution group continues to strengthen its distribution network serving over 400,000 registered retail outlets in Indonesia for increasing product penetration and high product visibility in retail outlets.
2016 OutlookOverall market condition in the first half of 2016 is better than last year, supported by improving economic growth and a manageable inflation rate. Indofood remains positive for the outlook for the remainder of the year.

Interim Report 2016 21
Indo
foodReconciliation of Reported Results Between Indofood and First Pacific
Indofood’s operations are principally denominated in rupiah, which averaged Rupiah 13,414 (1H15: Rupiah 13,009) to the U.S. dollar. Its financial results are prepared under Indonesian GAAP and reported in rupiah. First Pacific’s financial results are prepared under Hong Kong GAAP and reported in U.S. dollars. Accordingly, certain adjustments need to be made to Indofood’s reported rupiah results to ensure full compliance with Hong Kong GAAP. An analysis of these adjustments follows. For the six months ended 30 June 2016 2015Rupiah billions (Restated)(i) Net income under Indonesian GAAP 2,231 1,731Differing accounting and presentational treatments(ii)
– Reclassification of non-recurring items (8) (3)– Gain on changes in fair value of biological assets 30 6– Foreign exchange accounting 26 27– Others (195) (158)
Adjusted net income under Hong Kong GAAP 2,084 1,603Foreign exchange and derivative (gains)/losses(iii) (1) 354Gain on changes in fair value of biological assets(iii) (30) (6) Indofood’s net income as reported by First Pacific 2,053 1,951 US$ millions Net income at prevailing average rates for
1H16: Rupiah 13,414 and 1H15: Rupiah 13,009 153.0 150.0Contribution to First Pacific Group profit, at an average shareholding of
1H16: 50.1% and 1H15: 50.1% 76.6 75.0 (i) The Group has restated its 1H2015 contribution from Indofood to US$75.0 million from US$78.4 million following its adoption of the amendments to HKAS 16 and 41
“Agriculture: Bearer Plants” with effect from 1 January 2016.(ii) Differences in accounting treatment under Indonesian GAAP, compared with Hong Kong GAAP, and other presentational differences. The principal adjustments
include:– Reclassification of non-recurring items: Certain items, through occurrence or size, are not considered usual operating items which are reallocated and presented
separately.– Gain on changes in fair value of biological assets: Under Indonesian GAAP, Indofood measures its biological assets on a historical cost basis. HKAS 41 “Agriculture”
requires the measurement of biological assets at fair value less costs to sell. The adjustment relates to the change in fair value of biological assets during the period.
– Foreign exchange accounting: The adjustment relates to the reversal of the amortization of foreign exchange losses that were previously capitalized by Indofood on certain fixed assets under construction, as the originating capitalized foreign exchange losses have already been written off by First Pacific.
– Others: The adjustments principally relate to the accrual of withholding tax on Indofood’s dividends in accordance with the requirements of HKAS 12 “Income Taxes”.
(iii) To illustrate the underlying operational results and profit contributions, foreign exchange and derivative gains/losses (net of related tax) and gain on changes in fair value of biological assets are excluded and presented separately.

22 First Pacific Company Limited
Review of Operations – MPIC
MPIC’s infrastructure portfolio as at 19 August 2016 comprises the following assets offering a wide range of services:
Power distribution and generation 75.0% in Beacon Electric which owns 34.96% of Meralco and 56.0% of GBPC 15.0% in Meralco
Water distribution and sewage management 52.8% in Maynilad Water Services, Inc. (“Maynilad”) 100.0% in MWIC which in turn owns 65.0% in ESTII
Toll roads 99.9% in MPTC which in turn owns:
75.6% in Manila North Tollways Corporation (“MNTC”) 46.0% in Tollways Management Corporation (“TMC”) 100.0% in Cavitex Infrastructure Corporation (“CIC”) 100.0% in MPCALA Holdings, Inc. (“MPCALA”) 44.9% in CII Bridges and Roads Investment Joint Stock Co. (“CII B&R”) in Vietnam
29.45% in Don Muang Tollway Public Company Limited (“DMT”) in Thailand
Hospitals 60.1% interest in Metro Pacific Hospital Holdings, Inc. (“MPHHI”) which in turn owns:
100.0% in Colinas Verdes Hospital Managers Corporation, the operator of Cardinal Santos Medical Center (“CSMC”) 100.0% in East Manila Hospital Managers Corporation, the operator of Our Lady of Lourdes Hospital (“OLLH”) 100.0% in Metro Pacific Zamboanga Hospital Corporation, the operator of West Metro Medical Center (“WMMC”) 93.0% in Marikina Valley Medical Center (“MVMC”) 85.6% in Asian Hospital, Inc. (“AHI”) which owns 100.0% of Asian Hospital and Medical Center 78.0% in Riverside Medical Center, Inc. (“RMCI”) 51.0% in Central Luzon Doctors’ Hospital (“CLDH”) 51.0% in De Los Santos Medical Center Inc. (“DLSMC”) 51.0% in Sacred Heart Hospital of Malolos Inc. (“SHHMI”) 35.2% in Davao Doctors Hospital, Inc. (“DDH”) 33.2% in Medical Doctors, Inc. (“MDI”) 20.0% in Manila Medical Services Inc. (“MMSI”), the operator of Manila Doctors Hospital (“MDH”) 51.0% in The Megaclinic, Inc. (“Megaclinic”)
Rail 55.0% in Light Rail Manila Corporation (“LRMC”), the operator of Light Rail Transit 1 (“LRT1”) 20.0% in AF Payments Inc. (“AFPI”)

Interim Report 2016 23
MPI
CMPIC’s contribution to the Group increased 1% to US$70.2 million (1H15: US$69.8 million), reflecting higher contributions from its power, toll roads, hospitals and rail businesses, partly offset by a lower contribution from its water business due to the expiry of income tax holiday of Maynilad, a higher MPIC head office net interest expense, lower average shareholding in MPIC and a 5% depreciation of the average peso exchange rate against the U.S. dollar.
Consolidated core net income up 13% to Pesos 6.6 billion (US$141.4 million) from Pesos 5.9 billion (US$132.2 million)
reflecting strong growth at all of MPIC’s operating companies, except Maynilad due to the expiration of its income tax holiday
power, water, toll roads, hospitals and rail accounted for 52%, 22%, 22%, 3% and 1%, respectively, of MPIC’s consolidated profit contribution from operations
a 39% increase in contribution from Meralco/Beacon Electric to Pesos 4.1 billion (US$86.7 million), a higher average shareholding in Meralco and lower net interest expense at Beacon Electric
a 26% decline in contribution from Maynilad to Pesos 1.8 billion (US$38.3 million) as the increases in billed volume and average effective tariff were offset by an increase in tax expense due to the expiration of Maynilad’s income tax holiday in December 2015
a 32% rise in contribution from MPTC and DMT to Pesos 1.8 billion (US$38.1 million). MPTC’s performance reflected higher contributions from NLEX and SCTEX
a 33% increase in contribution from Hospitals to Pesos 249 million (US$5.3 million) a turnaround of contribution of Pesos 159 million (US$3.4 million) from the light rail
business from a pre-operating loss for the same period in 2015 partly offset by a higher MPIC head office net interest expense arising from debt
financing for investments in various projects and interest accretion on amounts due to Beacon Electric in relation to its acquisition of an additional 10% interest in Meralco and to PCEV in relation to its acquisition of an additional 25% common and preferred shares in Beacon Electric
Consolidated reported net income up 25% to Pesos 7.0 billion (US$148.5 million) from Pesos 5.6 billion (US$125.0 million)
due largely to higher core net income a non-recurring income of Pesos 336 million (US$7.1 million) principally reflecting
reduced expected future tax liabilities related to Maynilad following a reassessment of future net deferred tax liabilities
Revenues up 24% to Pesos 21.7 billion (US$462.6 million) from Pesos 17.6 billion (US$395.4 million)
reflecting revenue growth at Maynilad, MPTC and Hospitals, and new contribution from Rail business
Debt ProfileAs at 30 June 2016, MPIC reported consolidated debt of Pesos 88.2 billion (US$1.9 billion), up 1% from Pesos 87.6 billion (US$1.9 billion) as at 31 December 2015. Of the total, 94% was denominated in pesos. Fixed-rate loans accounted for 95% of the total and the average pre-tax interest cost was approximately 5.8%.
Interim DividendMPIC’s Board of Directors declared an interim dividend of Peso 0.032 (U.S. 0.068 cent) per share payable on 26 September 2016 to shareholders on record as of 1 September 2016. This interim dividend represents a payout ratio of 15% of core net income.
Additional InvestmentsOn 7 March 2016, MPHHI completed the acquisition of a 51.0% interest in SHHMI for a total consideration of Pesos 150 million (US$3.2 million). SHHMI plans to use the funds paid by MPHHI to increase its bed capacity and to enhance its medical facilities.
On 15 April 2016, MPTC signed a joint venture agreement with the City of Cebu and the Municipality of Cordova for the financing, design, construction, implementation, operation and maintenance of the 8.25 kilometers Cebu-Cordova Bridge Project. The estimated construction cost is expected to be no more than Pesos 27.9 billion (US$592.9 million). Construction is expected to be completed by 2020.
On 5 May 2016, MWIC signed a joint venture agreement with the Metro Iloilo Water District for the supply of bulk treated water and the rehabilitation, expansion, operation and maintenance of certain water facilities, with an estimated project cost of Pesos 2.8 billion (US$59.6 million).

24 First Pacific Company Limited
Review of Operations – MPIC
On 27 May 2016, Beacon Electric, through its wholly-owned entity, Beacon Powergen Holdings, Inc. (“Beacon Powergen”) acquired a 56% interest in GBPC for a total consideration of Pesos 22.1 billion (US$470.2 million) of which half was paid in cash and the remaining half in vendor finance to be settled through a 10-year fixed interest rate peso denominated loan.
On 30 May 2016, MPIC acquired an additional 25.0% interest in Beacon Electric from PLDT’s subsidiary PCEV for a consideration of Pesos 26.2 billion (US$557.4 million). MPIC has paid Pesos 17.0 billion (US$361.7 million) in cash to PCEV upfront and the balance of Pesos 9.2 billion (US$195.7 million) to be settled in annual installments until June 2020.
On 16 June 2016, MWIC acquired a 65.0% interest in ESTII for a total consideration of Pesos 1.8 billion (US$38.3 million). ESTII’s core businesses are related to wastewater and sewage treatment plant facilities.
On 29 July 2016, MPHHI completed the acquisition of a 93.0% interest in MVMC for a total consideration of Pesos 993 million (US$21.1 million). MVMC is a prominent tertiary hospital in Marikina with 140 beds, its newly built 7-storey Medical Arts Building has 44 clinics for MVMC’s more than 270 accredited doctors.
Equity PlacementOn 27 May 2016, MPIC raised Pesos 22.0 billion (US$467.2 million) new equity by placing 3.6 billion of new shares to GT Capital. The funds were primarily used for the acquisition of an additional 25% interest in Beacon Electric from PCEV and the acquisition of a 56% interest in GBPC by Beacon Electric. GT Capital also acquired another 1.3 billion shares of MPIC from MPHI which brings its economic interest in MPIC to 15.6%.
PowerMeralco operates a franchise that runs until 2028 for electricity distribution to a region that produces over half of the Philippines’ gross domestic product.
Meralco’s operating performance was strong during the period, driven by sustained economic growth and robust consumer demand resulting from low inflation, interest rates and fuel prices. The volume of electricity sold rose 11% to 19,717 GWh, with residential, commercial and industrial demand recording 17%, 11% and 6% increases, respectively.
Natural gas accounted for 46% of Meralco’s total fuel sources, followed by coal at 37%. The remaining 17% included hydro, geothermal and biomass sources.
System loss was further reduced to 6.46% at end-June 2016 from 6.60% a year earlier, reflecting Meralco’s continuing investment in operating efficiencies. Capital expenditure declined 14% to Pesos 4.5 billion (US$95.7 million) during the transition to a new regulatory period. On 15 June 2016, Meralco received approval from the Energy Regulatory Commission of Pesos 15.5 billion (US$329.8 million) for capital expenditure on system quality and various power station expansion projects.
Revenues decreased 4% to Pesos 128.8 billion (US$2.7 billion), mainly reflecting a 9% decrease in the average distribution rate and lower pass-through charges despite the higher availability of Meralco’s contracted power plants. The decline eroded the positive impact of an 11% growth in energy sales, a 4% increase in number of customers and an 8% rise in non-electricity revenues.
During the period, MPIC added GBPC to its power generation portfolio through Beacon Electric. GBPC is a holding company, through its subsidiaries, is a leading power producer in the Visayas region and Mindoro Island with current generation capacity of 702 MW, an additional 150 MW is expected to commence operation this year, of which 70 MW is contracted to Meralco. Its fuel sources are coal and diesel.
In the first half of 2016, GBPC’s electricity sold rose 4% to 1,787 GWh. Revenues declined 5% to Pesos 8.5 billion (US$180.9 million) reflecting lower market prices, partly offset by lower fuel and other pass-through costs.
Meralco PowerGen Corporation (“Meralco PowerGen”), Meralco’s wholly-owned power generation subsidiary, is developing several power projects with a total planned capacity of over 3,000 MW through San Buenaventura Power, Redondo Peninsula Energy, Atimonan One Energy, St. Raphael Power and Mariveles Power. It also has investments in GBPC’s power assets and the PLP power plant in Singapore.
Interim Report 2016 25
MPI
CWaterMaynilad is the biggest water utility in the Philippines. It operates a concession that runs until 2037 for water distribution and sewerage services for the West Zone of Metro Manila.
During the period, Maynilad’s average non-revenue water fell to 29.3% from 32.3%. Revenues rose 8% to Pesos 10.1 billion (US$214.9 million), reflecting a 4% increase in billed water volume to 247.6 million cubic meters, a 5% increase in billed customers to 1.3 million and a 5% increase in inflationary adjustment. Core income declined 25% to Pesos 3.6 billion (US$76.6 million), resulting from the expiration of an income tax holiday.
Maynilad’s water tariff under the rate rebasing for the period from 2013 to 2017 received a favorable award in arbitration proceedings on 29 December 2014. However, the Metropolitan Waterworks and Sewerage System (“MWSS”) of the Philippines has not yet acted on the arbitration award. Maynilad continues the arbitration process, and a new hearing is expected to take place in December 2016. Despite the subsequent delay in the tariff increase it is entitled to, Maynilad remains committed to providing affordable, clean and safe water to its customers, and continues to invest in wastewater treatment facilities.
The investment in ESTII allows MPIC to diversify its water-related investment and invest in the high-growth wastewater engineering procurement and construction (“EPC”) and operations and maintenance (“O&M”) market.
Toll RoadsMPTC operates NLEX, CAVITEX, SCTEX and the Subic Freeport Expressway in the Philippines, and has investments in DMT in Thailand and CII B&R in Vietnam. The concession for NLEX runs until 2037, for CAVITEX until 2033 for the original toll road and to 2046 for its extension, for SCTEX until 2043, for DMT until 2034 and for CII B&R and various roads and bridges ranging from 2018 to 2034.
During the period, revenues rose 27% to Pesos 5.9 billion (US$125.5 million), reflecting strong traffic growth on the NLEX and CAVITEX and the inclusion of SCTEX.
Capital expenditure increased 26% to Pesos 2.4 billion (US$51.1 million) mainly reflecting the cost of integrating SCTEX with NLEX which was completed in March 2016, Segments 2 and 3 of NLEX road widening project with target completion by 2016 and the construction of Segment 10 of the NLEX Harbour Link with completion planned in 2017.
In the Philippines, the integration of SCTEX with NLEX was completed in March 2016. The construction of the CAVITEX C5 South Link is expected to be completed in 2019, while it would be in 2020 for Cavite-Laguna Expressway (“CALAX”) and the Cebu-Cordova Bridge, and in 2021 for NLEX Citi Link.
For the Connector Road with estimated project cost of Pesos 17.5 billion (US$371.9 million), there was no comparative bid submitted during the “Swiss Challenge” process, MPTC is expected to receive the award of the project during 2016.
In Vietnam, CII B&R expects to complete the construction of the first 37-kilometer section of its 53-kilometer toll roads this year and by 2018 for the remaining 16-kilometer section.
HospitalsMPIC’s Hospital group comprises 12 full-service hospitals and MegaClinic, a mall-based diagnostic and surgical center, and has indirect ownership in two healthcare colleges. MPIC is the largest private provider of premier hospital services in the Philippines with approximately 2,800 beds as at end-June 2016.
Revenues rose 25% to Pesos 9.3 billion (US$197.9 million), reflecting higher contribution from all of its operating units. The number of out-patients rose 31% to 1.3 million and in-patients rose 25% to 73,416.
The Hospital division plans to expand its portfolio to 5,000 beds. Current priorities include implementing synergies across its hospital network, expanding capacity and enhancing facilities of its existing hospitals, establishing a central laboratory for the Hospitals division and improving healthcare delivery.
RailLRMC commenced operation of LRT1, its first rail project, in September 2015, in a concession which runs until 2047. During the period, it recorded revenues of Pesos 1.5 billion (US$31.9 million). LRT1’s average daily ridership for the period was at 405,568.

26 First Pacific Company Limited
Review of Operations – MPIC
In February 2016, LRMC signed a Pesos 24.0 billion (US$510.6 million) loan facility for the LRT1 project, of which Peso 15.3 billion (US$325.5 million) is for the construction of the Cavite Extension while the remaining is for the rehabilitation of the existing LRT1 system. Since takeover in September 2015, 14 LRV were restored which increased the total number of LRV in operation to 91.
Projects for rail replacement, lining and leveling are progressing as scheduled and are expected to be completed by 2017. Other ongoing enhancement projects involve various improvements for stations and depots, the unification of the central station and preparations for the Grantor’s delivery of the right of way for the Cavite Extension.
MPIC is working on the re-submission of proposals for MRT3 rail line as requested by the new Administration of the Philippine Government.
As at 30 June 2016, there were approximately 2.1 million Automated Fare Collection System’s beep™ cards registered for use on LRT1, LRT2 and MRT3 network. AFPI successfully created an integrated contactless payment solution for its rail network. AFPI has expanded the use of the beep™ cards in certain bus lines in Metro Manila and recently, the CAVITEX on a trial basis. AFPI expects to further expand usage of the beep™ cards in the public transport sector, toll roads and retail establishments.
2016 OutlookThe arrival into power of a new business-friendly Administration in the Philippine Government is expected to result in better prospects for resolution of the many continuing tariff disputes involving MPIC businesses. Continuing strong economic growth is lifting revenues at all businesses while Management’s enduring vigilance over costs and efficiency is feeding directly to the bottom line. In all, the outlook for the MPIC group of companies is for stronger earnings in 2016, creating a stable foundation for further growth and investment.
Reconciliation of Reported Results Between MPIC and First PacificMPIC’s operations are principally denominated in peso, which averaged Pesos 47.00 (1H15: Pesos 44.51) to the U.S. dollar. Its financial results are prepared under Philippine GAAP and reported in peso. First Pacific’s financial results are prepared under Hong Kong GAAP and reported in U.S. dollars. Philippine GAAP and Hong Kong GAAP are largely based on IFRSs, however, certain adjustments need to be made to MPIC’s reported peso results to ensure full compliance with Hong Kong GAAP. An analysis of these adjustments follows. For the six months ended 30 June 2016 2015Peso millions Net income under Philippine GAAP 6,980 5,563Preference dividends(i) (3) (1) Net income attributable to common shareholders 6,977 5,562Differing accounting and presentational treatments(ii)
– Reclassification of non-recurring items (213) 357– Others (31) 35
Adjusted net income under Hong Kong GAAP 6,733 5,954Foreign exchange and derivative gains(iii) (123) (37) MPIC’s net income as reported by First Pacific 6,610 5,917 US$ millions Net income at prevailing average rates for
1H16: Pesos 47.00 and 1H15: Pesos 44.51 140.6 132.9Contribution to First Pacific Group profit, at an average shareholding of
1H16: 50.0% and 1H15: 52.5% 70.2 69.8 (i) First Pacific presents net income after deduction of preference dividends.(ii) Differences in accounting treatment under Philippine GAAP, compared with Hong Kong GAAP, and other presentational differences. The principal adjustment includes:
– Reclassification of non-recurring items: Certain items, through occurrence or size, are not considered usual operating items which are reallocated and presented separately. Adjustment for 1H16 of Pesos 213 million principally represents Pesos 545 million of reversal of net deferred tax liabilities for future related to Maynilad following a reassessment and Pesos 121 million of reversal of provision for liabilities, partly offset by Pesos 453 million of project expenses. Adjustment for 1H15 of Pesos 357 million principally represents project expenses.
(iii) To illustrate the underlying operational results and profit contributions, foreign exchange and derivative gains (net of related tax) are excluded and presented separately.
Interim Report 2016 27
FPW
/Goo
dman
Fie
lder
FPW contributed a profit of US$7.2 million to the Group (1H15: 6.4 million). The 13% increase in profit contribution reflected six months of contribution in the period versus three months in the first half of 2015, partly offset by a 5% depreciation of the average Australian dollar exchange rate against the U.S. dollar.
During the period, Goodman Fielder recorded core net income of A$20.7 million (US$15.2 million), sales of A$953.3 million (US$701.0 million), normalized EBIT at A$57.5 million (US$42.3 million) and EBIT margin at 6.0%. Capital expenditure decreased 61% to A$35.2 million (US$25.9 million).
International BusinessPapua New Guinea’s market leadership for the flour and snack categories continued in the period, as sales volume of GF Pro Bakers Flour and Meadow Fresh UHT milk introduced in late 2015 remained strong, while sales volume of Flame Stock Feed rose 19%.
In Fiji, sales of poultry, snack foods and ice cream products remained strong and grew by 12%. In China, sales volume of UHT milk rose 48% to 8,670 million liters. Sales volumes of UHT milk also grew in PNG, Fiji, Vietnam and Malaysia. However, the positive impact from higher sales volume was offset by the depreciation of the Papua New Guinean Kina and the Renminbi against the U.S. dollar.
With the milk facility expansion at Christchurch in New Zealand completed in late 2015, Goodman Fielder’s export volumes of its Meadow Fresh UHT milk to Southeast Asia rose approximately 50% during the period. In addition to UHT milk, Goodman Fielder is working on increasing exports of its dairy creams, yogurts, butter and cheese products to the foodservice and retail markets across China and South East Asia.
New Zealand BusinessPuhoi Valley premium organic milk and flavored milk were launched in late 2015 and recorded strong performance in the period. In March 2016, Puhoi Valley Kawau Blue was named the best cheese at the New Zealand Champion of Cheese awards. Puhoi Valley also won the washed rind cheese category with their cellar range washed rind winning a perfect score of 100 from the judges. Puhoi Valley’s Fresh Goat cheese made Cheese awards history by becoming the first goat cheese to win the Champion Export Cheese Award. It has only been exported since the end of 2015. Baking products sales volume and prices remained under pressure due to continuing price constraints.
The expanded UHT milk facility at Christchurch increased Goodman Fielder’s efficiency and production capacity, while lower raw milk prices eroded the margin of its dairy products.
Continued sales to large retail customers of fresh white milk during the period has assisted with Dairy margins. The New Zealand business is focusing on a number of cost-out initiatives.
Australia BusinessIn Australia, the reassessment of logistics arrangements carried out by the new management has begun showing positive results. During the period, costs in relation to logistics were reduced by approximately 15%, and the local business was stabilized period-on-period. Praise, Australia’s most popular salad dressing and mayonnaise brand, continues to maintain strong market share.
The June 2016 closing of a bread manufacturing facility in Tamworth will allow Goodman Fielder to move production to facilities in Sydney and Canberra.
FPW /

28 First Pacific Company Limited
Review of Operations – FPW/Goodman Fielder
New product initiatives are being launched to drive sales growth. For example, the introduction of White Wings ‘Cake in a Cup’ in May 2016, which is focused on convenience snacking, has generated strong volume growth with an expected annualized net sales value growth of A$3.0 million (US$2.2 million) for the home baking category.
Debt ProfileAs at 30 June 2016, Goodman Fielder’s net debt stood at A$457.2 million (US$340.7 million) with maturity ranging from 2016 to 2020, and 31% of total borrowings were at fixed rate. Fixed rate borrowings are drawn in U.S. dollars and hedged to A$167.9 million. In addition, Australian dollar and New Zealand dollar borrowings are funded by a diverse panel of domestic and international banks.
2016 OutlookAfter 15 months of new management at Goodman Fielder, the outlook is more positive than it has been in recent years. Recent management initiatives to improve operating efficiencies and cost structures are expected to lift profitability for the second half of this year. An increased capital expenditure budget is also planned to support growth opportunities and various management initiatives. These investments will improve the manufacturing footprint with enhanced scale in key growth markets and categories, and support the business for longer-term, sustainable growth.
Reconciliation of Reported Results Between FPW/Goodman Fielder and First PacificGoodman Fielder’s operations are principally denominated in A$, which averaged A$1.360 (April to June 2015: A$1.287) to the U.S. dollar. Its financial results are prepared under Australian GAAP and reported in A$. First Pacific’s financial results are prepared under Hong Kong GAAP and reported in U.S. dollars. Australian GAAP and Hong Kong GAAP are largely based on IFRSs, however, certain adjustments need to be made to Goodman Fielder’s reported A$ results to ensure full compliance with Hong Kong GAAP. An analysis of these adjustments follows.
For the six months ended 30 June 2016
For the three months ended 30 June 2015
A$ millions Goodman Fielder’s net income under Australian GAAP 10.5 9.4Differing accounting and presentational treatments(i)
– Reclassification of non-recurring items 10.8 9.8 Adjusted Goodman Fielder’s net income under Hong Kong GAAP 21.3 19.2Foreign exchange and derivative (gains)/losses(ii) (0.6) 0.2 Adjusted Goodman Fielder’s net income 20.7 19.4Differing accounting and presentational treatments(i)
– Acquisition accounting (1.1) (3.1) Adjusted FPW’s net income as reported by First Pacific 19.6 16.3 US$ millions Net income at prevailing average rate for
1H16: A$1.360 and April to June 2015: A$1.287 14.4 12.7Contribution to First Pacific Group profit, at an average shareholding of
1H16: 50.0% and April to June 2015: 50.0% 7.2 6.4 (i) Differences in accounting treatment under Australian GAAP, compared with Hong Kong GAAP, and other presentational differences. The principal adjustments include:
– Reclassification of non-recurring items: Certain items, through occurrence or size, are not considered usual operating items which are reallocated and presented separately. Adjustment for 1H16 of A$10.8 million principally represents write-off of deferred tax assets related to prior years of A$6.3 million, site closure costs of A$2.8 million and project expenses of A$1.7 million. Adjustment for April to June 2015 of A$9.8 million principally represents losses arising from unwinding cross currency interest rate swaps of A$8.0 million after the early settlement of related debts following a change in control of Goodman Fielder and change of control related expenses of A$0.5 million (which are pre-acquisition in nature and hence eliminated at First Pacific level) and manpower rightsizing costs of A$1.3 million.
– Acquisition accounting: A fair value assessment was performed at the date of acquisition of Goodman Fielder and certain revaluation increment adjustments have been made to its property, plant and equipment and inventories. The adjustments principally relate to recognition of additional depreciation based on the fair value of its property, plant and equipment and the reversal of the revaluation increment adjustment made to Goodman Fielder’s inventories at the date of acquisition into its post-acquisition cost of sales.
(ii) To illustrate the underlying operational results and profit contributions, foreign exchange and derivative gains/losses (net of related tax) are excluded and presented separately.

Interim Report 2016 29
Phile
x
Philex’s natural resources portfolio as at 19 August 2016 comprises:
Philex for metal-related assets 100% in Padcal mine 100% in Silangan Mindanao Exploration Co., Inc. (“SMECI”) 100% in Silangan Mindanao Mining Co., Inc. 99.3% in Lascogon Mining Corporation 100% in Philex Gold Philippines, Inc. 5% in Kalayaan Copper Gold Resources, Inc.
PXP Energy Corporation (“PXP”)*, formerly Philex Petroleum Corporation, for energy-related assets 53.4% Pitkin Petroleum Limited which owns oil and gas exploration assets in Peru Block Z-38 58.2%† in Forum Energy Limited (“Forum”) which owns 70.0% of Service Contract (“SC”) 72, currently in the exploration stage
and a 2.3% interest in the Galoc oil field (SC 14C-1) which is in the production stage, both of these assets are located in the West Philippine Sea
50.0% in SC 75 and 70.0% in SC 74, both located in Northwest Palawan
* 19.8% held by Philex, 25.0% held by First Pacific and 7.7% held by Two Rivers Pacific Holdings Corporation, a Philippine affiliate of First Pacific.† 48.8% held directly by PXP, 18.4% held by its 51.2%-owned Canadian subsidiary FEC Resources, Inc., and 3.3% held by First Pacific.
Philex’s contribution to the Group increased 55% to US$4.5 million (1H15: US$2.9 million) on the strength of lower production costs and expenses, as well as higher gold prices. These positive factors were partly offset by lower volumes of metal sold and lower copper prices. The average realized price for gold rose 6% to US$1,263 per ounce (1H15: US$1,190 per ounce), while the average realized copper price fell 18% to US$2.14 per pound (1H15: US$2.61 per pound), the lowest level since 2005.
Gold production decreased 8% to 49,589 ounces (1H15: 53,689 ounces) due to lower gold grades, while copper production increased 3% to 17.3 million pounds (1H15: 16.9 million pounds) as a result of higher tonnage milled. The efforts to increase metal output from the second quarter of 2016 resulted in higher tonnage. The improved production in the second quarter of 2016 was driven by improved equipment efficiency and better ore grades, particularly in June 2016, as new draw points started to deliver higher grades. Gold grade averaged 0.436 gram/tonne in June compared with an average of 0.406 gram/tonne for the period. Copper grades were also higher in June at 0.215% against 0.206% average for the period.

30 First Pacific Company Limited
Review of Operations – Philex
During the period, Philex retired US$6.5 million of outstanding short-term debts. As at 30 June 2016, it had Pesos 349 million (US$7.4 million) of cash and cash equivalents and Pesos 9.4 billion (US$200.2 million) of borrowings comprising convertible notes issued by SMECI and short-term bank loans.
Core net income up 49% to Pesos 774 million (US$16.5 million) from Pesos 520 million (US$11.7 million)
reflecting a higher production of copper and increase in gold prices lower operating costs and expenses through cost management initiatives
Net income up 28% to Pesos 779 million (US$16.6 million) from Pesos 607 million (US$13.6 million)
reflecting higher core net income
Revenue flat at Pesos 4.8 billion (US$102.1 million) from Pesos 4.8 billion (US$107.8 million) (restated)
reflecting higher output of copper which was offset by an 18% decline in prices a 6% improvement in gold price was offset by lower ore grade of gold and metal recovery revenues from gold, copper and silver contributed 62%, 37% and 1% of the total,
respectively
EBITDA up 14% to Pesos 1.7 billion (US$36.2 million) from Pesos 1.5 billion (US$33.7 million)
reflecting lower operating expenses through cost management initiatives
Operating cost per tonne of ore milled down 11% to Pesos 741 (US$15.8) from Pesos 830 (US$18.6)
arising from continued organizational optimization initiatives with comparatively lower total cost allocated over higher tonnage
Capital expenditure (including exploration costs) down 51% to Pesos 1.2 billion (US$25.5 million) from Pesos 2.5 billion (US$56.2 million)
reflecting lower capital expenditure for Silangan project due to the near completion of the feasibility study
The mine life of Philex’s major operating metal asset Padcal mine was extended to 2022 in October 2015 with additional resources and reserves declared. The maiden inferred resource estimate from the Bumolo exploration increases the likelihood of further extension of Padcal’s mine life. Additional work is required to further identify the quality and quantity of the initial findings.
Property DividendOn 29 February 2016, Philex’s Board of Directors approved a property dividend of record as at 15 March 2016, in which every 100 shares of Philex will be entitled to receive 17 shares of PXP. Philex’s registered shareholders in the U.S. received the equivalent property dividend in the form of cash. The transaction was completed with Philex’s shareholding in PXP declining by 45.0% to 19.8%, and First Pacific and its Philippine affiliate Two Rivers Pacific Holdings Corporation’s economic interest increasing to 25.0% and 7.7%, respectively. Subsequently, PXP will be deconsolidated from Philex.
Interim DividendWith the significantly improved first half results, Philex’s Board of Directors declared on 27 July 2016 an interim dividend of Peso 0.03 (U.S. 0.064 cent) per share payable on 24 August 2016 to shareholders on record as of 10 August 2016.
Silangan ProjectThe gold copper mine development project is located in Surigao del Norte, Northeastern Mindanao in the Philippines. The project has secured all major permits including environmental compliance certification for surface mining and approval by the Department of Environment and Natural Resources of the amended Declaration of Mining Project Feasibility for surface mining. The project’s definitive feasibility study is under peer review by third-party consultants with targeted completion by early 2017. Meantime, community development and environment enhancement programs are ongoing while the feasibility study is progressing.

Interim Report 2016 31
Phile
xMineral Resources and Proved ReservesListed below are the mineral resources and proved reserves of the Padcal mine and the mineral resources of the Silangan project based on the most recent data:
Silangan Project (as at 5 August 2011)
Padcal mine(As at 31 December 2015*) Boyongan Bayugo
Resources (million tonnes) 258(i) 273(i) 125(i)
Gold (gram/tonne) 0.37 0.72 0.66Copper (%/tonne) 0.20 0.52 0.66
Contained copper (thousand lbs) 1,172,400 3,120,000 1,820,000Contained gold (ounces) 3,036,200 6,300,000 2,700,000Copper equivalent(ii) cutoff (%) 0.314 – –Copper equivalent cutoff (%) 0.50 0.50 Proved reserves (million tonnes) 69.7
Gold (gram/tonne) 0.41Copper (%/tonne) 0.20
Recoverable copper (thousand lbs) 255,300Recoverable gold (ounces) 726,300Copper equivalent(ii) cutoff (%) 0.370 * Based on the Competent Person’s report disclosed in March 2016(i) Measured and indicated(ii) Copper equivalent = % copper + 0.66 x gram/tonne gold; Metal prices: US$2.75/lb copper, US$1,275/oz gold; Metal recoveries: 82% copper, 80% gold
PXPDuring the period, petroleum revenues declined 29% to Pesos 59 million (US$1.3 million) (1H15: Pesos 83 million (US$1.9 million)) as a result of lower crude oil prices and lower output in the Galoc oil field. Costs fell 50% to Pesos 90 million (US$1.9 million) (1H15: Pesos 179 million (US$4.0 million)) because of cost cutting initiatives and lower production.
SC72The property covered by SC 72 is located in Reed Bank (Rector Bank) which lies within the Philippines’ Exclusive Economic Zone (“EEZ”) as defined under the United Nations Convention on the Law of the Sea (“UNCLOS”). Its second sub-phase of exploration activities is currently suspended due to a force majeure imposed since 15 December 2014.
On 12 July 2016, the Permanent Court of Arbitration made a favorable decision confirming that PXP’s service contracts, particularly SC 72, are within the Philippine’s EEZ. PXP, through Forum, will take guidance from the Philippine Government in respect of any future activity in SC 72 and other areas covered by the Tribunal’s decision.
2016 OutlookOn current trends, the operational results at the Padcal mine will be stronger than in 2015, though the uncertainty over future metal prices, particularly for copper, brings uncertainty to the anticipated full-year results. The improved price for gold, however, has been favorable in the first half and Philex aims to take full advantage of a sustained trend by ramping up production from June. Continuing exploration in the vicinity of the Padcal mine is anticipated to deliver further results in the course of the second half of 2016. It is also expected that the peer review of the Silangan Project’s definitive feasibility study will be finished by early 2017.

32 First Pacific Company Limited
Review of Operations – Philex
Reconciliation of Reported Results Between Philex and First PacificPhilex’s operations are principally denominated in peso, which averaged Pesos 47.00 (1H15: Pesos 44.51) to the U.S. dollar. Its financial results are prepared under Philippine GAAP and reported in peso. First Pacific’s financial results are prepared under Hong Kong GAAP and reported in U.S. dollars. Philippine GAAP and Hong Kong GAAP are largely based on IFRSs, however, certain adjustments need to be made to Philex’s reported peso results to ensure full compliance with Hong Kong GAAP. An analysis of these adjustments follows. For the six months ended 30 June 2016 2015Peso millions Net income under Philippine GAAP 779 607Differing accounting and presentational treatments(i)
– Reclassification of non-recurring items – (107)– Revenue recognition regarding sale of mine products (105) 6– Depreciation of revaluation increment of assets (120) (153)– Others (91) (89)
Adjusted net income under Hong Kong GAAP 463 264Foreign exchange and derivative (gains)/losses(ii) (5) 20 Philex’s net income as reported by First Pacific 458 284 US$ millions Net income at prevailing average rates for
1H16: Pesos 47.00 and 1H15: Pesos 44.51 9.7 6.4Contribution to First Pacific Group profit, at an average shareholding of
1H16: 46.2% and 1H15: 46.2% 4.5 2.9 (i) Differences in accounting treatments under Philippine GAAP, compared with Hong Kong GAAP, and other presentational differences. The principal adjustments
include:– Reclassification of non-recurring items: Certain items, through occurrence or size are not considered usual operating items which are reallocated and presented
separately. Adjustment for 1H15 of Pesos 107 million represents a gain on sale of available-for-sale assets.– Revenue recognition regarding sale of mine products: Philex recognizes revenue based on the production of mine products. HKAS 18 “Revenue” requires the
recognition of revenue based on the satisfaction of certain conditions, which includes the transfer of significant risks and rewards of ownership of the products to the buyers and the absence of continuing managerial involvement to the degree usually associated with ownership and effective control over the products sold.
– Depreciation of revaluation increment of assets: A fair value assessment was performed at the date of acquisition of Philex and certain revaluation increment adjustments have been made to its property, plant and equipment. The adjustment relates to the recognition of additional depreciation based on the revalued fair value of these property, plant and equipment over the remaining life of the mine.
– Others: The adjustments principally relate to accrual of withholding tax on Philex’s net income in accordance with the requirements of HKAS 12 “Income Taxes” and the adjustments for the Group’s direct share of PXP results.
(ii) To illustrate the underlying operational results and profit contributions, foreign exchange and derivative gains/losses (net of related tax) are excluded and presented separately.

Interim Report 2016 33
FPM
Pow
er/P
LP
First Pacific through a 60/40-owned entity with Meralco PowerGen holds a 70% interest in PLP. PLP is the first power plant in Singapore fully fueled by liquefied natural gas, equipped with efficient facilities for power generation. The plant’s fuel is provided by BG Group under a long-term agreement until 2024 through SLNG Terminal developed by the Singaporean Government. Its combined cycle combustion turbine power plant consists of two 400 gross megawatts natural gas-fired turbines with net capacity of 781 megawatts. PLP launched commercial operations of the power plant on 1 February 2014.
First Pacific’s share of FPM Power’s loss widened by 45% to US$10.9 million (1H15: US$7.5 million), reflecting a lower contribution from the retail market, non-recognition of deferred tax credits arising from tax losses and capital allowances and a long outage of the plant in January 2016 and four incidents of forced outages in the period. This was slightly offset by a 2% depreciation of the average Singapore dollar exchange rate against the U.S. dollar.
During the period, the volume of electricity sold rose 19% to approximately 2,353 gigawatt hours (1H15: 1,983 gigawatt hours), of which 98% was for retail, futures, contracts for difference and vesting contracts and the remaining 2% for merchant market sales. PLP’s generation market share for the period was approximately 8.4%.
Core net loss up 53% to S$57.1 million (US$41.5 million) from S$37.3 million (US$27.6 million)
reflecting a lower contribution from the retail market lower oil prices resulting in lower average selling prices per unit of electricity one long outage and four incidents of forced outages in the period non-recognition of deferred tax credits arising from tax losses and capital allowances slightly offset by a 2% depreciation of the average Singapore dollar exchange rate against
the U.S. dollar
Net loss up 38% to S$54.9 million (US$39.9 million) from S$39.8 million (US$29.5 million)
reflecting higher core net loss the recognition of provision for onerous contracts as non-recurring losses partly offset by a foreign exchange gains on US$ denominated shareholders’ loans
compared with a loss in the first half of 2015
Revenues down 19% to S$356.5 million (US$259.3 million) from S$439.2 million (US$325.1 million)
reflecting a 34% decrease in average selling prices due to lower fuel costs and intense competition as a result of lower oil prices, despite higher volume of electricity generated and sold
Operating expenses down 4% to S$11.5 million (US$8.4 million) from S$12.0 million (US$8.9 million)
reflecting savings achieved in operating expenses
EBITDA at a loss of S$2.8 million (US$2.0 million) from a profit of S$6.1 million (US$4.5 million)
reflecting lower contribution from retail and pool market due to intense competition partly offset by reduction in fixed costs
FPM Power/

34 First Pacific Company Limited
Review of Operations – FPM Power/PLP
Debt ProfileAs at 30 June 2016, FPM Power’s net debt stood at US$506.5 million while gross debt stood at US$548.6 million with 7% maturing within one year and the remaining debts maturing from 2018 up to 2021. All of the borrowings were floating-rate bank loans, with 97% effectively changed to fixed rates through interest rate swap arrangements.
2016 OutlookContinuing low crude oil prices and strong competition in the Singapore market will put pressure on profitability in 2016 and beyond.
Reconciliation of Reported Results Between FPM Power/PLP and First PacificPLP’s operations are principally denominated in S$, which averaged S$1.375 (1H15: S$1.351) to the U.S. dollar. Its financial results are prepared under Singapore GAAP and reported in S$. First Pacific’s financial results are prepared under Hong Kong GAAP and reported in U.S. dollars. Singapore GAAP and Hong Kong GAAP are largely based on IFRSs, however, certain adjustments need to be made to PLP’s reported S$ results to ensure full compliance with Hong Kong GAAP. An analysis of these adjustments follows. For the six months ended 30 June 2016 2015S$ millions PLP’s net loss under Singapore GAAP (54.9) (39.8)Differing accounting and presentational treatments(i)
– Reclassification of non-recurring items 12.1 –– Intra-group elimination for consolidation accounting 22.5 15.1– Amortization of vesting contract (0.9) (0.9)– Others 0.2 0.3
Adjusted PLP’s net loss under Hong Kong GAAP (21.0) (25.3)Foreign exchange and derivative (gains)/losses(ii) (14.3) 2.5 Adjusted PLP’s net loss (35.3) (22.8) US$ millions Net loss at prevailing average rates for
1H16: S$1.375 and 1H15: S$1.351 (25.7) (16.9) FPM Power’s share of PLP’s net loss, at an average shareholding of
1H16: 70.0% and 1H15: 70.0% (18.0) (11.8)Adjusted FPM Power head office’s net loss(iii) (0.2) (0.7) Adjusted FPM Power’s net loss as reported by First Pacific (18.2) (12.5)First Pacific Group’s share of loss, at an average shareholding of
1H16: 60.0% and 1H15: 60.0% (10.9) (7.5) (i) Differences in accounting treatments under Singapore GAAP, compared with Hong Kong GAAP, and other presentational differences. The principal adjustments
include:– Reclassification of non-recurring items: Certain items, through occurrence or size, are not considered usual operating items which are reallocated and presented
separately. Adjustment for 1H16 of S$12.1 million represents provision for onerous contracts.– Intra-group elimination for consolidation accounting: Intra-group transactions between FPM Power and PLP are eliminated upon FPM Power’s consolidation
accounting. The principal consolidation adjustments include elimination of shareholders loans interest expenses and management service fee.– Amortization of vesting contract: A fair value assessment was performed at the date of acquisition of PLP and the fair value of PLP’s vesting contract entered with
the regulator in the respect of the supply of electricity has been measured and recognized as an intangible asset. The adjustment relates to the amortization of the carrying amount of the vesting contract.
(ii) To illustrate the underlying operational results and profit contributions, foreign exchange and derivative gains/losses (net of related tax) are excluded and presented separately.
(iii) Adjusted FPM Power head office’s net loss for 1H16 excludes foreign exchange and derivative gains (net of related tax) of US$8.0 million (1H15: foreign exchange and derivative losses (net of related tax) of US$2.4 million).

Interim Report 2016 35
FP N
atur
al R
esou
rces
/RH
I/FCM
I
Disposal and Additional InvestmentOn 18 February 2016, FP Natural Resources sold its entire 14.8% interest in Victorias Milling Company, Inc. (“VMC”) to VMC and LT Group in two transactions for a total consideration of approximately Pesos 2.2 billion (US$46.0 million). The proceeds raised were used to participate in RHI’s rights issue and invest in FCMI.
On 18 May 2016, FP Natural Resources and its Philippine affiliate First Agri Holdings Corporation increased their economic interest in RHI to 59.7% from 50.8% for a consideration of Pesos 1.1 billion (US$23.4 million) by participating in RHI’s rights issue.
Review of OperationsFirst Pacific and its indirect agribusiness subsidiary IndoAgri, through a 70/30-owned entity FP Natural Resources and a Philippine affiliate have an aggregate 59.7% interest in RHI and 100.0% in FCMI.
RHI is the leading sugar milling operator and the biggest ethanol producer in the Philippines, and FCMI engages in crushing of copra, and refining coconut oil and production of crude coconut oil in the Philippines.
During the period, FP Natural Resources’ contribution to the Group decreased 82% to US$0.2 million (1H15: US$1.1 million). RHI recorded a core net income of Pesos 197 million (US$4.2 million) despite higher material costs for sugar and ethanol production, and decline in sales of premium raw sugar, while FCMI recorded a core net loss of Pesos 70 million (US$1.5 million).
Together with its associate Hawaiian-Philippine Company, Inc. (“HPC”), RHI is one of the largest raw sugar producers in the Philippines, accounting for 17% of the Philippines’ raw sugar production. It has three sugar mills, one in Batangas and two in Negros Occidental, with combined milling capacity of 34,500 tonnes of sugar cane per day. Its refinery facility in Batangas has capacity of 18,000 Lkg per day. RHI also has two ethanol plants in Negros Occidental with daily production capacity of 285,000 liters.
During the period, RHI sold 1.4 million Lkg of refined sugar (1H15: 1.1 million Lkg), 1.1 million Lkg of raw sugar (1H15: approximately 538,000 Lkg), 50,279 Lkg of premium raw sugar (1H15: approximately 200,000 Lkg) and 39.0 million liters of ethanol (1H15: 29.5 million liters) in the Philippines.
Core net income down 33% to Pesos 215 million (US$4.6 million) from Pesos 320 million (US$7.2 million)
principally due to higher cost of sugar cane, extended facility upgrade for ethanol, and higher interest expense due to a higher debt level
continued shortage in supply of sugar cane in the Philippines earlier commencement of off-season maintenance activities in 2016 partly offset by a 34%, 101% and 32% increase in sales volume of refined sugar, raw
sugar and ethanol, respectively, and higher average selling prices of all products
Reported net income down 38% to Pesos 197 million (US$4.2 million) from Pesos 320 million (US$7.2 million)
reflecting a lower core net income
Revenue up 43% to Pesos 7.8 billion (US$164.9 million) from Pesos 5.4 billion (US$121.3 million)
mainly driven by improved sales volumes and higher average selling prices of sugar and ethanol
FP Natural Resources/
/

36 First Pacific Company Limited
Review of Operations – FP Natural Resources/RHI/FCMI
Operating expenses down 18% to Pesos 456 million (US$9.7 million) from Pesos 559 million (US$12.6 million)
reflecting cost control initiatives and lower taxes the consolidation of SCBI’s six months of operating expenses while it was two months in
the first half of 2015
EBITDA down 3% to Pesos 873 million (US$18.6 million) from Pesos 904 million (US$20.3 million)
reflecting higher cost of cane for sugar and extended facility upgrade for ethanol earlier commencement of off-season maintenance activities in 2016 partly offset by the higher average selling prices of all products and higher volumes of
refined sugar, raw sugar and alcohol
EBITDA margin down to 11.3% from 16.7%
due to lower EBITDA
Debt ProfileAs at 30 June 2016, long-term debt of RHI stood at Pesos 4.0 billion (US$84.8 million) with maturities ranging from two to eight years at an annual interest of approximately 4.5%. Short-term debt stood at Pesos 5.1 billion (US$108.7 million) with an average interest of approximately 3.2%.
2016 OutlookHigh production costs are expected for the remainder of 2016. RHI’s profitability will be slightly boosted with improved competitiveness in attracting cane supply from independent sugar farmers, improved production efficiency resulting from capital investments, and higher average prices of raw and refined sugar, and higher sales of ethanol.
Reconciliation of Reported Results Between FP Natural Resources/RHI/FCMI and First PacificRHI’s operations are principally denominated in peso, which averaged Pesos 47.00 (1H15: Pesos 44.51) to the U.S. dollar. Its financial results are prepared under Philippine GAAP and reported in peso. First Pacific’s financial results are prepared under Hong Kong GAAP and reported in U.S. dollars. Philippine GAAP and Hong Kong GAAP are largely based on IFRSs, however, certain adjustments need to be made to RHI’s reported peso results to ensure full compliance with Hong Kong GAAP. An analysis of these adjustments follows. For the six months ended 30 June 2016 2015Peso millions RHI’s net income under Philippine GAAP 197 320Differing accounting and presentational treatments(i)
– Reclassification of non-recurring items 18 –– Depreciation of revaluation increment of assets (27) (16)– Others (7) (11)
Adjusted RHI’s net income 181 293 US$ millions Net profit at prevailing average rates for
1H16: Pesos 47.00 and 1H15: Pesos 44.51 3.9 6.6 FP Natural Resources group’s share of RHI’s net income, at an average shareholding of
1H16: 52.3% and 1H15: 45.3% 2.0 3.0FCMI’s net loss (1.7) (1.4) Adjusted FP Natural Resources group’s net income as reported by First Pacific 0.3 1.6Contribution to First Pacific Group profit, at an average shareholding of
1H16: 70.0% and 1H15: 70.0% 0.2 1.1 (i) Differences in accounting treatments under Philippine GAAP, compared with Hong Kong GAAP, and other presentational differences. The principal adjustments
include:– Reclassification of non-recurring items: Certain items, through occurrence or size, are not considered usual operating items which are reallocated and presented
separately. Adjustment for 1H16 of Pesos 18 million principally represents payments for settlement of claims.– Depreciation of revaluation increment of assets: A fair value assessment was performed at the date of FP Natural Resources’ acquisition of a controlling interest
in RHI of 27 February 2015 and certain revaluation increment adjustments have been made to its property, plant and equipment. The adjustment relates to the recognition of additional depreciation based on the revalued fair value of these property, plant and equipment.
– Others: The adjustments relates to accrual of withholding tax on RHI’s net income in accordance with the requirements of HKAS12 “Income Taxes”.

Interim Report 2016 37
Financial Review
Liquidity and Financial Resources
Net Debt and Gearing(A) Head Office Net Debt
The decrease in net debt principally reflects the net proceeds on sale of 1.3 billion common shares in MPIC of US$168.6 million. The Head Office’s borrowings at 30 June 2016 comprise bonds of US$1,461.7 million (with an aggregated face value of US$1,471.3 million) which are due for redemption between 2017 and 2023 and a bank loan of US$316.8 million (with a principal amount of US$320 million) which is due for repayment in 2018.
Changes in Head Office Net Debt
US$ millions Borrowings
Cash and cash
equivalents(i) Net debt At 1 January 2016 1,789.4 (114.1) 1,675.3Movement (10.9) (201.3) (212.2) At 30 June 2016 1,778.5 (315.4) 1,463.1
Head Office Cash Flow For the six months ended 30 June 2016 2015US$ millions Dividend and fee income 132.7 183.3Head Office overhead expense (12.6) (12.1)Net cash interest expense (45.7) (46.6) Net Cash Inflow from Operating Activities 74.4 124.6Net proceeds on sale of an investment(ii)/(net investments)(iii) 168.6 (455.1)Financing activities
– Dividend paid (30.2) (71.5)– (Repayment of loans)/borrowings (13.3) 70.0– Repurchase of shares – (19.0)– Others 1.8 (0.1)
Increase/(Decrease) in Cash and Cash Equivalents 201.3 (351.1)Cash and cash equivalents at 1 January 114.1 508.5 Cash and Cash Equivalents at 30 June 315.4 157.4 (i) Includes pledged deposits and restricted cash(ii) Represents the net proceeds from the sale of 1.3 billion common shares in MPIC.(iii) 2015’s net investments represent principally the investments in an additional 40.2% effective interest in Goodman Fielder of US$423.4 million.

38 First Pacific Company Limited
Financial Review
Consolidated net debt 30 June 2016 31 December 2015
Net Debt and Gearing — Consolidated
Consolidatednet debtUS$ billions
Dec 15 Jun 16
Consolidatedgearing(times)
Consolidated gearing (times)
0
1
2
3
4
5
0
0.1
0.2
0.3
0.4
0.5
0.6
0.8
0.7
(B) Group Net Debt and GearingAn analysis of net debt and gearing for principal consolidated and associated companies and joint venture follows.
Consolidated At 30 June 2016 At 31 December 2015
Net debt(i)
Total equity
Gearing (times)
Net debt(i)
Total equity
Gearing (times)
US$ millions (Restated) (Restated) Head Office 1,463.1 2,119.3 0.69x 1,675.3 2,112.6 0.79xIndofood 1,293.2 3,380.8 0.38x 1,053.3 3,193.7 0.33xMPIC 1,367.0 3,863.4 0.35x 1,282.3 3,202.4 0.40xFPM Power 506.5 409.8 1.24x 465.4 397.2 1.17xFP Natural Resources 167.1 219.1 0.76x 191.6 215.0 0.89xGroup adjustments(ii) – (1,598.5) – – (1,786.5) – Total 4,796.9 8,393.9 0.57x 4,667.9 7,334.4 0.64x
Associated Companies and Joint Venture At 30 June 2016 At 31 December 2015
US$ millionsNet
debt(i)
Total equity
Gearing (times)
Net debt(i)
Total equity
Gearing (times)
PLDT 2,848.4 2,374.1 1.20x 2,431.7 2,420.3 1.00xFPW 340.5 1,006.6 0.34x 336.7 972.9 0.35xPhilex 192.8 556.5 0.35x 182.1 579.8 0.31x (i) Includes short-term deposits, pledged deposits and restricted cash(ii) Group adjustments mainly represents elimination of goodwill arising from acquisitions prior to 1
January 2001 against the Group’s retained earnings and other standard consolidation adjustments to present the Group as a single economic entity.
Head Office’s gearing decreased which reflects the net proceeds on sale of 1.3 billion MPIC shares.
Indofood’s gearing increased because of an increase in its net debt, which mainly reflects the appreciation of the rupiah against the U.S. dollar during the period and its payments for capital expenditure and dividends to shareholders, partly offset by its operating cash inflow, despite an increase in its equity reflecting the appreciation of the rupiah against the U.S. dollar and its profit recorded during the period.
MPIC’s gearing decreased because of a growth of its equity as a result of its share placement and profit recorded during the period, partly offset by an increase in its net debt, which principally reflects its payments for acquisition of additional interests in Beacon Electric and Maynilad’s and MPTC’s payments for capital expenditure, partly offset by the proceeds from share placement and operating cash inflow.
FPM Power’s gearing increased mainly because of an increase in its net debt as a result of the appreciation of the S$ against the U.S. dollar during the period and its operating cash outflow.
FP Natural Resources’ gearing decreased mainly reflecting a decrease in its net debt as a result of the proceeds from its sale of investments in Victorias Milling Company, Inc., partly offset by its repayment of advances to First Pacific and RHI’s payments for capital expenditure.

Interim Report 2016 39
The Group’s gearing decreased to 0.57 times which reflects an increase in the Group’s equity as a result of sale of MPIC shares, MPIC’s share placement, an appreciation of the rupiah and its profit recorded during the period, partly offset by a higher net debt level reflecting Indofood’s payments for capital expenditure and dividends and MPIC’s payments for additional investments in Beacon Electric.
PLDT’s gearing increased because of an increase in net debt mainly reflecting its payments for capital expenditure and its reduced equity reflecting dividends paid. FPW’s gearing decreased principally because of a growth of FPW’s equity as a result of an appreciation of the A$ against the U.S. dollar and its profit recorded during the period, despite an increase in its net debt reflecting an appreciation of the A$ against the U.S. dollar during the period and its payments for capital expenditure, partly offset by its operating cash inflow. Philex gearing increased principally because of its payments for capital expenditure, coupled with its reduced equity mainly because of its declaration of a property dividend of PXP shares.
Maturity ProfileThe maturity profile of debt of consolidated and associated companies and joint venture follows.
Consolidated Carrying Amounts Nominal Values
US$ millions
At 30 June
2016
At 31 December
2015
At 30 June
2016
At 31 December
2015 Within one year 1,178.6 998.6 1,180.4 1,000.2One to two years 949.1 574.1 962.7 578.0Two to five years 2,291.3 2,513.7 2,306.2 2,542.2Over five years 2,148.1 2,275.5 2,156.6 2,285.4 Total 6,567.1 6,361.9 6,605.9 6,405.8
The change in the Group’s debt maturity profile from 31 December 2015 to 30 June 2016 principally reflects a shift in long-term borrowings among the different maturity periods for Indofood and MPIC, Indofood’s reclassification of Rupiah 2.0 trillion (US$151.7 million) of its bonds mature in May 2017 from long-term to short-term and MPIC’s repayments of short-term borrowings.
Maturity Profile ofConsolidated Debt
30 June 2016
18%
35%
33%
14%
US$ millionsWithin one year 1,178.6One to two years 949.1Two to five years 2,291.3Over five years 2,148.1Total 6,567.1
Maturity Profile ofConsolidated Debt31 December 2015
16%
39%
36% 9%
US$ millionsWithin one year 998.6One to two years 574.1Two to five years 2,513.7Over five years 2,275.5Total 6,361.9

40 First Pacific Company Limited
Financial Review
Associated Companies and Joint Venture PLDT FPW Philex
Carrying amounts Nominal values Carrying amounts Nominal values Carrying amounts Nominal values
US$ millions
At 30 June
2016
At 31 December
2015
At 30 June
2016
At 31 December
2015
At 30 June
2016
At 31 December
2015
At 30 June
2016
At 31 December
2015
At 30 June
2016
At 31 December
2015
At 30 June
2016
At 31 December
2015 Within one year 621.9 359.4 626.1 365.7 136.1 122.2 136.1 122.2 64.0 70.5 64.0 70.5One to two years 531.4 693.1 532.5 695.9 179.4 170.3 179.8 170.9 – – – –Two to five years 1,277.6 1,008.5 1,279.3 1,012.6 142.1 143.1 142.6 143.7 – – – –Over five years 914.4 1,357.9 921.2 1,359.0 – – – – 136.2 133.0 153.0 153.0 Total 3,345.3 3,418.9 3,359.1 3,433.2 457.6 435.6 458.5 436.8 200.2 203.5 217.0 223.5
The change in PLDT’s debt maturity profile from 31 December 2015 to 30 June 2016 principally reflects loan repayments and new borrowings arranged to finance capital expenditure and/or refinance its loan obligations which were utilized for service improvements and expansion programs. The change in FPW’s debt maturity profile from 31 December 2015 to 30 June 2016 principally reflects its new short-term borrowings. The decrease in Philex’s debt principally reflects loan repayments.
Charges on Group AssetsAt 30 June 2016, certain bank and other borrowings were secured by the Group’s property, plant and equipment, accounts receivable, pledged deposits, cash and cash equivalents and inventories amounting to a net book value of US$1,288.9 million (31 December 2015: US$1,280.2 million), receipts from future toll collections and funds in the related accounts of CIC and the Group’s interests of 11.1% (31 December 2015: 6.9%) in PLDT, 35.5% (31 December 2015: 40.2%) in MPIC, 100% (31 December 2015: 100%) in CIC, 100% (31 December 2015: 100%) in AIF Toll Road Holdings (Thailand) Limited, 25.9% (31 December 2015: 25.9%) in DMT, none (31 December 2015: 93.7%) in SCBI and none (31 December 2015: 45.1%) in HPC.
Financial Risk Management
Foreign Currency Risk(A) Company Risk
As the Head Office debts are currently denominated in U.S. dollars, foreign currency risk relates mainly to the receipt of cash dividends and to the translation of non-U.S. dollar denominated investments in subsidiary and associated companies and joint ventures.
The Company actively reviews the potential benefits of hedging based on forecast dividend flows and enters into hedging arrangements (including the use of forward exchange contracts) for managing its foreign currency exposure in respect of dividend income and payments in foreign currency on a transactional basis. However, the Company does not actively seek to hedge risks arising on the translation of foreign currency denominated investments due to (i) the non-cash nature of such exposure until the values of the investments are realized and (ii) the high costs associated with such hedging. Accordingly, the Company is exposed to the impact of foreign currency fluctuations on the translated U.S. dollar value of its foreign currency denominated investments.
With the exception of the Head Office, the principal components of the Group’s NAV mainly relate to investments denominated in the peso and the rupiah. Accordingly, any change in these currencies, against their respective 30 June 2016 exchange rates, would have an effect on the Group’s NAV in U.S. dollar terms.

Interim Report 2016 41
The following table illustrates the estimated effect on the Group’s adjusted NAV for a one per cent change of the peso and rupiah exchange rates against the U.S. dollar.
Effect on adjusted
NAV(i)
Effect on adjusted
NAV per share
Company Basis US$ millions HK cents PLDT (i) 25.2 4.60Indofood (i) 24.2 4.41MPIC (i) 19.6 3.57Philex (i) 4.1 0.75PXP (i) 0.2 0.03FP Natural Resources (ii) 0.6 0.11Head Office – Other assets (iii) 1.1 0.20 Total 75.0 13.67
(i) Based on quoted share prices at 30 June 2016 applied to the Group’s economic interests(ii) Based on quoted share prices of RHI at 30 June 2016 applied to the Group’s effective economic
interest and the value of other assets measured at cost(iii) Based on the investment cost in SMECI’s convertible notes
(B) Group RiskThe results of the Group’s operating entities are denominated in local currencies, principally the peso, the rupiah, A$, the New Zealand dollar (NZ$) and S$, which are translated and consolidated to give the Group’s results in U.S. dollars.
Net Debt by CurrencyIt is often necessary for operating entities to borrow in U.S. dollars, which results in the risk of a translation impact on local currency results. A summary of consolidated and associated companies’ and joint venture’s net debt by currency follows.
Consolidated US$ millions US$ Peso Rupiah S$ Others Total Total borrowings 2,587.7 1,951.8 1,098.2 830.3 99.1 6,567.1Cash and cash equivalents(i) (559.5) (532.3) (615.0) (57.4) (6.0) (1,770.2) Net Debt 2,028.2 1,419.5 483.2 772.9 93.1 4,796.9 Representing:Head Office 1,477.2 (10.7) – – (3.4) 1,463.1Indofood 500.5 – 483.2 256.5 53.0 1,293.2MPIC 63.2 1,260.1 – – 43.7 1,367.0FPM Power (9.7) – – 516.4 (0.2) 506.5FP Natural Resources (3.0) 170.1 – – – 167.1 Net Debt 2,028.2 1,419.5 483.2 772.9 93.1 4,796.9
Associated Companies and Joint Venture US$ millions US$ Peso A$ NZ$ Others Total Net DebtPLDT 934.6 1,918.1 – – (4.3) 2,848.4FPW 141.8 0.1 77.2 177.5 (56.1) 340.5Philex 59.2 133.6 – – – 192.8 (i) Includes short-term deposits, pledged deposits and restricted cash
Analysis ofConsolidated Total Borrowings
by Currency
1%13%
30%
17%39%
US$ millionsUS$ 2,587.7Peso 1,951.8Rupiah 1,098.2S$ 830.3Others 99.1Total 6,567.1
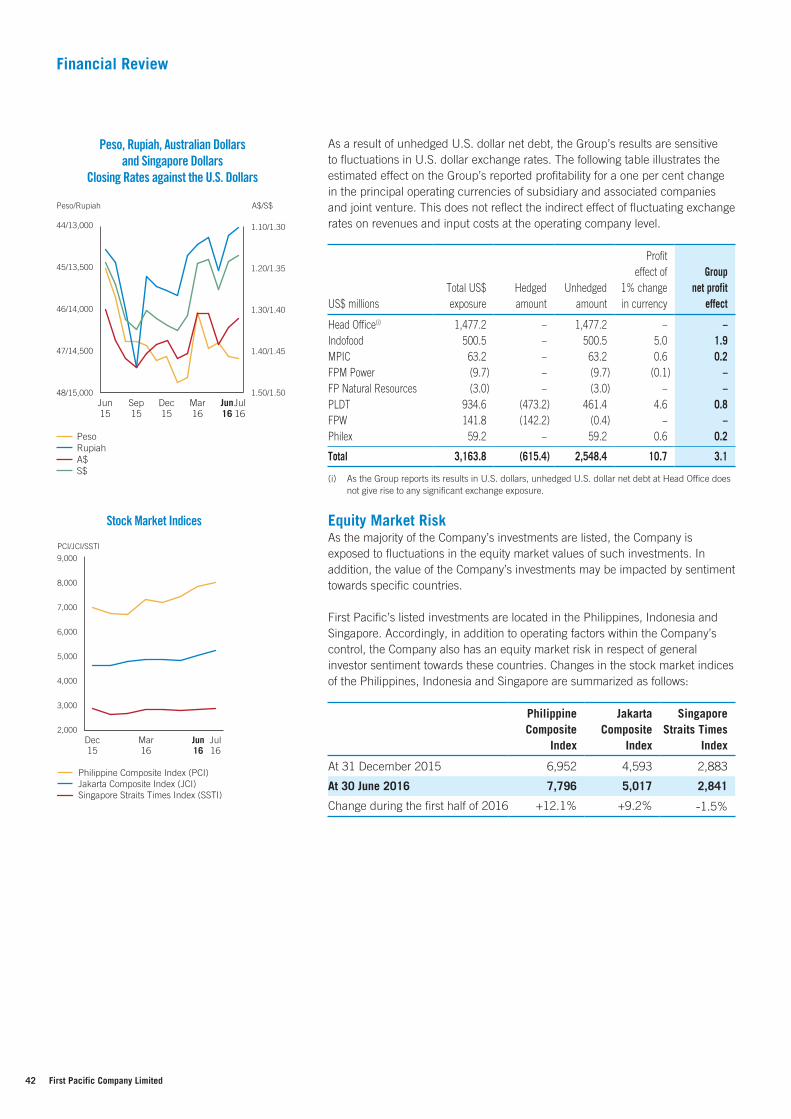
42 First Pacific Company Limited
Financial Review
As a result of unhedged U.S. dollar net debt, the Group’s results are sensitive to fluctuations in U.S. dollar exchange rates. The following table illustrates the estimated effect on the Group’s reported profitability for a one per cent change in the principal operating currencies of subsidiary and associated companies and joint venture. This does not reflect the indirect effect of fluctuating exchange rates on revenues and input costs at the operating company level.
US$ millionsTotal US$ exposure
Hedged amount
Unhedged amount
Profit effect of
1% change in currency
Group net profit
effect Head Office(i) 1,477.2 – 1,477.2 – –Indofood 500.5 – 500.5 5.0 1.9MPIC 63.2 – 63.2 0.6 0.2FPM Power (9.7) – (9.7) (0.1) –FP Natural Resources (3.0) – (3.0) – –PLDT 934.6 (473.2) 461.4 4.6 0.8FPW 141.8 (142.2) (0.4) – –Philex 59.2 – 59.2 0.6 0.2 Total 3,163.8 (615.4) 2,548.4 10.7 3.1 (i) As the Group reports its results in U.S. dollars, unhedged U.S. dollar net debt at Head Office does
not give rise to any significant exchange exposure.
Equity Market RiskAs the majority of the Company’s investments are listed, the Company is exposed to fluctuations in the equity market values of such investments. In addition, the value of the Company’s investments may be impacted by sentiment towards specific countries.
First Pacific’s listed investments are located in the Philippines, Indonesia and Singapore. Accordingly, in addition to operating factors within the Company’s control, the Company also has an equity market risk in respect of general investor sentiment towards these countries. Changes in the stock market indices of the Philippines, Indonesia and Singapore are summarized as follows:
Philippine Composite
Index
Jakarta Composite
Index
Singapore Straits Times
Index At 31 December 2015 6,952 4,593 2,883
At 30 June 2016 7,796 5,017 2,841
Change during the first half of 2016 +12.1% +9.2% -1.5%
Peso/Rupiah A$/S$
Jun15
Sep15
Dec15
Mar16
Jun16
Jul16
48/15,000
47/14,500
46/14,000
45/13,500
44/13,000
1.50/1.50
1.30/1.40
1.40/1.45
1.20/1.35
1.10/1.30
Peso, Rupiah, Australian Dollarsand Singapore Dollars
Closing Rates against the U.S. Dollars
PesoRupiahA$S$
PCI/JCI/SSTI
Dec15
Mar16
Jun16
Jul16
2,000
3,000
4,000
5,000
6,000
7,000
9,000
8,000
Stock Market Indices
Philippine Composite Index (PCI)Jakarta Composite Index (JCI)Singapore Straits Times Index (SSTI)
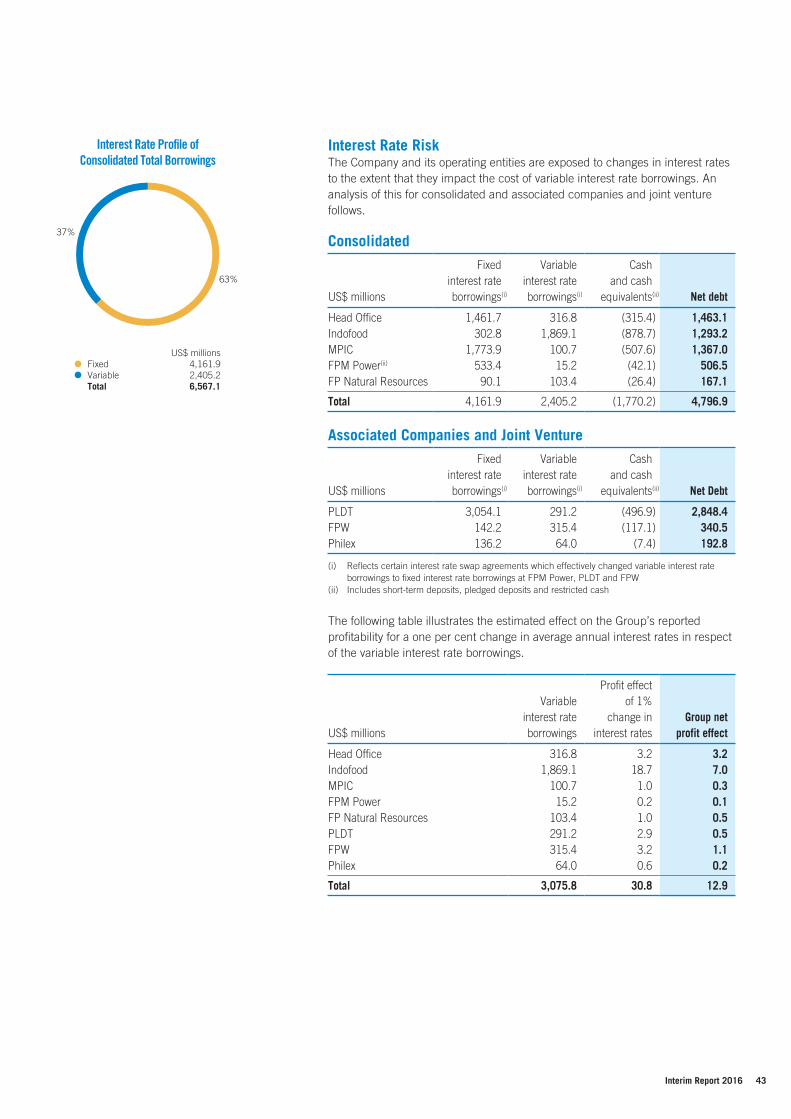
Interim Report 2016 43
Interest Rate RiskThe Company and its operating entities are exposed to changes in interest rates to the extent that they impact the cost of variable interest rate borrowings. An analysis of this for consolidated and associated companies and joint venture follows.
Consolidated
US$ millions
Fixedinterest rateborrowings(i)
Variableinterest rateborrowings(i)
Cashand cash
equivalents(ii) Net debt Head Office 1,461.7 316.8 (315.4) 1,463.1Indofood 302.8 1,869.1 (878.7) 1,293.2MPIC 1,773.9 100.7 (507.6) 1,367.0FPM Power(ii) 533.4 15.2 (42.1) 506.5FP Natural Resources 90.1 103.4 (26.4) 167.1 Total 4,161.9 2,405.2 (1,770.2) 4,796.9
Associated Companies and Joint Venture
US$ millions
Fixedinterest rateborrowings(i)
Variableinterest rateborrowings(i)
Cashand cash
equivalents(ii) Net Debt PLDT 3,054.1 291.2 (496.9) 2,848.4FPW 142.2 315.4 (117.1) 340.5Philex 136.2 64.0 (7.4) 192.8 (i) Reflects certain interest rate swap agreements which effectively changed variable interest rate
borrowings to fixed interest rate borrowings at FPM Power, PLDT and FPW(ii) Includes short-term deposits, pledged deposits and restricted cash
The following table illustrates the estimated effect on the Group’s reported profitability for a one per cent change in average annual interest rates in respect of the variable interest rate borrowings.
US$ millions
Variableinterest rateborrowings
Profit effectof 1%
change ininterest rates
Group net profit effect
Head Office 316.8 3.2 3.2Indofood 1,869.1 18.7 7.0MPIC 100.7 1.0 0.3FPM Power 15.2 0.2 0.1FP Natural Resources 103.4 1.0 0.5PLDT 291.2 2.9 0.5FPW 315.4 3.2 1.1Philex 64.0 0.6 0.2 Total 3,075.8 30.8 12.9
Interest Rate Profile ofConsolidated Total Borrowings
37%
63%
US$ millionsFixed 4,161.9Variable 2,405.2Total 6,567.1

44 First Pacific Company Limited
Financial Review
Adjusted NAV Per ShareThere follows a calculation of the Group’s underlying worth.
US$ millions Basis
At 30 June
2016
At 31 December
2015 PLDT (i) 2,523.9 2,418.3Indofood (i) 2,418.2 1,649.1MPIC (i) 1,958.4 1,604.7FPW (ii) 554.0 554.0Philex (i) 409.7 213.3PXP (i) 17.3 5.5FPM Power (ii) 335.3 335.3FP Natural Resources (iii) 60.7 79.4Head Office – Other assets (iv) 107.1 107.1
– Net debt (1,463.1) (1,675.3) Total Valuation 6,921.5 5,291.4 Number of Ordinary Shares in Issue (millions) 4,275.8 4,268.5 Value per share – U.S. dollars 1.62 1.24
– HK dollars 12.63 9.67Company’s closing share price (HK$) 5.62 5.14Share price discount to HK$ value per share (%) 55.5 46.8 (i) Based on quoted share prices applied to the Group’s economic interests(ii) Represents investment costs(iii) Mainly represents RHI (based on quoted share price applied to the Group’s effective economic
interest) and the Group’s economic interest in other assets (measured at cost)(iv) Represent investment costs in SMECI’s convertible notes
Employee InformationThe following information relates to the Head Office and its subsidiary companies. For the six months ended 30 June 2016 2015US$ millions Employee Remuneration
(including Directors’ Remuneration)Basic salaries 238.4 220.4Bonuses 73.1 48.3Benefits in kind 52.7 45.3Pension contributions 20.0 24.6Retirement and severance allowances 6.3 6.0Share-based compensation benefit expenses 6.7 7.0 Total 397.2 351.6
2016 2015 Number of Employees
– At 30 June 95,017 97,089– Average for the period 94,903 96,899
For details regarding the Group’s remuneration policies for Directors and senior executives, please refer to page 106 of the Company’s 2015 Annual Report.
HK$
Jun12
Dec12
Jun13
Dec13
Jun14
Dec14
Jun15
Dec15
Jun16
4
6
8
10
12
14
16
18
Share Price vsAdjusted NAV Per Share
15.51
5.628.01
12.63
Adjusted NAV per shareShare price
Adjusted NAV by Country30 June 2016
29%
11%
60%
US$ millionsPhilippines 4,970.0Indonesia 2,418.2Others 889.3Total 8,277.5

Interim Report 2016 45
Condensed Interim Consolidated Financial Statements
Condensed Consolidated Income Statement
(Unaudited)
For the six months ended 30 June 2016 2015US$ millions Notes (Restated)(i) Turnover 2 3,436.0 3,329.3Cost of sales (2,440.0) (2,386.1) Gross Profit 996.0 943.2Selling and distribution expenses (274.2) (277.3)Administrative expenses (264.6) (250.3)Other operating income/(expenses), net 40.8 (27.7)Interest income 27.8 37.9Finance costs 3 (186.4) (178.6)Share of profits less losses of associated companies and joint ventures 125.1 166.6 Profit Before Taxation 4 464.5 413.8Taxation 5 (113.2) (85.3) Profit for the Period from Continuing Operations 351.3 328.5Profit for the period from a discontinued operation 6 13.7 28.9 Profit for the Period 365.0 357.4 Attributable to:
Owners of the Parent 7– For profit from continuing operations 121.9 145.4– For profit from a discontinued operation 5.7 12.0 – For Profit for the Period 127.6 157.4 Non-controlling Interests– For profit from continuing operations 229.4 183.1– For profit from a discontinued operation 8.0 16.9 – For Profit for the Period 237.4 200.0
365.0 357.4 Earnings Per Share Attributable to Owners of the Parent (U.S. cents) 8
Basic– For profit from continuing operations 2.86 3.40– For profit from a discontinued operation 0.13 0.28 – For Profit for the Period 2.99 3.68 Diluted– For profit from continuing operations 2.86 3.38– For profit from a discontinued operation 0.13 0.28 – For Profit for the Period 2.99 3.66
(i) Refer to Note 1(B)
Details of the interim distribution declared for the period are disclosed in Note 9 to the Condensed Interim Consolidated Financial Statements.
The accompanying notes form an integral part of these Condensed Interim Consolidated Financial Statements.

46 First Pacific Company Limited
Condensed Interim Consolidated Financial Statements
Condensed Consolidated Statement of Comprehensive Income
(Unaudited)
For the six months ended 30 June 2016 2015US$ millions (Restated)(i) Profit for the Period 365.0 357.4 Other Comprehensive Income/(Loss)Items that may be Reclassified Subsequently to Profit or Loss:
Exchange differences on translating foreign operations 130.2 (248.1)Unrealized gains on available-for-sale assets 11.4 31.9Realized gains on available-for-sale assets (2.6) –Unrealized gains on cash flow hedges 45.8 41.6Income tax related to cash flow hedges (8.4) (7.0)Share of other comprehensive income/(loss) of associated companies and joint ventures 6.7 (72.7)
Items that will not be Reclassified to Profit or Loss:Actuarial losses on defined benefit pension plans (0.4) (1.9)Share of other comprehensive loss of associated companies and joint ventures (11.7) (11.8)
Other Comprehensive Income/(Loss) for the Period, Net of Tax 171.0 (268.0) Total Comprehensive Income for the Period 536.0 89.4 Attributable to:
Owners of the parent 178.0 32.4Non-controlling interests 358.0 57.0
536.0 89.4
(i) Refer to Note 1(B)
The accompanying notes form an integral part of these Condensed Interim Consolidated Financial Statements.

Interim Report 2016 47
Condensed Consolidated Statement of Financial Position
US$ millions Notes
At30 June
2016(Unaudited)
At31 December
2015(Restated)(i)
At1 January
2015(Restated)(i)
Non-current Assets
Property, plant and equipment 10 4,016.0 3,791.1 3,504.6Biological assets 27.5 26.2 24.6Associated companies and joint ventures 11 4,994.2 4,360.5 3,568.4Goodwill 1,079.5 1,023.8 1,057.6Other intangible assets 12 3,289.5 3,151.2 2,511.8Investment properties 9.8 9.7 –Accounts receivable, other receivables and prepayments 14.8 8.8 11.8Available-for-sale assets 135.3 44.1 193.8Deferred tax assets 206.0 198.6 199.2Pledged deposits and restricted cash 13 30.0 30.0 30.9Other non-current assets 299.4 312.1 385.9
14,102.0 12,956.1 11,488.6 Current Assets
Cash and cash equivalents and short-term deposits 1,687.3 1,612.3 2,265.9Restricted cash 13 52.9 51.7 53.2Available-for-sale assets 100.1 124.8 59.2Accounts receivable, other receivables and prepayments 14 994.2 758.5 661.2Inventories 703.9 631.0 717.2Other current assets 9.4 2.0 5.7
3,547.8 3,180.3 3,762.4Assets classified as held for sale 963.0 1,062.6 982.4
4,510.8 4,242.9 4,744.8 Current Liabilities
Accounts payable, other payables and accruals 15 1,324.4 1,241.0 1,192.4Short-term borrowings 1,178.6 998.6 912.0Provision for taxation 91.5 44.7 51.0Current portion of deferred liabilities, provisions and payables 16 301.0 348.1 321.9
2,895.5 2,632.4 2,477.3Liabilities directly associated with the assets classified as held for sale 319.2 436.2 335.9
3,214.7 3,068.6 2,813.2 Net Current Assets 1,296.1 1,174.3 1,931.6 Total Assets Less Current Liabilities 15,398.1 14,130.4 13,420.2 Equity
Issued share capital 42.8 42.7 42.9Shares held for share award scheme 17 (8.2) (6.0) (8.7)Retained earnings 1,327.7 1,398.9 1,434.8Other components of equity 1,974.7 1,634.6 1,878.2 Equity attributable to owners of the parent 3,337.0 3,070.2 3,347.2Non-controlling interests 5,056.9 4,264.2 4,064.1
Total Equity 8,393.9 7,334.4 7,411.3 Non-current Liabilities
Long-term borrowings 5,388.5 5,363.3 4,893.9Deferred liabilities, provisions and payables 16 1,332.2 1,128.9 850.0Deferred tax liabilities 283.5 303.8 265.0
7,004.2 6,796.0 6,008.9 15,398.1 14,130.4 13,420.2
(i) Refer to Note 1(B)
The accompanying notes form an integral part of these Condensed Interim Consolidated Financial Statements.
On behalf of the Board of Directors
ROBERT C. NICHOLSONExecutive Director19 August 2016

48 First Pacific Company Limited
Condensed Interim Consolidated Financial Statements
Condensed Consolidated Statement of Changes in Equity
Equity attributable to owners of the parent
US$ millions
Issuedshare
capital
Sharesheld for
shareaward
schemeShare
premium
Employeeshare-based
compensationreserve
Othercomprehensive(loss)/income
(Note 18)
Differencesarising fromchanges inequities ofsubsidiary
companies
Reservesfor assetsclassified
as heldfor sale
Capitaland other
reservesContributed
surplusRetainedearnings Total
Non-controlling
interests
(Unaudited)Total
equity Balance at 1 January 2015
As previously reported 42.9 (8.7) 1,797.2 61.7 (379.1) 345.2 16.8 12.3 – 1,540.1 3,428.4 4,288.6 7,717.0Prior year adjustments (Note 1(B)) – – – – 23.5 0.6 – – – (105.3) (81.2) (224.5) (305.7) As restated(i) 42.9 (8.7) 1,797.2 61.7 (355.6) 345.8 16.8 12.3 – 1,434.8 3,347.2 4,064.1 7,411.3
Profit for the periodAs previously reported – – – – – – – – – 159.6 159.6 208.6 368.2Prior year adjustments (Note 1(B)) – – – – – – – – – (2.2) (2.2) (8.6) (10.8) As restated(i) – – – – – – – – – 157.4 157.4 200.0 357.4
Other comprehensive (loss)/income for the periodAs previously reported – – – – (128.2) – 0.2 – – – (128.0) (161.7) (289.7)Prior year adjustments – – – – 3.0 – – – – – 3.0 18.7 21.7 As restated(i) – – – – (125.2) – 0.2 – – – (125.0) (143.0) (268.0)
Total comprehensive (loss)/income for the period – – – – (125.2) – 0.2 – – 157.4 32.4 57.0 89.4 Issue of shares upon the exercise of share options – – 0.3 (0.1) – – – – – – 0.2 – 0.2Repurchase and cancellation of shares (0.2) – (17.8) – – – – – – – (18.0) – (18.0)Shares vested under share award scheme – 0.2 – (0.2) – – – – – – – – –Employee share-based compensation benefits – – – 6.7 – – – – – – 6.7 – 6.7Acquisition and dilution of interests in subsidiary companies – – – (0.1) (1.7) 23.2 – 0.1 – – 21.5 158.8 180.3Appropriation to statutory reserve funds – – – – – – 0.4 – – (0.4) – – –2014 final dividend paid – – – – – – – – – (71.5) (71.5) – (71.5)Acquisition of subsidiary companies – – – – – – – – – – – 93.4 93.4Capital contributions from non-controlling shareholders – – – – – – – – – – – 63.9 63.9Dividends paid to non-controlling shareholders – – – – – – – – – – – (160.2) (160.2) Balance at 30 June 2015 42.7 (8.5) 1,779.7 68.0 (482.5) 369.0 17.4 12.4 – 1,520.3 3,318.5 4,277.0 7,595.5 Balance at 1 January 2016
As previously reported 42.7 (6.0) 1,779.7 70.5 (653.8) 369.0 25.7 12.4 – 1,508.7 3,148.9 4,480.2 7,629.1Prior year adjustments (Note 1(B)) – – – – 30.6 0.5 – – – (109.8) (78.7) (216.0) (294.7) As restated(i) 42.7 (6.0) 1,779.7 70.5 (623.2) 369.5 25.7 12.4 – 1,398.9 3,070.2 4,264.2 7,334.4
Profit for the period – – – – – – – – – 127.6 127.6 237.4 365.0Other comprehensive income/(loss) for the period – – – – 57.4 – (8.3) – – 1.3 50.4 120.6 171.0 Total comprehensive income/(loss) for the period – – – – 57.4 – (8.3) – – 128.9 178.0 358.0 536.0 Issue of shares upon the exercise of share options – – 2.8 (0.9) – – – – – – 1.9 – 1.9Issue of shares under share award scheme 0.1 (2.8) 2.7 – – – – – – – – – –Shares vested under share award scheme – 0.6 – (0.6) – – – – – – – – –Transfer from share premium to contributed surplus – – (1,785.2) – – – – – 1,785.2 – – – –Reclassification – – – – – – – – 173.8 (173.8) – – –Cancellation of share options – – – (4.0) – – – – – 4.0 – – –Employee share-based compensation benefits – – – 6.4 – – – – – – 6.4 – 6.4Acquisition, divestment and dilution of interests in
subsidiary companies – – – – 8.3 102.2 – 0.2 – – 110.7 532.8 643.5Appropriation to statutory reserve funds – – – – – – 0.1 – – (0.1) – – –2015 final dividend paid – – – – – – – – – (30.2) (30.2) – (30.2)Acquisition of subsidiary companies – – – – – – – – – – – 13.5 13.5Capital contributions from non-controlling shareholders – – – – – – – – – – – 17.7 17.7Dividends paid to non-controlling shareholders – – – – – – – – – – – (129.3) (129.3) Balance at 30 June 2016 42.8 (8.2) – 71.4 (557.5) 471.7 17.5 12.6 1,959.0 1,327.7 3,337.0 5,056.9 8,393.9 (i) Refer to Note 1(B)
The accompanying notes form an integral part of these Condensed Interim Consolidated Financial Statements.

Interim Report 2016 49
(i) Refer to Note 1(B)
continued/...
Condensed Consolidated Statement of Cash Flows
(Unaudited)
For the six months ended 30 June 2016 2015US$ millions Notes (Restated)(i)
Profit Before Taxation
From continuing operations 464.5 413.8From a discontinued operation 13.4 36.6
Adjustments for:Finance costs 198.4 185.8Depreciation 139.8 129.7Amortization of intangible assets 4 42.5 44.8Provision for onerous contracts 4 8.8 –Employee share-based compensation benefit expenses 6.7 7.0Provision for impairment losses 4 6.1 4.1Share of profits less losses of associated companies and joint ventures (125.1) (166.6)Interest income (33.5) (46.2)Foreign exchange and derivative (gains)/losses, net 7 (21.2) 47.5Gain on changes in fair value of biological assets 4 (7.1) (1.5)Gain on disposal of available-for-sale assets 4 (2.6) –Gain on sale of property, plant and equipment 4 – (0.3)Others (0.5) (1.4)
690.2 653.3Decrease in working capital (369.7) (35.9) Net cash generated from operations 320.5 617.4Interest received 34.6 43.8Interest paid (180.1) (159.0)Taxes paid (100.2) (106.3) Net Cash Flows From Operating Activities 74.8 395.9 Dividends received from associated companies 123.2 126.3Proceeds from disposal of available-for-sale assets 50.6 1.4Dividends received from available-for-sale assets 2.8 1.7Proceeds from disposal of property, plant and equipment 2.7 0.7Increased investments in a joint venture 19(A) (238.6) –Increased investments in preferred shares issued by a joint venture 19(B) (197.6) –Purchase of property, plant and equipment (189.8) (209.2)Investments in intangible assets (148.3) (140.3)Acquisition of available-for-sale assets (102.5) (35.1)Acquisition of a business 19(C) (46.1) –Increase in time deposits with original maturity of more than three months (44.9) (61.6)Acquisition of subsidiary companies 19(C) (25.1) (104.5)Investments in associated companies (4.6) (63.0)Increase in pledged deposits and restricted cash (1.2) (81.4)Investments in biological assets (0.1) (0.4)Preferred share dividends received from a joint venture – 9.1Proceeds from divestment of interests in an associated company – 4.2Increased investments in associated companies 19(D) – (519.4)Investments in joint ventures 19(E) – (423.4) Net Cash Flows Used in Investing Activities (819.5) (1,494.9)

50 First Pacific Company Limited
Condensed Interim Consolidated Financial Statements
Condensed Consolidated Statement of Cash Flows (continued)
(Unaudited)
For the six months ended 30 June 2016 2015US$ millions Notes (Restated)(i)
Proceeds from new borrowings 1,098.2 1,039.8Proceeds from issue of shares to non-controlling shareholders by subsidiary companies 19(F) 471.7 197.2Proceeds from divestment of interests in a subsidiary company 19(G) 168.6 –Capital contributions from non-controlling shareholders 17.7 27.9Proceeds from issue of shares under a long-term incentive plan 1.9 0.2Borrowings repaid (887.5) (333.1)Dividends paid to non-controlling shareholders by subsidiary companies (129.3) (160.2)Dividends paid to shareholders (30.2) (71.5)Payments for concession fees payable (14.3) (17.0)Increased investments in a subsidiary company (0.6) (12.6)Repurchase of shares – (19.0)Repurchase of a subsidiary company’s shares – (11.7) Net Cash Flows From Financing Activities 696.2 640.0 Net Decrease in Cash and Cash Equivalents (48.5) (459.0)Cash and cash equivalents at 1 January 1,450.0 2,086.3Exchange translation 31.2 (96.9) Cash and Cash Equivalents at 30 June 1,432.7 1,530.4 RepresentingCash and cash equivalents and short-term deposit as stated in
the condensed consolidated statement of financial position 1,687.3 1,707.4Add cash and cash equivalents and short-term deposits attributable to a discontinued operation 634.5 618.3Less time deposits with original maturity of more than three months (888.9) (785.1)Less bank overdrafts (0.2) (10.2) Cash and Cash Equivalents at 30 June 1,432.7 1,530.4
(i) Refer to Note 1(B)
The accompanying notes form an integral part of these Condensed Interim Consolidated Financial Statements.

Interim Report 2016 51
Notes to the Condensed Interim Consolidated Financial Statements
1. Basis of Preparation and Impact of Revised HKFRSs(A) Basis of Preparation
The condensed interim consolidated financial statements have been prepared in accordance with HKAS 34 “Interim Financial Reporting” issued by the Hong Kong Institute of Certified Public Accountants (HKICPA) and the disclosure requirements of the Rules Governing the Listing of Securities on the Stock Exchange of Hong Kong Limited (the Listing Rules) issued by The Stock Exchange of Hong Kong Limited (SEHK). The condensed interim consolidated financial statements have been prepared on a basis consistent with the accounting policies adopted in the Group’s 2015 audited financial statements, except for the adoption of revised financial reporting standards effective on 1 January 2016 as described below.
(B) Impact of Revised HKFRSsDuring 2016, the Group has adopted the following revised Hong Kong Financial Reporting Standards (HKFRSs) (which include all HKFRSs, HKASs and Hong Kong (International Financial Reporting Interpretations Committee) – Interpretations) effective for annual periods commencing on or after 1 January 2016 issued by the HKICPA:
HKAS 16 and HKAS 41 Amendments “Agriculture: Bearer Plants”HKAS 1 Amendments “Disclosure Initiative”HKAS 16 and HKAS 38 Amendments “Clarification of Acceptable Methods of Depreciation and Amortization”HKAS 27 (2011) Amendments “Equity Method in Separate Financial Statements”HKFRS 10, HKFRS 12 and
HKAS 28 (2011) Amendments “Investment Entities: Applying the Consolidation Exception”HKFRS 11 Amendments “Accounting for Acquisitions of Interests in Joint Operations”Improvements to HKFRSs “Annual Improvements to HKFRSs 2012-2014”
The Group’s adoption of the above pronouncements, except for HKAS 16 and HKAS 41 Amendments, has had no effect on both the profit attributable to owners of the parent for the six-month periods ended 30 June 2016 and 30 June 2015 and the equity attributable to owners of the parent at 30 June 2016, 31 December 2015 and 1 January 2015.
The Group adopted HKAS 16 and HKAS 41 Amendments with effect from 1 January 2016. Under the amendments, bearer plants are defined as living plants that are used in the production or supply of agricultural produce and expected to bear produce for more than one period, and has a remote likelihood of being sold as agricultural produce, except for incidental scrap sales. Biological assets that meet the definition of bearer plants are no longer be within the scope of HKAS 41 “Agriculture”. Instead, bearer plants are measured under HKAS 16 “Property, Plant and equipment” at accumulated cost (before maturity) using the cost model (after maturity). Depreciation for bearer plants is calculated on a straight-line basis over the economic useful lives of 25 years for oil palm and rubber trees, and four years for sugar cane. However, the agricultural produce growing on bearer plants will remain within the scope of HKAS 41 and to be measured at fair value less costs to sell. The Group has applied the amendments retrospectively. The effects of the above change are summarized below:
(a) Effects on the Condensed Consolidated Statement of Financial Position at 31 December 2015 and 1 January 2015
US$ millions
At 31 December
2015
At 1 January
2015 AssetsIncrease in property, plant and equipment 730.0 772.8Decrease in biological assets/plantations (1,124.9) (1,186.1)Decrease in deferred tax assets (0.9) (1.0)Increase in other current assets 2.0 5.7
(393.8) (408.6) LiabilitiesDecrease in deferred tax liabilities (99.1) (102.9)
(99.1) (102.9) EquityDecrease in retained earnings (109.8) (105.3)Increase in exchange reserve 30.6 23.5Increase in differences arising from changes in equities of subsidiary companies 0.5 0.6Decrease in non-controlling interests (216.0) (224.5)
(294.7) (305.7)

52 First Pacific Company Limited
Notes to the Condensed Interim Consolidated Financial Statements
(b) Effects on the Condensed Consolidated Income Statement for the Six Months Ended 30 June 2015 For the six months ended 30 June 2015 US$ millions Increase in cost of sales (19.1)Decrease in administrative expenses 4.5Decrease in other operating expenses, net 0.5Decrease in taxation 3.3 Decrease in profit for the period (10.8) Attributable to:
Owners of the parent – For profit from continuing operations (2.2)Non-controlling interests – For profit from continuing operations (8.6)
Decrease in profit for the period (10.8) Decrease in earnings per share attributable to owners of the parent (U.S. cent)
Basic (0.06)Diluted (0.05)
2. Turnover and Operating Segmental Information For the six months ended 30 June 2016 2015US$ millions TurnoverSale of goods 2,705.3 2,585.8Sale of electricity 259.3 325.1Rendering of services 471.4 418.4 Total 3,436.0 3,329.3
Operating Segmental InformationAn operating segment is a component of the Group that engages in business activities from which it may earn revenues and incur expenses (including revenues and expenses relating to transactions with other components of the Group), whose operating results are regularly reviewed by the Group’s chief operating decision maker who makes decisions about how resources are to be allocated to the segment and assesses its performance, and for which discrete financial information is available to him.
The Board of Directors considers the business of the Group from both product or service and geographical perspectives. From the product or service perspective, the Group’s business interests are divided into four main segments, which are telecommunications, consumer food products, infrastructure and natural resources. Geographically, the Board of Directors considers the businesses of the Group are operating in the Philippines, Indonesia, Australasia and Singapore and the turnover information of continuing operations is based on the locations of the customers. Details of the Group’s principal investments are provided on pages 89 to 91.
The Board of Directors assesses the performance of the operating segments based on a measure of recurring profit. This basis measures the profit attributable to owners of the parent excluding the effects of foreign exchange and derivative gains/losses, gain on changes in fair value of biological assets and non-recurring items. Non-recurring items represent certain items, through occurrence or size, which are not considered as usual operating items.

Interim Report 2016 53
The revenue, results and other information for the six months ended 30 June 2016 and 2015, and total assets and total liabilities at 30 June 2016 and 31 December 2015 regarding the Group’s operating segments are as follows.
By Principal Business Activity – 2016
For the six months ended/at 30 JuneUS$ millions
Telecom-munications
ConsumerFood
Products InfrastructureNatural
ResourcesHeadOffice
2016Total
RevenueTurnover – 2,714.1 721.9 – – 3,436.0 ResultsRecurring profit 78.4 84.0 59.3 4.5 (68.4) 157.8 Assets and LiabilitiesNon-current assets (other than
financial instruments and deferred tax assets)– Associated companies and joint ventures 1,226.7 645.8 2,659.6 462.1 – 4,994.2– Others – 3,929.7 4,713.2 – 22.1 8,665.0
1,226.7 4,575.5 7,372.8 462.1 22.1 13,659.2Other assets – 2,731.8 939.8 – 319.0 3,990.6 Segment assets 1,226.7 7,307.3 8,312.6 462.1 341.1 17,649.8Assets classified as held for sale – 929.8 33.2 – – 963.0 Total assets 1,226.7 8,237.1 8,345.8 462.1 341.1 18,612.8 Borrowings – 2,365.4 2,423.2 – 1,778.5 6,567.1Other liabilities – 1,398.8 1,817.3 – 116.5 3,332.6 Segment liabilities – 3,764.2 4,240.5 – 1,895.0 9,899.7Liabilities directly associated with
the assets classified as held for sale – 319.2 – – – 319.2 Total liabilities – 4,083.4 4,240.5 – 1,895.0 10,218.9 Other Information – Continuing OperationsDepreciation and amortization – (116.1) (65.1) – (7.8) (189.0)Gain on changes in fair value of biological assets – 7.1 – – – 7.1Impairment losses – (5.9) (0.2) – – (6.1)Interest income – 21.9 4.5 – 1.4 27.8Finance costs – (63.8) (73.0) – (49.6) (186.4)Share of profits less losses of
associated companies and joint ventures 55.2 (8.3) 74.1 4.1 – 125.1Taxation – (76.7) (28.2) – (8.3) (113.2)Additions to non-current assets (other than
financial instruments and deferred tax assets) – 159.8 673.8 – 0.1 833.7
By Geographical Market – 2016 For the six months ended/at 30 JuneUS$ millions
ThePhilippines Indonesia Australasia Singapore Others
2016Total
RevenueTurnover 643.3 2,354.9 5.8 270.7 161.3 3,436.0 Assets Non-current assets (other than
financial instruments and deferred tax assets) 8,494.0 3,385.3 533.5 1,171.9 74.5 13,659.2

54 First Pacific Company Limited
Notes to the Condensed Interim Consolidated Financial Statements
By Principal Business Activity – 2015
For the six months ended 30 June/at 31 DecemberUS$ millions
Telecom-munications
ConsumerFood
Products InfrastructureNatural
ResourcesHeadOffice
2015(Restated)
Total RevenueTurnover – 2,608.8 720.5 – – 3,329.3 ResultsRecurring profit 97.4 82.5 62.3 2.9 (70.3) 174.8 Assets and LiabilitiesNon-current assets (other than
financial instruments and deferred tax assets)– Associated companies and joint ventures 1,240.6 632.7 2,028.7 458.5 – 4,360.5– Others – 3,757.8 4,463.6 – 23.7 8,245.1
1,240.6 4,390.5 6,492.3 458.5 23.7 12,605.6Other assets – 2,422.2 988.7 – 119.9 3,530.8 Segment assets 1,240.6 6,812.7 7,481.0 458.5 143.6 16,136.4Assets classified as held for sale – 1,031.2 31.4 – – 1,062.6 Total assets 1,240.6 7,843.9 7,512.4 458.5 143.6 17,199.0 Borrowings – 2,204.3 2,368.2 – 1,789.4 6,361.9Other liabilities – 1,248.6 1,701.3 – 116.6 3,066.5 Segment liabilities – 3,452.9 4,069.5 – 1,906.0 9,428.4Liabilities directly associated with
the assets classified as held for sale – 436.2 – – – 436.2 Total liabilities – 3,889.1 4,069.5 – 1,906.0 9,864.6 Other Information – Continuing OperationsDepreciation and amortization – (97.3) (61.1) – (8.1) (166.5)Gain on changes in fair value of biological assets – 1.5 – – – 1.5Impairment losses – (4.0) (0.1) – – (4.1)Interest income – 28.8 6.0 – 3.1 37.9Finance costs – (61.4) (67.2) – (50.0) (178.6)Share of profits less losses of
associated companies and joint ventures 104.9 (9.5) 66.7 4.5 – 166.6Taxation – (65.6) (7.1) – (12.6) (85.3)Additions to non-current assets (other than
financial instruments and deferred tax assets) – 621.3 799.0 – 0.2 1,420.5
By Geographical Market – 2015 For the six months ended 30 June/at 31 DecemberUS$ millions
ThePhilippines Indonesia Australasia Singapore Others
2015Total
RevenueTurnover 504.2 2,312.3 6.1 344.1 162.6 3,329.3 Assets Non-current assets (other than
financial instruments and deferred tax assets) 7,624.9 3,168.8 517.9 1,211.0 83.0 12,605.6

Interim Report 2016 55
A reconciliation between profit before taxation as shown in the condensed consolidated income statement and recurring profit is as follows. For the six months ended 30 June 2016 2015US$ millions (Restated) Profit before taxation
From continuing operations 464.5 413.8From a discontinued operation 13.4 36.6
Exclusion of:– Foreign exchange and derivative (gains)/losses, net (Note 7) (22.5) 48.4– Gain on changes in fair value of biological assets (Note 4) (7.1) (1.5)– Non-recurring items 56.5 5.3
Deduction of attributable taxation and non-controlling interests (347.0) (327.8) Recurring Profit 157.8 174.8
3. Finance Costs For the six months ended 30 June 2016 2015US$ millions (Restated) Finance costs on bank loans and other loans 212.5 187.1Less: Finance costs capitalized in
– Intangible assets (19.8) (3.7)– Property, plant and equipment (6.3) (4.8)
Total 186.4 178.6
4. Profit Before Taxation For the six months ended 30 June 2016 2015US$ millions (Restated) Profit Before Taxation (from Continuing Operations) is stated after (Charging)/CreditingCost of inventories sold (1,472.6) (1,395.0)Employees’ remuneration (381.1) (334.1)Cost of services rendered (162.9) (146.4)Depreciation (139.8) (114.7)Amortization of intangible assets (42.5) (44.8)Provision for onerous contracts (8.8) –Impairment losses
– Inventories(i) (5.7) (4.0)– Accounts receivable(ii) (0.4) (0.1)
Foreign exchange and derivative gains/(losses), net 27.8 (47.5)Gain on changes in fair value of biological assets (Note 2) 7.1 1.5Gain on disposal of available-for-sale assets 2.6 –Dividends received from available-for-sale assets 1.7 1.7Gain on sale of property, plant and equipment – 0.3 (i) Included in cost of sales(ii) Included in selling and distribution expenses

56 First Pacific Company Limited
Notes to the Condensed Interim Consolidated Financial Statements
5. TaxationNo Hong Kong profits tax (2015: Nil) has been provided as the Group had no estimated assessable profits (2015: Nil) arising in Hong Kong for the period. Taxation on assessable profits generated outside Hong Kong has been provided at the rates of taxation prevailing in the countries in which the Company’s subsidiary companies operate. For the six months ended 30 June 2016 2015US$ millions (Restated) Subsidiary Companies – OverseasCurrent taxation 129.5 100.6Deferred taxation (16.3) (15.3) Total 113.2 85.3
Included within the share of profits less losses of associated companies and joint ventures is taxation of US$66.0 million (2015: US$69.4 million) which is analyzed as follows. For the six months ended 30 June 2016 2015US$ millions Associated Companies and Joint Ventures – OverseasCurrent taxation 59.3 64.8Deferred taxation 6.7 4.6 Total 66.0 69.4
6. A Discontinued OperationOn 31 December 2014, Indofood engaged in a discussion with CMZ BVI, a company beneficially owned by the management of CMZ, to divest a majority interest of approximately 52.9% in CMZ at a price of S$1.2 (US$0.89) per share, thereby reducing Indofood’s interests in CMZ from 82.9% to approximately 30%. On 14 October 2015, Indofood and CMZ BVI entered into a binding MOU which sets out the terms upon which they will continue to discuss and work towards finalization of a definitive sale and purchase agreement for the proposed transaction. In consideration of Indofood entering into the MOU, CMZ BVI paid Indofood earnest sums of S$40 million (US$29.4 million) by 30 December 2015, which shall be treated as part of the consideration payable to Indofood upon the consummation of the proposed transaction. CMZ was classified as a disposal group held for sale at 31 December 2014 and 2015 and 30 June 2016 and a discontinued operation in the Group’s 2014 and 2015 annual consolidated financial statements and 2015 and 2016 condensed interim consolidated financial statements. The potential divestment is expected to be completed during 2016. Prior to the classification as a discontinued operation, the operation of CMZ was reported as the cultivation and processed vegetables group of the Group’s consumer food products business segment and the People’s Republic of China geographical segment.
7. Profit Attributable to Owners of the ParentThe profit attributable to owners of the parent includes US$9.5 million of net foreign exchange and derivative gains (2015: US$17.4 million of loss), which represent the foreign exchange translation differences on the Group’s unhedged foreign currency denominated net borrowings and payables and the changes in the fair values of derivatives, US$1.1 million (2015: US$0.2 million (Restated)) of gain on changes in fair value of biological assets and US$40.8 million (2015: US$0.2 million) of net non-recurring losses.
Analysis of Foreign Exchange and Derivative Gains/(Losses), Net For the six months ended 30 June 2016 2015US$ millions Foreign exchange and derivative gains/(losses), net
– Subsidiary companies 21.2 (47.5)– Associated companies and joint ventures 1.3 (0.9)
Subtotal (Note 2) 22.5 (48.4)Attributable taxation and non-controlling interests (13.0) 31.0 Total 9.5 (17.4)
The non-recurring losses represent certain items, through occurrence or size, which are not considered as usual operating items. 2016’s non-recurring losses of US$40.8 million mainly represent PLDT’s impairment provision for its investment in Rocket Internet shares (US$29.3 million), MPIC’s project expenses (US$4.3 million) and PLP’s provision for onerous contracts (US$3.7 million).

Interim Report 2016 57
8. Earnings Per Share Attributable to Owners of the ParentThe calculation of the basic earnings per share is based on the profit for the period attributable to owners of the parent of US$127.6 million (2015: US$157.4 million) and the weighted average number of ordinary shares of 4,271.8 million (2015: 4,280.1 million) in issue less shares held for a share award scheme of 6.9 million (2015: 7.7 million) during the period.
The calculation of the diluted earnings per share is based on: (a) the profit for the period attributable to owners of the parent of US$127.6 million (2015: US$157.4 million) reduced by the dilutive impacts of US$0.1 million (2015: US$0.1 million) in respect of the exercise of share options issued by the Group’s subsidiary and associated companies and (b) a share base equal to the aggregate of the weighted average number of ordinary shares of 4,271.8 million (2015: 4,280.1 million) in issue less shares held for a share award scheme of 6.9 million (2015: 7.7 million) during the period (as used in the basic earnings per share calculation) and the weighted average number of ordinary shares of 2.5 million (2015: 27.3 million) assumed to have been issued at no consideration on the deemed exercise of all dilutive share options of the Company during the period.
9. Ordinary Share Interim DistributionAt a meeting held on 19 August 2016, the Directors declared an interim cash distribution of U.S. 1.03 cents (2015: U.S. 1.03 cents) per ordinary share, equivalent to a total amount of US$43.8 million (2015: US$44.2 million).
10. Property, Plant and EquipmentThe movements in property, plant and equipment are set out below.
2016 2015 US$ millions (Restated) At 1 January
As previously reported 3,061.1 2,731.8Prior year adjustments (Note 1(B)) 730.0 772.8 As restated 3,791.1 3,504.6
Exchange translation 156.6 (191.6)Additions 188.8 200.5Acquisition of a business and subsidiary companies (Note 19(C)) 22.0 387.1Depreciation (139.8) (114.7)Disposals (2.7) (0.4) At 30 June 4,016.0 3,785.5
11. Associated Companies and Joint Ventures
US$ millions
At30 June
2016
At31 December
2015 MPIC(i) 2,659.6 2,028.6PLDT 1,226.7 1,240.6Philex 462.1 458.6FPW 533.5 517.9Indofood(ii) 98.5 101.0FP Natural Resources(iii) 13.8 13.8 Total 4,994.2 4,360.5 (i) Principally represents MPIC’s investments in Beacon Electric and Meralco(ii) Principally represents Indofood’s investments in CMAA and PT Asahi Indofood Beverage Makmur(iii) Represents RHI’s investments in HPC

58 First Pacific Company Limited
Notes to the Condensed Interim Consolidated Financial Statements
12. Other Intangible Assets
US$ millions
At30 June
2016
At31 December
2015 Concession assets – Water distribution 1,655.9 1,611.0Concession assets – Toll roads 1,206.3 1,154.2Concession assets – Rail 131.5 119.6Brands – Dairy 182.6 182.3Brand and networks – Water 69.6 66.5Service contracts – Wastewater and sewage treatment 24.0 –Vesting contract – Power 12.2 12.4Software and others 7.4 5.2 Total 3,289.5 3,151.2
Concession assets – Water distribution mainly represent the exclusive right granted by MWSS on behalf of the Philippine Government for Maynilad to provide water distribution and sewerage services and charge users for these services provided in the area of West Metro Manila during its concession period.
Concession assets – Toll roads represent the concession comprising the rights, interests and privileges to finance, design, construct, operate and maintain toll roads, toll facilities and other facilities generating toll-related and non-toll related income held by (a) MNTC in respect of the Manila North Expressway (also known as NLEX) and SCTEX, (b) CIC in respect of CAVITEX and (c) MPCALA in respect of CALAX during their concession periods.
Concession assets – Rail represent concession comprising of the exclusive right during the concession period to operate and maintain the current LRT1 system, collect farebox revenue and construct the LRT1 Extension.
Brands – Dairy represent the brands held by PT Indolakto, a subsidiary company of Indofood, for its various milk-related products, which include Indomilk, Cap Enaak, Tiga Sapi, Crima, Kremer and Indoeskrim.
Brands and networks – Water represent the registered brand name, CLUB, and the distribution and customer networks of Indofood’s packaged drinking water business.
Service contracts – Wastewater and sewage treatment represent ESTII’s customer contracts in relation to its business of designing, supplying, constructing, installing and operating and maintaining wastewater and sewage treatment plant facilities.
Vesting contract – Power represents an agreement entered into between PLP and a Singapore government agency, which allows PLP to sell electricity at a specified volume and a specific price to the agency over a period of 10 years from November 2013 to November 2023.
13. Pledged Deposits and Restricted CashAt 30 June 2016, the Group had US$11.1 million (31 December 2015: US$11.1 million) of pledged bank deposits as security for certain bonds issued by the Group, US$52.9 million (31 December 2015: US$51.7 million) of cash which was set aside to cover principal and interest payments of certain borrowings in compliance with loan agreements and US$18.9 million (31 December 2015: US$18.9 million) of cash held in an escrow account in relation to a construction contract which is restricted as to use.
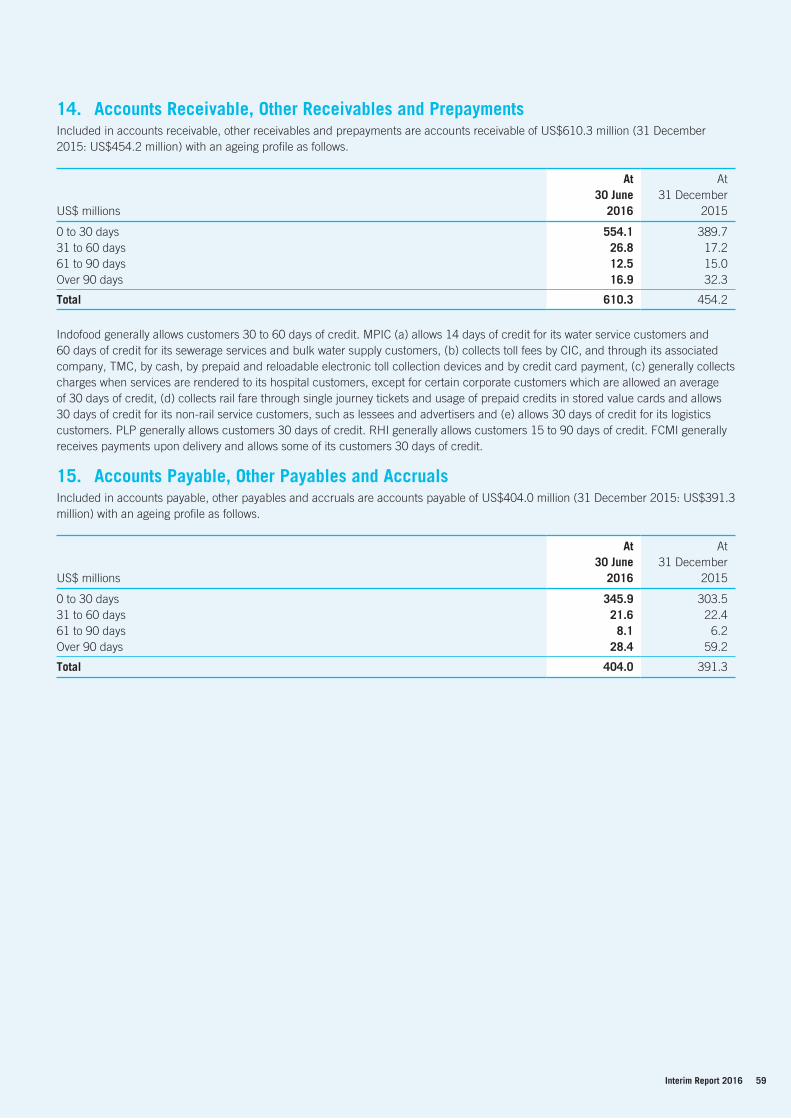
Interim Report 2016 59
14. Accounts Receivable, Other Receivables and PrepaymentsIncluded in accounts receivable, other receivables and prepayments are accounts receivable of US$610.3 million (31 December 2015: US$454.2 million) with an ageing profile as follows.
US$ millions
At30 June
2016
At31 December
2015 0 to 30 days 554.1 389.731 to 60 days 26.8 17.261 to 90 days 12.5 15.0Over 90 days 16.9 32.3 Total 610.3 454.2
Indofood generally allows customers 30 to 60 days of credit. MPIC (a) allows 14 days of credit for its water service customers and 60 days of credit for its sewerage services and bulk water supply customers, (b) collects toll fees by CIC, and through its associated company, TMC, by cash, by prepaid and reloadable electronic toll collection devices and by credit card payment, (c) generally collects charges when services are rendered to its hospital customers, except for certain corporate customers which are allowed an average of 30 days of credit, (d) collects rail fare through single journey tickets and usage of prepaid credits in stored value cards and allows 30 days of credit for its non-rail service customers, such as lessees and advertisers and (e) allows 30 days of credit for its logistics customers. PLP generally allows customers 30 days of credit. RHI generally allows customers 15 to 90 days of credit. FCMI generally receives payments upon delivery and allows some of its customers 30 days of credit.
15. Accounts Payable, Other Payables and AccrualsIncluded in accounts payable, other payables and accruals are accounts payable of US$404.0 million (31 December 2015: US$391.3 million) with an ageing profile as follows.
US$ millions
At30 June
2016
At31 December
2015 0 to 30 days 345.9 303.531 to 60 days 21.6 22.461 to 90 days 8.1 6.2Over 90 days 28.4 59.2 Total 404.0 391.3

60 First Pacific Company Limited
Notes to the Condensed Interim Consolidated Financial Statements
16. Deferred Liabilities, Provisions and Payables
US$ millionsLong-term
liabilities Pension
Loans fromnon-controlling
shareholders Others2016Total
2015Total
At 1 January 563.3 363.7 249.0 301.0 1,477.0 1,171.9Exchange translation 0.5 16.4 4.9 2.9 24.7 (35.5)Additions 194.0 20.0 15.7 17.7 247.4 253.4Acquisition of subsidiary companies (Note 19(C)) – – – 0.1 0.1 5.8Payment and utilization (14.3) (4.4) – (97.3) (116.0) (121.0) At 30 June 743.5 395.7 269.6 224.4 1,633.2 1,274.6 Presented as:Current Portion 44.3 – 113.5 143.2 301.0 305.7Non-current Portion 699.2 395.7 156.1 81.2 1,332.2 968.9 Total 743.5 395.7 269.6 224.4 1,633.2 1,274.6
The long-term liabilities mainly relate to (a) Maynilad’s concession fees payable to MWSS, including a provision for certain additional concession fees payable and related interest amounts in dispute between Maynilad and MWSS, recognized by the Group upon its acquisition of Maynilad, (b) Maynilad’s deferred credits (which represent foreign exchange gains and other payables which will be refunded to the customers and foreign exchange differences arising from retranslation of the portion of Maynilad’s foreign currency denominated concession fees payable and loans), (c) MPCALA’s concession fees payable to the Philippine Government in respect of CALAX, (d) LRMC’s concession fees payable to the Philippine Government in respect of LRT 1 and (e) MPIC’s outstanding payable from its acquisition of an additional 25% interest in Beacon Electric from PCEV. In respect of the disputed amounts between Maynilad and MWSS, no final resolution has been reached at 30 June 2016.
The pension relates to accrued liabilities in relation to defined benefit retirement schemes and long service payments.
The loans from non-controlling shareholders represent unsecured loans provided by non-controlling shareholders of FPM Power, PLP and IndoAgri, a subsidiary company of Indofood.
The others mainly represent (a) Maynilad’s real property tax payables on certain common purpose facilities, (b) contractual obligations of MNTC and CIC to restore their service concession assets to a specified level of serviceability during their service concession periods and to maintain these assets in good condition prior to the handover of these assets to the Philippine Government at the end of their concession periods, (c) provision for certain business tax payables, (d) provisions for various claims and potential claims against the Group and (e) derivative liabilities arising from forward contracts, interest rate swaps and fuel swaps.
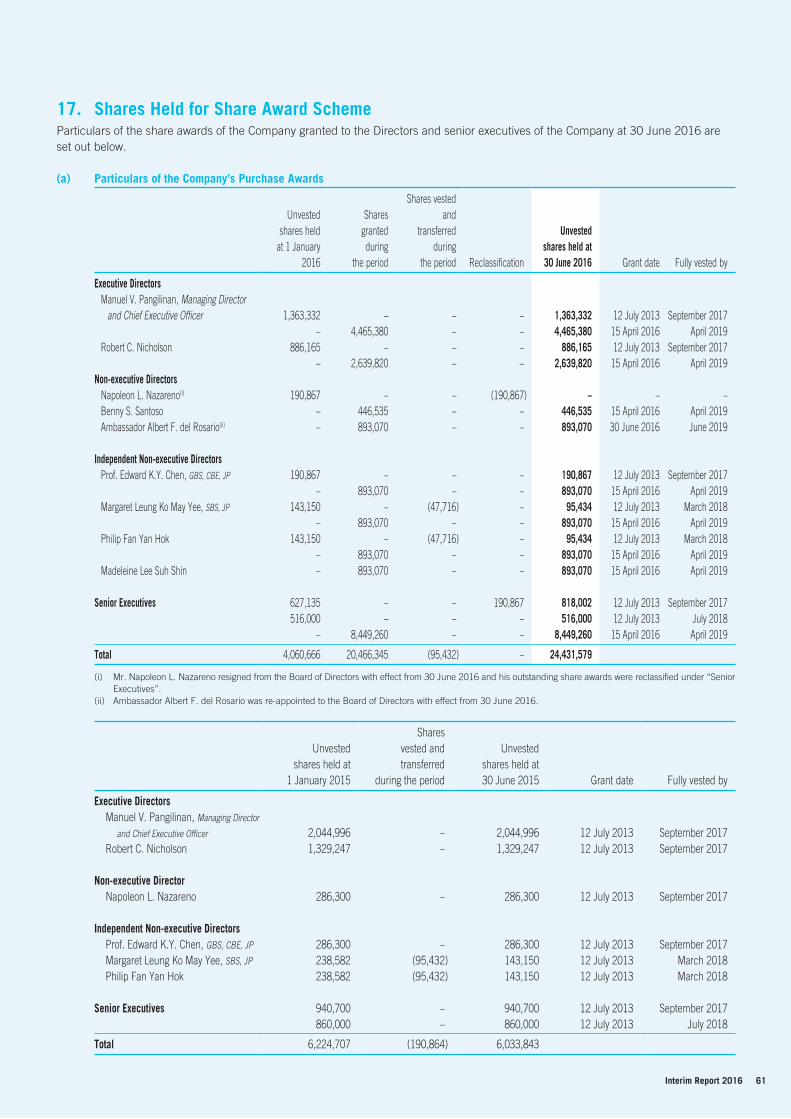
Interim Report 2016 61
17. Shares Held for Share Award SchemeParticulars of the share awards of the Company granted to the Directors and senior executives of the Company at 30 June 2016 are set out below.
(a) Particulars of the Company’s Purchase Awards
Unvestedshares held
at 1 January2016
Sharesgrantedduring
the period
Shares vestedand
transferredduring
the period Reclassification
Unvestedshares held at30 June 2016 Grant date Fully vested by
Executive DirectorsManuel V. Pangilinan, Managing Director
and Chief Executive Officer 1,363,332 – – – 1,363,332 12 July 2013 September 2017– 4,465,380 – – 4,465,380 15 April 2016 April 2019
Robert C. Nicholson 886,165 – – – 886,165 12 July 2013 September 2017– 2,639,820 – – 2,639,820 15 April 2016 April 2019
Non-executive DirectorsNapoleon L. Nazareno(i) 190,867 – – (190,867) – – –Benny S. Santoso – 446,535 – – 446,535 15 April 2016 April 2019Ambassador Albert F. del Rosario(ii) – 893,070 – – 893,070 30 June 2016 June 2019
Independent Non-executive DirectorsProf. Edward K.Y. Chen, GBS, CBE, JP 190,867 – – – 190,867 12 July 2013 September 2017
– 893,070 – – 893,070 15 April 2016 April 2019Margaret Leung Ko May Yee, SBS, JP 143,150 – (47,716) – 95,434 12 July 2013 March 2018
– 893,070 – – 893,070 15 April 2016 April 2019Philip Fan Yan Hok 143,150 – (47,716) – 95,434 12 July 2013 March 2018
– 893,070 – – 893,070 15 April 2016 April 2019Madeleine Lee Suh Shin – 893,070 – – 893,070 15 April 2016 April 2019
Senior Executives 627,135 – – 190,867 818,002 12 July 2013 September 2017516,000 – – – 516,000 12 July 2013 July 2018
– 8,449,260 – – 8,449,260 15 April 2016 April 2019 Total 4,060,666 20,466,345 (95,432) – 24,431,579 (i) Mr. Napoleon L. Nazareno resigned from the Board of Directors with effect from 30 June 2016 and his outstanding share awards were reclassified under “Senior
Executives”.(ii) Ambassador Albert F. del Rosario was re-appointed to the Board of Directors with effect from 30 June 2016.
Unvestedshares held at
1 January 2015
Sharesvested andtransferred
during the period
Unvestedshares held at30 June 2015 Grant date Fully vested by
Executive DirectorsManuel V. Pangilinan, Managing Director
and Chief Executive Officer 2,044,996 – 2,044,996 12 July 2013 September 2017Robert C. Nicholson 1,329,247 – 1,329,247 12 July 2013 September 2017
Non-executive DirectorNapoleon L. Nazareno 286,300 – 286,300 12 July 2013 September 2017
Independent Non-executive DirectorsProf. Edward K.Y. Chen, GBS, CBE, JP 286,300 – 286,300 12 July 2013 September 2017Margaret Leung Ko May Yee, SBS, JP 238,582 (95,432) 143,150 12 July 2013 March 2018Philip Fan Yan Hok 238,582 (95,432) 143,150 12 July 2013 March 2018
Senior Executives 940,700 – 940,700 12 July 2013 September 2017860,000 – 860,000 12 July 2013 July 2018
Total 6,224,707 (190,864) 6,033,843

62 First Pacific Company Limited
Notes to the Condensed Interim Consolidated Financial Statements
(b) Particulars of the Company’s Subscription Awards Unvested
sharesheld at
1 January 2016Shares granted
during the period
Shares vested andtransferred
during the period
Unvestedshares held at30 June 2016
Unvestedshares held at
1 January 2015and 30 June 2015 Grant date Fully vested by
Senior Executives 313,571 – – 313,571 470,352 29 August 2013 September 2017– – – – 220,000 29 August 2013 September 2017
860,000 – (344,000) 516,000 860,000 15 July 2014 February 2019– 4,416,489(i) – 4,416,489 – 15 April 2016 April 2019
Total 1,173,571 4,416,489 (344,000) 5,246,060 1,550,352 (i) 132,000 shares were awarded by re-granting the forfeited and unallocated shares.
On 15 April 2016, 19,573,275 share awards were granted as Purchase Awards and 4,416,489 share awards were granted as Subscription Awards under the Company’s Share Award Scheme. The average fair value of shares granted as calculated by Towers Watson Hong Kong Limited, by adjusting the closing share price at the grant date by the present value of expected dividend payments during the vesting period, was HK$4.71 per share or an aggregate value of US$14.5 million for all shares granted. The assumptions used were as follows:
Share price at the date of grant HK$4.95 per shareExpected dividend yield 2.4% per annumAverage risk-free interest rate (based on the Hong Kong Exchange Fund Notes) 0.6% per annum
On 30 June 2016, 893,070 share awards were granted as Purchase Awards under the Company’s Share Award Scheme. The average fair value of shares granted as calculated by Towers Watson Hong Kong Limited, by adjusting the closing share price at the grant date by the present value of expected dividend payments during the vesting period, was HK$5.35 per share or an aggregate value of US$0.6 million for all shares granted. The assumptions used were as follows:
Share price at the date of grant HK$5.62 per shareExpected dividend yield 2.4% per annumAverage risk-free interest rate (based on the Hong Kong Exchange Fund Notes) 0.4% per annum
Further information regarding the Company’s Share Award Scheme has been set out on pages 192 to 195 of the Company’s 2015 Annual Report.

Interim Report 2016 63
18. Other Comprehensive (Loss)/Income Attributable to Owners of the Parent
US$ millionsExchange
reserve
Unrealizedgains on
available-for-sale assets
Unrealized(losses)/gains on
cash flowhedges
Income taxrelated tocash flow
hedges
Actuarial(losses)/gains
on definedbenefit
pension plans
Share of othercomprehensive
loss ofassociated
companies andjoint ventures Total
Balance at 1 January 2015As previously reported (307.7) 14.9 (28.0) 4.1 (28.4) (34.0) (379.1)Prior year adjustments 23.5 – – – – – 23.5 As restated (284.2) 14.9 (28.0) 4.1 (28.4) (34.0) (355.6)
Other comprehensive (loss)/income for the periodAs previously reported (92.2) 27.5 19.8 (3.3) 5.0 (85.0) (128.2)Prior year adjustments 3.0 – – – – – 3.0 As restated (89.2) 27.5 19.8 (3.3) 5.0 (85.0) (125.2)
Acquisition and dilution of interests in subsidiary companies (1.0) – – – – (0.7) (1.7)
Balance at 30 June 2015 (374.4) 42.4 (8.2) 0.8 (23.4) (119.7) (482.5) Balance at 1 January 2016
As previously reported (542.3) 52.3 (32.6) 5.0 (17.5) (118.7) (653.8)Prior year adjustments 30.6 – – – – – 30.6 As restated (511.7) 52.3 (32.6) 5.0 (17.5) (118.7) (623.2)
Other comprehensive income/(loss) for the period 40.8 4.5 22.6 (4.0) (0.2) (5.0) 58.7Recycled to retained earnings – – – – – (1.3) (1.3)Acquisition, divestment and dilution of interests in
subsidiary companies 9.8 – – – – (1.5) 8.3 Balance at 30 June 2016 (461.1) 56.8 (10.0) 1.0 (17.7) (126.5) (557.5)
19. Notes to the Condensed Consolidated Statement of Cash Flows(A) Increased Investments in a Joint Venture
2016’s cash outflow of US$238.6 million relates to MPIC’s partial payments to PCEV for its acquisition of an additional 25% interest in Beacon Electric in May 2016.
(B) Increase Investments in Preferred Shares issued by a Joint Venture2016’s cash outflow of US$197.6 million relates to MPIC’s payments to (a) PCEV for its acquisition of preferred shares issued by Beacon Electric (US$123.1 million) and (b) Beacon Electric for subscription of additional preferred shares (US$74.5 million).
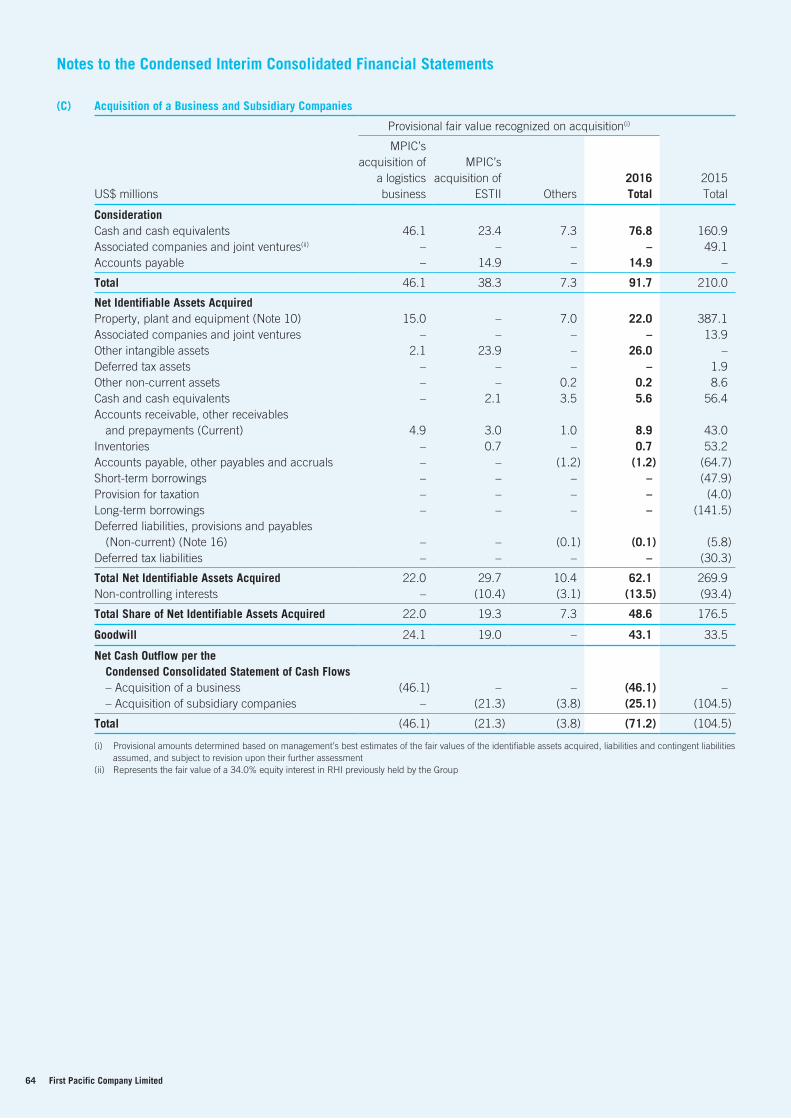
64 First Pacific Company Limited
Notes to the Condensed Interim Consolidated Financial Statements
(C) Acquisition of a Business and Subsidiary Companies Provisional fair value recognized on acquisition(i)
US$ millions
MPIC’sacquisition of
a logisticsbusiness
MPIC’sacquisition of
ESTII Others2016Total
2015Total
ConsiderationCash and cash equivalents 46.1 23.4 7.3 76.8 160.9Associated companies and joint ventures(ii) – – – – 49.1Accounts payable – 14.9 – 14.9 – Total 46.1 38.3 7.3 91.7 210.0 Net Identifiable Assets AcquiredProperty, plant and equipment (Note 10) 15.0 – 7.0 22.0 387.1Associated companies and joint ventures – – – – 13.9Other intangible assets 2.1 23.9 – 26.0 –Deferred tax assets – – – – 1.9Other non-current assets – – 0.2 0.2 8.6Cash and cash equivalents – 2.1 3.5 5.6 56.4Accounts receivable, other receivables
and prepayments (Current) 4.9 3.0 1.0 8.9 43.0Inventories – 0.7 – 0.7 53.2Accounts payable, other payables and accruals – – (1.2) (1.2) (64.7)Short-term borrowings – – – – (47.9)Provision for taxation – – – – (4.0)Long-term borrowings – – – – (141.5)Deferred liabilities, provisions and payables
(Non-current) (Note 16) – – (0.1) (0.1) (5.8)Deferred tax liabilities – – – – (30.3) Total Net Identifiable Assets Acquired 22.0 29.7 10.4 62.1 269.9Non-controlling interests – (10.4) (3.1) (13.5) (93.4) Total Share of Net Identifiable Assets Acquired 22.0 19.3 7.3 48.6 176.5 Goodwill 24.1 19.0 – 43.1 33.5 Net Cash Outflow per the
Condensed Consolidated Statement of Cash Flows– Acquisition of a business (46.1) – – (46.1) –– Acquisition of subsidiary companies – (21.3) (3.8) (25.1) (104.5)
Total (46.1) (21.3) (3.8) (71.2) (104.5) (i) Provisional amounts determined based on management’s best estimates of the fair values of the identifiable assets acquired, liabilities and contingent liabilities
assumed, and subject to revision upon their further assessment(ii) Represents the fair value of a 34.0% equity interest in RHI previously held by the Group

Interim Report 2016 65
On 19 May 2016, MetroPac Movers, Inc. (MMI), a subsidiary company of MPIC, acquired a logistics business and certain assets at a consideration of Pesos 2.2 billion (US$46.1 million). The transaction costs of US$0.3 million incurred by MMI for this business combination have been recognized as administrative expenses in the condensed consolidated income statement.
On 16 June 2016, MWIC, a subsidiary company of MPIC, acquired a 65.0% interest in ESTII at a consideration of Pesos 1.8 billion (US$38.3 million). ESTII principally engages in the business of designing, supplying, constructing, installing and operating and maintaining wastewater and sewage treatment plant facilities in the Philippines. The transaction costs of US$0.1 million incurred by MWIC for this business combination have been recognized as administrative expenses in the condensed consolidated income statement.
The net assets of the logistics business and ESTII recognized in the Group’s 2016 condensed interim consolidated financial statements were based on provisional assessments of their fair values while the Group is still evaluating the fair values of their assets acquired and liabilities and contingent liabilities assumed. The valuation and assessment had not been completed by the date the Group’s 2016 condensed interim consolidated financial statements were approved for issue by the Board of Directors. If new information obtained within one year of the acquisition dates about facts and circumstances that existed at the acquisition dates identify adjustments to the above provisional amounts, or any provisions that existed at the acquisition dates, then the accounting for the acquisition will be revised.
The goodwill arising from MPIC’s acquisition of the logistic business and ESTII pertains, but is not limited to, the expected synergies in the Group arising from the acquisition. None of the goodwill recognized is expected to be deductible for income tax purposes.
Since the dates of acquisition, the above acquired subsidiary companies recorded in aggregate a turnover of US$1.4 million and profit for the period of US$0.1 million which are included in the condensed consolidated income statement of the Group. If the acquisitions had taken place on 1 January 2016, the turnover and profit for the period ended 30 June 2016 of the Group would have been US$3,436.7 million and US$365.1 million, respectively.
2015’s net cash outflow of US$104.5 million mainly relates to RHI’s acquisition of SCBI, an ethanol manufacturing company in the Philippines, and Indofood’s acquisition of Asian Assets Management Pte. Ltd, a company based in Singapore which has a 100% interest in PT Aston Inti Makmur (AIM). AIM principally engages in property business and operates its own office building, Ariobimo Sentral Building located in Jakarta, Indonesia.
(D) Increased Investments in Associated Companies2015’s cash outflow of US$519.4 million relates to MPIC’s partial payments to Beacon Electric for its acquisition of an additional 10% direct interest in Meralco in April 2015 and final payment for its acquisition of a 5% direct interest in Meralco in June 2014.
(E) Investments in Joint Ventures2015’s cash outflow of US$423.4 million relates to the Group’s additional investments to increase its effective interest in Goodman Fielder by 40.2% to 50.0%.
(F) Proceeds from Issue of Shares to Non-controlling Shareholders by Subsidiary Companies2016’s cash inflow of US$471.7 million mainly represents MPIC’s proceeds from share placement (US$467.2 million) (2015: US$197.2 million).
(G) Proceeds from Divestment of Interests in a Subsidiary Company2016’s cash inflow of US$168.6 million represents the Group’s net proceeds from sale of MPIC shares.

66 First Pacific Company Limited
Notes to the Condensed Interim Consolidated Financial Statements
20. Commitments and Contingent Liabilities(A) Capital Expenditure
Consolidated
US$ millions
At 30 June
2016
At 31 December
2015 Commitments in respect of subsidiary companies:Authorized, but not contracted for 783.8 1,353.6Contracted, but not provided for 213.5 207.5 Total 997.3 1,561.1
The Group’s capital expenditure commitments principally relate to Indofood’s and RHI’s purchase of property, plant and equipment and construction of infrastructures for Maynilad’s water, MPTC’s toll road and LRMC’s rail businesses.
(B) Contingent Liabilities(a) At 30 June 2016, except for US$66.9 million (31 December 2015: US$73.4 million) of guarantees given by Indofood
for loan facilities obtained by certain plantation farmers in relation to arrangements for those farmers’ production and sale of fresh fruit bunches to Indofood, the Group had no significant contingent liabilities (31 December 2015: Nil).
(b) On 29 June 2011, the Supreme Court of the Philippines, or the Court, promulgated a Decision in the case of Wilson P. Gamboa vs. Finance Secretary Margarito B. Teves, et. al. (G.R. No. 176579) (the “Gamboa Case”), holding that “the term ‘capital’ in Section 11, Article XII of the 1987 Constitution refers only to shares of stock entitled to vote in the election of directors and thus only to voting common shares, and not to the total outstanding capital stock (common and non-voting preferred shares)”. This decision reversed earlier opinions issued by the Philippine Securities and Exchange Commission (SEC) that non-voting preferred shares are included in the computation of the 60%-40% Filipino-alien equity requirement of certain economic activities, such as telecommunications (which is a public utility under Section 11, Article XII of the 1987 Constitution).
Although PLDT is not a party to the Gamboa Case, in its decision, the Court directed the Philippine SEC “to apply this definition of the term ‘capital’ in determining the extent of allowable foreign ownership in PLDT, and if there is a violation of Section 11, Article XII of the 1987 Constitution, to impose the appropriate sanctions under the law.” Although the parties to the Gamboa Case filed Motions for Reconsideration of the decision and argued their positions before the Court, the Court ultimately denied the motions on 9 October 2012.
Meanwhile, on 5 July 2011, the Board of Directors of PLDT approved the amendments to the Seventh Article of Amended Articles of Incorporation of PLDT, or the Amendments to the Articles, which subclassified its authorized preferred capital into preferred shares with full voting rights, or Voting Preferred Shares, and serial preferred shares without voting rights. The Amendments to the Articles were subsequently approved by the stockholders of PLDT and the Philippine SEC.
On 15 October 2012, PLDT and BTF Holdings, Inc. (BTFHI), a Filipino corporation and a wholly-owned company of The Board of Trustees for the Account of the Beneficial Trust Fund created pursuant to the PLDT’s Benefit Plan, entered into a Subscription Agreement, pursuant to which PLDT issued 150 million Voting Preferred Shares to BTFHI at Peso 1 per share reducing the percentage of PLDT’s voting stock held by foreigners from 56.62% (based on Voting Common Shares) as at 15 October 2012 to 18.37% (based on Voting Common and Preferred Shares) as at 15 April 2013.

Interim Report 2016 67
On 20 May 2013, the Philippine SEC issued SEC Memorandum Circular No. 8, Series of 2013, or the Philippine SEC Guidelines, which PLDT believes was intended to fulfill the Court’s directive to the Philippine SEC in the Gamboa Case. The Philippine SEC Guidelines provided that “the required percentage of Filipino ownership shall be applied to BOTH: (a) the total number of outstanding shares of stock entitled to vote in the election of directors; AND (b) the total number of outstanding shares of stock, whether or not entitled to vote in the election of directors.” PLDT believes it was, and continues to be, compliant with the Philippine SEC Guidelines. As at 29 July 2016, PLDT’s foreign ownership was 29.49% of its outstanding shares entitled to vote (Common and Voting Preferred Shares), and 16.21% of its total outstanding capital stock. Therefore, PLDT believes that as at 29 July 2016, PLDT is in compliance with the requirement of Section 11, Article XII of the 1987 Constitution.
On 10 June 2013, Jose M. Roy III filed a petition for certiorari with the Supreme Court against the Philippine SEC, Philippine SEC Chairperson Teresita Herbosa and PLDT, claiming: (1) that the Philippine SEC Guidelines violate the Court’s decision in the Gamboa Case (on the basis that (a) the 60-40 ownership requirement be imposed on “each class of shares” and (b) Filipinos must have full beneficial ownership of 60% of the outstanding capital stock of corporations subject to the foreign ownership requirements); and (2) that the PLDT Beneficial Trust Fund is not a Filipino-owned entity and consequently, the corporations owned by PLDT Beneficial Trust Fund, including BTFHI, cannot be considered Filipino-owned corporations.
PLDT raised several procedural and substantive arguments against the petition, including in particular, that (a) the Philippine SEC Guidelines merely implemented the dispositive portion of the decision in the Gamboa Case, and that the dispositive portion of the Gamboa Case that defines “capital” is properly reflected in the Philippine SEC Guidelines, and (b) the fundamental requirements which need to be satisfied in order for PLDT Beneficial Trust Fund and BTFHI to be considered Filipino (for PLDT Beneficial Trust Fund’s Trustees to be Filipinos and for 60% of the Fund to accrue to the benefit of Philippine nationals) are satisfied with respect to the PLDT Beneficial Trust Fund, and therefore, PLDT Beneficial Trust Fund and BTFHI are Filipino shareholders for the purposes of classifying their 150 million Voting Preferred Shares in PLDT. As a result, more than 60% of PLDT’s total voting stock is Filipino-owned and PLDT is compliant with the Constitutional ownership requirements.
In 2013, the Philippine SEC and Chairperson Teresita Herbosa also raised a number of arguments for dismissal of the petition for being procedurally flawed and for lack of merit.
In May 2014, the petitioner filed a consolidated reply and a motion for the issuance of a temporary restraining order to prevent PLDT from holding its 2014 annual stockholders meeting. The temporary restraining order was denied and PLDT held its 2014 annual meeting on 10 June 2014 as scheduled.
On 10 February 2015, PLDT filed a consolidated memorandum setting forth its arguments against the petition.
As at 2 August 2016, the resolution of the petition remained pending with the Supreme Court.

68 First Pacific Company Limited
Notes to the Condensed Interim Consolidated Financial Statements
21. Share OptionsParticulars of the share options of the Company and its subsidiary companies granted to the Directors and senior executives of the Company and its subsidiary companies at 30 June 2016 are set out below.
(A) Particulars of the Company’s Share Option Scheme
Shareoptionsheld at
1 January2016
Shareoptionsgrantedduring
the period
Shareoptions
exercisedduring
the period
Shareoptions
cancelledduring
the period Reclassification
Shareoptionsheld at
30 June2016
Shareoption
exerciseprice per
share(i)
(HK$)
Market priceper share
immediatelybefore the
date of grant(i)
(HK$) Grant date Fully vested by Exercisable from Exercisable until Executive Directors
Manuel V. Pangilinan,Managing Director and
Chief Executive Officer
18,000,000 – (3,000,000) – – 15,000,000 4.9457 4.9363 5 September 2007 September 2012 September 2008 September 201710,224,972 – – – – 10,224,972 10.2299 10.4450 22 March 2013 September 2017 September 2013 March 2023
Edward A. Tortorici 5,112,486 – – – – 5,112,486 10.2299 10.4450 22 March 2013 September 2017 September 2013 March 202310,348,694 – – – – 10,348,694 10.2729 9.7213 4 June 2013 September 2017 September 2013 June 2023
5,112,486 – – – – 5,112,486 10.2299 7.72 29 August 2013 September 2017 September 2013 August 2023Robert C. Nicholson 13,704,933 – – – – 13,704,933 4.9457 4.9363 5 September 2007 September 2012 September 2008 September 2017
6,646,232 – – – – 6,646,232 10.2299 10.4450 22 March 2013 September 2017 September 2013 March 20237,281,203 – – – – 7,281,203 10.2729 9.7213 4 June 2013 September 2017 September 2013 June 2023
Non-Executive DirectorsBenny S. Santoso 1,066,177 – – – – 1,066,177 4.9457 4.9363 5 September 2007 September 2008 September 2008 September 2017
715,748 – – – – 715,748 10.2299 10.4450 22 March 2013 September 2017 September 2013 March 20231,097,139 – – – – 1,097,139 10.2729 9.7213 4 June 2013 September 2017 September 2013 June 2023
715,748 – – – – 715,748 10.2299 7.72 29 August 2013 September 2017 September 2013 August 2023– 1,339,600 – – – 1,339,600 4.972 4.950 15 April 2016 April 2019 April 2017 April 2022
Napoleon L. Nazareno(ii) 3,404,916 – – – (3,404,916) – 4.9457 4.5575 11 December 2009 December 2010 – –1,097,139 – – – (1,097,139) – 10.2729 9.7213 4 June 2013 September 2017 – –
Independent Non-Executive DirectorsProf. Edward K.Y. Chen,
GBS, CBE, JP
3,405,651 – – – – 3,405,651 4.9457 4.9363 5 September 2007 September 2008 September 2008 September 20171,097,139 – – – – 1,097,139 10.2729 9.7213 4 June 2013 September 2017 September 2013 June 2023
Margaret Leung Ko May Yee,SBS, JP
715,748 – – – – 715,748 10.2299 10.4450 22 March 2013 March 2018 March 2015 March 20231,097,139 – – – – 1,097,139 10.2729 9.7213 4 June 2013 March 2018 March 2015 June 2023
Philip Fan Yan Hok 715,748 – – – – 715,748 10.2299 10.4450 22 March 2013 March 2018 March 2015 March 20231,097,139 – – – – 1,097,139 10.2729 9.7213 4 June 2013 March 2018 March 2015 June 2023
Senior Executives 36,803,889 – – (7,583,032) – 29,220,857 4.9457 4.9363 5 September 2007 September 2012 September 2008 September 2017– – – – 3,404,916 3,404,916 4.9457 4.5575 11 December 2009 December 2010 December 2010 December 2019
3,542,137 – – – 3,542,137 5.1932 5.2127 18 June 2010 June 2015 June 2012 June 202017,075,702 – – (2,862,992) – 14,212,710 10.2299 10.4450 22 March 2013 September 2017 September 2013 March 202333,019,503 – – (4,591,013) 1,097,139 29,525,629 10.2729 9.7213 4 June 2013 September 2017 September 2013 June 202314,638,000 – – – – 14,638,000 10.2514 7.72 29 August 2013 July 2018 July 2015 August 20237,538,000 – – – – 7,538,000 10.2514 9.24 15 July 2014 February 2019 February 2016 July 2024
– 1,184,750 – – – 1,184,750 4.972 4.950 15 April 2016 April 2019 April 2017 April 2022 Total 205,273,668 2,524,350 (3,000,000)(iii) (15,037,037) – 189,760,981(iv) (i) Adjusted for the effect of the Company’s rights issue completed in July 2013 for the prices prior to the trading of the Company’s shares on an ex-rights basis on 6 June
2013 and the Company’s rights issue completed in December 2009 for the prices prior to the trading of the Company’s shares on an ex-rights basis on 29 October 2009
(ii) Mr. Napoleon L. Nazareno resigned from the Board of Directors with effect from 30 June 2016 and his outstanding share options were reclassified under “Senior Executives”.
(iii) The weighted average closing prices of the Company’s shares immediately before and at the dates on which these share options were exercised are HK$4.88 and HK$4.86, respectively.
(iv) The number of outstanding share options vested and exercisable at 30 June 2016 was 135,644,594. These share options have a weighted average exercise price of HK$7.55.

Interim Report 2016 69
Share
options
held at
1 January
2015
Share
options
exercised
during
the period Reclassification
Share
options
held at
30 June
2015
Share
option
exercise
price per
share(i)
(HK$)
Market price
per share
immediately
before the
date of grant(i)
(HK$) Grant date Fully vested by Exercisable from Exercisable until
Executive Directors
Manuel V. Pangilinan, Managing Director
and Chief Executive Officer
18,000,000 – – 18,000,000 4.9457 4.9363 5 September 2007 September 2012 September 2008 September 2017
10,224,972 – – 10,224,972 10.2299 10.4450 22 March 2013 September 2017 September 2013 March 2023
Edward A. Tortorici 5,112,486 – – 5,112,486 10.2299 10.4450 22 March 2013 September 2017 September 2013 March 2023
10,348,694 – – 10,348,694 10.2729 9.7213 4 June 2013 September 2017 September 2013 June 2023
5,112,486 – – 5,112,486 10.2299 7.72 29 August 2013 September 2017 September 2013 August 2023
Robert C. Nicholson 13,704,933 – – 13,704,933 4.9457 4.9363 5 September 2007 September 2012 September 2008 September 2017
6,646,232 – – 6,646,232 10.2299 10.4450 22 March 2013 September 2017 September 2013 March 2023
7,281,203 – – 7,281,203 10.2729 9.7213 4 June 2013 September 2017 September 2013 June 2023
Non-Executive Directors
Benny S. Santoso 1,066,177 – – 1,066,177 4.9457 4.9363 5 September 2007 September 2008 September 2008 September 2017
715,748 – – 715,748 10.2299 10.4450 22 March 2013 September 2017 September 2013 March 2023
1,097,139 – – 1,097,139 10.2729 9.7213 4 June 2013 September 2017 September 2013 June 2023
715,748 – – 715,748 10.2299 7.72 29 August 2013 September 2017 September 2013 August 2023
Napoleon L. Nazareno 3,404,916 – – 3,404,916 4.9457 4.5575 11 December 2009 December 2010 December 2010 December 2019
1,097,139 – – 1,097,139 10.2729 9.7213 4 June 2013 September 2017 September 2013 June 2023
Independent Non-Executive Directors
Graham L. Pickles(ii) 1,431,496 – (1,431,496) – 10.2299 10.4450 22 March 2013 September 2017 – –
1,097,139 – (1,097,139) – 10.2729 9.7213 4 June 2013 September 2017 – –
Prof. Edward K.Y. Chen, GBS, CBE, JP 3,405,651 – – 3,405,651 4.9457 4.9363 5 September 2007 September 2008 September 2008 September 2017
1,097,139 – – 1,097,139 10.2729 9.7213 4 June 2013 September 2017 September 2013 June 2023
Margaret Leung Ko May Yee, SBS, JP 715,748 – – 715,748 10.2299 10.4450 22 March 2013 March 2018 March 2015 March 2023
1,097,139 – – 1,097,139 10.2729 9.7213 4 June 2013 March 2018 March 2015 June 2023
Philip Fan Yan Hok 715,748 – – 715,748 10.2299 10.4450 22 March 2013 March 2018 March 2015 March 2023
1,097,139 – – 1,097,139 10.2729 9.7213 4 June 2013 March 2018 March 2015 June 2023
Senior Executives 36,803,889 – – 36,803,889 4.9457 4.9363 5 September 2007 September 2012 September 2008 September 2017
3,792,137 (250,000) – 3,542,137 5.1932 5.2127 18 June 2010 June 2015 June 2012 June 2020
15,644,206 – 1,431,496 17,075,702 10.2299 10.4450 22 March 2013 September 2017 September 2013 March 2023
31,922,364 – 1,097,139 33,019,503 10.2729 9.7213 4 June 2013 September 2017 September 2013 June 2023
17,178,000 – – 17,178,000 10.2514 7.72 29 August 2013 July 2018 July 2015 August 2023
7,538,000 – – 7,538,000 10.2514 9.24 15 July 2014 February 2019 February 2016 July 2024
Total 208,063,668 (250,000)(iii) – 207,813,668(iv)
(i) Adjusted for the effect of the Company’s rights issue completed in July 2013 for the prices prior to the trading of the Company’s shares on an ex-rights basis on 6 June 2013 and the Company’s rights issue completed in December 2009 for the prices prior to the trading of the Company’s shares on an ex-rights basis on 29 October 2009.
(ii) Mr. Graham L. Pickles retired from the Board of Directors with effect from 3 June 2015 and his outstanding share options were reclassified under “Senior Executives”.(iii) The weighted average closing prices of the Company’s shares immediately before and at the dates on which these share options were exercised are HK$7.66 and
HK$7.73, respectively.(iv) The number of outstanding share options vested and exercisable at 30 June 2015 was 121,195,653. These share options have a weighted average exercise price of
HK$6.76.
On 15 April 2016, 2,524,350 share options under a share option scheme (the Scheme) approved by the shareholders of the Company (at the Company’s annual general meeting held on 31 May 2012) were granted. The average fair value of options granted as calculated by Towers Watson Hong Kong Limited, based on the binomial model, was HK$1.05 each or an aggregate value of US$0.3 million for all options granted. The assumptions used were as follows:
Share price at the date of grant HK$4.95 per shareExercise price HK$4.972 per shareExpected volatility (based on historical volatility of the Company’s shares
commensurate with the average expected life of the options granted) 29%Option life 6 yearsExpected dividend yield 2.4% per annumAverage risk-free interest rate (based on the Hong Kong Exchange Fund Notes) 1.0% per annum

70 First Pacific Company Limited
Notes to the Condensed Interim Consolidated Financial Statements
Taking into account the expected turnover rate of the senior executives and the early exercise behavior, the average expected life of the options granted was estimated to be around 5 years. The early exercise behavior assumes that option holders will exercise the options when the share price is at least 150% higher than the exercise price. No other feature of the option granted was incorporated into the measurement of fair value.
The binomial model, applied for determining the estimated values of the share options granted under the Scheme, was developed for use in estimating the fair value of the traded options that are fully transferable. Such an option pricing model requires input of highly subjective assumptions, including the expected share price volatility. As the Company’s share options have characteristics significantly different from those of the traded options, changes in the subjective input assumptions can materially affect the estimated value of the options granted.
At the date of approval of the condensed interim consolidated financial statements, the Company had 186,356,065 share options outstanding under the schemes, which represented approximately 4.4% of the Company’s shares in issue as at that date.
Further information regarding the Company’s share option scheme has been set out on pages 211 to 216 of the Company’s 2015 Annual Report.
(B) Particulars of MPIC’s Share Option Scheme
Shareoptionsheld at
1 January2016
Shareoptions
exercisedduring
the period
Shareoptionsheld at
30 June2016
Shareoption
exerciseprice per
share(Peso)
Market priceper share
immediatelybefore the
date of grant(Peso) Grant date Fully vested by Exercisable from Exercisable until
Executive DirectorsManuel V. Pangilinan 6,250,000 (4,250,000) 2,000,000 4.60 4.59 14 October 2013 October 2015 October 2014 October 2018Edward A. Tortorici 5,000,000 – 5,000,000 4.60 4.59 14 October 2013 October 2015 October 2014 October 2018Robert C. Nicholson 5,000,000 – 5,000,000 4.60 4.59 14 October 2013 October 2015 October 2014 October 2018
Senior Executives 102,750,000 (27,650,000) 75,100,000 4.60 4.59 14 October 2013 October 2015 October 2014 October 2018 Total 119,000,000 (31,900,000)(i) 87,100,000(ii) (i) The weighted average closing prices of MPIC’s shares immediately before and at the dates on which these share options were exercised are Pesos 5.91 and Pesos 5.92,
respectively.(ii) The number of outstanding share options vested and exercisable at 30 June 2016 was 87,100,000. These share options have a weighted average exercise price of
Pesos 4.60.
Shareoptionsheld at
1 January2015
Shareoptions
exercisedduring
the period
Shareoptionsheld at
30 June2015
Shareoption
exerciseprice per
share(Peso)
Market priceper share
immediatelybefore the
date of grant(Peso) Grant date Fully vested by Exercisable from Exercisable until
Executive DirectorsManuel V. Pangilinan 6,250,000 – 6,250,000 4.60 4.59 14 October 2013 October 2015 October 2014 October 2018Edward A. Tortorici 5,000,000 – 5,000,000 4.60 4.59 14 October 2013 October 2015 October 2014 October 2018Robert C. Nicholson 10,000,000 (10,000,000) – 2.73 2.65 2 July 2010 July 2013 January 2011 July 2015
5,000,000 – 5,000,000 4.60 4.59 14 October 2013 October 2015 October 2014 October 2018Senior Executives 18,060,000 (12,025,000) 6,035,000 2.73 2.65 2 July 2010 July 2013 January 2011 July 2015
3,500,000 (3,500,000) – 3.50 3.47 21 December 2010 August 2013 August 2011 August 2015778,000 (778,000) – 3.66 3.66 14 April 2011 April 2013 April 2012 April 2016
102,750,000 – 102,750,000 4.60 4.59 14 October 2013 October 2015 October 2014 October 2018 Total 151,338,000 (26,303,000)(i) 125,035,000(ii) (i) The weighted average closing prices of MPIC’s shares immediately before and at the dates on which these share options were exercised are Pesos 4.94 and Pesos 4.89,
respectively.(ii) The number of outstanding share options vested and exercisable at 30 June 2015 was 65,535,000. These share options have a weighted average exercise price of
Pesos 4.43.
Further information regarding MPIC’s share option scheme has been set out on pages 217 to 219 of the Company’s 2015 Annual Report.

Interim Report 2016 71
(C) Particulars of RHI’s Share Option Scheme
Shareoptionsheld at
1 January2016
Shareoptions
exercisedduring
the period
Shareoptionsheld at
30 June 2016(i)
Shareoption
exerciseprice
per share(i)
(Peso)
Market priceper share
immediatelybefore the
date of grant(ii)
(Peso) Grant dateFully
vested byExercisable
fromExercisable
until Executive Director
Manuel V. Pangilinan 500,000 – 500,000 5.32 7.09 30 April 2014 April 2019 April 2015 April 2019Senior Executives 20,918,717 (2,919,049) 17,999,668 2.49 2.66 29 July 2013 July 2018 July 2014 July 2018
2,646,729 – 2,646,729 2.49 5.31 2 January 2014 January 2019 January 2015 January 201934,490,274 (317,303) 34,172,971 5.32 7.09 30 April 2014 April 2019 April 2015 April 2019
Total 58,555,720 (3,236,352)(ii) 55,319,368(iii) (i) Before adjusting for the effect of RHI’s rights issue completed in May 2016 as the adjustments are in the course of implementation(ii) The weighted average closing prices of RHI’s shares immediately before and at the dates on which these share options were exercised are Pesos 4.97 and Pesos 4.99,
respectively.(iii) The number of outstanding share options vested and exercisable at 30 June 2016 was 19,020,998. These share options have a weighted average exercise price of
Pesos 4.53.
Share options
held at27 February
2015(the date ofacquisition)
and 30 June2015
Share optionexercise
priceper share(i)
(Peso)
Market priceper share
immediatelybefore the
date of grant(i)
(Peso) Grant date Fully vested by Exercisable from Exercisable until Executive Director
Manuel V. Pangilinan 500,000 5.32 7.09 30 April 2014 April 2019 April 2015 April 2019Senior Executives 21,846,906 2.49 2.66 29 July 2013 July 2018 July 2014 July 2018
2,646,729 2.49 5.31 2 January 2014 January 2019 January 2015 January 201938,308,567 5.32 7.09 30 April 2014 April 2019 April 2015 April 2019
Total 63,302,202(ii) (i) Before adjusting for the effect of RHI’s rights issue completed in May 2016(ii) The number of outstanding share options vested and exercisable at 30 June 2015 was 12,987,088. These share options have a weighted average exercise price of
Pesos 4.18.
Further information regarding RHI’s share option scheme has been set out on pages 219 and 220 of the Company’s 2015 Annual Report.
22. Related Party TransactionsSignificant related party transactions entered into by the Group during the period are disclosed as follows:
(A) Asia Link B.V. (ALBV), a wholly-owned subsidiary company of the Company, has a technical assistance agreement with Smart, a wholly-owned subsidiary company of PLDT, for ALBV to provide Smart with technical support services and assistance in the operations and maintenance of cellular mobile telecommunications services for a period of four years from 23 February 2012, subject to renewal upon mutual agreement between the parties. The agreement expired on 23 February 2016 and was renewed for a period of two years to 23 February 2018. The agreement provides for payments of technical service fees equivalent to 0.4% (2015: 0.4%) of the consolidated net revenue of Smart.
For the period ended 30 June 2016, the fees under the above arrangement amounted to Pesos 95 million (US$2.0 million) (2015: Pesos 103 million or US$2.3 million). At 30 June 2016, the outstanding technical service fee payable amounted to Pesos 15 million (US$0.3 million) (31 December 2015: Pesos 46 million or US$1.0 million).

72 First Pacific Company Limited
Notes to the Condensed Interim Consolidated Financial Statements
(B) In December 2014, ALBV entered into a subscription agreement with SMECI, a wholly-owned subsidiary company of Philex, in respect of the subscription for the convertible notes issued by SMECI with a principal amount of Pesos 5.04 billion (US$107.1 million) (out of the total Pesos 7.2 billion (US$153.0 million) convertible notes issued by SMECI), principally for financing capital expenditure of the Silangan project and repaying the advances from Philex. The convertible notes bear interest at a coupon rate of 1.5%, payable semi-annually every 18 June and 18 December and has a maturity of eight years, with a one-time redemption option exercisable by SMECI on the first anniversary of the issuance of the notes (i.e., 18 December 2015). A redemption premium, payable at a rate of 3% per annum, retroactive from the issue date and compounded semi-annually, will apply if SMECI exercises the redemption option or upon the maturity of the convertible notes. SMECI did not exercise the one-time redemption option on 18 December 2015. During the period ended 30 June 2016, ALBV accrued interest income of US$2.4 million (2015: US$2.4 million) on these notes.
(C) On 30 May 2016, MPIC acquired from PCEV, a subsidiary of PLDT, an additional 25% interest in Beacon Electric’s common shares (Pesos 20.4 billion or US$434.3 million) and preferred shares (Pesos 5.8 billion or US$123.1 million) at a total consideration of Pesos 26.2 billion (US$557.4 million), of which Pesos 17.0 billion (US$361.7 million) was settled in cash in May 2016. The outstanding payable of Pesos 9.2 billion (US$195.7 million) will be settled in annual installments until June 2020. At 30 June 2016, the outstanding consideration payable due in June 2017 of Pesos 2.0 billion (US$42.4 million) (with a present value of US$34.4 million) was included in the current portion of deferred liabilities, provisions and payables (Note 16) and the remaining outstanding consideration due between June 2018 to June 2020 of Pesos 7.2 billion (with a present value of US$139.0 million) was included in the non-current portion of deferred liabilities, provisions and payables (Note 16).
(D) In March 2013, Meralco PowerGen, through its wholly-owned subsidiary company, MPG Asia Limited, provided a loan of US$110.0 million to FPM Power. In June 2014, MPG Asia Limited provided an additional loan of US$3.5 million to FPM Power. The loans are unsecured, interest-free and have no fixed terms of repayment. The loans of US$113.5 million (31 December 2015: US$113.5 million) remained outstanding at 30 June 2016 and are included in the current portion of deferred liabilities, provisions and payables (Note 16).
(E) At 30 June 2016, Petronas Power Sdn. Bhd. (Petronas), the 30% shareholder of PLP, has outstanding loans due from PLP of approximately US$118.1 million (31 December 2015: US$110.5 million), which have been included in non-current portion of deferred liabilities, provisions and payables (Note 16). The loans are unsecured, subject to a variable Singapore Swap Offer Rate and London Interbank Offered Rate, which are payable semi-annually. The tenor for each loan shall be 10 years. For the period ended 30 June 2016, PLP accrued interest expenses of US$4.2 million (2015: US$3.5 million) to Petronas, which were compounded as part of the outstanding loans from Petronas. At 30 June 2016, PLP has approximately US$22,815 (31 December 2015: US$22,512) of outstanding interest payable due to Petronas which has been included in accounts payable, other payables and accruals.
(F) At 30 June 2016, Mr. Robert C. Nicholson, a Director of the Company, owned US$400,000 (31 December 2015: US$400,000) of bonds due 2017 issued by FPMH Finance Limited, US$200,000 (31 December 2015: US$200,000) of bonds due 2020 issued by FPT Finance Limited and US$600,000 (31 December 2015: US$600,000) of bonds due 2019 issued by FPC Finance Limited, all of which are wholly-owned subsidiary companies of the Company. For the period ended 30 June 2016, Mr. Nicholson received interest income of US$39,125 (2015: US$39,125) on these bonds.
(G) At 30 June 2016, Mr. Edward A. Tortorici, a Director of the Company, owned US$600,000 (31 December 2015: US$600,000) of bonds due 2019 issued by FPC Finance Limited, a wholly-owned subsidiary company of the Company. For the period ended 30 June 2016, Mr. Tortorici received interest income of US$18,000 (2015: US$18,000) on these bonds.
(H) At 30 June 2016, Ambassador Albert F. del Rosario, who has been re-appointed as a Director of the Company with effect from 30 June 2016, owned US$200,000 of bonds due 2020 issued by FPT Finance Limited and US$200,000 of bonds due 2019 issued by FPC Finance Limited, both of which are wholly-owned subsidiary companies of the Company.

Interim Report 2016 73
(I) Key Management Personnel Compensation
Nature of Transactions For the six months ended 30 June 2016 2015US$ millions Non-performance based
– Salaries and benefits 32.6 32.1– Pension contributions 4.9 3.2
Performance based– Bonuses and long-term monetary incentive awards 31.4 28.1
Share-based compensation benefit expenses 6.7 7.0Fees 0.3 0.2 Total 75.9 70.6
(J) In the ordinary course of business, Indofood has engaged in trade transactions with certain of its associated companies, joint ventures and affiliated companies under certain framework agreements which are related to the Salim Family either through its control or joint control. Mr. Anthoni Salim is the Chairman and a substantial shareholder of the Company and is the President Director and Chief Executive Officer of Indofood.
All significant transactions with related parties, whether or not conducted under normal terms and conditions similar to those with non-related parties, are disclosed as follows:
Nature of Transactions For the six months ended 30 June 2016 2015US$ millions Income Statement ItemsSales of finished goods
– to associated companies and joint ventures 29.3 29.2– to affiliated companies 48.1 49.8
Purchases of raw materials and finished goods– from associated companies and joint ventures 110.3 81.2
Management and technical services fee income and royalty income– from associated companies and joint ventures 1.4 1.4– from affiliated companies 4.4 7.6
Rental income– from associated companies and joint ventures 0.1 0.1
Insurance expenses– to affiliated companies 3.2 4.1
Rental expenses– to associated companies and joint ventures 0.1 0.1– to affiliated companies 1.7 1.7
Transportation, pump services and employee expenses– to affiliated companies 0.4 0.3
Approximately 3% (2015: 3%) of Indofood’s sales and 6% (2015: 4%) of its purchases were transacted with these related parties.

74 First Pacific Company Limited
Notes to the Condensed Interim Consolidated Financial Statements
Nature of Balances
US$ millions
At30 June
2016
At31 December
2015 Statement of Financial Position ItemsAccounts receivable – trade
– from associated companies and joint ventures 8.7 5.0– from affiliated companies 12.6 12.2
Accounts receivable – non-trade– from associated companies and joint ventures 2.1 3.1– from affiliated companies 20.0 23.2
Accounts payable – trade– to associated companies and joint ventures 23.3 16.9– to affiliated companies 1.3 1.0
Accounts payable – non-trade– to associated companies and joint ventures 0.2 0.2– to affiliated companies 38.0 24.6
(K) In January 2015, MPIC’s subsidiary company, Maynilad renewed (i) the framework agreement with D.M. Consunji, Inc. (Consunji), a subsidiary company of DMCI Holdings Inc. (DMCI) (a 27.2% shareholder of MWHC, Maynilad’s parent company) for the period from 13 January 2015 to 31 December 2017 on substantially the same terms as the previous framework agreement in relation to the provision of engineering, procurement and construction services by Consunji to Maynilad and (ii) the lease agreement with DMCI Project Developers, Inc. (DMCIPD), a subsidiary company of DMCI, for the renting of certain premises in Makati City by DMCIPD to Maynilad for the period from 1 February 2015 to 31 January 2018. For the period ended 30 June 2016, Maynilad entered into certain construction contracts with DMCI group for the latter’s construction of water infrastructure for Maynilad.
All significant transactions with DMCI group, whether or not conducted under normal terms and conditions similar to those with non-related parties, are disclosed as follows:
Nature of Transactions For the six months ended 30 June 2016 2015US$ millions Capital Expenditure ItemsConstruction services for water infrastructure 9.9 28.0Income Statement ItemsRental expenses 0.1 0.1

Interim Report 2016 75
(L) For the period ended 30 June 2016, MPIC’s subsidiary company, MNTC, collected toll fees through TMC, an associated company of MPIC.
All significant transactions with TMC, whether or not conducted under normal terms and conditions similar to those with non-related parties, are disclosed as follows:
Nature of Transactions For the six months ended 30 June 2016 2015US$ millions Income Statement ItemsOperator’s fee 21.4 18.5Management income 1.0 0.4
Nature of Balances
US$ millions
At30 June
2016
At31 December
2015 Statement of Financial Position ItemsAccounts receivable – trade 2.1 2.3Accounts payable – trade 21.4 10.2
(M) For the period ended 30 June 2016, MPIC and its subsidiary companies were charged for electricity expenses by Meralco, an associated company of the Group.
All significant transactions with Meralco, whether or not conducted under normal terms and conditions similar to those with non-related parties, are disclosed as follows:
Nature of Transactions For the six months ended 30 June 2016 2015US$ millions Income Statement ItemsElectricity expenses 11.6 11.3
Nature of Balances
US$ millions
At30 June
2016
At31 December
2015 Statement of Financial Position ItemsAccounts payable – trade 0.8 0.3

76 First Pacific Company Limited
Notes to the Condensed Interim Consolidated Financial Statements
(N) For the period ended 30 June 2016, MPIC was entitled to dividend income on preferred shares from Beacon Electric, a joint venture of the Group. In March 2010, MPIC subscribed Pesos 8.0 billion (US$170.2 million) of Beacon Electric’s preferred shares and extended non-interest-bearing cash advances to Beacon Electric of Pesos 756 million (US$16.1 million). In June 2012, MPIC acquired approximately Pesos 3.6 billion (US$75.7 million) of Beacon Electric’s preferred shares. In May 2016, MPIC subscribed Pesos 3.5 billion (US$74.4 million) of Beacon Electric’s preferred shares and acquired Pesos 5.8 billion (US$123.0 million) (with a book carrying amount, which reflected the effect of discounting, of Pesos 5.5 billion or US$117.9 million) of Beacon Electric’s preferred shares from PCEV (Note 22(C)).
On 17 April 2015, MPIC acquired an additional 10% interest in Meralco from Beacon Electric at an aggregate consideration of Pesos 26.5 billion (US$581.0 million), of which Pesos 18.0 billion (US$394.7 million) was settled in cash in April and June 2015. The outstanding payable of Pesos 8.5 billion (US$182.8 million) was included in the accounts payable, other payables and accruals in the consolidated statement of financial position at 30 June 2016.
All significant transactions with Beacon Electric, whether or not conducted under normal terms and conditions similar to those with non-related parties, are disclosed as follows:
Nature of Transactions For the six months ended 30 June 2016 2015US$ millions Income Statement ItemsPreferred share dividend income 25.9 9.1
Nature of Balances
US$ millions
At30 June
2016
At31 December
2015 Statement of Financial Position ItemsAssociated companies and joint ventures
– Preferred shares, at cost 438.2 245.9– Amounts due from associated companies and joint ventures 16.1 16.1– Accounts payable, other payables and accruals 182.8 179.6
(O) For the period ended 30 June 2016, MPIC and its subsidiary companies had the following transactions with PLDT, an associated company of the Group.
All significant transactions with PLDT, whether or not conducted under normal terms and conditions similar to those with non-related parties, are disclosed as follows:
Nature of Transactions For the six months ended 30 June 2016 2015US$ millions Income Statement ItemsVoice and data service expenses 1.0 1.0Income from advertising 0.4 0.4Rental expenses 0.1 0.1
Nature of Balances
US$ millions
At30 June
2016
At31 December
2015 Statement of Financial Position ItemsAccounts receivable – trade 0.4 0.6Accounts payable – trade 1.7 1.6

Interim Report 2016 77
(P) For the period ended 30 June 2016, MNTC had the following transactions with Easytrip Services Corporation (ESC), a joint venture of the Group.
All significant transactions with ESC, whether or not conducted under normal terms and conditions similar to those with non-related parties, are disclosed as follows:
Nature of Transactions For the six months ended 30 June 2016 2015US$ millions Income Statement ItemsService expenses 0.7 0.7
Nature of Balances
US$ millions
At30 June
2016
At31 December
2015 Statement of Financial Position ItemsAccounts receivable – trade 10.9 4.9Accounts payable – trade 0.5 1.3
(Q) For the period ended 30 June 2016, MPIC and its subsidiary companies had the following transactions with Indra Philippines, Inc. (Indra), an associated company of the Group since 14 October 2015.
All significant transactions with Indra, whether or not conducted under normal terms and conditions similar to those with non-related parties, are disclosed as follows:
Nature of Transactions For the six months ended 30 June 2016 2015US$ millions Income Statement ItemsService expenses 3.3 –
Nature of Balances
US$ millions
At30 June
2016
At31 December
2015 Statement of Financial Position ItemsAccounts payable – trade 0.3 0.4
(R) First Pacific Management Services Limited (FPMSL), a wholly-owned subsidiary company of the Company, has a service agreement with Goodman Fielder for FPMSL to provide Goodman Fielder with management, advisory and financial services with effect from 17 March 2015 and subject to an annual review on the terms and conditions by the end of each reporting period between the parties.
For the period ended 30 June 2016, the fees under the above arrangement amounted to A$0.6 million (US$0.4 million) (2015: Nil). At 30 June 2016, FPMSL has approximately A$0.1 million (US$0.1 million) (31 December 2015: A$0.1 million or US$0.1 million) of outstanding service fees receivable from Goodman Fielder which has been included in accounts receivable, other receivables and prepayments.

78 First Pacific Company Limited
Notes to the Condensed Interim Consolidated Financial Statements
23. Financial Instruments(A) Financial Instruments by Category
(a) Financial AssetsThe following table summarizes the Group’s financial assets at the end of the reporting period.
At 30 June 2016 At 31 December 2015
US$ million
Loans and
receivables
Available-for-
sale financial
assets
Financial
assets at
fair value Total
Loans and
receivables
Available-for-
sale financial
assets
Financial
assets at
fair value Total
Accounts and other receivables (Non-current) 132.7(i) – 8.5 141.2 125.7(i) – 7.0 132.7
Available-for-sale assets (Non-current) – 573.5(ii) – 573.5 – 290.0(ii) – 290.0
Pledged deposits and restricted cash (Non-current) 30.0 – – 30.0 30.0 – – 30.0
Other non-current assets 62.8 – – 62.8 57.0 – – 57.0
Cash and cash equivalents and short-term deposits 1,687.3 – – 1,687.3 1,612.3 – – 1,612.3
Restricted cash (Current) 52.9 – – 52.9 51.7 – – 51.7
Available-for-sale assets (Current) – 100.1 – 100.1 – 124.8 – 124.8
Accounts and other receivables (Current) 919.4 – 9.1 928.5 702.2 – 18.0 720.2
Total 2,885.1 673.6 17.6(iii) 3,576.3 2,578.9 414.8 25.0(iii) 3,018.7
(i) Includes amounts due from associated companies and joint ventures of US$126.4 million (31 December 2015: US$123.9 million)(ii) Includes preferred shares issued by Beacon Electric of US$438.2 million (31 December 2015: US$245.9 million)(iii) Represents derivative assets in respect of derivatives designated as hedging instruments
(b) Financial LiabilitiesThe following table summarizes the Group’s financial liabilities at the end of the reporting period.
At 30 June 2016 At 31 December 2015
US$ million
Financialliabilities
at amortizedcost
Financialliabilities
at fair value Total
Financialliabilities
at amortizedcost
Financialliabilities
at fair value Total Accounts payable, other payables and
accruals 1,145.3 – 1,145.3 1,031.6 – 1,031.6Short-term borrowings 1,178.6 – 1,178.6 998.6 – 998.6Current portion of deferred liabilities,
provisions and payables 9.9 19.3 29.2 13.3 68.9 82.2Long-term borrowings 5,388.5 – 5,388.5 5,363.3 – 5,363.3Deferred liabilities, provisions and
payables 696.5 5.1 701.6 682.2 6.6 688.8 Total 8,418.8 24.4(iv) 8,443.2 8,089.0 75.5(iv) 8,164.5 (iv) Represents derivative liabilities in respect of derivatives designated as hedging instruments
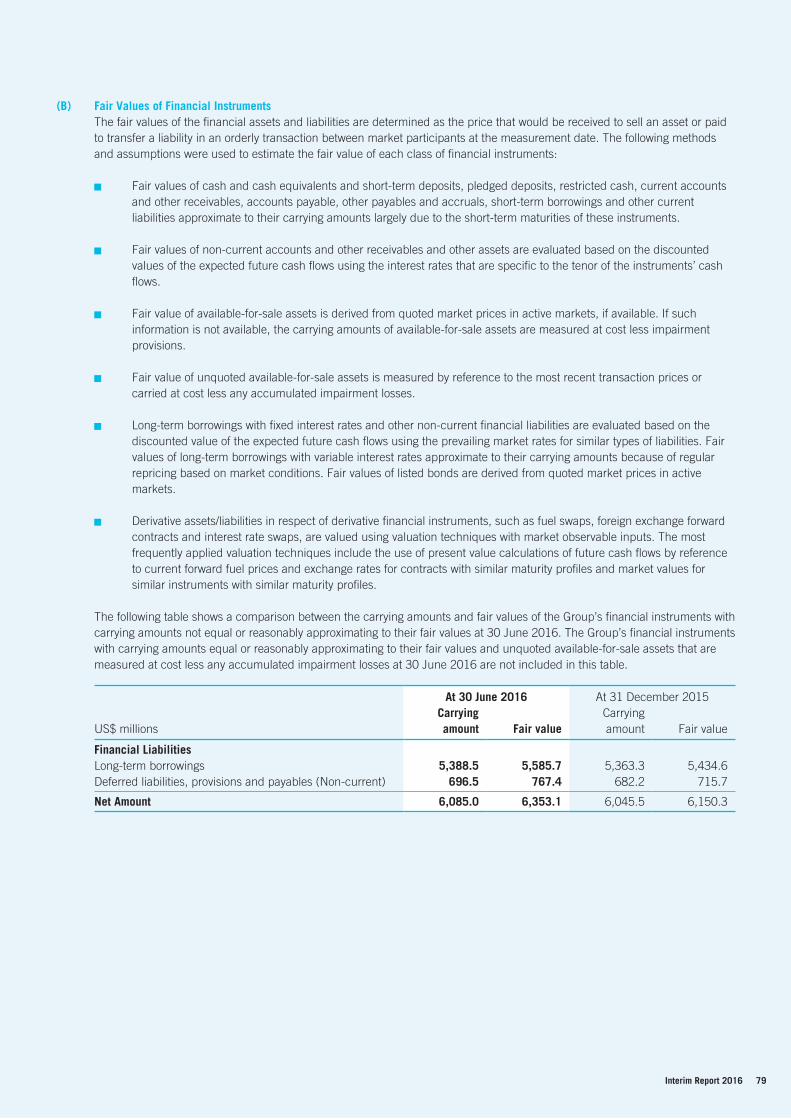
Interim Report 2016 79
(B) Fair Values of Financial InstrumentsThe fair values of the financial assets and liabilities are determined as the price that would be received to sell an asset or paid to transfer a liability in an orderly transaction between market participants at the measurement date. The following methods and assumptions were used to estimate the fair value of each class of financial instruments:
Fair values of cash and cash equivalents and short-term deposits, pledged deposits, restricted cash, current accounts and other receivables, accounts payable, other payables and accruals, short-term borrowings and other current liabilities approximate to their carrying amounts largely due to the short-term maturities of these instruments.
Fair values of non-current accounts and other receivables and other assets are evaluated based on the discounted values of the expected future cash flows using the interest rates that are specific to the tenor of the instruments’ cash flows.
Fair value of available-for-sale assets is derived from quoted market prices in active markets, if available. If such information is not available, the carrying amounts of available-for-sale assets are measured at cost less impairment provisions.
Fair value of unquoted available-for-sale assets is measured by reference to the most recent transaction prices or carried at cost less any accumulated impairment losses.
Long-term borrowings with fixed interest rates and other non-current financial liabilities are evaluated based on the discounted value of the expected future cash flows using the prevailing market rates for similar types of liabilities. Fair values of long-term borrowings with variable interest rates approximate to their carrying amounts because of regular repricing based on market conditions. Fair values of listed bonds are derived from quoted market prices in active markets.
Derivative assets/liabilities in respect of derivative financial instruments, such as fuel swaps, foreign exchange forward contracts and interest rate swaps, are valued using valuation techniques with market observable inputs. The most frequently applied valuation techniques include the use of present value calculations of future cash flows by reference to current forward fuel prices and exchange rates for contracts with similar maturity profiles and market values for similar instruments with similar maturity profiles.
The following table shows a comparison between the carrying amounts and fair values of the Group’s financial instruments with carrying amounts not equal or reasonably approximating to their fair values at 30 June 2016. The Group’s financial instruments with carrying amounts equal or reasonably approximating to their fair values and unquoted available-for-sale assets that are measured at cost less any accumulated impairment losses at 30 June 2016 are not included in this table.
At 30 June 2016 At 31 December 2015
US$ millionsCarryingamount Fair value
Carryingamount Fair value
Financial LiabilitiesLong-term borrowings 5,388.5 5,585.7 5,363.3 5,434.6Deferred liabilities, provisions and payables (Non-current) 696.5 767.4 682.2 715.7 Net Amount 6,085.0 6,353.1 6,045.5 6,150.3

80 First Pacific Company Limited
Notes to the Condensed Interim Consolidated Financial Statements
(C) Fair Value HierarchyThe Group uses the following hierarchy for determining and disclosing the fair values of financial instruments:
Level 1: fair values measured based on quoted prices (unadjusted) in active markets for identical assets or liabilities
Level 2: fair values measured based on the most recent transaction prices and valuation techniques for which all inputs which have a significant effect on the recorded fair values are observable, either directly or indirectly
Level 3: fair values measured based on valuation techniques for which any inputs which have a significant effect on the recorded fair values that are not based on observable market data (unobservable inputs)
The Group held the following financial instruments measured at fair value as at the end of the reporting period.
At 30 June 2016 At 31 December 2015US$ million Level 1 Level 2 Level 3 Total Level 1 Level 2 Level 3 Total Available-for-sale assets
– Listed equity investments 87.1 – – 87.1 121.2 – – 121.2– Listed debentures 34.2 – – 34.2 36.2 – – 36.2– Unlisted investments – 102.0 – 102.0 – 2.0 – 2.0
Derivative assets(i) – 17.6 – 17.6 – 25.0 – 25.0Derivative liabilities(ii) – (24.4) – (24.4) – (75.5) – (75.5) Net Amount 121.3 95.2 – 216.5 157.4 (48.5) – 108.9 (i) Included within accounts receivable, other receivables and prepayments(ii) Included within deferred liabilities, provisions and payables
The fair values of unlisted investments, derivative assets and derivative liabilities in Level 2 are measured by reference to the most recent transaction prices and using the valuation techniques as described in Note 23(B) to the condensed interim consolidated financial statements, respectively.
For financial instruments that are recognized at fair value on a recurring basis, the Group determines whether transfers have occurred between Levels in the hierarchy by re-assessing categorization (based on the lowest level input that is significant to the fair value measurement as a whole) at the end of each reporting period. During the year, there were no transfers among Level 1, Level 2 and Level 3 fair value measurements.
24. Comparative AmountsAs explained in Note 1(B) to the condensed interim consolidated financial statements, due to the Group’s adoption of the amendments to HKAS 16 and 41 “Agriculture: Bearer Plants” with effect from 1 January 2016, certain prior year adjustments have been made and certain comparative amounts have been restated to conform with the current period’s accounting treatments and presentation.
25. Approval of the Condensed Interim Consolidated Financial StatementsThe condensed interim consolidated financial statements of the Company were approved and authorized for issue by the Board of Directors on 19 August 2016.

Interim Report 2016 81
Review Statement of the Audit and Risk Management CommitteeIn accordance with the requirements of paragraph 39 of Appendix 16 of the Listing Rules issued by SEHK, the Audit and Risk Management Committee has reviewed the Interim Report for the six months ended 30 June 2016, including the accounting policies and practices adopted by the Group. The Audit and Risk Management Committee also has discussed financial reporting, auditing, risk management and internal control matters with the Company’s management and its external auditors.

82 First Pacific Company Limited
Corporate Governance Report
Corporate Governance PracticesFirst Pacific is committed to building and maintaining high standards of corporate governance. During the period, the Company’s Corporate Governance Committee, comprised a majority of Independent Non-executive Directors (“INEDs”) and chaired by an INED, was delegated with the responsibility for supervision of the Company’s corporate governance functions, carried out a review of its corporate governance practices to ensure compliance with the Listing Rule requirements.
Throughout the period, First Pacific has applied the principles and complied with most of the Code Provisions and, where appropriate, adopted the Recommended Best Practices contained in the CG Code with the following exceptions:–
Code Provision C.2.5: Issuers should have an internal audit function. Issuers without an internal audit function should review the need for one on an annual basis and should disclose the reasons for the absence of such a function in the Corporate Governance Report.
Since the Group has multiple listed companies in Philippines, Indonesia and Singapore, as well as a joint venture company in Australia, each of which has its own internal audit and/or risk management functions to monitor the internal control system for operational, financial and compliance and risk management functions. Accordingly, the Company can rely on group resources to carry out internal audit/risk management functions for members of the Group. Taking this into account, the Company does not consider it necessary to have a separate internal audit function. The Company will review the need for such function on an annual basis.
Recommended Best Practice B.1.8: Issuers should disclose details of any remuneration payable to members of senior management, on an individual and named basis, in their annual reports.
The Company does not disclose such information as a large number of the senior executives employed by the Group are employed in jurisdictions that do not require disclosure of such information.
Recommended Best Practices C.1.6 and C.1.7: An issuer should announce and publish quarterly financial results within 45 days after the end of the relevant quarter.
The Company does not issue quarterly financial results as most of our major operating units based in the Philippines, Indonesia and Singapore already issue quarterly reports. As such, we believe that the relevant information is already available in the public domain.
On 30 June 2016, the Company re-appointed Ambassador Albert F. del Rosario as a Non-executive Director to replace Mr. Napoleon L. Nazareno, who resigned from the Board due to personal reasons.
Compliance of the Model Code for Securities Transactions by Directors of Listed IssuersThe Company has adopted its own Model Code for Securities Transactions by Directors (the “Model Code”) on terms no less exacting than the required standards of the Model Code for Securities Transactions by Directors of Listed Issuers, as set out in Appendix 10 of the Listing Rules. All Directors have confirmed, following specific enquiries by the Company, that they have complied with the required standards set out in the Model Code throughout the period.
Continuing Connected TransactionsDuring the period, the INEDs agreed with the Directors in relation to the following continuing connected transactions and approved the disclosure of the transactions in the form of a published announcement:
29 July 2016: following the previous announcement made on 15 October 2014 relating to certain continuing connected transactions in respect of the Indofood Group’s noodles business, plantations business, insurance business, distribution business, flour business, beverage business and dairy business and the respective Annual Caps for 2014, 2015 and 2016, the Annual Cap in respect of a continuing connected transaction between PT Indolakto, a subsidiary of Indofood, and PT Nippon Indosari Corpindo, an associate of Mr. Salim, has been increased from US$0.3 million (equivalent to approximately HK$2.3 million) to US$1.0 million (equivalent to approximately HK$7.8 million) as a result of expansion of the Dairy Business, thereby increasing the aggregated Annual Cap in respect of the Dairy Business Transactions relating to associates of Mr. Salim from US$6.1 million (equivalent to approximately HK$47.6 million) to US$6.8 million (equivalent to approximately HK$53.0 million) for 2016. Furthermore, SIMP, a member of the lndofood Group, proposed to enter into a revolving loan agreement with the Plantation Joint Venture companies (“the Borrowers”) whereby SIMP will provide a revolving loan facility of up to US$40 million (equivalent to approximately HK$312 million) to the Borrowers, which are the Company’s connected subsidiaries relating to the Indofood Group’s plantations business, in order to finance the immediate and urgent working capital requirements of the Borrowers and to facilitate the smooth running of their operations. In compliance with the Listing Rule requirements, the Company announced the revised Annual Cap in respect of the Dairy Business Transactions relating to associates of Mr. Salim for 2016 as well as the entering into of the revolving loan agreement between SIMP and the Borrowers on 29 July 2016.

Interim Report 2016 83
Internal Control and Risk ManagementThe Board is responsible for maintaining adequate systems of risk management and internal controls in the Group and reviewing their effectiveness through the Audit and Risk Management Committee.
During the period ended 30 June 2016, the Audit and Risk Management Committee reviewed and advised that:
The risk management and internal control systems of the Group function effectively and are designed to provide reasonable assurance that material assets are protected, business risks attributable to the Group are identified and monitored, material transactions are executed in accordance with management’s authorization and the financial statements are reliable for publication and compliant with all relevant laws and regulations.
There are processes in place for identifying, evaluating and managing the material business risks faced by the Group. Such processes are incorporated in all the Group’s businesses.
There are adequate resources, qualified and experienced staff, training programs and budget for the Group’s accounting and financial reporting function.
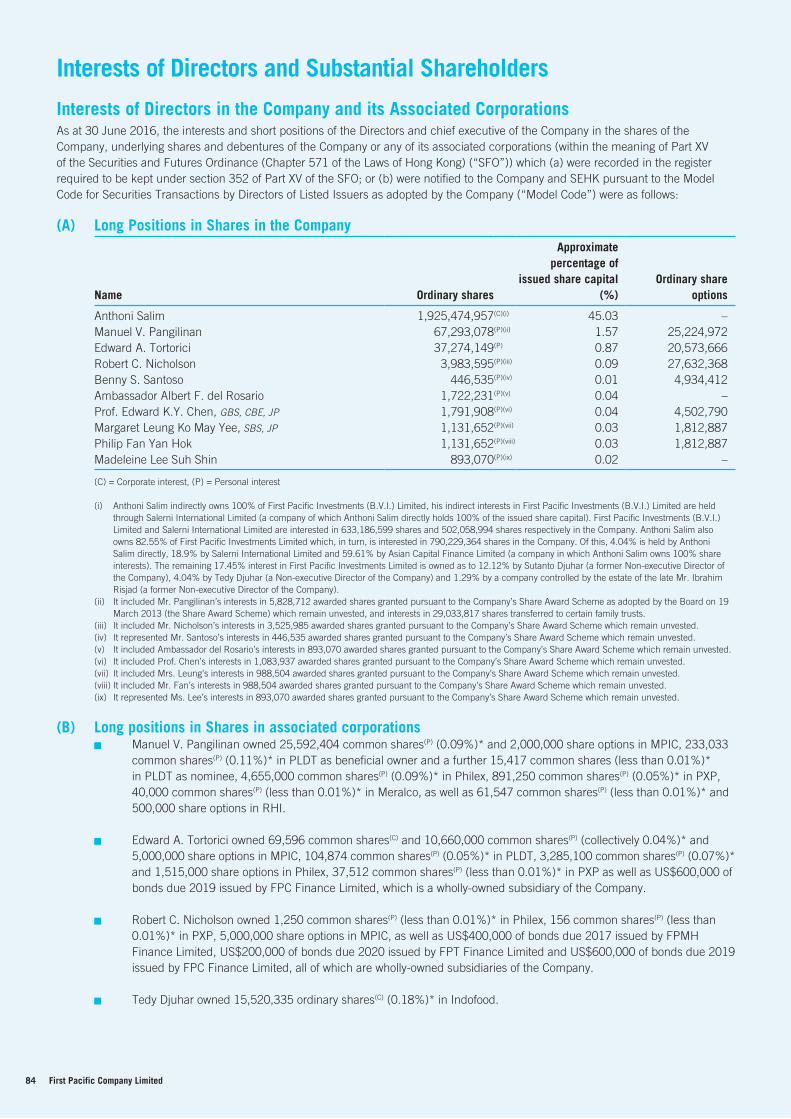
84 First Pacific Company Limited
Interests of Directors and Substantial Shareholders
Interests of Directors in the Company and its Associated CorporationsAs at 30 June 2016, the interests and short positions of the Directors and chief executive of the Company in the shares of the Company, underlying shares and debentures of the Company or any of its associated corporations (within the meaning of Part XV of the Securities and Futures Ordinance (Chapter 571 of the Laws of Hong Kong) (“SFO”)) which (a) were recorded in the register required to be kept under section 352 of Part XV of the SFO; or (b) were notified to the Company and SEHK pursuant to the Model Code for Securities Transactions by Directors of Listed Issuers as adopted by the Company (“Model Code”) were as follows:
(A) Long Positions in Shares in the Company
Name Ordinary shares
Approximate percentage of
issued share capital (%)
Ordinary share options
Anthoni Salim 1,925,474,957(C)(i) 45.03 –Manuel V. Pangilinan 67,293,078(P)(ii) 1.57 25,224,972Edward A. Tortorici 37,274,149(P) 0.87 20,573,666Robert C. Nicholson 3,983,595(P)(iii) 0.09 27,632,368Benny S. Santoso 446,535(P)(iv) 0.01 4,934,412Ambassador Albert F. del Rosario 1,722,231(P)(v) 0.04 –Prof. Edward K.Y. Chen, GBS, CBE, JP 1,791,908(P)(vi) 0.04 4,502,790Margaret Leung Ko May Yee, SBS, JP 1,131,652(P)(vii) 0.03 1,812,887Philip Fan Yan Hok 1,131,652(P)(viii) 0.03 1,812,887Madeleine Lee Suh Shin 893,070(P)(ix) 0.02 – (C) = Corporate interest, (P) = Personal interest
(i) Anthoni Salim indirectly owns 100% of First Pacific Investments (B.V.I.) Limited, his indirect interests in First Pacific Investments (B.V.I.) Limited are held through Salerni International Limited (a company of which Anthoni Salim directly holds 100% of the issued share capital). First Pacific Investments (B.V.I.) Limited and Salerni International Limited are interested in 633,186,599 shares and 502,058,994 shares respectively in the Company. Anthoni Salim also owns 82.55% of First Pacific Investments Limited which, in turn, is interested in 790,229,364 shares in the Company. Of this, 4.04% is held by Anthoni Salim directly, 18.9% by Salerni International Limited and 59.61% by Asian Capital Finance Limited (a company in which Anthoni Salim owns 100% share interests). The remaining 17.45% interest in First Pacific Investments Limited is owned as to 12.12% by Sutanto Djuhar (a former Non-executive Director of the Company), 4.04% by Tedy Djuhar (a Non-executive Director of the Company) and 1.29% by a company controlled by the estate of the late Mr. Ibrahim Risjad (a former Non-executive Director of the Company).
(ii) It included Mr. Pangilinan’s interests in 5,828,712 awarded shares granted pursuant to the Company’s Share Award Scheme as adopted by the Board on 19 March 2013 (the Share Award Scheme) which remain unvested, and interests in 29,033,817 shares transferred to certain family trusts.
(iii) It included Mr. Nicholson’s interests in 3,525,985 awarded shares granted pursuant to the Company’s Share Award Scheme which remain unvested.(iv) It represented Mr. Santoso’s interests in 446,535 awarded shares granted pursuant to the Company’s Share Award Scheme which remain unvested.(v) It included Ambassador del Rosario’s interests in 893,070 awarded shares granted pursuant to the Company’s Share Award Scheme which remain unvested.(vi) It included Prof. Chen’s interests in 1,083,937 awarded shares granted pursuant to the Company’s Share Award Scheme which remain unvested.(vii) It included Mrs. Leung’s interests in 988,504 awarded shares granted pursuant to the Company’s Share Award Scheme which remain unvested.(viii) It included Mr. Fan’s interests in 988,504 awarded shares granted pursuant to the Company’s Share Award Scheme which remain unvested.(ix) It represented Ms. Lee’s interests in 893,070 awarded shares granted pursuant to the Company’s Share Award Scheme which remain unvested.
(B) Long positions in Shares in associated corporations Manuel V. Pangilinan owned 25,592,404 common shares(P) (0.09%)* and 2,000,000 share options in MPIC, 233,033
common shares(P) (0.11%)* in PLDT as beneficial owner and a further 15,417 common shares (less than 0.01%)* in PLDT as nominee, 4,655,000 common shares(P) (0.09%)* in Philex, 891,250 common shares(P) (0.05%)* in PXP, 40,000 common shares(P) (less than 0.01%)* in Meralco, as well as 61,547 common shares(P) (less than 0.01%)* and 500,000 share options in RHI.
Edward A. Tortorici owned 69,596 common shares(C) and 10,660,000 common shares(P) (collectively 0.04%)* and 5,000,000 share options in MPIC, 104,874 common shares(P) (0.05%)* in PLDT, 3,285,100 common shares(P) (0.07%)* and 1,515,000 share options in Philex, 37,512 common shares(P) (less than 0.01%)* in PXP as well as US$600,000 of bonds due 2019 issued by FPC Finance Limited, which is a wholly-owned subsidiary of the Company.
Robert C. Nicholson owned 1,250 common shares(P) (less than 0.01%)* in Philex, 156 common shares(P) (less than 0.01%)* in PXP, 5,000,000 share options in MPIC, as well as US$400,000 of bonds due 2017 issued by FPMH Finance Limited, US$200,000 of bonds due 2020 issued by FPT Finance Limited and US$600,000 of bonds due 2019 issued by FPC Finance Limited, all of which are wholly-owned subsidiaries of the Company.
Tedy Djuhar owned 15,520,335 ordinary shares(C) (0.18%)* in Indofood.

Interim Report 2016 85
Anthoni Salim owned 1,329,770 ordinary shares(P) (0.02%)* in Indofood and an indirect interest of 4,396,103,450 Indofood shares (50.07%)* through the Company’s group companies, a direct interest of 2,007,788 shares(C) (0.14%)* in IndoAgri through his controlled corporations other than the Company and an indirect interest of 1,037,760,830 IndoAgri shares (74.34%)* through the Company’s group companies and a direct interest of 20,483,364 shares (0.13%)* in SIMP through his controlled corporations other than the Company and an indirect interest of 12,471,746,400 SIMP shares (80.46%)* through the Company’s group companies.
Ambassador Albert F. del Rosario owned 1 common share(P) (less than 0.01%)* in personal capacity and 206,789 common shares(P) (0.10%)* under joint names in PLDT, 1,450,000 common shares(P) (less than 0.01%)* in personal capacity and 11,516,624 common shares(P) (0.04%)* under joint names in MPIC, 100 common shares(P) (less than 0.01%)* in personal capacity and 675,000 common shares(P) (0.01%)* under joint names in Philex, 12 common shares(P) (less than 0.01%)* in personal capacity and 84,375 common shares(P) (less than 0.01%)* under joint names in PXP, 25,700 common shares(P) (less than 0.01%)* in personal capacity and 111,000 common shares(P) (0.01%)* under joint names in Meralco, as well as US$200,000 of bonds due 2020 issued by FPT Finance Limited and US$200,000 of bonds due 2019 issued by FPC Finance Limited, both of which are wholly-owned subsidiaries of the Company.
(P) = Personal interest, (C) = Corporate interest
* Approximate percentage of the issued capital of the respective class of shares in the respective associated corporations as at 30 June 2016.
Save for those disclosed above, as at 30 June 2016, none of the Directors and chief executive of the Company had any interests or short positions in respect of shares, underlying shares or debentures of the Company or any of its associated corporations (within the meaning of Part XV of the SFO) as recorded in the register required to be kept under Section 352 of the SFO, or as otherwise notified to the Company pursuant to the Model Code.
Interests of Substantial Shareholders in the CompanyThe interests and short positions of substantial shareholders in the shares and underlying shares of the Company as at 30 June 2016 as recorded in the register required to be kept under Section 336 of the SFO are set out below:
(a) Salerni International Limited (“Salerni”), which was incorporated in the British Virgin Islands, was interested in 1,135,245,593 ordinary shares of the Company at 30 June 2016, representing approximately 26.55% of the Company’s issued share capital at that date, by way of 502,058,994 ordinary shares of the Company held, representing approximately 11.74% of the Company’s issued share capital at that date and also its 100% interest in First Pacific Investments (B.V.I.) Limited (“FPIL-BVI”). Anthoni Salim, Chairman of the Company, beneficially owns the entire issued share capital of Salerni and, accordingly, is taken to be interested in the shares owned by Salerni.
(b) Asian Capital Finance Limited (“ACFL”), which was incorporated in the British Virgin Islands, was interested in 790,229,364 ordinary shares of the Company at 30 June 2016, representing approximately 18.48% of the Company’s issued share capital at that date, by way of its 59.61% interest in First Pacific Investments Limited (“FPIL-Liberia”). Anthoni Salim, Chairman of the Company, beneficially owns the entire issued share capital of ACFL and, accordingly, is taken to be interested in the shares owned by ACFL.
(c) FPIL-Liberia, which was incorporated in the Republic of Liberia, beneficially owned 790,229,364 ordinary shares at 30 June 2016, representing approximately 18.48% of the Company’s issued share capital at that date. FPIL-Liberia is owned by Salerni, ACFL, Anthoni Salim (Chairman of the Company), Tedy Djuhar (a Non-executive Director of the Company), Sutanto Djuhar (a former Non-executive Director of the Company) and a company controlled by the estate of the late Ibrahim Risjad (a former Non-executive Director of the Company), in the proportion specified in note (i) of the table on page 84. Anthoni Salim, Chairman of the Company, is taken to be interested in the shares owned by FPIL-Liberia.
(d) FPIL-BVI, which was incorporated in the British Virgin Islands, beneficially owned 633,186,599 ordinary shares at 30 June 2016, representing approximately 14.81% of the Company’s issued share capital at that date. Anthoni Salim, Chairman of the Company, indirectly owns the entire issued share capital of FPIL-BVI and, accordingly, is taken to be interested in the shares owned by FPIL-BVI.
(e) Lazard Asset Management LLC (“Lazard”), a United States incorporated company, notified the Company that it held 298,073,249 ordinary shares of the Company as at 5 April 2016, representing approximately 6.98% of the Company’s issued share capital at that date. At 30 June 2016, the Company has not received any other notification from Lazard of any change to such holding.

86 First Pacific Company Limited
Interests of Directors and Substantial Shareholders
(f) Brandes Investment Partners L.P. (“Brandes”), a United States incorporated company, notified the Company that it held 340,323,566 ordinary shares of the Company as at 22 June 2016, representing approximately 7.96% of the Company’s issued share capital at that date. At 30 June 2016, the Company has not received any other notification from Brandes of any change to such holding.
(g) Modern Retail Holdings Limited (“Modern Retail”), a Cayman Islands incorporated company, disclosed as at 11 November 2015 its security interest over 258,000,000 ordinary shares of the Company held by FPIL-BVI, representing approximately 6.04% of the Company’s issued share capital at that date. At 30 June 2016, the Company has not received any other notification from Modern Retail of any change to such holding.
(h) Mr. Ashish Jaiprakash Shastry disclosed his security interest over 258,000,000 ordinary shares of the Company as at 11 November 2015, representing approximately 6.04% of the Company’s issued share capital at that date. Mr. Shastry, by way of his 100% control of Modern Retail, is taken to be interested in the security interest of Modern Retail. At 30 June 2016, the Company has not received any other notification from Mr. Shastry of any change to such holding.
Other than as disclosed above, the Company had not been notified of any person (other than Directors or chief executive of the Company) at 30 June 2016 who had an interest or short position in the shares or underlying shares of the Company to be recorded in the register required to be kept under Section 336 of Part XV of the SFO.

Interim Report 2016 87
Purchase, Sale or Redemption of Listed SecuritiesDuring the six months ended 30 June 2016, the Company repurchased US$13.0 million (Six months ended 30 June 2015: Nil) of the US$400 million 4.5% Guaranteed Bonds due April 2023 issued by its subsidiary company, FPC Treasury Limited, at an aggregate consideration of US$13.3 million (Six months ended 30 June 2015: Nil). These bonds were subsequently cancelled.
During the six months ended 30 June 2016, the independent trustee managing the Company’s share award scheme subscribed 4,284,489 new shares (Six months ended 30 June 2015: Nil) issued by the Company at an aggregate consideration of HK$21.3 million (US$2.8 million) (Six months ended 30 June 2015: Nil) at the cost of the Company.
Except as disclosed above, neither the Company, nor any of its subsidiary companies, has made any purchase, sale or redemption of any of the Company’s listed securities during the period.

88 First Pacific Company Limited
Information for Investors
Financial DiaryPreliminary announcement of 2016
interim results 19 August 2016Last day to register for interim distribution 2 September 2016Payment of interim distribution 20 September 2016Interim report posted to shareholders 20 September 2016Financial year-end 31 December 2016Preliminary announcement of 2016 results 29 March 2017*
* Subject to confirmation
Head Office24th Floor, Two Exchange Square8 Connaught PlaceCentral, Hong Kong SARTelephone : +852 2842 4388Fax : +852 2845 9243Email : [email protected]
Registered OfficeCanon’s Court22 Victoria StreetHamilton HM12, BermudaTelephone : +1 441 295 2244Fax : +1 441 292 8666
Web Sitewww.firstpacific.com
Share InformationFirst Pacific shares are listed on The Stock Exchange of
Hong Kong Limited and are traded over the counter in theUnited States in the form of American Depositary Receipts
Listing date : 12 September 1988Par value : U.S.1 cent per shareLot size : 2,000 sharesNumber of ordinary shares issued: 4,275,750,092
Stock CodesSEHK : 00142Bloomberg : 142 HKThomson Reuters : 0142.HK
American Depositary Receipts (ADRs) InformationLevel: 1ADRs Code: FPAFYCUSIP reference number: 335889200ADRs to ordinary shares ratio: 1:5ADRs depositary bank: Deutsche Bank Trust Company Americas
To Consolidate ShareholdingsWrite to our principal share registrar and transfer
office in Bermuda at:MUFG Fund Services (Bermuda) LimitedThe Belvedere Building69 Pitts Bay RoadPembroke HM08, Bermuda
Or the Hong Kong branch registrar at:Computershare Hong Kong Investor Services Limited
Registrar Office17M Floor, Hopewell Centre183 Queen’s Road East, Wanchai, Hong Kong SARTelephone : +852 2862 8555Fax : +852 2865 0990/+852 2529 6087Email : [email protected]
Transfer OfficeShops 1712-1716, 17th Floor, Hopewell Centre183 Queen’s Road East, Wanchai, Hong Kong SAR
A Chinese Version of this Report, or Additional InformationAvailable at:www.firstpacific.com
Or contact:Sara CheungVice PresidentGroup Corporate CommunicationsFirst Pacific Company Limited24th Floor, Two Exchange Square8 Connaught PlaceCentral, Hong Kong SARTelephone : +852 2842 4317Email : [email protected]
AuditorsErnst & Young22nd Floor, CITIC Tower1 Tim Mei Avenue, Central, Hong Kong SAR
SolicitorsGibson, Dunn & Crutcher LLP32nd Floor, Gloucester Tower, The Landmark15 Queen’s Road Central, Hong Kong SAR
Principal BankersBank of America NAMizuho Corporate Bank, Ltd.Sumitomo Mitsui Banking CorporationThe Hongkong & Shanghai Banking CorporationBank of Philippine IslandsChina Banking Corporation

Interim Report 2016 89
Summary of Principal InvestmentsAs at 30 June 2016
PLDT Inc.PLDT (PSE: TEL; NYSE: PHI) is the leading telecommunications provider in the Philippines. Its shares are listed on the Philippine Stock Exchange and its American Depositary Receipts are listed on the New York Stock Exchange. It has one of the largest market capitalizations among Philippine listed companies. Through its principal business groups – fixed line and wireless – PLDT offers a wide range of telecommunications services across the Philippines’ most extensive fiber optic backbone and fixed line, and cellular network.
Sector : TelecommunicationsPlace of incorporation/business area : The PhilippinesOutstanding number of shares : 216.1 millionParticulars of outstanding shares held : Common shares of Pesos 5 par valueEconomic/voting interest : 25.6%/15.1%
Further information on PLDT can be found at www.pldt.com
PT Indofood Sukses Makmur TbkIndofood (IDX:INDF) is a leading Total Food Solutions company with operations in all stages of food manufacturing from the production of raw materials and their processing through to consumer products and distribution to the market. It is based and listed in Indonesia; its Consumer Branded Products subsidiary PT Indofood CBP Sukses Makmur Tbk and agribusiness subsidiaries PT Salim Ivomas Pratama Tbk and PT Perusahaan Perkebunan London Sumatra Indonesia Tbk are also listed in Indonesia. Two other subsidiaries, Indofood Agri Resources Ltd. and China Minzhong Food Corporation Limited, are listed in Singapore, and an agribusiness associate Roxas Holdings, Inc. is listed in the Philippines.
Through its five complementary Strategic Business groups, Indofood manufactures and distributes a wide range of food products: Consumer Branded Products (noodles, dairy, snack foods, food seasonings, nutrition and special foods, and beverages), Bogasari (wheat flour and pasta), Agribusiness (oil palm, rubber, sugar cane, cocoa and tea plantations, cooking oils, margarine and shortenings), Distribution and Cultivation & Processed Vegetables (fresh and processed vegetables).
Indofood is one of the world’s largest manufacturers by volume of wheat-based instant noodles, one of the largest plantation companies by area and the largest flour miller in Indonesia. Indofood also has an extensive distribution network across Indonesia.
Sector : Consumer Food ProductsPlace of incorporation/business area : IndonesiaIssued number of shares : 8.8 billionParticulars of issued shares held : Shares of Rupiah 100 par valueEconomic and voting interests : 50.1%
Further information on Indofood can be found at www.indofood.com
Metro Pacific Investments CorporationMPIC (PSE: MPI; ADR code: MPCIY) is a Philippine-listed investment management and holding company focused on infrastructure development.
Sector : Infrastructure, Utilities and HospitalsPlace of incorporation/business area : The PhilippinesIssued number of shares : 31.5 billionParticulars of issued shares held : Common shares of Peso 1 par valueEconomic/voting interest : 42.0%/55.0%
Further information on MPIC can be found at www.mpic.com.ph

90 First Pacific Company Limited
Summary of Principal Investments
FPW Singapore Holdings Pte. LtdFPW controls Goodman Fielder Pty Limited (“Goodman Fielder”).
Sector : Consumer Food ProductsPlace of incorporation/business area : Singapore/AustralasiaIssued number of shares : 204.9 millionParticulars of issued shares held : Shares with no par valueEconomic and voting interests : 50.0%
Goodman Fielder Pty LimitedGoodman Fielder is headquartered in Sydney, Australia and has over 40 manufacturing plants in Australia, New Zealand, Papua New Guinea, Fiji and New Caledonia. It is a leading food company in Australasia, offering packaged baked products, dairy products, flour, dressings, spreads, sauces, desserts, condiments, vinegar and cooking oils to over 30,000 retail outlets. Goodman Fielder’s corporate history spans over 100 years, and has developed iconic brands such as Meadow Lea, Praise, White Wings, Pampas, Helga’s, Wonder White, Vogel’s, Meadow Fresh, Edmonds and Irvines.
Sector : Consumer Food ProductsPlace of incorporation/business area : Australia/AustralasiaIssued number of shares : 2.0 billionParticulars of issued shares held : Common shares with no par valueEconomic and voting interests : 50.0%
Further information on Goodman Fielder can be found at www.goodmanfielder.com.au
Philex Mining CorporationPhilex (PSE: PX) is a Philippine-listed company engaged in the exploration and mining of mineral resources and, through a listed investment PXP Energy Corporation (PSE: PXP), in oil and gas exploration.
Sector : Natural ResourcesPlace of incorporation/business area : The PhilippinesIssued number of shares : 4.9 billionParticulars of issued shares held : Common shares of Peso 1 par valueEconomic and voting interests : 31.2%(1)
(1) Two Rivers Pacific Holdings Corporation, a Philippine affiliate of First Pacific, holds an additional 15.0% economic interest in Philex.
Further information on Philex can be found at www.philexmining.com.ph
FPM Power Holdings LimitedFPM Power controls PLP.
Sector : Infrastructure/UtilitiesPlace of incorporation/business area : British Virgin Islands/SingaporeIssued number of shares : 10,000Particulars of issued shares held : Shares of US$1 par valueEconomic/voting interests : 67.8%(2)/60.0%
(2) Includes a 7.8% effective economic interest in FPM Power held by First Pacific through its indirect interests in Meralco.
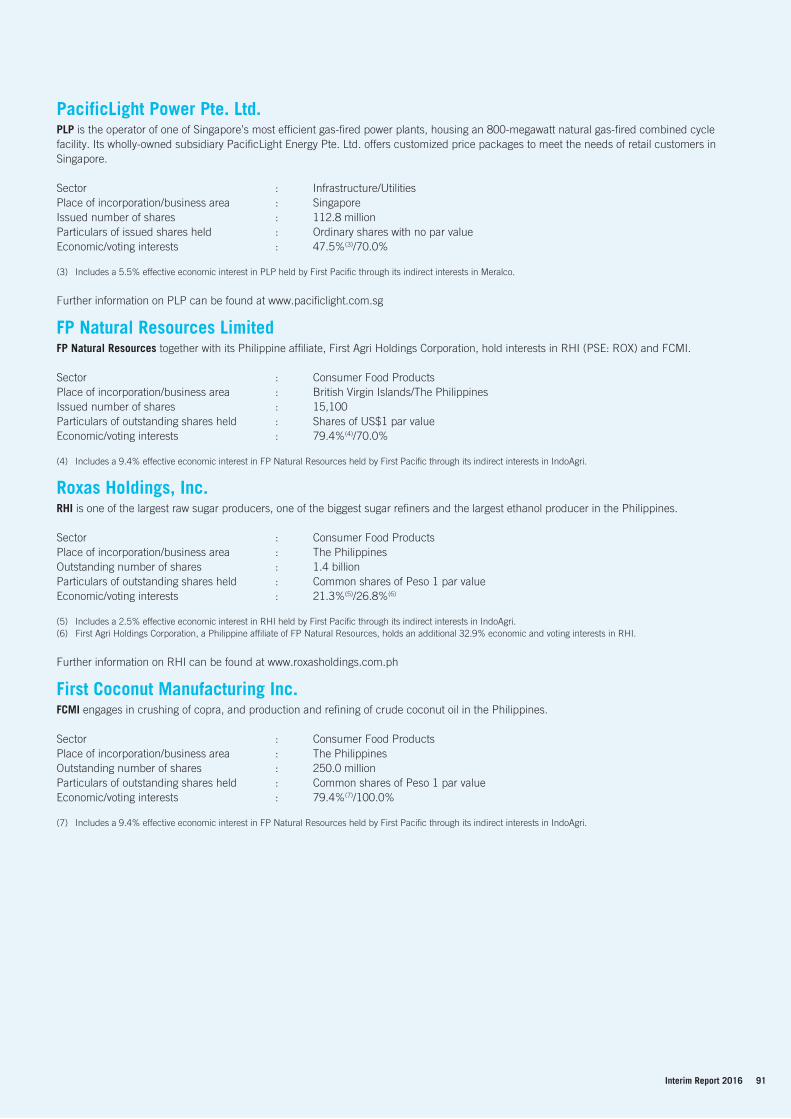
Interim Report 2016 91
PacificLight Power Pte. Ltd.PLP is the operator of one of Singapore’s most efficient gas-fired power plants, housing an 800-megawatt natural gas-fired combined cycle facility. Its wholly-owned subsidiary PacificLight Energy Pte. Ltd. offers customized price packages to meet the needs of retail customers in Singapore.
Sector : Infrastructure/UtilitiesPlace of incorporation/business area : SingaporeIssued number of shares : 112.8 millionParticulars of issued shares held : Ordinary shares with no par valueEconomic/voting interests : 47.5%(3)/70.0%
(3) Includes a 5.5% effective economic interest in PLP held by First Pacific through its indirect interests in Meralco.
Further information on PLP can be found at www.pacificlight.com.sg
FP Natural Resources LimitedFP Natural Resources together with its Philippine affiliate, First Agri Holdings Corporation, hold interests in RHI (PSE: ROX) and FCMI.
Sector : Consumer Food ProductsPlace of incorporation/business area : British Virgin Islands/The PhilippinesIssued number of shares : 15,100Particulars of outstanding shares held : Shares of US$1 par valueEconomic/voting interests : 79.4%(4)/70.0%
(4) Includes a 9.4% effective economic interest in FP Natural Resources held by First Pacific through its indirect interests in IndoAgri.
Roxas Holdings, Inc.RHI is one of the largest raw sugar producers, one of the biggest sugar refiners and the largest ethanol producer in the Philippines.
Sector : Consumer Food ProductsPlace of incorporation/business area : The PhilippinesOutstanding number of shares : 1.4 billionParticulars of outstanding shares held : Common shares of Peso 1 par valueEconomic/voting interests : 21.3%(5)/26.8%(6)
(5) Includes a 2.5% effective economic interest in RHI held by First Pacific through its indirect interests in IndoAgri.(6) First Agri Holdings Corporation, a Philippine affiliate of FP Natural Resources, holds an additional 32.9% economic and voting interests in RHI.
Further information on RHI can be found at www.roxasholdings.com.ph
First Coconut Manufacturing Inc.FCMI engages in crushing of copra, and production and refining of crude coconut oil in the Philippines.
Sector : Consumer Food ProductsPlace of incorporation/business area : The PhilippinesOutstanding number of shares : 250.0 millionParticulars of outstanding shares held : Common shares of Peso 1 par valueEconomic/voting interests : 79.4%(7)/100.0%
(7) Includes a 9.4% effective economic interest in FP Natural Resources held by First Pacific through its indirect interests in IndoAgri.

92 First Pacific Company Limited
Corporate StructureAs at 19 August 2016
Intermediateinvestmentholdingsubsidiariesand affiliates
(6)
(1) Economic interest(2) Two Rivers Pacific Holdings Corporation, a Philippine affiliate of First Pacific, holds additional 15.0% and 7.7% economic interests in Philex and PXP Energy
Corporation, respectively.(3) Includes a 7.8% effective economic interest in FPM Power held by First Pacific through its indirect interests in Manila Electric Company.(4) Includes a 9.4% effective economic interest in FP Natural Resources held by First Pacific through its indirect interests in Indofood Agri Resources Ltd.(5) First Agri Holdings Corporation, a Philippine affiliate of FP Natural Resources, holds an additional 32.9% economic interest in RHI and a 100.0% economic
interest in First Coconut Manufacturing Inc.(6) Listed company
Digital TelecommunicationsPhilippines, Inc.
Smart Communications, Inc.
PLDT Communications andEnergy Ventures, Inc.
100.0% Digitel MobilePhilippines, Inc.25.6%(1)(6)
99.6%
100.0%
25.0%(1)(2)
Silangan Mindanao Exploration Company, Inc.
67.8%(1)(3)
3.3%
FPM PowerHoldings Limited
100.0%
100.0%
100.0%
19.8%
70.0% 100.0%
26.8%(5)
79.4%(1)(4)
FP NaturalResources Limited
53.4%
58.2% 100.0% Forum (GSEC101) Limited
Roxas Holdings, Inc.(6)
PacificLight Power Pte. Limited
PXP Energy Corporation(6)
Pitkin Petroleum Limited
Silangan Mindanao Mining Co., Inc.
Forum Energy Limited
PacificLight EnergyPte. Limited
PT Indomarco Adi Prima
80.5%
62.8%(1)
7.0%
100.0%
82.9%
Indofood Agri Resources Ltd.(6)
PT Indofood CBP Sukses Makmur Tbk
(6)
73.5%59.5% PT Perusahaan
Perkebunan LondonSumatra Indonesia Tbk
(6)
PT Salim Ivomas Pratama Tbk
(6)
Beacon Electric AssetHoldings, Inc.
Maynilad Water HoldingCompany, Inc.
56.0%
34.96%
14.0%
100.0%
Maynilad WaterServices, Inc.
75.0%
5.2%
51.3% 92.9%
MetroPac Water InvestmentsCorporation
Metro Pacific Tollways Corporation
Metro Pacific TollwaysDevelopment Corporation
Don Muang TollwayPublic Company Limited
CII Bridges and Roads Investment Joint Stock Co.
Metro Pacific Hospital Holdings, Inc.
Light Rail Manila Corporation
AF Payments Inc.
100.0%(1)
60.1%(1)
55.0%(1)
20.0%
Cavitex Infrastructure Corporation
100.0%
99.9%
29.45%
44.9%
75.6%(1)
46.0%
100.0%(1)
Manila NorthTollways Corporation
MPCALA Holdings, Inc.
Tollways ManagementCorporation
Meralco PowerGenCorporation
Global Business Power Corporation
Manila ElectricCompany
(6)
50.0%(1)
31.2%(1)(2)(6)
FPW SingaporeHoldings Pte. Ltd.
50.1%(1)(6)
41.9%(1)(6)
(6)China Minzhong FoodCorporation Limited
99.9%
100%
25.0%15.0%

Interim
Rep
ort 2016
24th Floor, Two Exchange Square8 Connaught PlaceCentral, Hong Kong SARTelephone: +852 2842 4388Fax: +852 2845 9243Email: [email protected]: www.firstpacific.com
(Incorporated with limited Iiability under the laws of Bermuda)
A Chinese version of this report is available at
www.firstpacific.com or from the Company on request.
本報告之中文版可瀏覽www.firstpacific.com或向本公司索取。
This report is printed on environmentally friendly paper.
Design and production: iOne Financial Press Limited
Interim Report 2016Interim Report 2016
UV