interactive effects of free-air co2 enrichment and drought stress on maize growth
TRANSCRIPT

I
RI
ARRA
KCCGMRW
1
2demtatc(imib
m
1d
Europ. J. Agronomy 52 (2014) 11–21
Contents lists available at ScienceDirect
European Journal of Agronomy
journa l homepage: www.e lsev ier .com/ locate /e ja
nteractive effects of free-air CO2 enrichment and drought stress on maize growth
emy Manderscheid ∗, Martin Erbs, Hans-Joachim Weigelnstitute of Biodiversity, Johann Heinrich von Thunen-Institute, Federal Research Institute for Rural Areas, Forestry and Fisheries, Bundesallee 50, D-38116 Braunschweig, Germany
a r t i c l e i n f o
rticle history:eceived 31 August 2011eceived in revised form 8 December 2011ccepted 19 December 2011
eywords:O2 concentrationlimate changerowthaize
adiation use efficiencyater use efficiency
a b s t r a c t
Predicting future maize yields requires quantifying anticipated climate change impacts on maize growthand yield. In the present study, maize was grown over 2 years (2007 and 2008) under sufficient (WET)and reduced water supply (DRY) and under ambient (378 �l l−1, AMB) and elevated (550 �l l−1, FACE)atmospheric CO2 concentration ([CO2]) using free air CO2 enrichment (FACE). The objective of the presentstudy was to test the hypothesis that maize growth does not respond to elevated [CO2] under WET butunder DRY conditions due to an increase of water use efficiency (WUE) of biomass production realizedthrough reduced transpiration. Moreover, in 2008 soil cover was varied to test whether mitigation ofevaporation by straw mulch increases the CO2 effect on WUE. The DRY treatment received 12% and48% less water than the WET treatment in 2007 and 2008, respectively, which was achieved with theaid of rainout shelters. In the first year, drought stress was insignificant and crop growth was similaramong the two watering regimes. CO2 enrichment did not affect crop growth in 2007 and also in theWET treatment of 2008. In the second year, a pronounced drought stress decreased green leaf index,accumulated seasonal radiation absorption and radiation use efficiency (RUE) significantly. However,these effects were mitigated by CO2 enrichment and the decrease of RUE was higher under AMB (−18%)than under FACE (−2%) conditions. In the DRY treatment in 2008, CO2 enrichment significantly increased
final biomass (+24%) and grain yield (+41%) as compared to the DRY AMB treatment. CO2 enrichmentsignificantly increased soil water content under WET and DRY conditions but did not affect the soil waterexploitation. There was a significant interaction of [CO2] and water supply on WUE with no (2007) or asmall CO2-response (+10% in 2008) under WET and a strong effect under DRY conditions in 2008 (+25%).Soil cover did not intensify the CO2 effect on WUE. It is concluded that maize will benefit from the increasein [CO2] only under drought but not under sufficient water supply.. Introduction
Atmospheric CO2 concentration [CO2] has increased from about80 �l l−1 in pre-industrial times to 385 �l l−1 today and is pre-icted to reach 550 �l l−1 in the middle of this century (Meehlt al., 2007). These changes are expected to rise air temperature anday increase the frequency of extremes, including drought condi-
ions, which will have significant consequences for crop growthnd food supply in the future (Easterling et al., 2007). Maize ishe most important crop species in terms of global production andomes a close second after wheat in terms of globally cultivated areaFAOSTAT, 2009). By 2020, global demand for maize as a food supplys projected to exceed that for wheat or rice, making it the world’s
ost important crop (Pingali, 2001). Moreover, this crop is increas-ngly being used not only for food and feed but also to produceiofuels. Despite this importance of maize in global agricultural
∗ Corresponding author. Tel.: +49 (0)531 596 2579; fax: +49 (0)531 596 2599.E-mail addresses: [email protected] (R. Manderscheid),
[email protected] (M. Erbs), [email protected] (H.-J. Weigel).
161-0301/$ – see front matter © 2012 Elsevier B.V. All rights reserved.oi:10.1016/j.eja.2011.12.007
© 2012 Elsevier B.V. All rights reserved.
production there is a lack of experimental studies addressing theresponse of this crop to changes in atmospheric CO2 concentrationand water availability (Leakey, 2009).
The rise of [CO2] produces an increase of the intracellular CO2concentration of the leaf which induces a decrease of stomatal con-ductance and an increase of photosynthesis in C3 plants (Ainsworthand Rogers, 2007). Photosynthesis of C4 species is CO2 saturatedat the current [CO2], and thus, photosynthetic CO2 uptake theo-retically should not respond to elevated [CO2] (Ghannoum, 2009).Several CO2 enrichment studies with maize done under controlledenvironment conditions showed an increase of C4 photosynthe-sis under sufficient water supply (Kang et al., 2002; Driscoll et al.,2006; Ziska and Bunce, 1997) while others did not (Rogers et al.,1983; Kim et al., 2007). Similar findings have been obtained withother C4 plants (Leakey, 2009). Up to now there have been freeair CO2 enrichment (FACE) experiments with C4 crops only attwo sites in the United States, in which sorghum (Arizona) and
maize (Illinois) were cultivated in the field under different [CO2].In the sorghum-FACE study CO2 enrichment produced an increaseof the photosynthetic quantum efficiency in young leaves (Cousinset al., 2001) and in mature leaves net photosynthesis was strongly
1 op. J. A
ics(w2
iwKGeGseuMgwKGw
as(b2petepessiob[owaEswFc2arwpe
wa(lTawpS
t
2 R. Manderscheid et al. / Eur
ncreased (+23%) under drought but only slightly (+9%) under wetonditions (Wall et al., 2001). In the maize-FACE studies photo-ynthesis was increased by elevated [CO2] under summer droughtLeakey et al., 2004; Markelz et al., 2011) but was totally unaffectedhen the plant was not experiencing water deficit (Leakey et al.,
006; Markelz et al., 2011).With respect to biomass production many enclosure studies
ndicated an increase of maize growth under elevated [CO2] andell-watered conditions (Driscoll et al., 2006; Kang et al., 2002;ing and Greer, 1986; Loomis and Lafitte, 1987; Morison andifford, 1984) while others reported on no CO2 effects (Bethenodt al., 2001; Kim et al., 2007; Rudorff et al., 1996; Samarakoon andifford, 1996). In the FACE experiments with C4 crops biomass oforghum was only slightly increased by CO2 enrichment (Ottmant al., 2001), however biomass and grain yield of maize was totallynaffected under sufficient water availability (Leakey et al., 2006;arkelz et al., 2011). Under drought stress growth of maize was
enerally increased by CO2 enrichment and the relative CO2 effectas greater than under well-watered conditions (Kang et al., 2002;ing and Greer, 1986; Loomis and Lafitte, 1987; Samarakoon andifford, 1996) and this was also observed in the FACE experimentith sorghum (Ottman et al., 2001).
The CO2 fertilization effect of C4 crops under drought isttributed to decreased stomatal conductance, which may con-erve the soil water and thus delay the onset of drought stressGhannoum, 2009). Improved soil moisture under high [CO2] haseen found in FACE studies with sorghum and maize (Conley et al.,001; Leakey et al., 2006). However, the CO2 effect on evapotrans-iration, which amounted to 10–13% (Conley et al., 2001; Triggst al., 2004), was much lower than the effect on stomatal conduc-ance, which ranged between 30% and 40% (Leakey et al., 2006; Wallt al., 2001). The reasons for this difference are several feedbackrocesses at the leaf and canopy level (Oliver et al., 2009). Wilsont al. (1999) have analysed these feedback processes for maize andoybean with a model approach in more detail. According to theirtudy the soil evaporation feedback was most important in reduc-ng the CO2 effect by 60%. The increased specific humidity deficitf the canopy airspace and the higher soil moisture content, whichoth result from the decrease of stomatal conductance under highCO2], should contribute to an increase of evaporative loss through-ut the season. Consequently, in the field much of the potentialater saving under elevated [CO2] could be lost by evaporation
nd thus would not be available for mitigation of drought stress.vaporation depends on the water content in the upper soil layer,urface net radiation and amounts to approximately 15% of totalater flux at leaf area index of 4 for a maize crop (Villalobos and
ereres, 1990). Averaged over the season about one third of wateronsumption of a maize crop results from soil evaporation (Liu et al.,002). This water loss can be decreased, for example, by soil covernd according to Bond and Willis (1969) a straw layer of 8 t ha−1
educes evaporation by 80%. Consequently, soil cover by residuehich is used to improve crop growth under limited water sup-ly by conserving soil water might be even more advisable underlevated [CO2].
Insufficient precipitation decreases soil water content (SWC)hich in turn first affects growth of plant tissue and at lower values
lso stomatal conductance and CO2 assimilation rate of the leavesSadras and Milroy, 1996). Moreover, water deficit can advanceeaf senescence and reduce light absorption (Stone et al., 2001).hus, drought stress impairs biomass production by decreasing thebsorption of light by the green canopy and the efficiency withhich absorbed light is used for photosynthesis and dry weight
roduction, i.e. radiation use efficiency (RUE) (Earl and Davis, 2003;tone et al., 2001).Previous CO2 enrichment studies have addressed some details ofhe processes involved in the decline of biomass production under
gronomy 52 (2014) 11–21
drought. As already mentioned [CO2] effects on maize were higherunder drought than under sufficient water supply. In addition, CO2enrichment increased leaf area more under dry than wet condi-tions (Kang et al., 2002; King and Greer, 1986; Samarakoon andGifford, 1996). Most of the CO2 enrichment studies with maize havebeen done in chambers and with artificial root environment in pots.There was only one FACE site, at which the growth response ofmaize to elevated [CO2] was investigated over three seasons withdifferent precipitation regimes (Leakey et al., 2006; Markelz et al.,2011). It turned out that water supply to the crop was slightly insuf-ficient in 2 years and but not in 1 year, when no CO2 effect onphotosynthesis and biomass production was detected. As there areno other CO2 enrichment studies with maize under conditions ofcontrolled water supply, there is a need for FACE experiments withmaize, in which water supply is included as an additional factor inorder to determine the interaction of [CO2] and water supply moreprecisely (Leakey, 2009; Oliver et al., 2009).
The present FACE experiment with maize was carried under fieldconditions over two growing seasons. We combined the FACE tech-nique with a large-scale rain exclusion system (Erbs et al., 2011)to study the effect of CO2 enrichment simultaneously under well-watered and drought stress conditions. The main objectives of thestudy were to quantify the effects of CO2 and water supply on theprimary processes responsible for biomass and yield production ofmaize, i.e. temporal changes in green leaf area index, the result-ing radiation absorption by the canopy and the radiation and wateruse efficiencies. Moreover, in the second growing year soil coverwas included as an additional subplot treatment to test whetherstraw mulching as compared to bare soil increases the CO2 fertil-ization effect under drought by lessening evaporative water lossand enhancing water usage for plant growth. This is the first FACEstudy to address comprehensively the interactions of elevated CO2and water in maize.
2. Materials and methods
2.1. Field conditions and experimental treatments
The experiment was conducted on an experimental field site(10 ha) of the Johann Heinrich von Thunen-Institute. The soil at theexperimental area is a luvisol of a loamy sand texture in the ploughhorizon (0–40 cm) and the subsoil consists of a mixture of graveland sand. It has a pH of 6.5, a mean organic matter content of 1.4%and a comparatively shallow rooting zone (0–60 cm). The drainedupper (0.01 MPa soil water tension) and lower limits (1.5 MPa soilwater tension) of plant available volumetric SWC within the 0.6 msoil profile were approximately 23% and 5%, respectively. Based onexpert knowledge the rooting depth for maize at the study site isassumed to be approximately 0.6 m. The estimated plant availablewater capacity within the root zone of 0.6 m was 108 mm.
A FACE system engineered by Brookhaven National Laboratoryand previously used for C3 crops (Weigel et al., 2005) was modifiedfor the maize experiments. Three circular plots were equipped withFACE rings each with a diameter of 20 m. The 32 vertical vent pipesof each FACE ring had a height of 3.2 m compatible to the maximalheight of 3 m of the maize crop. The three rings comprised whatwas termed the FACE treatment. Three circular plots without CO2enrichment and without venting were used as control treatment(=AMB treatment). The target CO2 concentration in the FACE ringswas set to 550 �l l−1 during daylight hours. CO2 enrichment wasinterrupted at high wind speed (>5.5 m s−1). At the field site, wind
speed was low during the night but increased during the day witha maximum in early afternoon. So the effect of venting on canopyclimate was exceeded by the wind effect. This was confirmed bydata of canopy air temperature recorded in AMB and FACE plots
R. Manderscheid et al. / Europ. J. Agronomy 52 (2014) 11–21 13
Table 1Timetable of agricultural measures carried out in the first (2007) and second (2008)season.
Event First growing season Second growing season
Sowing 30th April 9th MayEmergence 10th May 16th MayStart of CO2 enrichment 11th June 9th JuneStart of irrigation 20th July 27th JuneAnthesis stage 18th July 25th JulyFinal harvest 1st October 29th September
ooLaMw
wwW5imdWfetbd
dwiaucsgTpitttiToarrfhe
aqwtaoem
2008
0
5
10
15
20
25
30
35
1-Jun 22-Jun 13-Jul 3-Aug 24-Aug 14-Sep
radiation(MJm
d),temperature(°C)
0
10
20
30
40
rainfall,irrigation(mmd)
rainfallirrigationradiationtemperature
2007
0
5
10
15
20
25
30
35
1-Jun 22-Jun 13-Jul 3-Aug 24-Aug 14-Sep
radiation(MJm
d),temperature(°C)
0
10
20
30
40
rainfall,irrigation(mmd)
rainfallirrigationradiationtemperature
Fig. 1. Mean daily air temperature and total daily global radiation, rainfall andirrigation over the growing seasons of 2007 and 2008. The operation time of thetarpaulins of the rain-shelter in 2008 is shown by grey bars. The DRY plots werenot irrigated except of one event at 30th July 2008 (20 mm). (Notes: *: Wet plots
soil moisture measurements were done at different positions. This
End of CO2 enrichment 2nd October 30th September
ver the whole season. CO2 enrichment started at a leaf area indexf about 0.5 in early June, since crop water dynamics for the timeAI < 0.5 have little effects on the remainder of the growing season,nd lasted until final harvest at the end of September (Table 1).ean seasonal [CO2] during daylight hours in the AMB treatmentas 378 �l l−1 (2007: 377.2 �l l−1, 2008: 378.5 �l l−1).
In order to test the CO2 response of maize under two levels ofater supply each of the six circular main plots was split into aell-watered (WET) and a dry (DRY) semicircular subplot. In theET subplots water content in the 0.6 m soil profile was kept above
0% of maximum plant available SWC. In the DRY treatment it wasntended to reduce SWC in the 0.6 m soil profile below 50% of maxi-
um plant available SWC during midsummer. Based on long-termata from the Agrometeorological Research Station of the Germaneather Service at Braunschweig maize suffers more than 20 days
rom drought stress in every second summer (July–August) at ourxperimental field site. Drip irrigation lines were installed alonghe maize rows, which enabled to establish the WET treatmenty drip irrigation or the DRY treatment by omitting water supplyepending on the climatic conditions during summer.
To induce drought also in summer with high rainfall, we testedifferent rain exclusion systems. In 2007, wooden racks equippedith PVC shelves (0.6 m width) were positioned in every second
nter row area and the rain intercepted was drained to the outsiderea of the plots. The racks were operated from the end of Augustntil the end of September, but only 11% of the total precipitationould be excluded during this time. In 2008, the designated DRYubplots were equipped with aluminium frames of tents with around area of 20 m × 12 m each as described by Erbs et al. (2011).he frames were covered with transparent PVC tarpaulins duringeriods of forecasted rainfall >10 mm day−1. The frames reduced
ncident photosynthetic active radiation (PAR) by 6.6% withoutarpaulins based on the exposed horizontal area and by 24.1% witharpaulins. The tarpaulins were installed during three periods (3rdo 4th July, 17th to 22nd July, and 22nd to 25th August) result-ng in rain exclusion of 12, 16 and 29 mm, respectively (Fig. 1).wo sensors for PAR (BF2 sunshine sensor, Delta-T Devices, UK)perated from mid of June until final harvest in the DRY and WETreas yielded amounts of incident radiation of 812 and 872 MJ m−2,espectively, Thus, the incident radiation over the season waseduced by 7% in the dry plots as compared to the wet plots. Apartrom the reduction in incident PAR, the rain shelter equipmentad no substantial influence on the environmental conditions (Erbst al., 2011).
In 2008 each semicircle of the WET and DRY treatments wasdditionally divided in a quarter without soil cover (BARE) and auarter in which the soil surface was covered at the 1st July by handith 7 t ha−1 barley straw (MULCH). Such an amount of residue on
he soil surface reduces the rate of evaporative water loss by ca. 80%s compared to the bare soil (Bond and Willis, 1969). The objective
f this additional treatment was to test whether the effect of CO2nrichment on plant growth under drought can be advanced byinimizing the evaporative water flux.with FACE were not irrigated. **: For one time dry plots were also irrigated at thisdate with 20 mm. ***: Wet plots with FACE and mulch layer were excluded fromirrigation.)
2.2. Crop culture and management
Agricultural management measures of the 10 ha field andthe experimental plots were carried out according to local farmpractices. Maize (Zea mays L., cv. ‘Romario’) was sown with arow distance of 0.75 m and a seeding density of 10 plants m−2
(Table 1). Weed control was done by application of herbicidesin May and hand weeding in the experimental rings. Mineralnutrients were added according to local fertilizing practices basedon soil analysis in early springtime. The following amounts offertilizers were applied: 2007: 171 kg N ha−1, 92 kg P2O5 ha−1,200 kg K2O ha−1, and 36 kg S ha−1; 2008: 198 kg N ha−1,92 kg P2O5 ha−1, 25 kg MgO ha−1, and 20 kg S ha−1. Anthesis stagewas reached at 18th and 25th of July in 2007 and 2008, respectively,and did not significantly differ between the treatments.
2.3. Measurements of soil water content and climatic conditions,and water supply
Volumetric SWCs were measured by time domain reflectometry(TDR) sensors approximately twice per week from 12th of June untilfinal harvest. To account for spatial variation in SWC due to the dripirrigation and the discharge of precipitation to the plant row area,
was especially considered in the DRY treatment to quantify aver-age SWC conditions. In the top soil layer (0–0.2 m) water contentwas measured by a hand-held TDR probe at three positions from
1 op. J. Agronomy 52 (2014) 11–21
tWaipawVpPlwcb
ptW
a
2
tcc1twtwltsu
R
2
fe1Twspmimn
s(JcUbcta
f
2008
0
20
40
60
80
100
120
01. Jun 22. Jun 13. Jul 03. Aug 24. Aug 14. Sep
PAW(mm)
DRY AMBDRY FACEWET AMBWET FACE
2007
0
20
40
60
80
100
120
1-Jun 22-Jun 13-Jul 3-Aug 24-Aug 14-Sep
PAW(mm)
DRY AMBDRY FACEWET AMBWET FACE
4 R. Manderscheid et al. / Eur
he plant row up to the centre between two rows. In each of the sixET plots two TDR probes were installed in 0.3 m soil depth withhorizontal distance of 0.2 m from the plant rows with one probe
n the BARE and MULCH quarter, respectively, in 2008. A similarositioning was used for the DRY treatment in 2007, while in 2008n additional probe was installed in the BARE quarter. The recordsere used for the quantification of SWC in the 0.2–0.4 m soil layer.alues in the 0.4–0.6 m layer were obtained by one (2007) or tworobes (2008, in BARE and MULCH) installed in the DRY plots only.lant available water (PAW) in the 0.6 m rooting depth was calcu-ated from the data of the TDR probes. For the WET treatment it
as assumed that water content in the 0.4–0.6 m layer remainedonstant at a high level as measured in the DRY plots during Juneefore applying the different watering regime.
Data on climatic conditions (global radiation, rainfall, air tem-erature measured 2 m above ground level) were obtained fromhe nearby Agrometeorological Research Station of the German
eather Service located 500 m apart from the experimental site.Irrigation of the experimental plots was controlled by manual
pplication based on records of SWC.
.4. Measurement of leaf relative water content (RWC)
Leaf relative water content (RWC) was measured according tohe method described by Schonfeld et al. (1988). In each quarterircle of the six rings four sun exposed leaves (5th and 6th leafounted from the top and from two plants) were sampled withinh at 2 p.m. From the total leaf the tip and the base were abscised
o obtain a middle segment of ca. 20 cm length. The four segmentsere put in a plastic bag and stored at 0 ◦C until the measurement of
he fresh weight (FW) within 2 h. Subsequently, the leaf segmentsere soaked over night in distilled water at room temperature. The
eaf samples were carefully blotted dry with filter paper and theurgid weight (TW) was determined. Dry weights (DWs) of the leafegments were obtained after drying at 105 ◦C. RWC was calculatedsing the following equation:
WC = FW − DWTW − DW
× 100 (1)
.5. Plant growth analysis
Four (2007) or five (2008) destructive harvests were carried outrom June until end of September and samples were taken fromach quarter per ring. The size of the sampling area amounted tom2 and 2 m2 at the intermediate and final harvest, respectively.he major fraction (ca. 70%) of the total above ground biomassas dried and the dry weight was determined. The remaining
ub-sample was used for estimation of green area and biomassartitioning. Area of green leaves was measured with a leaf areaeter (Model LI-3100, LICOR) and used to calculate green leaf area
ndex. Dry weights of leaves, stems, husks and cobs were deter-ined after drying at 105 ◦C. At maturity yield components (grain
umber, mean grain weight and grain yield) were measured.Fraction of PAR absorbed by the green canopy (fapar) was mea-
ured at noon (±2 h) similar to the procedure done by Earl and Davis2003) and approximately once per week starting in the middle ofune when fapar reached a value of 0.3–0.4. The measurements werearried out with the SUNSCAN system (Delta-T Devices, Cambridge,K) and included the radiation incident on the canopy (J0), reflectedy the canopy (Jr), and the radiation at the lower limit of the greenanopy (Jc), which was estimated by eye. Jr and Jc were measuredwo to four times per semicircle in 2007 and per quarter in 2008
nd averaged. fapar was calculated using the following equation:apar = J0 − Jr − JcJ0
(2)
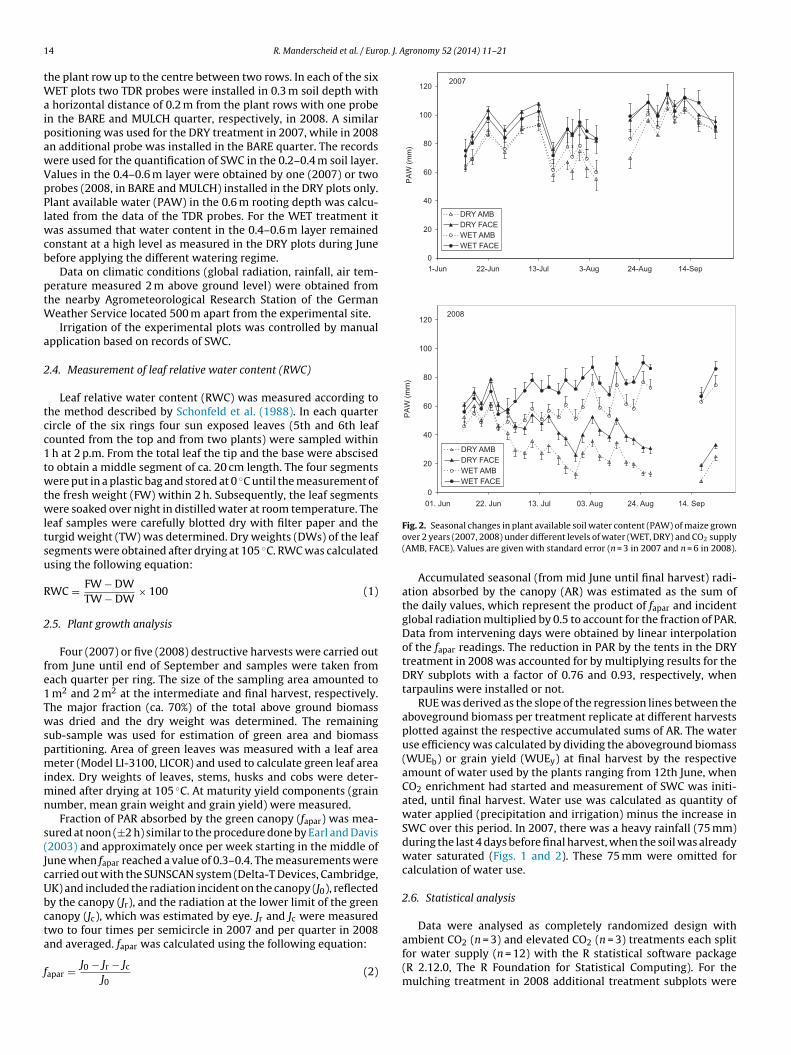
Fig. 2. Seasonal changes in plant available soil water content (PAW) of maize grownover 2 years (2007, 2008) under different levels of water (WET, DRY) and CO2 supply(AMB, FACE). Values are given with standard error (n = 3 in 2007 and n = 6 in 2008).
Accumulated seasonal (from mid June until final harvest) radi-ation absorbed by the canopy (AR) was estimated as the sum ofthe daily values, which represent the product of fapar and incidentglobal radiation multiplied by 0.5 to account for the fraction of PAR.Data from intervening days were obtained by linear interpolationof the fapar readings. The reduction in PAR by the tents in the DRYtreatment in 2008 was accounted for by multiplying results for theDRY subplots with a factor of 0.76 and 0.93, respectively, whentarpaulins were installed or not.
RUE was derived as the slope of the regression lines between theaboveground biomass per treatment replicate at different harvestsplotted against the respective accumulated sums of AR. The wateruse efficiency was calculated by dividing the aboveground biomass(WUEb) or grain yield (WUEy) at final harvest by the respectiveamount of water used by the plants ranging from 12th June, whenCO2 enrichment had started and measurement of SWC was initi-ated, until final harvest. Water use was calculated as quantity ofwater applied (precipitation and irrigation) minus the increase inSWC over this period. In 2007, there was a heavy rainfall (75 mm)during the last 4 days before final harvest, when the soil was alreadywater saturated (Figs. 1 and 2). These 75 mm were omitted forcalculation of water use.
2.6. Statistical analysis
Data were analysed as completely randomized design with
ambient CO2 (n = 3) and elevated CO2 (n = 3) treatments each splitfor water supply (n = 12) with the R statistical software package(R 2.12.0, The R Foundation for Statistical Computing). For themulching treatment in 2008 additional treatment subplots were
op. J. Agronomy 52 (2014) 11–21 15
et
idTaaoparu
3
3c
ftt±9r
wot
3
altiww2
i(pSdJepiab2Da1wt
foaWPw
WET
4
8
12
16
20
24
11-Jun 1-Jul 21-Jul 10-Aug 30-Aug
soilwatercontent(Vol%)
AMB MULAMB BAREFACE MULFACE BARE
ANOVA resultsCO2 - - - ** - - - - - - - - - - - - - - -SC - - + - - - - - + ** - - + - - - - - -C x S - - - - - * - - - - - - - + - - - - -
DRY
4
8
12
16
20
24
11-Jun 1-Jul 21-Jul 10-Aug 30-Aug
soilwatercontent(Vol%)
AMB MULAMB BAREFACE MULFACE BARE
ANOVA resultsCO2 - - * ** * * *** * * + - - ** ** * * + * *SC - - - - + - + * - - * - - - - + + - -C x S - - - - - * ** - + - - - - - - * - - -
Fig. 3. Seasonal changes in water content of the upper soil layer (0–0.2 m depth)
R. Manderscheid et al. / Eur
stablished in each quarter of the ring halves and were included inhe statistical analysis as additional splitting factor.
Plants grown under the rain shelter in 2008 received 7% lessncident PAR than plants from the WET plots. This should haveecreased plant growth, since it is directly related to incident PAR.o exclude these differences in the radiation environment and tollow for a direct comparison of the growth data from the WETnd DRY areas, a rough approximation was used and growth databtained under the rain shelter in 2008 were corrected by multi-lication of the measured values with 1.07. These corrected valuesre presented in Table 3 and in Figs. 5 and 6. Calculation of theesource use efficiency of biomass production was done with thencorrected values (Table 4).
. Results
.1. Performance of the FACE system and environmentalonditions over the two seasons
During the growing seasons, CO2 enrichment was interruptedor 1.1% of the operational time in 2007 and for 2.5% in 2008 dueo high wind speeds or system failures of the CO2 enrichment. Thearget concentration of 550 �l l−1 was reached within thresholds of10% of the average 1-min [CO2] at the FACE plots for 94.1% and5.0% of the operational time in the 2007 and 2008 growing season,espectively.
The weather conditions during the two experimental seasonsere typical for this site (Fig. 1) except of the extraordinary amount
f rainfall in 2007, which was nearly twice the amount of the long-erm mean over the last 30 years.
.2. Soil water content and seasonal water use
Due to the huge rainfall in 2007, the total amount of plant avail-ble water in the rooting zone (0.0–0.6 m, PAW) stayed at a highevel and showed only a slight and temporary decrease towardshe end of July, which was mitigated in the WET plots by 34 mmrrigation from late July to early August (Fig. 2). Thus, water supply
as quite high in both DRY and WET treatment, and the seasonalater use hardly differed between the two watering regimes in
007 (Table 2).In 2008, PAW decreased at the end of June (Fig. 2). Therefore,
rrigation was started at this time in all WET plots to raise SWCFig. 1). Water supply to the WET FACE plots was reduced as com-ared to the WET AMB treatment (at the 1st August, 4th and 16theptember) to prevent water logging (Fig. 1). PAW was significantlyifferent (p < 0.001) between WET and DRY since the beginning of
uly. Elevated [CO2] resulted in a significant increase of PAW on sev-ral dates (p < 0.10: 7th and 10th July; 7th, 11th and 25th August;< 0.05: 18th, 21st and 28th August), and there was no significant
nteraction of the CO2 and water supply on this variable. Soil coverffected SWC only in the top soil layer (Fig. 3). SWC was found toe increased (WET: 28th July, 7th August; DRY: 21st July, 31st July,1st August) and decreased by the straw layer (WET: 24th July;RY: 10th July). There was a positive interaction of CO2 enrichmentnd soil cover on several dates (WET: 14th July, 11th August; DRY:7th July, 24 July). However, in the DRY treatment water contentas also found to be less stimulated by CO2 enrichment in MULCH
han in BARE subplots on two dates (17th July, 24th July).The seasonal rainfall in 2008 amounted to 208 mm and 151 mm
or the WET and DRY plots, respectively, due to the operationf the rain exclusion system (Table 2). The quantity of water
pplied by rain and irrigation was ca. 330 mm and 170 mm for theET and DRY treatment, respectively (Table 2). The difference inAW between early June and end of September depended on theatering regime but was neither affected by CO2 enrichment nor
of maize in 2008 under different levels of water (WET, DRY) and CO2 supply (AMB,FACE) and soil cover (BARE and MULCH). Values are given with standard error (n = 3).+p < 0.10; *p < 0.05; **p < 0.01; ***p < 0.001.
by soil cover. Thus, CO2 enrichment did not increase soil waterexploitation even if the water supply was reduced to half of theamount added to the well-watered treatment.
3.3. Leaf relative water content and radiation absorption during astrong drought period
At the end of July 2008, PAW decreased to a minimum of ca.10 mm and 20 mm in the DRY AMB and DRY FACE treatment,respectively (Fig. 2). Moreover, in the upper soil layer SWC wasclose to the permanent wilting point (Fig. 3). This coincided withhot summer weather (Fig. 1) with daily maximum temperaturesabove 30 ◦C. During this period leaf RWC was analysed as an indi-cator of the plant water status. At the 28th July, RWC was unaffectedin WET plots but significantly decreased in DRY FACE and even morein DRY AMB plots (Fig. 4). Moreover, plants showed visible symp-toms of drought stress, i.e. leaf curling, on 28th and 29th July, whichincreased during the day and resulted in a short-term decline offapar. Therefore, additional recordings of fapar were made and notonly before noon but also later in the day (Fig. 4). There was asignificant effect of water supply on fapar at 28th July, which wasmitigated by CO2 enrichment. This effect was primarily due to leafcurling, which partially ceased over night and then increased againas indicated by the fapar readings taken at the morning and noonof the next day. At 30th of July, all dry plots were irrigated with20 mm to mitigate the severe drought stress (Fig. 2), which is con-
firmed by the data on RWC measured on 31st July and 4th August.Subsequently, on 7th August RWC of the leaves of the DRY AMBplots again were more affected by drought than those of the DRYFACE plots. Moreover, there was a persistent long-term decline of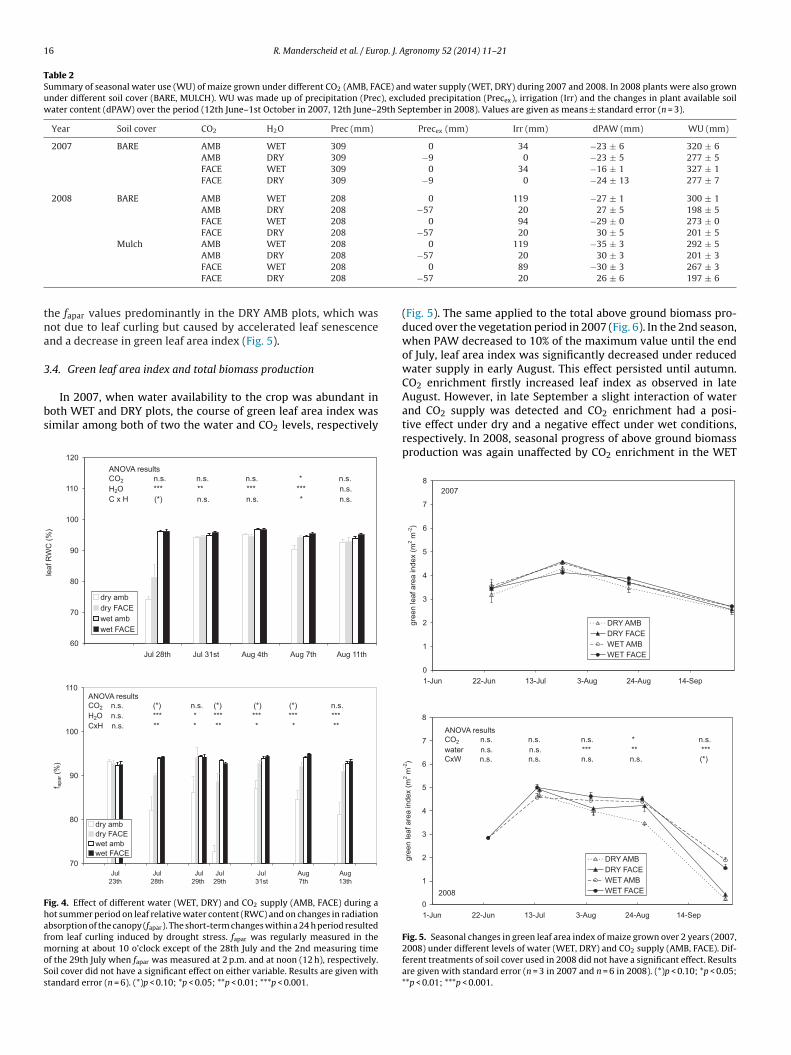
16 R. Manderscheid et al. / Europ. J. Agronomy 52 (2014) 11–21
Table 2Summary of seasonal water use (WU) of maize grown under different CO2 (AMB, FACE) and water supply (WET, DRY) during 2007 and 2008. In 2008 plants were also grownunder different soil cover (BARE, MULCH). WU was made up of precipitation (Prec), excluded precipitation (Precex), irrigation (Irr) and the changes in plant available soilwater content (dPAW) over the period (12th June–1st October in 2007, 12th June–29th September in 2008). Values are given as means ± standard error (n = 3).
Year Soil cover CO2 H2O Prec (mm) Precex (mm) Irr (mm) dPAW (mm) WU (mm)
2007 BARE AMB WET 309 0 34 −23 ± 6 320 ± 6AMB DRY 309 −9 0 −23 ± 5 277 ± 5FACE WET 309 0 34 −16 ± 1 327 ± 1FACE DRY 309 −9 0 −24 ± 13 277 ± 7
2008 BARE AMB WET 208 0 119 −27 ± 1 300 ± 1AMB DRY 208 −57 20 27 ± 5 198 ± 5FACE WET 208 0 94 −29 ± 0 273 ± 0FACE DRY 208 −57 20 30 ± 5 201 ± 5
Mulch AMB WET 208 0 119 −35 ± 3 292 ± 5
tna
3
bs
FhafmoSs
AMB DRY 208FACE WET 208FACE DRY 208
he fapar values predominantly in the DRY AMB plots, which wasot due to leaf curling but caused by accelerated leaf senescencend a decrease in green leaf area index (Fig. 5).
.4. Green leaf area index and total biomass production
In 2007, when water availability to the crop was abundant inoth WET and DRY plots, the course of green leaf area index wasimilar among both of two the water and CO2 levels, respectively
60
70
80
90
100
110
120
Jul 28th Jul 31st Aug 4th Aug 7th Aug 11th
leafRWC(%)
dry ambdry FACEwet ambwet FACE
ANOVA resultsCO2 n.s. n.s. n.s. * n.s.H2O *** ** *** *** n.s.C x H (*) n.s. n.s. * n.s.
70
80
90
100
110
Jul23th
Jul28th
Jul29th
Jul29th
Jul31st
Aug7th
Aug13th
f apar(%)
dry ambdry FACEwet ambwet FACE
ANOVA resultsCO2H2O n.s. *** * *** *** *** ***CxH n.s. ** * ** * * **
ig. 4. Effect of different water (WET, DRY) and CO2 supply (AMB, FACE) during aot summer period on leaf relative water content (RWC) and on changes in radiationbsorption of the canopy (fapar). The short-term changes within a 24 h period resultedrom leaf curling induced by drought stress. fapar was regularly measured in the
orning at about 10 o’clock except of the 28th July and the 2nd measuring timef the 29th July when fapar was measured at 2 p.m. and at noon (12 h), respectively.oil cover did not have a significant effect on either variable. Results are given withtandard error (n = 6). (*)p < 0.10; *p < 0.05; **p < 0.01; ***p < 0.001.
−57 20 30 ± 3 201 ± 30 89 −30 ± 3 267 ± 3
−57 20 26 ± 6 197 ± 6
(Fig. 5). The same applied to the total above ground biomass pro-duced over the vegetation period in 2007 (Fig. 6). In the 2nd season,when PAW decreased to 10% of the maximum value until the endof July, leaf area index was significantly decreased under reducedwater supply in early August. This effect persisted until autumn.CO2 enrichment firstly increased leaf index as observed in lateAugust. However, in late September a slight interaction of water
and CO2 supply was detected and CO2 enrichment had a posi-tive effect under dry and a negative effect under wet conditions,respectively. In 2008, seasonal progress of above ground biomassproduction was again unaffected by CO2 enrichment in the WET2007
0
1
2
3
4
5
6
7
8
1-Jun 22-Jun 13-Jul 3-Aug 24-Aug 14-Sep
greenleafareaindex(m
m)
DRY AMBDRY FACEWET AMBWET FACE
2008
0
1
2
3
4
5
6
7
8
1-Jun 22-Jun 13-Jul 3-Aug 24-Aug 14-Sep
greenleafareaindex(m
m)
DRY AMBDRY FACEWET AMBWET FACE
ANOVA resultsCO n.s. n.s. n.s. * n.s.water n.s. n.s. *** ** ***CxW n.s. n.s. n.s. n.s. (*)
Fig. 5. Seasonal changes in green leaf area index of maize grown over 2 years (2007,2008) under different levels of water (WET, DRY) and CO2 supply (AMB, FACE). Dif-ferent treatments of soil cover used in 2008 did not have a significant effect. Resultsare given with standard error (n = 3 in 2007 and n = 6 in 2008). (*)p < 0.10; *p < 0.05;**p < 0.01; ***p < 0.001.

R. Manderscheid et al. / Europ. J. A
2008
0
500
1000
1500
2000
2500
3000
1-Jun 22-Jun 13-Jul 3-Aug 24-Aug 14-Sep
abovegroundbiomass(gm)
DRY AMBDRY FACEWET AMBWET FACE
ANOVA resultsCO n.s. n.s. * ** *water n.s. n.s. *** * ***C x W n.s. n.s. n.s. n.s. **
2007
0
500
1000
1500
2000
2500
3000
1-Jun 22-Jun 13-Jul 3-Aug 24-Aug 14-Sep
abovegroundbiomass(gm)
DRY AMBDRY FACEWET AMBWET FACE
Fig. 6. Seasonal changes in above ground biomass production of maize grown over 2years (2007, 2008) under different levels of water (WET, DRY) and CO2 supply (AMB,FR*
tmsTspf
3
fanawoClttiwUbtop
ACE). Different treatments of soil cover used in 2008 did not have a significant effect.esults are given with standard error (n = 3 in 2007 and n = 6 in 2008). *p < 0.05;*p < 0.01; ***p < 0.001.
reatment except for one harvest in early August after a hot sum-er period as described in the previous paragraph. At this date a
lightly significant CO2 effect (p = 0.09) on biomass was detected.he reduction of water supply decreased total biomass productionignificantly as from the beginning of August. Moreover, there was aersistent significant effect of elevated [CO2] on total crop biomassrom this date.
.5. Final biomass and grain yield data
Final dry weights of the total plant and of individual plantractions are listed in Table 3. In 2007, water supply significantlyffected only the biomass of total and green leaves and the grainumber, which were decreased in the DRY treatment by up to 10%s compared to the WET treatment. All other growth parametersere unaffected by water supply and total biomass and grain yield
f the WET and DRY treatment were quite similar. In the first year,O2 enrichment did not significantly affect the dry weights of stem,
eaves or grain yield. There was only a significant CO2 effect onhe biomass of dead leaves, which reoccurred in 2008 and fits tohe CO2 related decrease in leaf area index under wet conditionsn 2008 (Fig. 5). In 2008, all growth variables except of stem dry
eight were significantly affected by the reduction in water supply.nder ambient [CO2] drought stress decreased total above ground
iomass and grain yield by 24% and 36%, respectively. Similar tohe findings in 2007, there was no CO2 effect under wet conditionsn dry weights of total biomass, leaves, stems or grains. For exam-le total biomass was the same under both CO2 levels and graingronomy 52 (2014) 11–21 17
yield was even 1% lower under elevated than under ambient [CO2].However, under dry conditions CO2 enrichment increased growthas supported by the significant interaction of CO2 and water supplyfor all growth variables except for stem dry weight. Grain yield wasincreased by 41% due to a positive CO2 effect on grain number andthousand seed weight. Soil cover had no significant effect on plantgrowth at final harvest.
3.6. Radiation absorption (AR) and radiation (RUE) and wateruse efficiency (WUE)
In the first year, the slight reduction in water supply had a smalleffect on seasonal radiation absorption and a clear effect on wateruse efficiency (Table 4). Percentage CO2 effect on AR and resourceuse efficiencies was ≤1% when averaged over both watering levels.This was similar to the results of AR and RUE obtained under the wetconditions in 2008. The strong drought stress in 2008 significantlyaffected AR, RUE and WUE of total biomass and there was also asignificant interaction with the CO2 supply. Under dry conditionsCO2 enrichment increased WUE by 25% and RUE by 19%. The CO2response of the WUE for grain yield was even greater and amountedto 42%. Soil cover did not have any effect on these variables.
As described in Section 2 incident photosynthetic radiation overthe season was 7% lower under the rain shelter than in the WETplots. This has to be considered when comparing values for ARobtained in the dry and wet treatments. Thus, the decrease of ARof 15% and 9% observed under the rain shelter under ambient andelevated [CO2], respectively, resulted both from a change of theabsorptivity of the green canopy for light and reduced incidentradiation. The later can be included by correcting the AR valueswith a number of 1.07 as has been done for the growth variables.With this correction, AR values of the DRY AMB and DRY FACEtreatment amounted to 666 and 722 MJ m−2, respectively. Basedon these numbers, CO2 enrichment increased AR by 8% and thedrought stress hardly decreased AR under FACE (−2%) but underambient [CO2] (−9%).
4. Discussion
The objective of the present study was to investigate the effect offree air CO2 enrichment on the growth of maize under sufficient andrestricted water supply. The FACE system was operated successfullyand increased [CO2] by 170 �l l−1 as compared to ambient [CO2]control treatment. A sufficient water supply treatment was guaran-teed by the application of drip irrigation. In contrast, drought stresscould not be established in the first but in the second experimentalseason. In the first year, precipitation during summer was doubledas compared to the long term mean of the field site and the rainexclusion system used was too inefficient to produce a substantialdecrease in SWC during summer. However, in the second year usinga newly designed rain shelter precipitation in July and August couldbe decreased by 40%. Seasonal rainfall from June until September in2008 was similar to the long term mean, and for this time period thearea under the rain shelter received 30% less precipitation, whichroughly corresponds to the changes predicted until the end of thiscentury (Meehl et al., 2007). The operation of the rain shelter didnot substantially affect the CO2 enrichment and the climatic condi-tions within the canopy except of the incident radiation, which wasreduced on averaged by ca. 7% as compared to the field plots with-out rain shelter. Thus, before comparing the water effect on growthdata from WET and DRY plots they should be adjusted for the dif-ference in incident radiation (Erbs et al., 2011). Under optimum
water and nutrient supply total biomass production depends lin-early on incident radiation. As plants under the rain shelter received7% less incident radiation, growth data of the dry plots have beenadjusted with a factor of 1.07. If water becomes limited, the effect of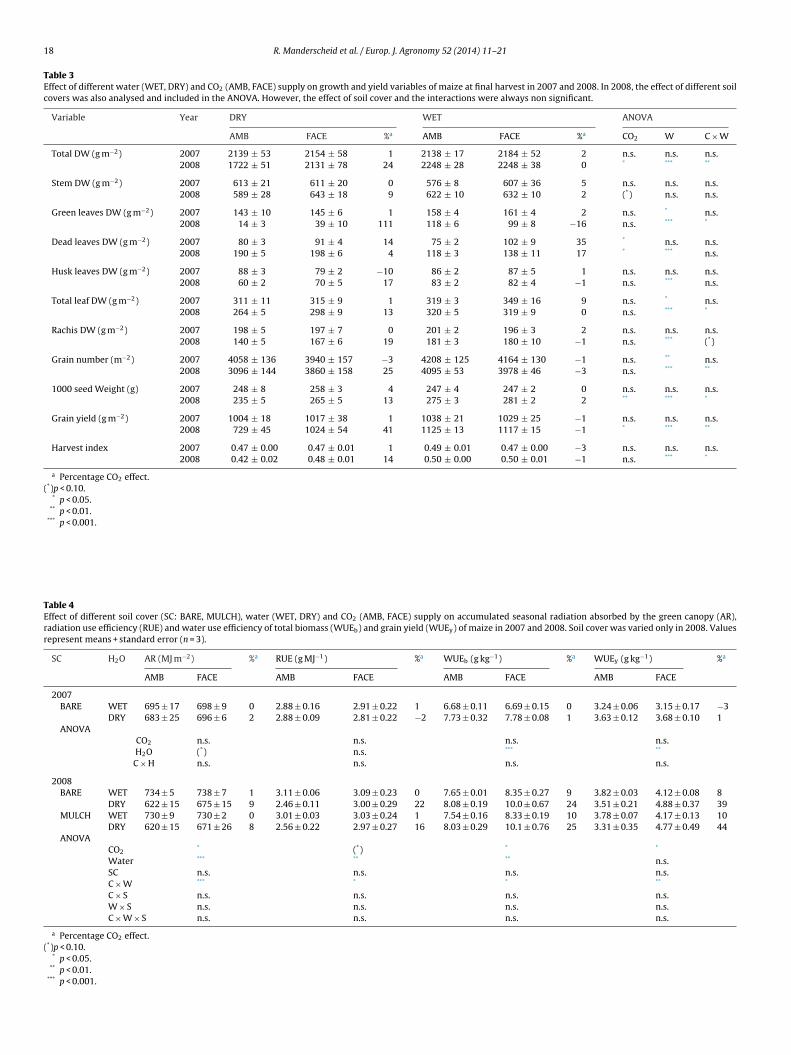
18 R. Manderscheid et al. / Europ. J. Agronomy 52 (2014) 11–21
Table 3Effect of different water (WET, DRY) and CO2 (AMB, FACE) supply on growth and yield variables of maize at final harvest in 2007 and 2008. In 2008, the effect of different soilcovers was also analysed and included in the ANOVA. However, the effect of soil cover and the interactions were always non significant.
Variable Year DRY WET ANOVA
AMB FACE %a AMB FACE %a CO2 W C × W
Total DW (g m−2) 2007 2139 ± 53 2154 ± 58 1 2138 ± 17 2184 ± 52 2 n.s. n.s. n.s.2008 1722 ± 51 2131 ± 78 24 2248 ± 28 2248 ± 38 0 * *** **
Stem DW (g m−2) 2007 613 ± 21 611 ± 20 0 576 ± 8 607 ± 36 5 n.s. n.s. n.s.2008 589 ± 28 643 ± 18 9 622 ± 10 632 ± 10 2 (*) n.s. n.s.
Green leaves DW (g m−2) 2007 143 ± 10 145 ± 6 1 158 ± 4 161 ± 4 2 n.s. * n.s.2008 14 ± 3 39 ± 10 111 118 ± 6 99 ± 8 −16 n.s. *** *
Dead leaves DW (g m−2) 2007 80 ± 3 91 ± 4 14 75 ± 2 102 ± 9 35 * n.s. n.s.2008 190 ± 5 198 ± 6 4 118 ± 3 138 ± 11 17 * *** n.s.
Husk leaves DW (g m−2) 2007 88 ± 3 79 ± 2 −10 86 ± 2 87 ± 5 1 n.s. n.s. n.s.2008 60 ± 2 70 ± 5 17 83 ± 2 82 ± 4 −1 n.s. *** n.s.
Total leaf DW (g m−2) 2007 311 ± 11 315 ± 9 1 319 ± 3 349 ± 16 9 n.s. * n.s.2008 264 ± 5 298 ± 9 13 320 ± 5 319 ± 9 0 n.s. *** *
Rachis DW (g m−2) 2007 198 ± 5 197 ± 7 0 201 ± 2 196 ± 3 2 n.s. n.s. n.s.2008 140 ± 5 167 ± 6 19 181 ± 3 180 ± 10 −1 n.s. *** (*)
Grain number (m−2) 2007 4058 ± 136 3940 ± 157 −3 4208 ± 125 4164 ± 130 −1 n.s. ** n.s.2008 3096 ± 144 3860 ± 158 25 4095 ± 53 3978 ± 46 −3 n.s. *** **
1000 seed Weight (g) 2007 248 ± 8 258 ± 3 4 247 ± 4 247 ± 2 0 n.s. n.s. n.s.2008 235 ± 5 265 ± 5 13 275 ± 3 281 ± 2 2 ** *** *
Grain yield (g m−2) 2007 1004 ± 18 1017 ± 38 1 1038 ± 21 1029 ± 25 −1 n.s. n.s. n.s.2008 729 ± 45 1024 ± 54 41 1125 ± 13 1117 ± 15 −1 * *** **
Harvest index 2007 0.47 ± 0.00 0.47 ± 0.01 1 0.49 ± 0.01 0.47 ± 0.00 −3 n.s. n.s. n.s.2008 0.42 ± 0.02 0.48 ± 0.01 14 0.50 ± 0.00 0.50 ± 0.01 −1 n.s. *** *
a Percentage CO2 effect.(*)p < 0.10.
* p < 0.05.**
TErr
(
p < 0.01.*** p < 0.001.
able 4ffect of different soil cover (SC: BARE, MULCH), water (WET, DRY) and CO2 (AMB, FACadiation use efficiency (RUE) and water use efficiency of total biomass (WUEb) and grainepresent means + standard error (n = 3).
SC H2O AR (MJ m−2) %a RUE (g MJ−1)
AMB FACE AMB FACE
2007BARE WET 695 ± 17 698 ± 9 0 2.88 ± 0.16 2.91 ± 0.22
DRY 683 ± 25 696 ± 6 2 2.88 ± 0.09 2.81 ± 0.22ANOVA
CO2 n.s. n.s.H2O (*) n.s.C × H n.s. n.s.
2008BARE WET 734 ± 5 738 ± 7 1 3.11 ± 0.06 3.09 ± 0.23
DRY 622 ± 15 675 ± 15 9 2.46 ± 0.11 3.00 ± 0.29MULCH WET 730 ± 9 730 ± 2 0 3.01 ± 0.03 3.03 ± 0.24
DRY 620 ± 15 671 ± 26 8 2.56 ± 0.22 2.97 ± 0.27ANOVA
CO2* (*)
Water *** **
SC n.s. n.s.C × W *** *
C × S n.s. n.s.W × S n.s. n.s.C × W × S n.s. n.s.
a Percentage CO2 effect.*)p < 0.10.
* p < 0.05.** p < 0.01.
*** p < 0.001.
E) supply on accumulated seasonal radiation absorbed by the green canopy (AR),yield (WUEy) of maize in 2007 and 2008. Soil cover was varied only in 2008. Values
%a WUEb (g kg−1) %a WUEy (g kg−1) %a
AMB FACE AMB FACE
1 6.68 ± 0.11 6.69 ± 0.15 0 3.24 ± 0.06 3.15 ± 0.17 −3−2 7.73 ± 0.32 7.78 ± 0.08 1 3.63 ± 0.12 3.68 ± 0.10 1
n.s. n.s.*** **
n.s. n.s.
0 7.65 ± 0.01 8.35 ± 0.27 9 3.82 ± 0.03 4.12 ± 0.08 822 8.08 ± 0.19 10.0 ± 0.67 24 3.51 ± 0.21 4.88 ± 0.37 391 7.54 ± 0.16 8.33 ± 0.19 10 3.78 ± 0.07 4.17 ± 0.13 1016 8.03 ± 0.29 10.1 ± 0.76 25 3.31 ± 0.35 4.77 ± 0.49 44
* *
** n.s.n.s. n.s.* **
n.s. n.s.n.s. n.s.n.s. n.s.

op. J. A
rwebcFtp
urh2soeicpetsl(eoTtselCai
hch
cagere21ttuptkb1tsatn
edtta
R. Manderscheid et al. / Eur
adiation on growth ceases and the usage of the correction factorould result in an over-adjustment of plant growth data. In our
xperiment, plant growth under the rain shelters was more affectedy SWC under AMB than FACE. Consequently, the application of theorrection factor produced a greater overestimation for AMB thanACE data. Nevertheless, the effects of the change in light condi-ions are much smaller than the effects of changes in soil water onlant growth.
In our field experiment, the CO2 enrichment increased SWCnder both sufficient and restricted water supply. This CO2esponse is similar to the results of maize studies done in the green-ouse (Samarakoon and Gifford, 1996) and in the field (Leakey et al.,006; Markelz et al., 2011) but in contrast to the findings withorghum (Conley et al., 2001). The soil water response is basedn the decrease in transpiration rate under high [CO2] (Ghannoumt al., 2000). Concomitant measurements of plant transpiration raten our experiment by means of stem sap flow sensors in 2007 indi-ated a decrease of plant water use of nearly 25% in the WET FACElots as compared to the WET AMB plots (data unpublished). How-ver, the CO2 effect on PAW was lower than one would expect fromhis number. This indicated that a large fraction of the remainingoil water resulting from the reduced transpiration was probablyost by augmented evaporation as demonstrated by Wilson et al.1999) with a model approach. However, our attempt to minimizevaporative water loss by soil cover with a straw layer in the sec-nd growing season to test this assumption was not successful.he results were inconsistent. The reason for that might be thathe straw layer did not only prevent evaporation from the upperoil layer, but also absorbed part of the rainfall which subsequentlyvaporates from the straw layer into the atmosphere. Neverthe-ess, it may be speculated that the water savings in the soil due toO2 enrichment could be optimized by cover if rainfall is seldomnd amounts are high or if the water is supplied by drip irrigationnstalled below the mulch layer.
The smaller soil water depletion under FACE than under AMBas contributed to the maintenance of higher leaf turgor as indi-ated by RWC and the delay of leaf curling under drought during aot weather period at the end of July in 2008.
In the WET treatment PAW was always above 50% of the fieldapacity, which is the threshold below which growth of monocots isffected by soil water availability (Sadras and Milroy, 1996). Maizerowth measured at final harvest was not increased by the CO2nrichment in the WET treatment. This is in agreement with theesults obtained in two FACE studies (Leakey et al., 2006; Markelzt al., 2011) and several studies done in enclosures (Bethenod et al.,001; Kim et al., 2007; Rudorff et al., 1996; Samarakoon and Gifford,996). In addition, measurements of crop growth over the vegeta-ion period yielded no CO2 effect under WET conditions except ofhe harvest data from the 5th August in 2008, when plants grownnder FACE had a slightly significant higher total dry weight thanlant from ambient plots. However, during the preceding dayshe weather was quite hot with a high atmospheric demand. It isnown that the threshold below which leaf gas exchange is affectedy PAW increases with atmospheric demand (Sadras and Milroy,996). Thus, the positive CO2 effect detected in early August inhe WET plots does not contradict the findings from other harvestshowing no CO2 response under WET. It rather indicates that overshort period at the end of July SWC content was not sufficient for
he crop resulting in a decrease of photosynthesis of AMB plots butot of FACE plots due to the water saving effect of elevated [CO2].
In our FACE experiment leaf senescence was significantly influ-nced by elevated [CO2] under WET conditions. There was a higher
ry weight of dead leaves at the end of both seasons in FACE plotshan in AMB plots. This was also recognized by the LAI data athe end of September in 2008 when a slightly significant inter-ction of CO2 and water supply was detected due a decrease ingronomy 52 (2014) 11–21 19
LAI in the FACE WET but not in the FACE DRY treatment. Such aCO2 response has also been recorded with maize under controlledenvironmental conditions (King and Greer, 1986) and in a previousFACE experiment with sorghum (Ottman et al., 2001). One possi-ble reason for the accelerated senescence under CO2 enrichmentcould be the decrease in leaf transpiration which in turn increasesleaf temperature (Triggs et al., 2004) resulting in an acceleration ofplant development.
The strong drought stress applied in 2008 caused a decline in LAIwhich was temporarily mitigated by CO2 enrichment as observed ina field experiment with sorghum (Ottman et al., 2001) and a green-house study with maize (Samarakoon and Gifford, 1996), but wasnot detectable under controlled environmental conditions (Kingand Greer, 1986). Moreover, in the present field study droughtstress decreased crop growth and yield, however, this effect wasdiminished by CO2 enrichment as it was previously shown in onegreenhouse study (Samarakoon and Gifford, 1996), but not in twoothers (King and Greer, 1986; Kang et al., 2002). Grain yield wasmore increased than biomass yield under FACE and the interac-tion of CO2 and water supply on yield and yield components wasgreater than previously observed for another C4 crop (Ottman et al.,2001). For example, the CO2 effect under restricted water supplyon biomass and grain yield amounted to 24% and 41% in the currentmaize FACE experiment and to 15% and 20% in a previous sorghumFACE experiment (Ottman et al., 2001).
Grain yield is particularly sensitive to water deficits duringthe early phase of plant reproduction (e.g. Otegui et al., 1995). Inthe experiment in 2008, PAW in the DRY AMB treatment reachedthe first minimum 3 days after anthesis. In addition, atmosphericdemand was quite high during this period and the plants showedvisible symptoms of drought stress. However, under DRY FACE PAWwas much higher due to the water savings in the preceding periodand symptoms of drought stress like leaf curling and leaf relativewater content were much smaller than under DRY AMB. Thesefindings indicate that crop growth was much more decreased bydrought under AMB than under FACE treatment in the period whichis most important for final grain number. This seems to be respon-sible for the finding that the CO2 effect was much stronger on grainyield than on total biomass.
Soil water deficit decreases crop growth by reducing PARabsorption due to changes in green leaf area (Stone et al., 2001) andby reducing RUE due to effects on stomatal conductance (Sinclairand Muchow, 1999). It has been shown in field studies with maizethat RUE is more affected by drought than PAR absorption (Earland Davis, 2003; Stone et al., 2001). Similar findings were obtainedin the present experiment, with both mechanisms contributing tothe decrease in plant growth under drought in 2008. However,the interference of the rain shelter with incident radiation has tobe taken into account. The rain shelter decreased incident PAR byca. 7% over the season. If accumulated seasonal radiation absorp-tion of the DRY plots is adjusted for this value, the effect of waterdeficit on this parameter adds up to −9% and −2% for the AMBand FACE plots, respectively. The effect on RUE amounted to −18%and −2% for the two CO2 treatments. Thus, in the present studywater deficit influenced crop growth under ambient [CO2] primar-ily by decreasing RUE, while radiation absorption was less affectedwhich corresponds to previous findings (Earl and Davis, 2003; Stoneet al., 2001). The water savings under CO2 enrichment preventedthe occurrence of drought stress effects on both RUE and radia-tion absorption. The effect of CO2 enrichment on RUE of maize hasalready been measured in a previous study but only under sufficientwater supply when no CO2 effect on RUE was detected (Rudorff
et al., 1996).There is strong evidence that elevated [CO2] does not directlystimulate C4 photosynthesis (Leakey, 2009), as confirmed by thegrowth data of the present FACE experiment with maize over

2 op. J. A
twdwiowgeetme
tEwhb11yWtsldrCFcseerWi1wdfeetin1ewitt
5
thwdordii
0 R. Manderscheid et al. / Eur
wo seasons. Maize will only benefit from elevated [CO2] whenater supply is limited, because the CO2 effect on stomatal con-uctance results in soil water conservation and retardation of soilater depletion. Beside this CO2 effect on transpiration, increases
n exploitation of soil water could also contribute to an increasef maize growth under limited water availability. However, thereas no difference in water use in the DRY plots between the plants
rown under AMB and FACE in our study. Moreover, in a FACExperiment with sorghum rooting depth was not enhanced by CO2nrichment (Wall et al., 2001). Thus, the decrease in transpira-ion rate and the resulting increase in WUE might be the main
echanism for explaining the growth response of maize to CO2nrichment under drought.
In our experiment, WUE of total biomass and grain yield produc-ion included the water lost by both transpiration and evaporation.vaporation can contribute up to one third of the total seasonalater use for a well watered maize crop (Liu et al., 2002). WUE wasigher under DRY than WET conditions. This was also observedy others (Chun et al., 2011; Conley et al., 2001; Otegui et al.,995) and ascribed to differences in evaporation (Otegui et al.,995). CO2 enrichment did not affect WUE of maize in the firstear. The reasons for this remain open. Probably as modelled byilson et al. (1999) the water conserved by decreased transpira-
ion under FACE was lost by increased evaporation. In the secondeason, when evaporation in the DRY plots was small due to theow SWC, a significant interaction of CO2 and water supply wasetected. The CO2 effect on WUE amounted to +10% and +25%,espectively, in the WET and DRY treatments. Again the smallerO2 effect under WET might be due to a higher evaporation underACE than AMB resulting from differences in SWC. Moreover, itould be assumed that in the DRY plots evaporation was quitemall and thus, the CO2 induced decrease in transpiration becamevident. In the sorghum FACE study WUE also increased by CO2nrichment, while the effect was quite similar under sufficient andestricted water supply and amounted to 16% (Conley et al., 2001).
UE has been analysed in several CO2 enrichment studies donen greenhouses (Bethenod et al., 2001; Samarakoon and Gifford,996) and in controlled environment chambers, where evaporationas impeded by the plastic screen (Bethenod et al., 2001) or whereaily water use was corrected for evaporation using weight lossrom pots without plants (Samarakoon and Gifford, 1996). In thesexperiments the CO2 effect on WUE ranged from +23% (Bethenodt al., 2001) to +55% (Samarakoon and Gifford, 1996) depending onhe CO2 enrichment level. If these values are recalculated for anncrease in [CO2] of 170 �l l−1 as in our FACE study, the respectiveumbers are +13% (Bethenod et al., 2001), +23% (King and Greer,986) and +24% (Samarakoon and Gifford, 1996). In a more recentxperiment done in sunlit growth chambers, the CO2 effect on WUEas highest under drought and amounted to +21% for a 170 �l l−1
ncrease in [CO2] (Chun et al., 2011). Thus, in most of these studieshe CO2 effect on WUE was quantitatively similar to our findings inhe field (+25%).
. Conclusions
The present FACE study with maize in which for the first timehis crop was exposed to CO2 enrichment simultaneously underigh and low water availability, clearly showed that rising [CO2]ill benefit maize growth only under drought conditions. Therought stress treatment was successfully achieved in the sec-nd experimental season by combining the FACE technique with
ain shelters. Maize growth benefited from CO2 enrichment underrought mainly due to higher RUE and WUE. The findings alsondicate that maize needs approximately one quarter less waterf [CO2] increases by 170 �l l−1. This water saving effect by [CO2]
gronomy 52 (2014) 11–21
elevation can mitigate negative effects on maize growth resultingfrom decreases in summer precipitation as predicted by climatechange models for the future (Meehl et al., 2007).
There will be an increasing demand for crop production in thefuture not least because of the additional usage to produce biofu-els (Leakey, 2009). Our study confirms previous findings (Leakey,2009) that growth of C4 crops will only benefit from the increasein [CO2] when water supply is limited. Thus, under sufficient watersupply and rapidly increasing [CO2] C3 crops will have an increas-ingly better growth performance in the future as compared to C4crops. In addition, WUE of C3 crops is also strongly increased by[CO2] elevation under drought stress. Assuming a linear responseto CO2 enrichment the effect of a 170 �l l−1 increase in [CO2] onWUE of C3 crops was maximal 23% in a field study in the US(Hunsaker et al., 1996) and 26% in Germany (Manderscheid andWeigel, 2007). Consequently, the benefits of increasing [CO2] forcrop growth under limited water supply seem not to be very dif-ferent between C4 and C3 crops. However, the per se higher WUE ofC4 as compared to C3 crops (Zwart and Bastiaanssen, 2004) mightstill promote the growth performance of C4 crops under conditionsof restricted water supply.
Acknowledgements
This research was supported by the German Federal Ministry ofEducation and Research (BMBF) and was part of the project Land-CaRe 2020. The FACE apparatus was engineered by BrookhavenNational Laboratory and we are grateful to Keith Lewin and Dr.John Nagy for their support. We acknowledge the technical assis-tance and the work of the people contributing to the experiment: P.Braunisch, Dr. S. Burkardt, A. Kremling, R. Isaak, A. Mundt, E. Nozin-ski, E. Schummer, and R. Staudte. The Experimental Station of theFriedrich Loffler-Institute, Braunschweig is thanked for conductingthe agricultural measures at the experimental area.
References
Ainsworth, E.A., Rogers, A., 2007. The response of photosynthesis and stomatal con-ductance to rising [CO2]: mechanisms and environmental interactions. Plant CellEnviron. 30, 258–270.
Bethenod, O., Ruget, F., Katerji, N., Combe, L., Renard, D., 2001. Impact of atmosphericCO2 concentration on water use efficiency of maize. Maydica 46 (2), 75–80.
Bond, J.J., Willis, W.O., 1969. Soil water evaporation—surface residue rate and place-ment effects. Soil Sci. Soc. Am. Proc. 33, 445–448.
Chun, J.A., Wang, Q., Timlin, D., Fleisher, D., Reddy, V.R., 2011. Effect of elevatedcarbon dioxide and water stress on gas exchange and water use efficiency incorn. Agric. For. Meteorol. 151, 378–384.
Conley, M.M., Kimball, B.A., Brooks, T.J., Pinter, P.J., Hunsaker, D.J., Wall, G.W., Adam,N.R., Lamorte, R.L., Matthias, A.D., Thompson, T.L., Leavitt, S.W., Ottman, M.J.,Cousins, A.B., Triggs, J.M., 2001. CO2 enrichment increases water-use efficiencyin sorghum. New Phytol. 151 (2), 407–412.
Cousins, A.B., Adam, N.R., Wall, G.W., Kimball, B.A., Pinter, P.J., Leavitt, S.W., Lamorte,R.L., Matthias, A.D., Ottman, M.J., Thompson, T.L., Webber, A.N., 2001. Reducedphotorespiration and increased energy-use efficiency in young CO2-enrichedsorghum leaves. New Phytol. 150, 275–284.
Driscoll, S.P., Prins, A., Olmos, E., Kunert, K.J., Foyer, C.H., 2006. Specification of adaxialand abaxial stomata, epidermal structure and photosynthesis to CO2 enrichmentin maize leaves. J. Exp. Bot. 57, 81–390.
Earl, H.J., Davis, R.F., 2003. Effect of drought stress on leaf and whole canopy radiationuse efficiency and yield of maize. Agron. J. 95, 688–696.
Easterling, W.E., Aggarwal, P.K., Batima, P., Brander, K.M., Erda, L., Howden, S.M.,Kirilenko, A., Morton, J., Soussana, J.F., Schmidhuber, J., Tubiello, F.N., 2007. Food,fibre and forest products. In: Parry, M.L., Canziani, O.F., Palutikof, J.P., van derLinden, P.J., Hanson, C.E. (Eds.), Climate Change 2007: Impacts, Adaptation andVulnerability. Contribution of Working Group II to the Fourth Assessment Reportof the Intergovernmental Panel on Climate Change. Cambridge University Press,Cambridge, UK, pp. 273–313.
Erbs, M., Manderscheid, R., Weigel, H.J., 2011. A combined rain shelter and free-airCO2 enrichment system to study climate change impacts on plants in the field.
MEE, doi:10.1111/j.2041-210X.2011.00143.x.FAOSTAT, 2009. Online at http://faostat.fao.org.Ghannoum, O., Von Caemmerer, S., Ziska, L.H., Conroy, J.P., 2000. The growth
response of C4 plants to rising atmospheric CO2 partial pressure: a reassessment.Plant Cell Environ. 23, 931–942.

op. J. A
GH
K
K
K
L
L
L
L
L
M
M
M
M
O
O
on the photosynthetic and growth stimulation of selected C-4 crops and weeds.
R. Manderscheid et al. / Eur
hannoum, O., 2009. C4 photosynthesis and water stress. Ann. Bot. 103, 635–644.unsaker, D.J., Kimball, B.A., Pinter, P.J., Lamorte, R.L., Wall, G.W., 1996. Carbon diox-
ide enrichment and irrigation effects on wheat evapotranspiration and water useefficiency. Trans. ASAE 39, 1345–1355.
ang, S., Zhang, F., Hu, X., Zhang, J., 2002. Benefits of CO2 enrichment on crop plantsare modified by soil water status. Plant Soil 238, 69–77.
im, S.H., Gitz, D.C., Sicher, R.C., Baker, J.T., Timlin, D.J., Reddy, V.R., 2007. Temper-ature dependence of growth, development, and photosynthesis in maize underelevated CO2. Environ. Exp. Bot. 61 (3), 224–236.
ing, K.M., Greer, D.H., 1986. Effects of carbon dioxide enrichment and soil water onmaize. Agron. J. 78, 515–521.
eakey, A.D.B., Bernacchi, C.J., Dohleman, F.G., Ort, D.R., Long, S.P., 2004. Will pho-tosynthesis of maize (Zea mays) in the US Corn Belt increase in future [CO2]rich atmospheres? An analysis of diurnal courses of CO2 uptake under free-airconcentration enrichment (FACE). Glob. Change Biol. 10, 951–962.
eakey, A.D.B., Uribelarrea, M., Ainsworth, E.A., Naidu, S.L., Rogers, A., Ort, D.R., Long,S.P., 2006. Photosynthesis, productivity, and yield of maize are not affected byopen-air elevation of CO2 concentration in the absence of drought. Plant Physiol.140, 779–790.
eakey, A.D.B., 2009. Rising atmospheric carbon dioxide concentration and thefuture of C4 crops for food and fuel. Proc. R. Soc. Lond. B: Biol. Sci. 276, 2333–2343.
iu, C.M., Zhang, X.Y., Zhang, Y.Q., 2002. Determination of daily evaporation andevapotranspiration of winter wheat and maize by large-scale weighing lysime-ter and micro-lysimeter. Agric. For. Meteorol. 111 (2), 109–120.
oomis, R.S., Lafitte, H.R., 1987. The carbon economy of a maize crop exposed toelevated CO2 concentrations and water stress as determined from elementalanalyses. Field Crops Res. 17, 63–74.
anderscheid, R., Weigel, H.J., 2007. Drought stress effects on wheat are mitigatedby atmospheric CO2 enrichment. Agron. Sustain. Dev. 27, 79–87.
arkelz, R.J.C., Strellner, R.S., Leakey, A.D.B., 2011. Impairment of C(4) photosynthe-sis by drought is exacerbated by limiting nitrogen and ameliorated by elevated[CO(2)] in maize. J. Exp. Bot. 62, 3235–3246.
eehl, G.A., Stocker, T.F., Collins, W.D., Friedlingstein, P., Gaye, A.T., Gregory, J.M.,Kitoh, A., Knutti, R., Murphy, J.M., Noda, A., Raper, S.C.B., Watterson, I.G., Weaver,A.J., Zhao, Z.-C., 2007. Global climate projections. In: Solomon, S., Qin, D., Man-ning, M., Chen, Z., Marquis, M., Averyt, K.B., Tignor, M., Miller, H.L. (Eds.), ClimateChange 2007: The Physical Science Basis. Contribution of Working Group I to theFourth Annual Assessment Report of the Intergovernmental Panel on ClimateChange. Cambridge University Press, Cambridge, UK, pp. 747–845.
orison, J.I.L., Gifford, R.M., 1984. Plant growth and water use with limited watersupply in high CO2 concentrations. II. Plant dry weight, partitioning and wateruse efficiency. Aust. J. Plant Physiol. 11, 375–384.
liver, R.J., Finch, J.W., Taylor, G., 2009. Second generation bioenergy crops and cli-mate change: a review of the effects of elevated atmospheric CO2 and droughton water use and the implications for yield. GCB Bioenergy 1, 97–114.
tegui, M.E., Andrade, F.H., Suero, E.E., 1995. Growth, water-use, and kernel abortionof maize subjected to drought at silking. Field Crops Res. 40 (2), 87–94.
gronomy 52 (2014) 11–21 21
Ottman, M.J., Kimball, B.A., Pinter, P.J., Wall, G.W., Vanderlip, R.L., Leavitt, S.W., Lam-orte, R.L., Matthias, A.D., Brooks, T.J., 2001. Elevated CO2 increases sorghumbiomass under drought conditions. New Phytol. 150, 261–273.
Pingali, P.L., 2001. In: Pingali, P.L. (Ed.), CIMMYT 1999–2000 World Maize Facts andTrends. Meeting World Maize Needs: Technological Opportunities and Prioritiesfor the Public Sector. CIMMYT, Mexico, D.F.
Rogers, H.H., Bingham, G.E., Cure, J.D., Smith, J.M., Surano, K.A., 1983. Responses ofselected plant species to elevated carbon dioxide in the field. J. Environ. Qual.12, 569–574.
Rudorff, B.F.T., Mulchi, C.L., Daughtry, C.S.T., Lee, E.H., 1996. Growth, radiation useefficiency, and canopy reflectance of wheat and corn grown under elevatedozone and carbon dioxide atmospheres. Remote Sens. Environ. 55, 163–173.
Sadras, V.O., Milroy, S.P., 1996. Soil-water thresholds for the responses of leaf expan-sion and gas exchange: a review. Field Crops Res. 47, 253–266.
Samarakoon, A.B., Gifford, R.M., 1996. Elevated CO2 effects on water use and growthof maize in wet and drying soil. Aust. J. Plant Physiol. 23, 53–62.
Sinclair, T.R., Muchow, R.C., 1999. Radiation use efficiency. Adv. Agron. 65, 215–265.Schonfeld, M.A., Johnson, R.C., Carver, B.F., Morhinweg, D.W., 1988. Water relations
in winter wheat as drought resistance indicators. Crop Sci. 28, 526–531.Stone, P.J., Wilson, D.R., Reid, J.B., Gillepsie, R.N., 2001. Water deficit effects on sweet
corn. I. Water use, radiation use efficiency, growth, and yield. Aust. J. Agric. Res.52 (1), 103–113.
Triggs, J., Kimball, B.A., Pinter, P.J., Wall, G.W., Conley, M.M., Brooks, T.J., LaMorte,R.L., Adam, N.R., Ottman, M.J., Matthias, A.D., Leavitt, S.W., Cerveny, R.S., 2004.Free-air CO2 enrichment effects on the energy balance and evapotranspirationof sorghum. Agric. For. Meteorol. 124, 63–79.
Villalobos, F.J., Fereres, E., 1990. Evaporation measurements beneath corn, cotton,and sunflower canopies. Agron. J. 82 (6), 1153–1159.
Wall, G.W., Brooks, T.J., Adam, R., Cousins, A.B., Kimball, B.A., Pinter, P.J., Lam-orte, R.L., Triggs, L., Ottman, M.J., Leavitt, S.W., Matthias, A.D., Williams,D.G., Webber, A.N., 2001. Elevated atmospheric CO2 improved sorghum plantwater status by ameliorating the adverse effects of drought. New Phytol. 152,231–248.
Weigel, H.-J., Pacholski, A., Burkart, S., Helal, M., Heinemeyer, O., Kleikamp, B.,Manderscheid, R., Fruehauf, C., Hendrey, G.R., Lewin, K., Nagy, J., 2005. Carbonturnover in a crop rotation under free air CO2 enrichment (FACE). Pedosphere15, 728–738.
Wilson, K.B., Carlson, T.N., Bunce, J.A., 1999. Feedback significantly influences thesimulated effect of CO2 on seasonal evapotranspiration from two agriculturalspecies. Glob. Change Biol. 5 (8), 903–917.
Ziska, L.H., Bunce, J.A., 1997. Influence of increasing carbon dioxide concentration
Photosynth. Res. 54 (3), 199–208.Zwart, S.J., Bastiaanssen, W.G.M., 2004. Review of measured crop water productivity
values for irrigated wheat, rice, cotton and maize. Agric. Water Manage. 69,115–133.