interactions between above- and belowground biota: importance for
TRANSCRIPT
University of Groningen
Interactions between above- and belowground biotaBlomqvist, M.M.; Olff, Han; Blaauw, M.B.; Bongers, T.; van der Putten, W.H.
Published in:Oikos
DOI:10.1034/j.1600-0706.2000.900316.x
IMPORTANT NOTE: You are advised to consult the publisher's version (publisher's PDF) if you wish to cite fromit. Please check the document version below.
Document VersionPublisher's PDF, also known as Version of record
Publication date:2000
Link to publication in University of Groningen/UMCG research database
Citation for published version (APA):Blomqvist, M. M., Olff, H., Blaauw, M. B., Bongers, T., & van der Putten, W. H. (2000). Interactions betweenabove- and belowground biota: Importance for small-scale vegetation mosaics in a grassland ecosystem.Oikos, 90(3), 582-598. DOI: 10.1034/j.1600-0706.2000.900316.x
CopyrightOther than for strictly personal use, it is not permitted to download or to forward/distribute the text or part of it without the consent of theauthor(s) and/or copyright holder(s), unless the work is under an open content license (like Creative Commons).
Take-down policyIf you believe that this document breaches copyright please contact us providing details, and we will remove access to the work immediatelyand investigate your claim.
Downloaded from the University of Groningen/UMCG research database (Pure): http://www.rug.nl/research/portal. For technical reasons thenumber of authors shown on this cover page is limited to 10 maximum.
Download date: 04-04-2018
OIKOS 90: 582–598. Copenhagen 2000
Interactions between above- and belowground biota: importance forsmall-scale vegetation mosaics in a grassland ecosystem
M. M. Blomqvist, H. Olff, M. B. Blaauw, T. Bongers and W. H. van der Putten
Blomqvist, M. M., Olff, H., Blaauw, M. B., Bongers, T. and van der Putten, W. H.2000. Interactions between above- and belowground biota: importance for small-scalevegetation mosaics in a grassland ecosystem. – Oikos 90: 582–598.
Grasslands are often characterised by small-scale mosaics in plant communitycomposition that contribute to their diversity. Although above- and belowgroundbiota can both cause such mosaics, few studies have addressed their interactingeffects. We studied multi-trophic interactions between aboveground vertebrate graz-ers, subterranean ants, plant-pathogenic soil biota (especially nematodes) and thevegetation in a temperate grassland. We found that when rabbits and cattle locallyomit vegetation patches, yellow ants (Lasius fla6us) respond to the taller vegetationby digging up more sand from deeper soil layers (hence making taller nest mounds),probably to maintain sufficiently high soil temperatures. We found that this antdigging affects other soil biota, as the mounds contain fewer plant-parasitic andfungivore nematodes. Also, the mounds have lower moisture content and soil bulkdensities, and higher pH and available nutrient content than the directly surroundingsoil. The clonal sedge Carex arenaria grows vigorously on the mounds, producingmore shoots and shorter rhizome internode lengths than in surrounding vegetation.Other plant species, such as the grass Festuca rubra, dominate the surroundingvegetation. A greenhouse bioassay experiment revealed that harmful soil organisms(as plant-parasitic nematodes and pathogenic fungi) outweighed the effect of benefi-cial organisms (e.g., mycorrhizae) in this system. Rhizome biomass and shootproduction of C. arenaria were indeed inhibited less by biota in soil from ant moundsthan by biota in soil from the surrounding vegetation. However, the total biomassproduction of C. arenaria was inhibited as strongly in both soil types. F. rubra wasinhibited more strongly by biota in the surrounding soil. We suggest that variousdirect and indirect interactions between above- and belowground biota can con-tribute to community mosaics and hence diversity in grasslands.
M. M. Blomq6ist, H. Olff (correspondence) and M. B. Blaauw, Nature Conser6ationand Plant Ecology Group, Wageningen Uni6., Bornsesteeg 69, NL-6708 PD Wagenin-gen, the Netherlands (present addresses: MMB: Section of En6ironmental Biology, Inst.of E6olutionary and Ecological Sciences, Leiden Uni6., P.O. Box 9516, NL-2300 RALeiden, the Netherlands. – HO: Tropical Nature Conser6ation and Vertebrate EcologyGroup, Wageningen Uni6., Bornsesteeg 69, NL-6708 PD Wageningen, the Netherlands[[email protected]]. – MBB: Soil Biology Group, Wageningen Uni6., Dreijen-plein 10, NL-6703 HB Wageningen, the Netherlands). – T. Bongers, Laboratory ofNematology, Wageningen Uni6., P.O. Box 8123, NL-6700 ES Wageningen, theNetherlands. – W. H. 6an der Putten, Centre for Terrestrial Ecology, Netherlands Inst.of Ecology, P.O. Box 40, NL-6666 ZG Heteren, the Netherlands.
Temperate natural grassland communities are oftencharacterised by a high plant species richness on smallspatial scales (Bakker 1989, Herben et al. 1993). Thecreation of small-scale environmental heterogeneity to-
gether with direct and indirect interactions betweenecosystem components at various trophic levels appearto be essential factors controlling local species dynamicsand species diversity (Grubb 1977, Tilman 1994, Woot-
Accepted 7 March 2000
Copyright © OIKOS 2000ISSN 0030-1299Printed in Ireland – all rights reserved
OIKOS 90:3 (2000)582
ton 1994, Bever et al. 1997, Olff and Ritchie 1998,Ritchie and Olff 1999). Several studies indicate thatphysical and chemical soil processes (Caldwell et al.1996, George et al. 1997) and herbivorous/pathogenicsoil organisms (van der Putten et al. 1993, Bever etal. 1997, Mills and Bever 1998, van der Putten andvan der Stoel 1998) can be involved in the creation ofmicrosites that are favoured by different plant species.Other studies stress the role of aboveground herbi-vores (Louda et al. 1990, Berg et al. 1997, Olff andRitchie 1998, Knapp et al. 1999). Few attempts havebeen made however to investigate the interactions be-tween above- and belowground organisms and theconsequences of these interactions for small-scale spa-tial patterns in species distributions (Dobson andCrawley 1994, McGinley et al. 1994, Bardgett et al.1998, Milchunas et al. 1998, Mortimer et al. 1999,Strong 1999).
In this study, we explore the interactions betweenplants, aboveground vertebrate herbivores (rabbitsand cattle), subterranean ants and soil-borne patho-gens. In particular, we will address the critical role ofthe yellow ant (Lasius fla6us F.) in this interactionweb.
Direct effects of Lasius fla6us mounds on plantsinclude the biting of leaves and roots, transportationof seeds, and the covering of plants with soil (Wood-ell and King 1991). This soil heaping on the surfaceof mounds seems to be a particularly powerful factorin creating vegetation heterogeneity, both directly bysmothering and indirectly by creating competition-freespace (King 1977a, b, c). Furthermore, the ants mayindirectly affect plants by responding to abovegroundgrazers, by changing soil properties, by tending ofplant-feeding root aphids, by affecting erosion and byattracting mammals and birds to the mounds (Way1963, Pontin 1963, 1978, Woodell and King 1991).
Although the effects of the mound-building activityof L. fla6us on the vegetation and on abiotic soilproperties have been the subject of several studies(see, e.g., Woodell and King 1991, Dean et al. 1997),the effects of the yellow ant on other soil biota andtheir interactions with aboveground grazers arepoorly known. By bringing soil from below the root-ing zone to the surface, the ants may have variousdirect and indirect effects on various harmful soilbiota, such as nematodes, soil-borne pathogenic fungiand soil insects. Various studies show that these or-ganisms can be powerful determinants of naturalplant community composition and dynamics (van derPutten et al. 1988, Brown and Gange 1990, Bever1994, van der Putten and Peters 1997). The abun-dance of soil pathogens is expected to be lower in the‘fresh’ soil that the ants deposit on top of the existingvegetation, both because of negative effects of soiltransport on soil pathogens and because of lowpathogen density in subsoil which has not been in
contact with plant roots (de Rooij-van der Goes et al.1997). Also, Lasius fla6us mounds are usually builtfrom smaller soil particles than the average soil andtheir bulk density and moisture content is generallylower (Wells et al. 1976, King 1977a, 1981, Woodelland King 1991). Furthermore, ants have been ob-served to be able to remove (eat) parasitic nematodesfrom their brood and from their own bodies (Ker-marrec 1975, Drees et al. 1992), opening the possibil-ity of direct effects on other nematode feeding groups(e.g., plant-parasites).
Soil-borne pathogens, in turn, can affect the mor-phology and performance of plant species. Exposureto soil pathogens caused a reduced biomass, shorterand fewer rhizomes and fewer secondary branches inCarex arenaria L. (D’Hertefeldt and van der Putten1998). Moreover, rhizomatous and stoloniferous spe-cies have been known to respond morphologically toabiotic soil characteristic (de Kroon and Hutchings1995). Since ants may change chemical, physical andbiotic soil properties, they could thus indirectly affectthe morphology and performance of plants.
It is generally supposed that the mound-buildinghabit of ants arises from the need to regulate thetemperature in the mound, particularly with respectto the high temperatures needed for optimal broodrearing (Woodell and King 1991, Dean et al. 1997).Some evidence exists that yellow ants build largermounds when the vegetation becomes taller, abandon-ing their nests altogether if the vegetation becomestoo tall (Pontin 1963, Wells et al. 1976, King 1977b).As a consequence, aboveground herbivores may con-trol the digging activity of ants indirectly by con-trolling the height of the vegetation, and hence mayhave an indirect impact on pathogenic or herbivoroussoil biota like plant-parasitic nematodes.
The aim of this study was to gain insight into theseinteractions between plants, above- and belowgroundherbivores and ants, and in their role in the forma-tion and maintenance of small-scale spatial mosaics inplant community composition in natural grasslands.We investigated the effect of local exclusion of above-ground herbivores (resulting in vegetation height dif-ferences) on ant digging activity. We quantified theinfluence of ant mounds on abiotic soil properties andon nematode community structure. The effects of La-sius fla6us ant mounds on the overall plant speciescomposition and specifically on the biomass and rhi-zome architecture of Carex arenaria L. were mea-sured. Finally, we investigated in a bioassay using soilsterilisation if the soil communities from ant moundsand from the surrounding soil were different in theirnet impact on two abundant plant species (Carex are-naria (dominant on mounds) and Festuca rubra L.(dominating the vegetation between mounds)).
OIKOS 90:3 (2000) 583
Methods
Description of research area
The field part of this study was conducted in the JunnerKoeland nature reserve along the river Vecht, theNetherlands (52°32%N, 6°36%E), an area managed by theDutch National Forest Service (Staatsbosbeheer). Thewhole area covers 100 ha of grassland, shrub thickets(mainly Prunus spinosa L.) and woodland (dominatedby Quercus robur L.). Without grazing, succession inthis area would proceed to a closed oak forest (Olff etal. 1999). Since structurally diverse landscapes generallyincrease botanic and faunal diversity (Olff et al. 1999),cattle (Bos taurus L., average density of 1 animal/5 ha)graze the area during the summer. Rabbits (Oryctolaguscuniculus L.) are also present at strongly fluctuatingdensities. During this study the density was low, ap-proximately 2 animals/ha. Soils consist of sandy loamand the terrain is undulating with height differences ofa few metres due to river dune formation in the past.Gley characteristics start below 30 cm and the watertable is below 120 cm. The experiments were performedat a well-drained open grassland site (ca 10 ha) grazedby cattle and hosting a high density (ca 1 mound on 4m2) of nests of the yellow ant, Lasius fla6us. Theaverage height of the ant mounds in this area is 18 cm,the mean diameter is 75 cm and the average (above-ground) mound volume is 0.055 m3 (Blomqvist et al.unpubl.).
According to Woodell and King (1991), the below-ground foraging tunnels of the ants may extend up toone metre around the mound. The grassland vegetationconsists of a rather species-rich plant community withan annual productivity of 400–500 g m−2 yr−1, andcontains several endangered plant species that are char-acteristic for weakly acid, nutrient poor, moist sandysoils. This community has become rare in the Nether-lands due to intensification of agricultural practices.Dominant plant species include Agrostis L. sp., Carexarenaria, Holcus lanatus L., Festuca filiformis Pourr.,Festuca rubra, Deschampsia flexuosa (L.) Trin. andLuzula campestris (L.) DC.
Experimental set up
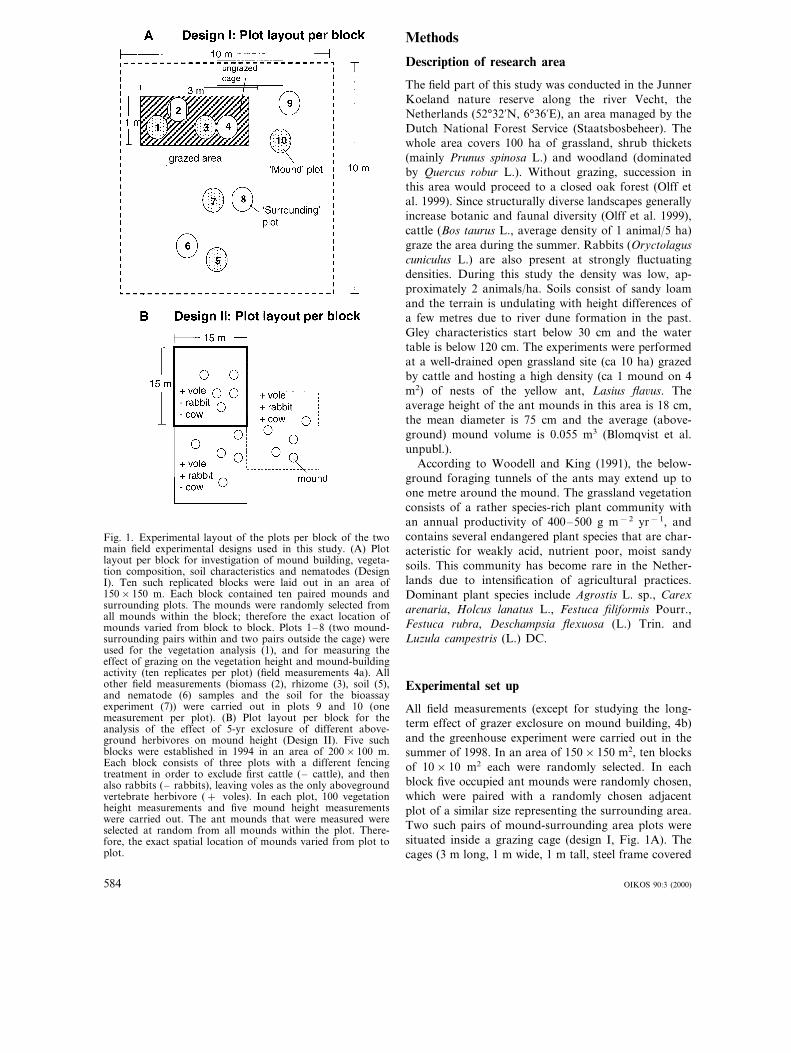
All field measurements (except for studying the long-term effect of grazer exclosure on mound building, 4b)and the greenhouse experiment were carried out in thesummer of 1998. In an area of 150×150 m2, ten blocksof 10×10 m2 each were randomly selected. In eachblock five occupied ant mounds were randomly chosen,which were paired with a randomly chosen adjacentplot of a similar size representing the surrounding area.Two such pairs of mound-surrounding area plots weresituated inside a grazing cage (design I, Fig. 1A). Thecages (3 m long, 1 m wide, 1 m tall, steel frame covered
Fig. 1. Experimental layout of the plots per block of the twomain field experimental designs used in this study. (A) Plotlayout per block for investigation of mound building, vegeta-tion composition, soil characteristics and nematodes (DesignI). Ten such replicated blocks were laid out in an area of150×150 m. Each block contained ten paired mounds andsurrounding plots. The mounds were randomly selected fromall mounds within the block; therefore the exact location ofmounds varied from block to block. Plots 1–8 (two mound-surrounding pairs within and two pairs outside the cage) wereused for the vegetation analysis (1), and for measuring theeffect of grazing on the vegetation height and mound-buildingactivity (ten replicates per plot) (field measurements 4a). Allother field measurements (biomass (2), rhizome (3), soil (5),and nematode (6) samples and the soil for the bioassayexperiment (7)) were carried out in plots 9 and 10 (onemeasurement per plot). (B) Plot layout per block for theanalysis of the effect of 5-yr exclosure of different above-ground herbivores on mound height (Design II). Five suchblocks were established in 1994 in an area of 200×100 m.Each block consists of three plots with a different fencingtreatment in order to exclude first cattle (– cattle), and thenalso rabbits (– rabbits), leaving voles as the only abovegroundvertebrate herbivore (+ voles). In each plot, 100 vegetationheight measurements and five mound height measurementswere carried out. The ant mounds that were measured wereselected at random from all mounds within the plot. There-fore, the exact spatial location of mounds varied from plot toplot.
584 OIKOS 90:3 (2000)
by chicken-fence) were placed in the field at the be-ginning of the growing season of 1998. Six types ofmeasurements were carried out: plant species compo-sition (1), aboveground biomass in the field (2),Carex arenaria rhizome architecture in the field (3),vegetation height and mound-building activity (4a andb), soil abiotic properties (5) and nematode composi-tion (6). In addition, a bioassay experiment (7) wasperformed in order to investigate the effect of soilbiota on C. arenaria and F. rubra.
In each block, the measurements for the plant spe-cies composition (1) and the vegetation height andmound-building activity (4a) were carried out in twopaired plots where grazing was allowed, and in twopaired plots which were non-grazed. In total, the fourpaired plots per block and ten blocks resulted in 80plots where these measurements were carried out (Fig.1A, plots 1–8). The remaining plots (1 paired plotper block where grazing was allowed, adding up to20 plots for the whole experiment; see Fig. 1A, plots9 and 10), were used for clipping the vegetation andcollecting soil and Carex arenaria rhizomes.
On 18 May 1998, in the 20 plots used for clipping,the biomass was cut from an area of 25×50 cm2 andkept frozen at −20°C until further analysis. Seg-ments of Carex arenaria rhizomes (approx. 30 cmlong) were extracted from a depth of 5–25 cm belowthe soil surface, stored at +5°C and analysed twodays later. Bulk soil samples (about 10 l from eachplot) were collected with a hand shovel to be used forsoil and nematode analyses, as well as for thebioassay. In the mounds, soil was taken from thecentre, at a depth of about 5–15 cm below the soilsurface. This depth ensured a soil sample to be col-lected directly below the most densely rooted zonebut still above the soil surface of the surroundingsoil. The soil collected from the mounds, therefore,was originally brought up by the ants. In the sur-rounding plots, soil samples were collected directlyunderneath the most dense rooting zone at a depth of5–25 cm.
Each soil sample was carefully sieved using a meshsize of 8 mm to exclude coarse fractions. As rhizomeswould be able to regenerate (D’Hertefeldt and vander Putten 1998), they were removed as well. Theroots sieved from each sample were cut into smallpieces and mixed back into the same soil sample. Alltools and hands were sterilised with 80% alcohol be-fore handling the next soil sample. Subsequently, 0.5 lof soil from each plot was stored at +5°C and ne-matodes were extracted within two weeks. The re-maining soil (used for measurements of soil abioticfactors and the bioassay experiment) was divided intotwo parts: 6 l was stored at +5°C and 4 l was sentto Gammaster b.v., Ede, for sterilisation by gamma
irradiation (25 kGy). During storage or processing,all soil samples were stored in closed plastic bags toprevent desiccation.
Field measurements
1. Plant species compositionAt the end of July 1998, the presence and abundanceof all plant species were determined in the 80 grazedand ungrazed (cattle and rabbits excluded) antmounds and surrounding plots (plots 1–8, Fig. 1A).Both for mounds and surrounding plots, we used acircular design with a diameter of 70 cm, as thisreflected the mean diameter of all mounds involved.The percentage cover of each plant species was visu-ally estimated. The amount of bare soil was also esti-mated.
2. Abo6eground biomass in the fieldIn the lab, the 20 clipped vegetation samples (fromplots 9 and 10, Fig. 1A) were defrosted and Carexarenaria was separated from the rest of the vegeta-tion. Samples were dried at +70°C for 3–4 d andplant biomass of C. arenaria and the other vegetationwere weighed separately.
3. Architecture of Carex arenaria in the fieldThe sedge C. arenaria is a clonal plant with extensiveunderground rhizomes, which consist of a series ofsympodial units, each unit built up of four visibleinternodes (Noble et al. 1979, Tietema 1981, D’Herte-feldt and van der Putten 1998). In the present study,nodes were divided into two main groups: 1) nodeswithout shoots and 2) nodes leading to aerial shoots.The first group was a broad composite group includ-ing dormant buds, dead buds, dead and broken-offbranches, and emerging buds without visible leaves.The second group included nodes leading to living ordead shoots. Shoots were classified as living if anygreen could be detected on the leaves. Intact sec-ondary branches were hardly ever encountered; sinceshoots were always present at or near the junction,the secondary branches and their shoots were in-cluded in the group of nodes leading to shoots. Fromeach of the 20 plots (plots 9 and 10, Fig. 1A), tenrhizome axes were examined. The number of eachnode type and the number of shoots per node wererecorded. In addition, internode length was calculatedin two ways: a) by measuring the total length of eightinternodes (= two sympodial units) and dividing thislength by eight, and b) by measuring the length ofthe whole rhizome axis divided by the number ofnodes, which was further divided by four (the numberof internodes per node).
OIKOS 90:3 (2000) 585
4. Vegetation height and mound-building acti6itya) The vegetation height (on 40 mounds and 40 sur-rounding plots, plots 1–8, Fig. 1A) and mound-build-ing activity (40 mounds, plots 1, 2, 5 and 6, Fig. 1A)were measured along transects in each plot. Two ver-tical poles were firmly placed on both sides of themounds one metre apart. Since literature indicatesthat the building activity is strongest on the southside (Schreiber 1969, Dlussky 1981), all transects onthe mounds were positioned in a S-N direction. Thetwo poles marking the transect in the surroundingplots (used only for vegetation height measurements)were located in a random direction since no gradientwas expected on the horizontal surrounding soil.From April to August, every 2–5 weeks, the vegeta-tion height and mound-building activity were mea-sured along these transects. Measurements were doneat 10-cm intervals, adding up to nine measurementsper plot per date. The vegetation height was mea-sured using a stick with a measuring scale and around polystyrene disc (10 cm diam., 27 mm thick,weighing 7.00 g) with a hole in the centre. The stickwas placed vertically on the ground, the disc wasreleased at about 1 m height. The height where thedisc remained resting on top of the canopy wasrecorded. The mound-building activity of the antswas measured by putting a one-metre-long bar hori-zontally across the two vertical poles marking a tran-sect across the mound, after which the height of themound was measured at right angles. The growthmeasurements were made by carefully dropping alight measuring stick onto the mound, after which theheight to the underside of the horizontal transect wasrecorded (1 cm precision). The incident and cumula-tive mound growth were calculated by subtractinglater measurements from previous ones.
b) In addition, on 4 May 1999, the heights of Lasiusfla6us ant mounds were measured in existing grazingexclosures under three different grazing regimes (fouryears of grazer exclusion) where (1) voles, (2) voles+rabbits, and (3) voles+rabbits+cattle were present(Design II, Fig. 1B) (H. Olff, E. S. Bakker unpubl.).These exclosures are part of a long-term experimenton the effect of different-sized aboveground herbi-vores on grassland community structure. We used thisexperiment to study the long-term effects of the localexclusion of aboveground herbivores on mound-build-ing by the ants. The design is non-factorial due toinherent practical problems in allowing access bysmall herbivores while excluding large species. Mea-surements were made in five replicate plots (15×15m) per grazing treatment, averaging over five mea-surements within each plot (Fig. 1B). The vegetationheight was measured as described above in the sameplots on 6 August 1998 (four-year grazer exclusion),averaging over 100 measurements within each plot.
Soil measurements
5. Soil propertiesThe effect of the mound-building activity of the antson soil physical and chemical properties was assessedby comparing the soil characteristics in ten moundsand ten surrounding plots (plots 9 and 10, Fig. 1A).Soil moisture content was determined by calculatingthe difference between the weight of the soil beforeand after drying for 4 d at +70°C. The soil pH wasmeasured after adding 50 ml of a 1 M KCl solutionto 20 g soil (field moisture content). Ammonium(NH4
+) and nitrate (NO3−) concentrations were
analysed with an auto-analyser after extraction with 1M KCl and soil phosphate (PO4
3−) after extractionwith CaCl2. Total soil P and N were analysed withan auto-analyser after destruction in a mixture ofH2SO4+Se+salicilic acid. Bulk density was mea-sured using 100-ml volumetric rings. Soil organic mat-ter was determined by drying the soil samples at105°C overnight, after which the weight loss after ig-nition at +550°C for 3 h was calculated. Valueswere calculated both on a per weight and on a pervolume basis. To investigate the effect of sterilisationon soil chemical characteristics, properties were mea-sured both in 1) unsterilised soil stored at +5°C andin 2) sterilised soil.
6. Nematode densities and species compositionNematodes were isolated from 100 ml soil (collectedfrom the same bulk samples as used for the soilchemical analysis and greenhouse experiment) usingthe Oostenbrink elutriator (Oostenbrink 1960), the re-maining roots were put in a mistifier to extract ne-matodes from roots. The extracted nematodes weresubsequently counted, fixed and identified in massslides. The Tylenchidae were divided into two groups:the Coslenchus group, also including Aglenchus, whichare characterised by relatively robust stylets and theFilenchus group, which also included Basiria. The ma-turity index (MI), the plant parasitic index (PPI) andthe PPI/MI-ratio were calculated following Bongers(1990) and Bongers et al. (1997). Classification totrophic groups was done according to Yeates et al.(1993). Number of nematodes and species composi-tion in mounds and in the surrounding soil werecompared.
Bioassay
The effect of the total soil biota on the growth ofCarex arenaria and Festuca rubra was investigated ina greenhouse experiment, using the same bulk soilsamples as used for the nematode and chemicalanalyses. Seeds of C. arenaria and F. rubra, which
586 OIKOS 90:3 (2000)
had been collected from Junner Koeland the previoussummer, were sown on fine silver sand, germinated at25/15°C and grown for 5–6 weeks. In order to be ableto grow both C. arenaria and F. rubra in soil samplesfrom the same origin, each of the ten mounds and ofthe ten surrounding soil samples mentioned above, aswell as their sterilised equivalents (20×2=40 samples),were split over two 1.0-l pots, resulting in 80 potsaltogether.
The sterilisation was done in order to detect theeffects of the soil biota alone on the growth of theplants, ‘excluding’ the effects of differences in soil abi-otic factors such as moisture and nutrients. Since steril-isation eliminates both beneficial and harmful soilorganisms, sterilisation may have both positive andnegative effects on plant growth. The net effect ofsterilisation on plant growth is determined by the bal-ance between positive and negative effects; a smallerbiomass production in unsterilised soil than in sterilisedsoil indicates a larger effect of harmful organisms,whereas a larger production in unsterilised soil indicatesa larger effect of beneficial soil organisms (see also, e.g.,van der Putten et al. 1988, van der Putten and Peters1997).
All pots were filled to contain the same dry weight ofsoil (1000 g) and moisture content was kept at 15% w/w(similar to that found in the field) by watering 2–3times a week. Tin foil was placed over the pots toprevent desiccation and growth of algae. Four seedlingsof each species were planted in monoculture in each potthrough holes in the tin foil. This resulted in 40 potswith C. arenaria and 40 pots with F. rubra. Within eachplant species, half of the pots contained ‘mound’ soil,while half of the pots contained ‘surrounding’ soil, andwithin this, half of the pots contained sterilised soilwhile half of the pots contained non-sterilised soil. On28 May 1998, the pots were placed randomly in agreenhouse at a temperature of 20/15°C without addi-tional illumination (day length 14.5–16.5 h during ex-periment). The position of the pots in the greenhousewas re-arranged weekly to avoid structural effects ofposition. During the first two weeks, seedlings whichwere unable to establish were replaced.
In order to avoid side effects due to differences ininitial soil fertility and any possible nutrient enhance-ment due to the sterilisation process itself, nutrients(full strength Hoagland solution) were added to thepots, starting on day 12 after the planting of theseedlings. Nutrients were added once a week, startingwith 12.5 ml. In order to meet the increasing demandsof growth, the doses were increased to 25 ml after twoweeks. After 12 weeks the number of surviving genetsand shoots were counted and the plants were harvested.Shoots, roots and rhizomes were collected and dried at70°C for 2–4 d, after which the dry biomass wasdetermined.
Data analysis
The effects of site or soil type (mound/surrounding),grazing (ungrazed/grazed), sterilisation (unsterilised/sterilised) and plant species (C. arenaria/F. rubra) onthe different response variables were tested using two-and three-way ANOVAs, followed by Tukey HSD con-trasts. In order to homogenise the variances, observednematode numbers (n) were log (n+1) transformedbefore to the analysis. Nematode densities were alsocalculated per volume of soil before differences betweenmounds and surrounding plots were tested with a one-way ANOVA. Biomass values observed in the green-house experiment were ln-transformed before ANOVA.The effect of sterilisation on plant biomass was calcu-lated as the proportional reduction in biomass beforeand after sterilisation as: 1 – (biomass unsterilised/biomass sterilised) (van der Putten et al. 1993, van derPutten and Peters 1997). The pairs of unsterilised andsterilised biomass were always grown in soil originatingfrom the same field plot (parts of the same bulksample).
Finally, we used multivariate ordination techniquesto explore whether specific nematode taxa preferred oravoided ant mounds, and to study which environmentalfactors had the largest impact on their communitycomposition. We used detrended correspondence analy-sis (DCA, Hill 1979) to investigate the length of thelongest underlying environmental gradient. This tech-nique indicates whether the species responses to theunderlying environmental factors can be approximatedbest by a linear model or by a unimodal model (with anoptimum). This information then directs the choicetoward ordination techniques based on a linear re-sponse (as principal component analysis (PCA) andredundancy analysis (RDA)), which use a linear multi-ple regression approach, or to techniques based onunimodal response models (detrended correspondenceanalysis (DCA) and canonical correspondence analysis(CCA)), which use weighted averaging as an ordinationalgorithm (ter Braak 1995). For our data, the underly-ing gradients were found to be short, leading to PCAand RDA. With PCA, the sites are ranked along animaginary axis in such an order that the differencesbetween species in the slope of their response to thisaxis are maximised (i.e., indirect ordination). It thusfinds an order of sites that most likely represents theranking of sites along the main environmental gradientdetermining the species composition. Depending ontheir correlation structure, individual environmentalfactors can co-vary along such a main environmentalgradient. Subsequent ordination axes (other environ-mental gradients) are similarly derived using the residu-als from all previous axes. We then applied RDA,which is a similar technique, but with the limitationthat the axes scores of the sites (representing the envi-ronmental gradient) are always constrained to be the
OIKOS 90:3 (2000) 587
result of a multiple regression equation of the measuredenvironmental factors (i.e., direct ordination). The re-duction in ‘fit’ (cumulative variance in the species dataexplained by the ordination axes) from PCA to RDAindicates whether important environmental factors de-termining the species composition have been missed (terBraak 1995). Both methods also give insight into theorder of importance of individual environmental factorsin determining community structure. Also, RDA allowsfor testing the significance of the effect of single envi-ronmental factors (as difference between mounds andsurroundings) on community structure.
The same type of multivariate analysis (PCA andRDA) was used to study variation in various architec-tural traits of C. arenaria (now the response variablesinstead of species abundances) in relation to environ-mental factors.
Results
Ant mounds and vegetation characteristics
The analysis of the plant species composition ofmounds and the surrounding matrix revealed that thetwo microhabitats differed in plant species richness andplant community composition. The species richness ofhigher plants (forbs, sedges and grasses) was larger inthe surrounding matrix (F1,9=24.20, p=0.001), whilespecies richness of mosses and lichens was higher on themounds (F1,9=25.45, p=0.001 and F1,9=7.364, p=0.024, respectively). Carex arenaria showed a strongaffinity for mounds (F1,9=33.45, pB0.001), while Fes-tuca rubra was more abundant in the surroundingmatrix (F1,9=10.47, p=0.01). In addition, Festuca fili-formis Pourr., and the mosses Pleurozium schreberi(Brid.) Mitt., Ceratodon purpureus (Hedw.) Brid., andDicranum scoparium Hedw. were more abundant on themounds, while Agrostis sp. L., Holcus lanatus L.,Luzula campestris (L.) DC, and the moss Rhytidiadel-phus squarrosus (Hedw.) Warnst. preferred the sur-rounding matrix. Within each microhabitat (moundand surrounding) exclusion of grazing for one summer(using the grazing cages) did not have any significanteffect on the plant community composition (results notshown). There was more bare soil on the mounds than
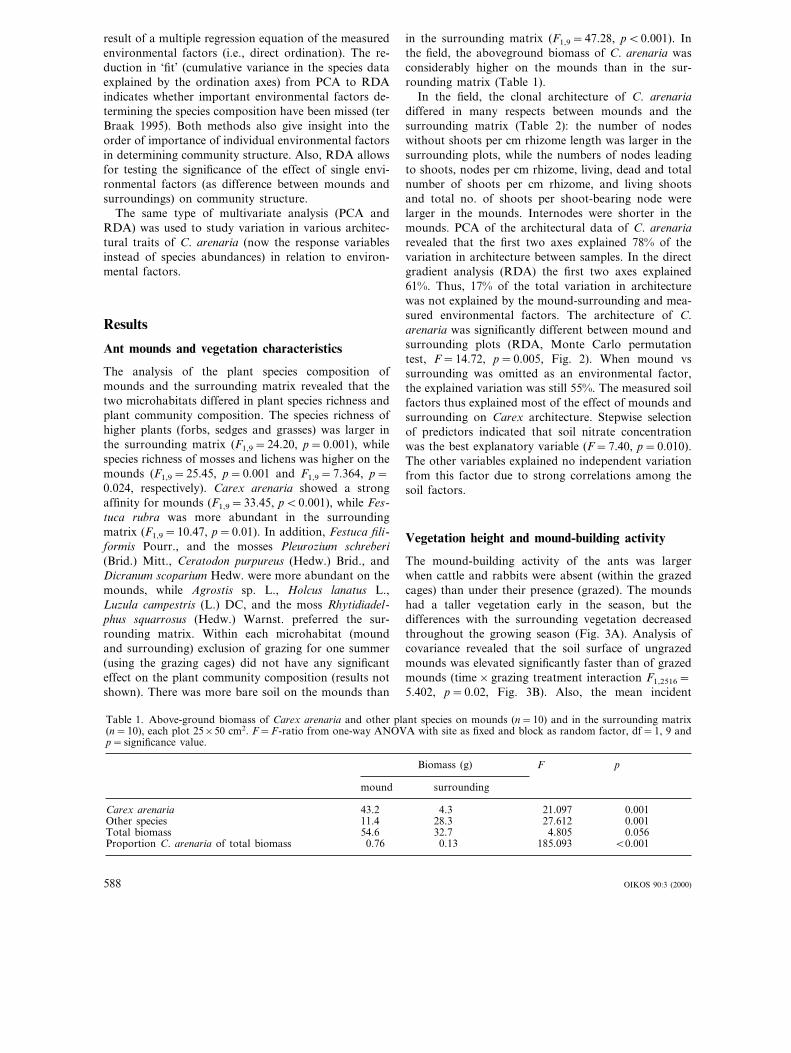
in the surrounding matrix (F1,9=47.28, pB0.001). Inthe field, the aboveground biomass of C. arenaria wasconsiderably higher on the mounds than in the sur-rounding matrix (Table 1).
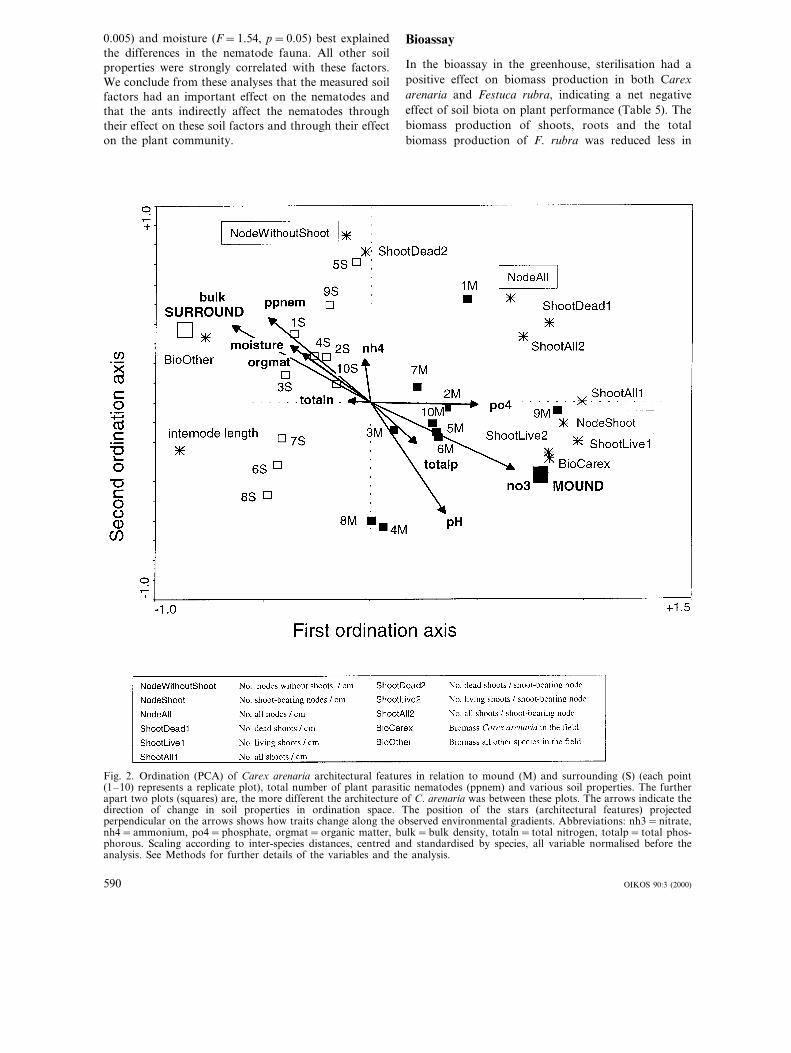
In the field, the clonal architecture of C. arenariadiffered in many respects between mounds and thesurrounding matrix (Table 2): the number of nodeswithout shoots per cm rhizome length was larger in thesurrounding plots, while the numbers of nodes leadingto shoots, nodes per cm rhizome, living, dead and totalnumber of shoots per cm rhizome, and living shootsand total no. of shoots per shoot-bearing node werelarger in the mounds. Internodes were shorter in themounds. PCA of the architectural data of C. arenariarevealed that the first two axes explained 78% of thevariation in architecture between samples. In the directgradient analysis (RDA) the first two axes explained61%. Thus, 17% of the total variation in architecturewas not explained by the mound-surrounding and mea-sured environmental factors. The architecture of C.arenaria was significantly different between mound andsurrounding plots (RDA, Monte Carlo permutationtest, F=14.72, p=0.005, Fig. 2). When mound vssurrounding was omitted as an environmental factor,the explained variation was still 55%. The measured soilfactors thus explained most of the effect of mounds andsurrounding on Carex architecture. Stepwise selectionof predictors indicated that soil nitrate concentrationwas the best explanatory variable (F=7.40, p=0.010).The other variables explained no independent variationfrom this factor due to strong correlations among thesoil factors.
Vegetation height and mound-building activity
The mound-building activity of the ants was largerwhen cattle and rabbits were absent (within the grazedcages) than under their presence (grazed). The moundshad a taller vegetation early in the season, but thedifferences with the surrounding vegetation decreasedthroughout the growing season (Fig. 3A). Analysis ofcovariance revealed that the soil surface of ungrazedmounds was elevated significantly faster than of grazedmounds (time×grazing treatment interaction F1,2516=5.402, p=0.02, Fig. 3B). Also, the mean incident
Table 1. Above-ground biomass of Carex arenaria and other plant species on mounds (n=10) and in the surrounding matrix(n=10), each plot 25×50 cm2. F=F-ratio from one-way ANOVA with site as fixed and block as random factor, df=1, 9 andp=significance value.
Biomass (g) F p
surroundingmound
0.00121.0974.343.2Carex arenaria27.61228.3Other species 0.00111.4
54.6Total biomass 0.0564.80532.7B0.001185.0930.130.76Proportion C. arenaria of total biomass
588 OIKOS 90:3 (2000)
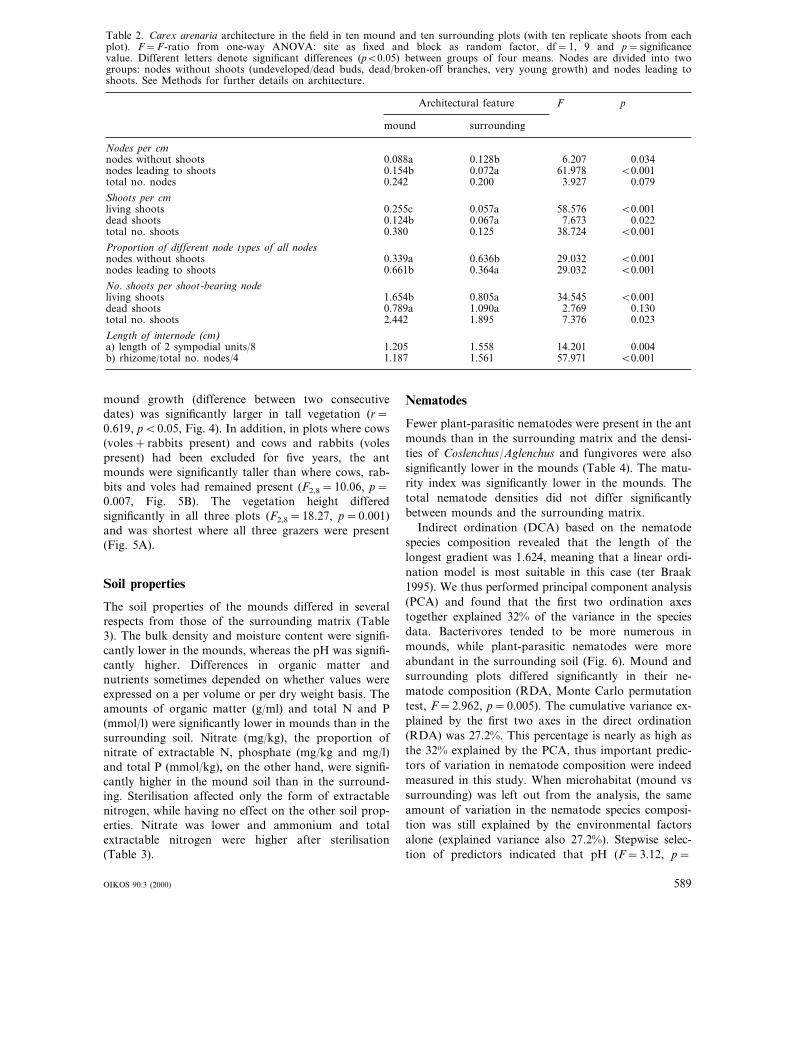
Table 2. Carex arenaria architecture in the field in ten mound and ten surrounding plots (with ten replicate shoots from eachplot). F=F-ratio from one-way ANOVA: site as fixed and block as random factor, df=1, 9 and p=significancevalue. Different letters denote significant differences (pB0.05) between groups of four means. Nodes are divided into twogroups: nodes without shoots (undeveloped/dead buds, dead/broken-off branches, very young growth) and nodes leading toshoots. See Methods for further details on architecture.
Architectural feature F p
mound surrounding
Nodes per cmnodes without shoots 0.0340.088a 0.128b 6.207nodes leading to shoots 0.154b B0.0010.072a 61.978total no. nodes 0.0790.242 0.200 3.927
Shoots per cmliving shoots B0.0010.255c 0.057a 58.576dead shoots 0.124b 0.0220.067a 7.673total no. shoots 0.380 B0.0010.125 38.724
Proportion of different node types of all nodesnodes without shoots B0.0010.339a 0.636b 29.032nodes leading to shoots 0.661b B0.0010.364a 29.032
No. shoots per shoot-bearing nodeliving shoots 1.654b B0.0010.805a 34.545dead shoots 0.789a 0.1301.090a 2.769total no. shoots 2.442 0.0231.895 7.376
Length of internode (cm)a) length of 2 sympodial units/8 1.205 0.0041.558 14.201b) rhizome/total no. nodes/4 1.187 1.561 57.971 B0.001
mound growth (difference between two consecutivedates) was significantly larger in tall vegetation (r=0.619, pB0.05, Fig. 4). In addition, in plots where cows(voles+rabbits present) and cows and rabbits (volespresent) had been excluded for five years, the antmounds were significantly taller than where cows, rab-bits and voles had remained present (F2,8=10.06, p=0.007, Fig. 5B). The vegetation height differedsignificantly in all three plots (F2,8=18.27, p=0.001)and was shortest where all three grazers were present(Fig. 5A).
Soil properties
The soil properties of the mounds differed in severalrespects from those of the surrounding matrix (Table3). The bulk density and moisture content were signifi-cantly lower in the mounds, whereas the pH was signifi-cantly higher. Differences in organic matter andnutrients sometimes depended on whether values wereexpressed on a per volume or per dry weight basis. Theamounts of organic matter (g/ml) and total N and P(mmol/l) were significantly lower in mounds than in thesurrounding soil. Nitrate (mg/kg), the proportion ofnitrate of extractable N, phosphate (mg/kg and mg/l)and total P (mmol/kg), on the other hand, were signifi-cantly higher in the mound soil than in the surround-ing. Sterilisation affected only the form of extractablenitrogen, while having no effect on the other soil prop-erties. Nitrate was lower and ammonium and totalextractable nitrogen were higher after sterilisation(Table 3).
Nematodes
Fewer plant-parasitic nematodes were present in the antmounds than in the surrounding matrix and the densi-ties of Coslenchus/Aglenchus and fungivores were alsosignificantly lower in the mounds (Table 4). The matu-rity index was significantly lower in the mounds. Thetotal nematode densities did not differ significantlybetween mounds and the surrounding matrix.
Indirect ordination (DCA) based on the nematodespecies composition revealed that the length of thelongest gradient was 1.624, meaning that a linear ordi-nation model is most suitable in this case (ter Braak1995). We thus performed principal component analysis(PCA) and found that the first two ordination axestogether explained 32% of the variance in the speciesdata. Bacterivores tended to be more numerous inmounds, while plant-parasitic nematodes were moreabundant in the surrounding soil (Fig. 6). Mound andsurrounding plots differed significantly in their ne-matode composition (RDA, Monte Carlo permutationtest, F=2.962, p=0.005). The cumulative variance ex-plained by the first two axes in the direct ordination(RDA) was 27.2%. This percentage is nearly as high asthe 32% explained by the PCA, thus important predic-tors of variation in nematode composition were indeedmeasured in this study. When microhabitat (mound vssurrounding) was left out from the analysis, the sameamount of variation in the nematode species composi-tion was still explained by the environmental factorsalone (explained variance also 27.2%). Stepwise selec-tion of predictors indicated that pH (F=3.12, p=
OIKOS 90:3 (2000) 589
0.005) and moisture (F=1.54, p=0.05) best explainedthe differences in the nematode fauna. All other soilproperties were strongly correlated with these factors.We conclude from these analyses that the measured soilfactors had an important effect on the nematodes andthat the ants indirectly affect the nematodes throughtheir effect on these soil factors and through their effecton the plant community.
Bioassay
In the bioassay in the greenhouse, sterilisation had apositive effect on biomass production in both Carexarenaria and Festuca rubra, indicating a net negativeeffect of soil biota on plant performance (Table 5). Thebiomass production of shoots, roots and the totalbiomass production of F. rubra was reduced less in
Fig. 2. Ordination (PCA) of Carex arenaria architectural features in relation to mound (M) and surrounding (S) (each point(1–10) represents a replicate plot), total number of plant parasitic nematodes (ppnem) and various soil properties. The furtherapart two plots (squares) are, the more different the architecture of C. arenaria was between these plots. The arrows indicate thedirection of change in soil properties in ordination space. The position of the stars (architectural features) projectedperpendicular on the arrows shows how traits change along the observed environmental gradients. Abbreviations: nh3=nitrate,nh4=ammonium, po4=phosphate, orgmat=organic matter, bulk=bulk density, totaln= total nitrogen, totalp= total phos-phorous. Scaling according to inter-species distances, centred and standardised by species, all variable normalised before theanalysis. See Methods for further details of the variables and the analysis.
OIKOS 90:3 (2000)590
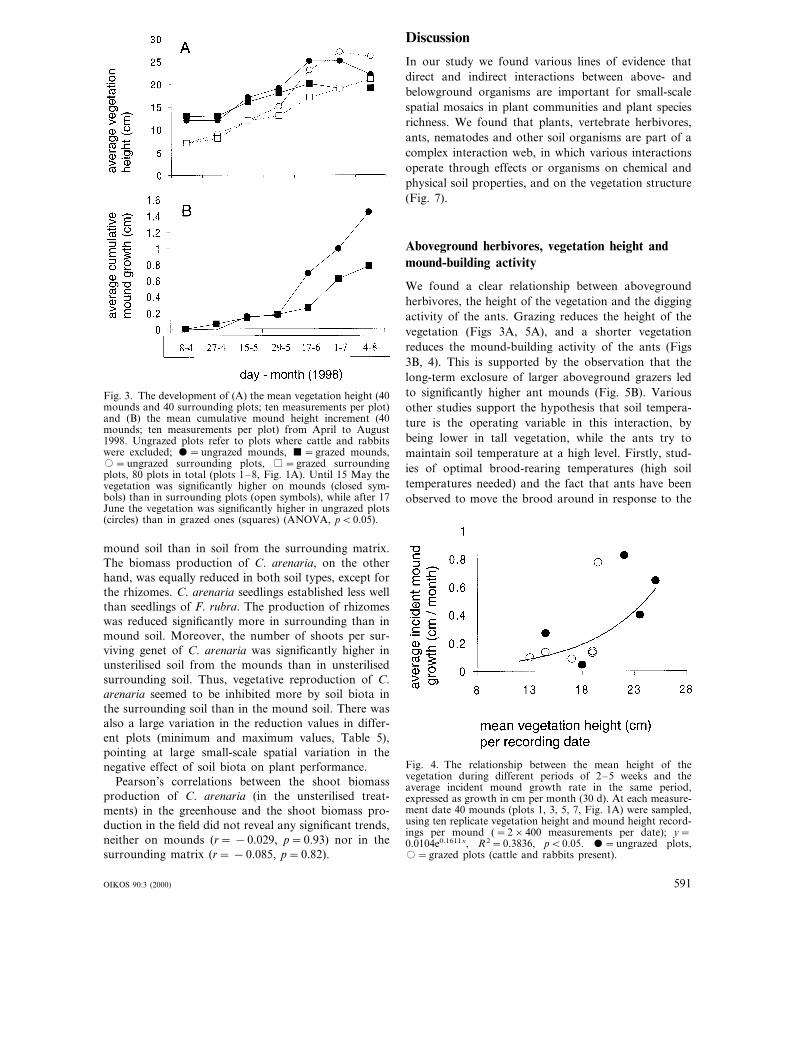
Fig. 3. The development of (A) the mean vegetation height (40mounds and 40 surrounding plots; ten measurements per plot)and (B) the mean cumulative mound height increment (40mounds; ten measurements per plot) from April to August1998. Ungrazed plots refer to plots where cattle and rabbitswere excluded; =ungrazed mounds, =grazed mounds,�=ungrazed surrounding plots, =grazed surroundingplots, 80 plots in total (plots 1–8, Fig. 1A). Until 15 May thevegetation was significantly higher on mounds (closed sym-bols) than in surrounding plots (open symbols), while after 17June the vegetation was significantly higher in ungrazed plots(circles) than in grazed ones (squares) (ANOVA, pB0.05).
Discussion
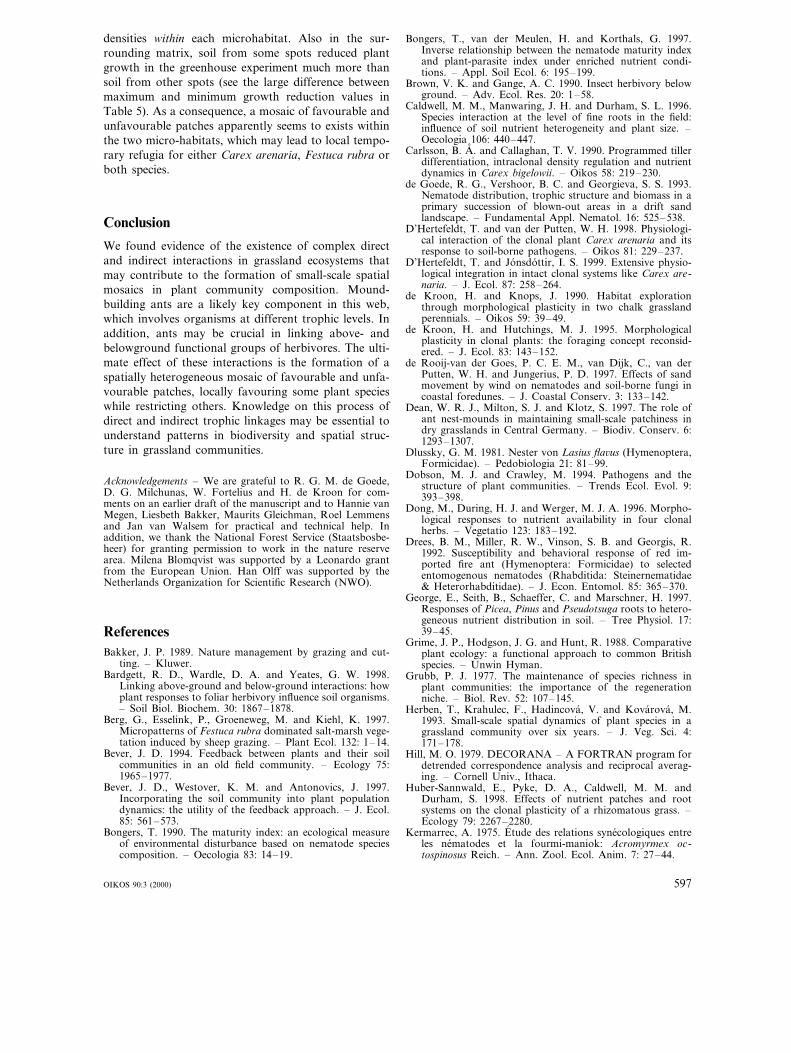
In our study we found various lines of evidence thatdirect and indirect interactions between above- andbelowground organisms are important for small-scalespatial mosaics in plant communities and plant speciesrichness. We found that plants, vertebrate herbivores,ants, nematodes and other soil organisms are part of acomplex interaction web, in which various interactionsoperate through effects or organisms on chemical andphysical soil properties, and on the vegetation structure(Fig. 7).
Aboveground herbivores, vegetation height andmound-building activity
We found a clear relationship between abovegroundherbivores, the height of the vegetation and the diggingactivity of the ants. Grazing reduces the height of thevegetation (Figs 3A, 5A), and a shorter vegetationreduces the mound-building activity of the ants (Figs3B, 4). This is supported by the observation that thelong-term exclosure of larger aboveground grazers ledto significantly higher ant mounds (Fig. 5B). Variousother studies support the hypothesis that soil tempera-ture is the operating variable in this interaction, bybeing lower in tall vegetation, while the ants try tomaintain soil temperature at a high level. Firstly, stud-ies of optimal brood-rearing temperatures (high soiltemperatures needed) and the fact that ants have beenobserved to move the brood around in response to the
Fig. 4. The relationship between the mean height of thevegetation during different periods of 2–5 weeks and theaverage incident mound growth rate in the same period,expressed as growth in cm per month (30 d). At each measure-ment date 40 mounds (plots 1, 3, 5, 7, Fig. 1A) were sampled,using ten replicate vegetation height and mound height record-ings per mound (=2×400 measurements per date); y=0.0104e0.1611x, R2=0.3836, pB0.05. =ungrazed plots,�=grazed plots (cattle and rabbits present).
mound soil than in soil from the surrounding matrix.The biomass production of C. arenaria, on the otherhand, was equally reduced in both soil types, except forthe rhizomes. C. arenaria seedlings established less wellthan seedlings of F. rubra. The production of rhizomeswas reduced significantly more in surrounding than inmound soil. Moreover, the number of shoots per sur-viving genet of C. arenaria was significantly higher inunsterilised soil from the mounds than in unsterilisedsurrounding soil. Thus, vegetative reproduction of C.arenaria seemed to be inhibited more by soil biota inthe surrounding soil than in the mound soil. There wasalso a large variation in the reduction values in differ-ent plots (minimum and maximum values, Table 5),pointing at large small-scale spatial variation in thenegative effect of soil biota on plant performance.
Pearson’s correlations between the shoot biomassproduction of C. arenaria (in the unsterilised treat-ments) in the greenhouse and the shoot biomass pro-duction in the field did not reveal any significant trends,neither on mounds (r= −0.029, p=0.93) nor in thesurrounding matrix (r= −0.085, p=0.82).
591OIKOS 90:3 (2000)

Fig. 5. Effect of five-year exclosure of different grazers (+means present,− means absent) on (A) vegetation height (fivereplicate plots with 100 measurements per plot) and (B) antmound height (five replicate plots, five measurements per plot).Means with different letters were significantly different (PB0.05, Tukey test after one-way ANOVA).
and King 1991). The resulting low moisture content isprobably one of the more important limiting factorsfor many plants, including the shallow-rooted Festucarubra (King 1977a). In addition, the availability ofbare soil where plant competition is limited, in com-bination with the smothering effect of the soil heap-ing, is probably a particularly important determinantof the plant species composition.
The influence of ants on nematodes
By building mounds, ants create a new soil microhab-itat for soil dwelling nematodes, with low initial ne-matode densities and with deviating physical andchemical soil properties. Transport of sand grains isalso known to reduce numbers of nematodes, as wellas numbers of fungal colony-forming units (de Rooij-van der Goes et al. 1997). Recolonisation fromdeeper soil layers and the surrounding undisturbedsoil is possible, but may lag behind the continuoussoil heaping by the ants (responding to mound ero-sion). Mound-building activity may prevent the ne-matode community in the mounds to achieve anequilibrium with the community in the surroundingand underlying soil. This is reflected by the MaturityIndex, a community parameter based on the life-strategies of the constituent nematode taxa (Bongers1990), which was found to be lower in the moundsthan in the surrounding soil. Closer analysis revealsthat the mounds contain more ‘enrichment oppor-tunists’, indicating a higher microbial activity, and alower dominance of persisters (K-strategists in theloose sense).
In the mounds, the densities of fungivores andplant feeding nematodes are significantly lower (Table4), while bacterivores tend to be more abundant thanin surrounding soil (Fig. 6). The higher abundance offungal feeders in the surrounding soil may be relatedto the higher decomposition rate of plant roots byfungi and higher organic matter content in the sur-rounding (Stanton 1988). The multivariate analysesindicated that the soil properties explain practicallyall the (explained) variation in the nematode composi-tion, also for plant-pathogenic species. At first hand,this may seem strange as several studies indicate thatplant-pathogenic nematodes are much more sensitiveto the vegetation features (presence and productivityof host plants and root architecture) than to soilphysical and chemical factors (Yeates 1987, Stanton1988, de Goede et al. 1993, Mortimer et al. 1999). Ifthis is true also in the system we studied, the highstatistical correlation between soil abiotic factors andnematodes may represent an indirect effect possiblyoperating via the relation between soil abiotic factorsand vegetation characteristics.
position of the sun (King 1977b, Woodell and King1991) show that the ants respond rapidly to changesin soil temperature. Secondly, it has been observedthat ants abandon their nests when the vegetationbecomes too tall (Pontin 1963, Wells et al. 1976). Wethus conclude that aboveground herbivores facilitatefor ants on a large spatial scale, while affecting theirdigging activity on a small spatial scale by creatingvegetation height differences.
The influence of ant mounds on abiotic soilproperties
Ant mounds affect the soil abiotic factors in severalways (Table 3), which results in a small-scale mosaicof patches differing in their soil properties. As alsofound in other studies (King 1981, Woodell and King1991, Dean et al. 1997), we found that mounds weredrier and had a lower bulk density than the sur-rounding matrix. The lower bulk density is obviouslya result of the digging activity of the ants, by whichthey create a very loose soil structure with tunnelsand chambers leading to higher evaporation (Woodell
OIKOS 90:3 (2000)592
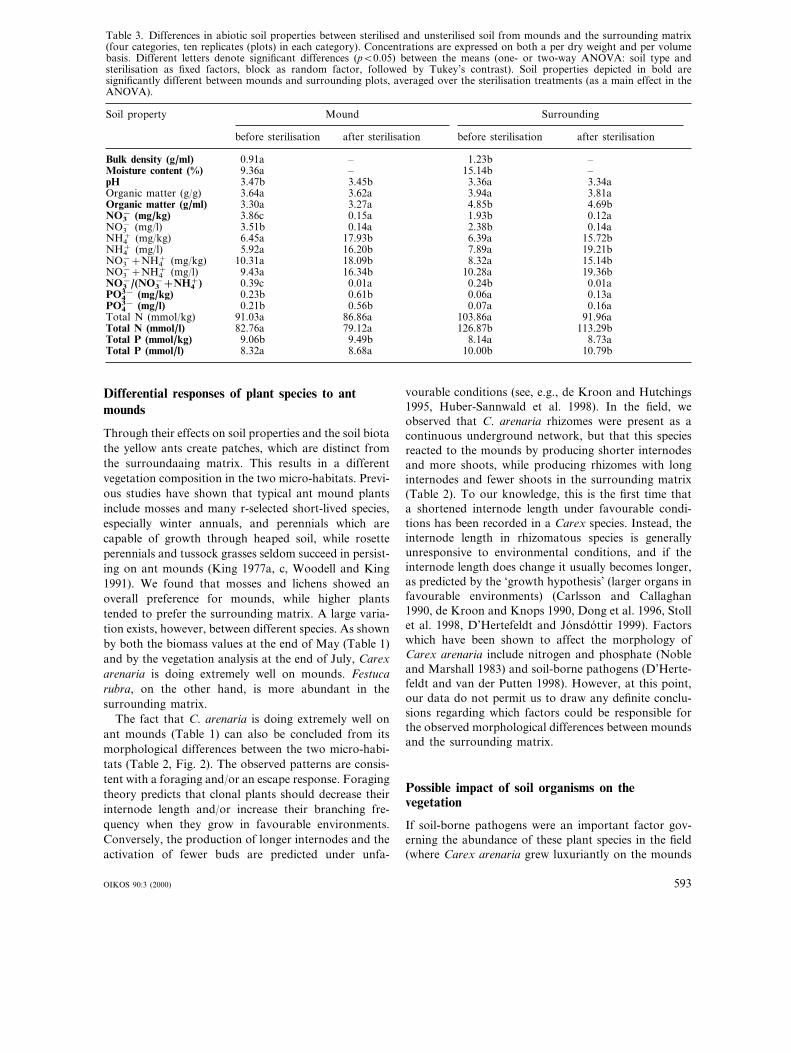
Table 3. Differences in abiotic soil properties between sterilised and unsterilised soil from mounds and the surrounding matrix(four categories, ten replicates (plots) in each category). Concentrations are expressed on both a per dry weight and per volumebasis. Different letters denote significant differences (pB0.05) between the means (one- or two-way ANOVA: soil type andsterilisation as fixed factors, block as random factor, followed by Tukey’s contrast). Soil properties depicted in bold aresignificantly different between mounds and surrounding plots, averaged over the sterilisation treatments (as a main effect in theANOVA).
Soil property Mound Surrounding
after sterilisationbefore sterilisation after sterilisation before sterilisation
Bulk density (g/ml) 0.91a –– 1.23bMoisture content (%) –9.36a – 15.14bpH 3.47b 3.34a3.45b 3.36a
3.81aOrganic matter (g/g) 3.64a 3.62a 3.94aOrganic matter (g/ml) 3.30a 4.69b3.27a 4.85bNO3
− (mg/kg) 0.12a3.86c 0.15a 1.93bNO3
− (mg/l) 3.51b 0.14a0.14a 2.38bNH4
+ (mg/kg) 15.72b6.45a 17.93b 6.39aNH4
+ (mg/l) 5.92a 19.21b16.20b 7.89aNO3
−+NH4+ (mg/kg) 15.14b10.31a 18.09b 8.32a
NO3−+NH4
+ (mg/l) 9.43a 19.36b16.34b 10.28aNO3
−/(NO3−+NH4
+) 0.39c 0.01a 0.01a0.24bPO4
3− (mg/kg) 0.23b 0.13a0.61b 0.06aPO4
3− (mg/l) 0.16a0.21b 0.56b 0.07aTotal N (mmol/kg) 91.03a 91.96a86.86a 103.86aTotal N (mmol/l) 82.76a 79.12a 126.87b 113.29bTotal P (mmol/kg) 9.06b 8.73a9.49b 8.14aTotal P (mmol/l) 8.32a 8.68a 10.00b 10.79b
Differential responses of plant species to antmounds
Through their effects on soil properties and the soil biotathe yellow ants create patches, which are distinct fromthe surroundaaing matrix. This results in a differentvegetation composition in the two micro-habitats. Previ-ous studies have shown that typical ant mound plantsinclude mosses and many r-selected short-lived species,especially winter annuals, and perennials which arecapable of growth through heaped soil, while rosetteperennials and tussock grasses seldom succeed in persist-ing on ant mounds (King 1977a, c, Woodell and King1991). We found that mosses and lichens showed anoverall preference for mounds, while higher plantstended to prefer the surrounding matrix. A large varia-tion exists, however, between different species. As shownby both the biomass values at the end of May (Table 1)and by the vegetation analysis at the end of July, Carexarenaria is doing extremely well on mounds. Festucarubra, on the other hand, is more abundant in thesurrounding matrix.
The fact that C. arenaria is doing extremely well onant mounds (Table 1) can also be concluded from itsmorphological differences between the two micro-habi-tats (Table 2, Fig. 2). The observed patterns are consis-tent with a foraging and/or an escape response. Foragingtheory predicts that clonal plants should decrease theirinternode length and/or increase their branching fre-quency when they grow in favourable environments.Conversely, the production of longer internodes and theactivation of fewer buds are predicted under unfa-
vourable conditions (see, e.g., de Kroon and Hutchings1995, Huber-Sannwald et al. 1998). In the field, weobserved that C. arenaria rhizomes were present as acontinuous underground network, but that this speciesreacted to the mounds by producing shorter internodesand more shoots, while producing rhizomes with longinternodes and fewer shoots in the surrounding matrix(Table 2). To our knowledge, this is the first time thata shortened internode length under favourable condi-tions has been recorded in a Carex species. Instead, theinternode length in rhizomatous species is generallyunresponsive to environmental conditions, and if theinternode length does change it usually becomes longer,as predicted by the ‘growth hypothesis’ (larger organs infavourable environments) (Carlsson and Callaghan1990, de Kroon and Knops 1990, Dong et al. 1996, Stollet al. 1998, D’Hertefeldt and Jonsdottir 1999). Factorswhich have been shown to affect the morphology ofCarex arenaria include nitrogen and phosphate (Nobleand Marshall 1983) and soil-borne pathogens (D’Herte-feldt and van der Putten 1998). However, at this point,our data do not permit us to draw any definite conclu-sions regarding which factors could be responsible forthe observed morphological differences between moundsand the surrounding matrix.
Possible impact of soil organisms on thevegetation
If soil-borne pathogens were an important factor gov-erning the abundance of these plant species in the field(where Carex arenaria grew luxuriantly on the mounds
593OIKOS 90:3 (2000)
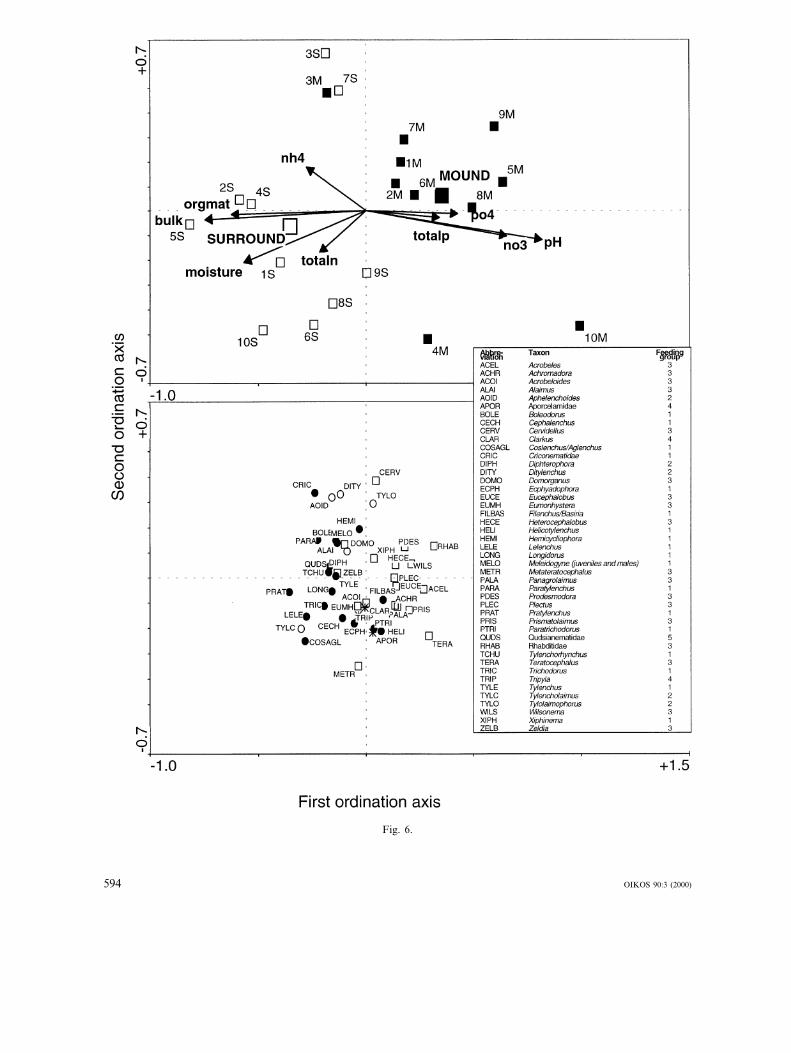
Fig. 6.
OIKOS 90:3 (2000)594
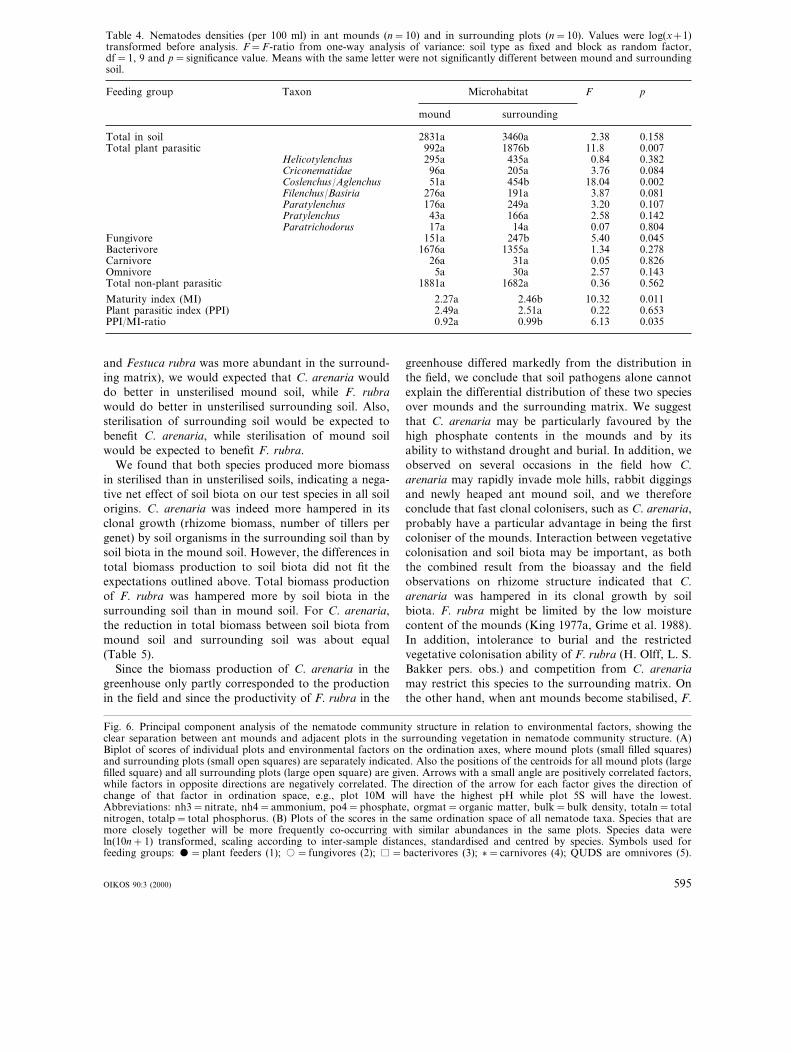
Table 4. Nematodes densities (per 100 ml) in ant mounds (n=10) and in surrounding plots (n=10). Values were log(x+1)transformed before analysis. F=F-ratio from one-way analysis of variance: soil type as fixed and block as random factor,df=1, 9 and p=significance value. Means with the same letter were not significantly different between mound and surroundingsoil.
Feeding group pTaxon Microhabitat F
mound surrounding
Total in soil 0.1582831a 3460a 2.38Total plant parasitic 992a 0.0071876b 11.8
Helicotylenchus 295a 435a 0.84 0.382Criconematidae 96a 0.084205a 3.76Coslenchus/Aglenchus 0.00251a 454b 18.04Filenchus/Basiria 276a 0.081191a 3.87Paratylenchus 0.107176a 249a 3.20Pratylenchus 43a 0.142166a 2.58Paratrichodorus 0.80417a 14a 0.07
Fungivore 151a 0.045247b 5.40Bacterivore 1676a 1355a 0.2781.34Carnivore 26a 0.82631a 0.05Omnivore 0.1435a 30a 2.57Total non-plant parasitic 0.5621881a 1682a 0.36
Maturity index (MI) 0.0112.27a 2.46b 10.32Plant parasitic index (PPI) 2.49a 0.6532.51a 0.22PPI/MI-ratio 0.0350.92a 0.99b 6.13
and Festuca rubra was more abundant in the surround-ing matrix), we would expected that C. arenaria woulddo better in unsterilised mound soil, while F. rubrawould do better in unsterilised surrounding soil. Also,sterilisation of surrounding soil would be expected tobenefit C. arenaria, while sterilisation of mound soilwould be expected to benefit F. rubra.
We found that both species produced more biomassin sterilised than in unsterilised soils, indicating a nega-tive net effect of soil biota on our test species in all soilorigins. C. arenaria was indeed more hampered in itsclonal growth (rhizome biomass, number of tillers pergenet) by soil organisms in the surrounding soil than bysoil biota in the mound soil. However, the differences intotal biomass production to soil biota did not fit theexpectations outlined above. Total biomass productionof F. rubra was hampered more by soil biota in thesurrounding soil than in mound soil. For C. arenaria,the reduction in total biomass between soil biota frommound soil and surrounding soil was about equal(Table 5).
Since the biomass production of C. arenaria in thegreenhouse only partly corresponded to the productionin the field and since the productivity of F. rubra in the
greenhouse differed markedly from the distribution inthe field, we conclude that soil pathogens alone cannotexplain the differential distribution of these two speciesover mounds and the surrounding matrix. We suggestthat C. arenaria may be particularly favoured by thehigh phosphate contents in the mounds and by itsability to withstand drought and burial. In addition, weobserved on several occasions in the field how C.arenaria may rapidly invade mole hills, rabbit diggingsand newly heaped ant mound soil, and we thereforeconclude that fast clonal colonisers, such as C. arenaria,probably have a particular advantage in being the firstcoloniser of the mounds. Interaction between vegetativecolonisation and soil biota may be important, as boththe combined result from the bioassay and the fieldobservations on rhizome structure indicated that C.arenaria was hampered in its clonal growth by soilbiota. F. rubra might be limited by the low moisturecontent of the mounds (King 1977a, Grime et al. 1988).In addition, intolerance to burial and the restrictedvegetative colonisation ability of F. rubra (H. Olff, L. S.Bakker pers. obs.) and competition from C. arenariamay restrict this species to the surrounding matrix. Onthe other hand, when ant mounds become stabilised, F.
Fig. 6. Principal component analysis of the nematode community structure in relation to environmental factors, showing theclear separation between ant mounds and adjacent plots in the surrounding vegetation in nematode community structure. (A)Biplot of scores of individual plots and environmental factors on the ordination axes, where mound plots (small filled squares)and surrounding plots (small open squares) are separately indicated. Also the positions of the centroids for all mound plots (largefilled square) and all surrounding plots (large open square) are given. Arrows with a small angle are positively correlated factors,while factors in opposite directions are negatively correlated. The direction of the arrow for each factor gives the direction ofchange of that factor in ordination space, e.g., plot 10M will have the highest pH while plot 5S will have the lowest.Abbreviations: nh3=nitrate, nh4=ammonium, po4=phosphate, orgmat=organic matter, bulk=bulk density, totaln= totalnitrogen, totalp= total phosphorus. (B) Plots of the scores in the same ordination space of all nematode taxa. Species that aremore closely together will be more frequently co-occurring with similar abundances in the same plots. Species data wereln(10n+1) transformed, scaling according to inter-sample distances, standardised and centred by species. Symbols used forfeeding groups: =plant feeders (1); �= fungivores (2); =bacterivores (3); �=carnivores (4); QUDS are omnivores (5).
OIKOS 90:3 (2000) 595
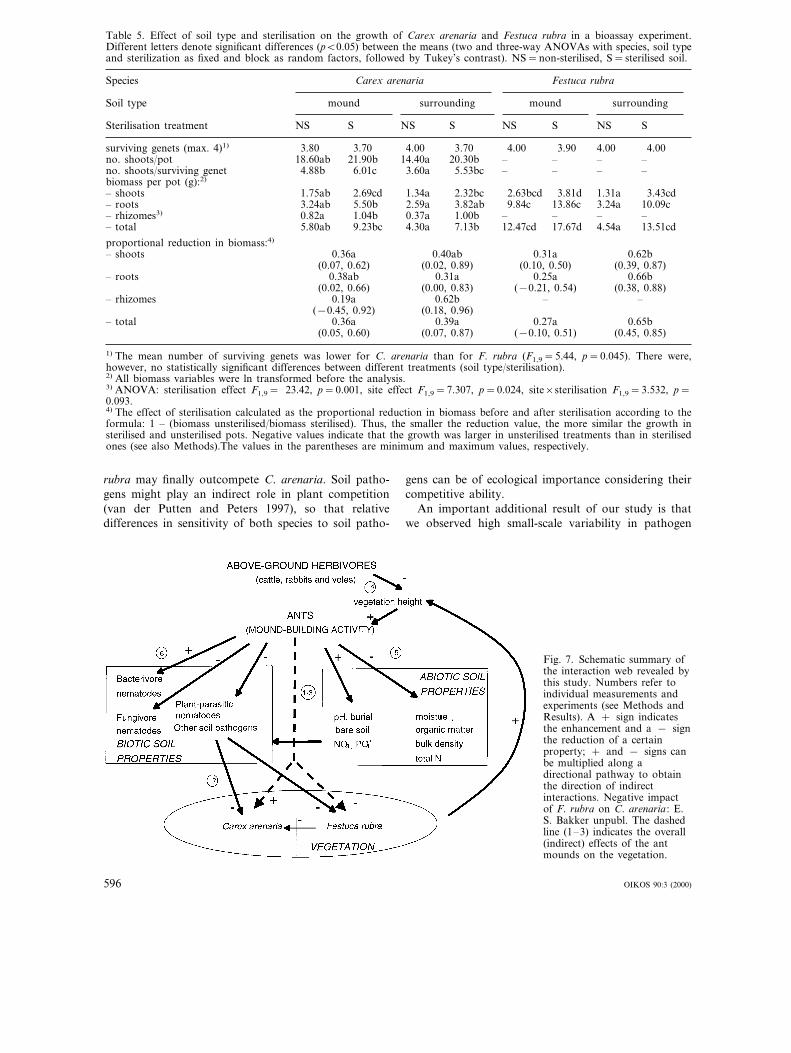
Table 5. Effect of soil type and sterilisation on the growth of Carex arenaria and Festuca rubra in a bioassay experiment.Different letters denote significant differences (pB0.05) between the means (two and three-way ANOVAs with species, soil typeand sterilization as fixed and block as random factors, followed by Tukey’s contrast). NS=non-sterilised, S=sterilised soil.
Species Carex arenaria Festuca rubra
mound surrounding mound surroundingSoil type
S NS S NS SSterilisation treatment NS S NS
4.003.904.003.704.00 4.003.703.80surviving genets (max. 4)1)
20.30b – – – –no. shoots/pot 18.60ab 21.90b 14.40a5.53bc – – – –no. shoots/surviving genet 4.88b 6.01c 3.60a
biomass per pot (g):2)
3.81d2.63bcd2.32bc1.34a2.69cd 1.31a1.75ab– shoots 3.43cd13.86c 10.09c3.24a– roots 3.24ab 5.50b 2.59a 3.82ab 9.84c– ––– rhizomes3) 0.82a 1.04b 0.37a 1.00b –
7.13b 12.47cd 17.67d 4.54a– total 13.51cd5.80ab 9.23bc 4.30a
proportional reduction in biomass:4)
0.36a 0.62b0.31a0.40ab– shoots(0.07, 0.62) (0.02, 0.89) (0.10, 0.50) (0.39, 0.87)
– roots 0.38ab 0.31a 0.25a 0.66b(0.38, 0.88)(−0.21, 0.54)(0.00, 0.83)(0.02, 0.66)
0.19a –– rhizomes –0.62b(−0.45, 0.92) (0.18, 0.96)
0.27a– total 0.36a 0.65b0.39a(−0.10, 0.51)(0.07, 0.87)(0.05, 0.60) (0.45, 0.85)
1) The mean number of surviving genets was lower for C. arenaria than for F. rubra (F1,9=5.44, p=0.045). There were,however, no statistically significant differences between different treatments (soil type/sterilisation).2) All biomass variables were ln transformed before the analysis.3) ANOVA: sterilisation effect F1,9= 23.42, p=0.001, site effect F1,9=7.307, p=0.024, site×sterilisation F1,9=3.532, p=0.093.4) The effect of sterilisation calculated as the proportional reduction in biomass before and after sterilisation according to theformula: 1 – (biomass unsterilised/biomass sterilised). Thus, the smaller the reduction value, the more similar the growth insterilised and unsterilised pots. Negative values indicate that the growth was larger in unsterilised treatments than in sterilisedones (see also Methods).The values in the parentheses are minimum and maximum values, respectively.
rubra may finally outcompete C. arenaria. Soil patho-gens might play an indirect role in plant competition(van der Putten and Peters 1997), so that relativedifferences in sensitivity of both species to soil patho-
gens can be of ecological importance considering theircompetitive ability.
An important additional result of our study is thatwe observed high small-scale variability in pathogen
Fig. 7. Schematic summary ofthe interaction web revealed bythis study. Numbers refer toindividual measurements andexperiments (see Methods andResults). A + sign indicatesthe enhancement and a − signthe reduction of a certainproperty; + and − signs canbe multiplied along adirectional pathway to obtainthe direction of indirectinteractions. Negative impactof F. rubra on C. arenaria : E.S. Bakker unpubl. The dashedline (1–3) indicates the overall(indirect) effects of the antmounds on the vegetation.
596 OIKOS 90:3 (2000)
densities within each microhabitat. Also in the sur-rounding matrix, soil from some spots reduced plantgrowth in the greenhouse experiment much more thansoil from other spots (see the large difference betweenmaximum and minimum growth reduction values inTable 5). As a consequence, a mosaic of favourable andunfavourable patches apparently seems to exists withinthe two micro-habitats, which may lead to local tempo-rary refugia for either Carex arenaria, Festuca rubra orboth species.
Conclusion
We found evidence of the existence of complex directand indirect interactions in grassland ecosystems thatmay contribute to the formation of small-scale spatialmosaics in plant community composition. Mound-building ants are a likely key component in this web,which involves organisms at different trophic levels. Inaddition, ants may be crucial in linking above- andbelowground functional groups of herbivores. The ulti-mate effect of these interactions is the formation of aspatially heterogeneous mosaic of favourable and unfa-vourable patches, locally favouring some plant specieswhile restricting others. Knowledge on this process ofdirect and indirect trophic linkages may be essential tounderstand patterns in biodiversity and spatial struc-ture in grassland communities.
Acknowledgements – We are grateful to R. G. M. de Goede,D. G. Milchunas, W. Fortelius and H. de Kroon for com-ments on an earlier draft of the manuscript and to Hannie vanMegen, Liesbeth Bakker, Maurits Gleichman, Roel Lemmensand Jan van Walsem for practical and technical help. Inaddition, we thank the National Forest Service (Staatsbosbe-heer) for granting permission to work in the nature reservearea. Milena Blomqvist was supported by a Leonardo grantfrom the European Union. Han Olff was supported by theNetherlands Organization for Scientific Research (NWO).
ReferencesBakker, J. P. 1989. Nature management by grazing and cut-
ting. – Kluwer.Bardgett, R. D., Wardle, D. A. and Yeates, G. W. 1998.
Linking above-ground and below-ground interactions: howplant responses to foliar herbivory influence soil organisms.– Soil Biol. Biochem. 30: 1867–1878.
Berg, G., Esselink, P., Groeneweg, M. and Kiehl, K. 1997.Micropatterns of Festuca rubra dominated salt-marsh vege-tation induced by sheep grazing. – Plant Ecol. 132: 1–14.
Bever, J. D. 1994. Feedback between plants and their soilcommunities in an old field community. – Ecology 75:1965–1977.
Bever, J. D., Westover, K. M. and Antonovics, J. 1997.Incorporating the soil community into plant populationdynamics: the utility of the feedback approach. – J. Ecol.85: 561–573.
Bongers, T. 1990. The maturity index: an ecological measureof environmental disturbance based on nematode speciescomposition. – Oecologia 83: 14–19.
Bongers, T., van der Meulen, H. and Korthals, G. 1997.Inverse relationship between the nematode maturity indexand plant-parasite index under enriched nutrient condi-tions. – Appl. Soil Ecol. 6: 195–199.
Brown, V. K. and Gange, A. C. 1990. Insect herbivory belowground. – Adv. Ecol. Res. 20: 1–58.
Caldwell, M. M., Manwaring, J. H. and Durham, S. L. 1996.Species interaction at the level of fine roots in the field:influence of soil nutrient heterogeneity and plant size. –Oecologia 106: 440–447.
Carlsson, B. A, . and Callaghan, T. V. 1990. Programmed tillerdifferentiation, intraclonal density regulation and nutrientdynamics in Carex bigelowii. – Oikos 58: 219–230.
de Goede, R. G., Vershoor, B. C. and Georgieva, S. S. 1993.Nematode distribution, trophic structure and biomass in aprimary succession of blown-out areas in a drift sandlandscape. – Fundamental Appl. Nematol. 16: 525–538.
D’Hertefeldt, T. and van der Putten, W. H. 1998. Physiologi-cal interaction of the clonal plant Carex arenaria and itsresponse to soil-borne pathogens. – Oikos 81: 229–237.
D’Hertefeldt, T. and Jonsdottir, I. S. 1999. Extensive physio-logical integration in intact clonal systems like Carex are-naria. – J. Ecol. 87: 258–264.
de Kroon, H. and Knops, J. 1990. Habitat explorationthrough morphological plasticity in two chalk grasslandperennials. – Oikos 59: 39–49.
de Kroon, H. and Hutchings, M. J. 1995. Morphologicalplasticity in clonal plants: the foraging concept reconsid-ered. – J. Ecol. 83: 143–152.
de Rooij-van der Goes, P. C. E. M., van Dijk, C., van derPutten, W. H. and Jungerius, P. D. 1997. Effects of sandmovement by wind on nematodes and soil-borne fungi incoastal foredunes. – J. Coastal Conserv. 3: 133–142.
Dean, W. R. J., Milton, S. J. and Klotz, S. 1997. The role ofant nest-mounds in maintaining small-scale patchiness indry grasslands in Central Germany. – Biodiv. Conserv. 6:1293–1307.
Dlussky, G. M. 1981. Nester von Lasius fla6us (Hymenoptera,Formicidae). – Pedobiologia 21: 81–99.
Dobson, M. J. and Crawley, M. 1994. Pathogens and thestructure of plant communities. – Trends Ecol. Evol. 9:393–398.
Dong, M., During, H. J. and Werger, M. J. A. 1996. Morpho-logical responses to nutrient availability in four clonalherbs. – Vegetatio 123: 183–192.
Drees, B. M., Miller, R. W., Vinson, S. B. and Georgis, R.1992. Susceptibility and behavioral response of red im-ported fire ant (Hymenoptera: Formicidae) to selectedentomogenous nematodes (Rhabditida: Steinernematidae& Heterorhabditidae). – J. Econ. Entomol. 85: 365–370.
George, E., Seith, B., Schaeffer, C. and Marschner, H. 1997.Responses of Picea, Pinus and Pseudotsuga roots to hetero-geneous nutrient distribution in soil. – Tree Physiol. 17:39–45.
Grime, J. P., Hodgson, J. G. and Hunt, R. 1988. Comparativeplant ecology: a functional approach to common Britishspecies. – Unwin Hyman.
Grubb, P. J. 1977. The maintenance of species richness inplant communities: the importance of the regenerationniche. – Biol. Rev. 52: 107–145.
Herben, T., Krahulec, F., Hadincova, V. and Kovarova, M.1993. Small-scale spatial dynamics of plant species in agrassland community over six years. – J. Veg. Sci. 4:171–178.
Hill, M. O. 1979. DECORANA – A FORTRAN program fordetrended correspondence analysis and reciprocal averag-ing. – Cornell Univ., Ithaca.
Huber-Sannwald, E., Pyke, D. A., Caldwell, M. M. andDurham, S. 1998. Effects of nutrient patches and rootsystems on the clonal plasticity of a rhizomatous grass. –Ecology 79: 2267–2280.
Kermarrec, A. 1975. Etude des relations synecologiques entreles nematodes et la fourmi-maniok: Acromyrmex oc-tospinosus Reich. – Ann. Zool. Ecol. Anim. 7: 27–44.
OIKOS 90:3 (2000) 597
King, T. J. 1977a. The plant ecology of ant-hills in calcareousgrasslands 1. Patterns of species in relation to ant-hills insouthern England. – J. Ecol. 65: 235–256.
King, T. J. 1977b. The plant ecology of ant-hills in calcareousgrasslands 2. Succession on the mounds. – J. Ecol. 65:257–278.
King, T. J. 1977c. The plant ecology of ant-hills in calcareousgrasslands 3. Factors affecting the population sizes ofselected species. – J. Ecol. 65: 279–315.
King, T. J. 1981. Ant-hill vegetation in acidic grasslands in theGower peninsula, South Wales. – New Phytol. 88: 559–571.
Knapp, A. K., Blair, J. M., Briggs, J. M. et al. 1999. Thekeystone role of bison in North American tallgrass prairie.– BioScience 49: 39–50.
Louda, S. M., Keeler, K. H. and Holt, R. D. 1990. Her-bivore influence on plant performance and competitiveinteractions. – In: Grace, J. B. and Tilman, D. (eds),Perspectives on plant competition. Academic Press, pp.413–444.
McGinley, M. A., Dhillion, S. S. and Neumann, J. C. 1994.Environmental heterogeneity and seedling establishment– ant plant microbe interactions. – Funct. Ecol. 8: 607–615.
Milchunas, D. G., Lauenroth, W. K. and Burke, I. C. 1998.Livestock grazing: animal and plant biodiversity of short-grass steppe and the relationship to ecosystem function. –Oikos 83: 65–74.
Mills, K. E. and Bever, J. D. 1998. Maintenance of diversitywithin plant communities: soil pathogens as agents ofnegative feedback. – Ecology 79: 1595–1601.
Mortimer, S. R., van der Putten, W. H. and Brown, V. K.1999. Insect and nematode herbivory under ground: inter-actions and role in vegetation succession. – In: Olff, H.,Brown, V. K. and Drent, R. H. (eds), Herbivores: betweenplants and predators. Blackwell Science, pp. 205–238.
Noble, J. C. and Marshall, C. 1983. The population biology ofplants with clonal growth II. The nutrient strategy andmodular physiology of Carex arenaria. – J. Ecol. 71:865–877.
Noble, J. C., Bell, A. D. and Harper, J. L. 1979. The popula-tion biology of plants with clonal growth I. The morphol-ogy and structural demography of Carex arenaria. – J.Ecol. 71: 865–877.
Olff, H. and Ritchie, M. E. 1998. Effects of herbivores ongrassland plant diversity. – Trends Ecol. Evol. 13: 261–265.
Olff, H., Vera, F. W. M., Bokdam, J. et al. 1999. Associationalresistance of plants to herbivory may lead to shiftingmosaics in grazed woodlands. – Plant Biol. 1: 127–137.
Oostenbrink, M. 1960. Estimating nematode populations bysome selected methods. – In: Sasser, J. M. and Jenkins, W.R. (eds), Nematology. Univ. of North Carolina Press,Chapel Hill, NC, pp. 85–102.
Pontin, A. J. 1963. Further considerations of competition andthe ecology of the ants Lasius fla6us (F.) and L. niger (L.).– J. Anim. Ecol. 32: 565–574.
Pontin, A. J. 1978. The numbers and distribution of subter-ranean aphids and their exploitation by the ant Lasiusfla6us (Fabr.). – Ecol. Entomol. 3: 203–207.
Ritchie, M. E. and Olff, H. 1999. Spatial scaling laws yield asynthetic theory of biodiversity. – Nature 400: 557–560.
Schreiber, K.-F. 1969. Beobachtungen uber die Entstehungvon ‘‘Buckelweiden’’ auf den Hochflachen des SchweizerJura. – Erdkunde 23: 280–290.
Stanton, N. L. 1988. The underground in grasslands. – Annu.Rev. Ecol. Syst. 19: 573–589.
Stoll, P., Egli, P. and Schmid, B. 1998. Plant foraging andrhizome growth patterns of Solidago altissima in responseto mowing and fertilizer application. – J. Ecol. 86: 341–354.
Strong, D. R. 1999. Predator control in terrestrial ecosystems:the underground chain of bush lupine. – In: Olff, J.,Brown, V. K. and Drent, R. H. (eds), Herbivores: betweenplants and predators. Blackwell Science, pp. 577–602.
ter Braak, C. J. F. 1995. Ordination. – In: Jongman, R. H. G.,ter Braak, C. J. F. and van Tongeren, O. F. R. (eds), Dataanalysis in community and landscape ecology. CambridgeUniv. Press, pp. 91–173.
Tietema, T. 1981. Ecophysiology of the sand sedge, Carexarenaria L. – PhD thesis, Univ. of Utrecht.
Tilman, D. 1994. Competition and biodiversity in spatiallystructured habitats. – Ecology 75: 2–16.
van der Putten, W. H. and Peters, B. A. M. 1997. Howsoil-borne pathogens may affect plant competition. – Ecol-ogy 78: 1785–1795.
van der Putten, W. H. and van der Stoel, C. D. 1998. Plantparasitic nematodes and spatio-temporal variation in natu-ral vegetation. – Appl. Soil Ecol. 10: 253–262.
van der Putten, W. H., van Dijk, C. and Troelstra, S. R. 1988.Biotic soil factors affecting the growth and development ofAmmophila arenaria. – Oecologia 76: 313–320.
van der Putten, W. H., van Dijk, C. and Peters, B. A. M. 1993.Plant-specific soil-borne diseases contribute to successionin foredune vegetation. – Nature 362: 53–55.
Way, M. J. 1963. Mutualism between ants and honeydewproducing Homoptera. – Annu. Rev. Entomol. 8: 307–344.
Wells, T. C. E., Sheail, J., Ball, D. F. and Ward, L. K. 1976.Ecological studies on the Porton Ranges: relationshipsbetween vegetation, soils and land-use history. – J. Ecol.64: 589–626.
Woodell, S. R. J. and King, T. J. 1991. The influence ofmound-building ants on British lowland vegetation. – In:Huxley, C. R. and Cutler, D. F. (eds), Ant-plant interac-tions. Oxford Univ. Press, pp. 521–535.
Wootton, J. T. 1994. The nature and consequences of indirecteffects in ecological communities. – Annu. Rev. Ecol. Syst.25: 443–466.
Yeates, G. 1987. How plants affect nematodes. – Adv. Ecol.Res. 17: 61–113.
Yeates, G. W., Bongers, T., de Goede, R. G. M. et al. 1993.Feeding habits in soil nematode families and genera – anoutline for soil ecologists. – J. Nematol. 25: 315–331.
598 OIKOS 90:3 (2000)