living apart together - waddenacademie...living apart together interactions between aboveground...
TRANSCRIPT

Living apart togetherInteractions between aboveground grazers,
plants and soil biota

Lay-out and figures: Dick VisserCover: Ciska Veen and Dick VisserPhotos: Ciska Veen, p. 138 Grant Hopcraft, p. 172 Aniek IvensPrinted by: Van Denderen BV, Groningen
ISBN: 978-90-367-4851-3 ISBN: 978-90-367-4852-0 (digital version)
The research for this thesis was carried out in the Community and ConservationEcology Group at the Centre for Ecological and Evolutionary Studies (CEES) ofthe University of Groningen, The Netherlands. The research was conducted incooperation with the Terrestrial Ecology Group at the Netherlands Institute ofEcology (NIOO), The Netherlands.

RIJKSUNIVERSITEIT GRONINGEN
Living apart togetherInteractions between aboveground grazers,
plants and soil biota
Proefschrift
ter verkrijging van het doctoraat in deWiskunde en Natuurwetenschappenaan de Rijksuniversiteit Groningen
op gezag van de Rector Magnificus, dr. E. Sterken,in het openbaar te verdedigen op
vrijdag 29 april 2011om 14.45 uur
door
Geertje Franciska Veen
geboren op 20 maart 1981te Apeldoorn

Promotores: Prof. dr. H. OlffProf. dr. ir. W.H. van der Putten
Beoordelingscommissie: Prof. dr. R.D. BardgettProf. dr. H. de KroonProf. dr. P.C. de Ruiter

Contents
Chapter 1 Introduction 6
Chapter 2 Vertebrate herbivores influence soil nematodes by 15modifying plant communities
Chapter 3 Plant-soil feedback and the coexistence of competing plants 29
Chapter 4 Large vertebrate herbivores overrule negative plant-soil feedback 55effects and stabilize spatiotemporal composition of plant communities
Chapter 5 Interactive effects of soil-dwelling ants (Lasius flavus) and aboveground 73vertebrate grazers on the local plant community composition ofa floodplain grassland
Chapter 6 Small-scale plant community composition affected by interactions between 89above- and belowground organisms that operate on different spatial scales
Chapter 7 Contrasting effects of large herbivores on nitrogen mineralization across 105ecosystems: integrating effects of soil physical properties
Chapter 8 General discussion 119
References 139
Summary / Samenvatting 153
Acknowledgements 167
List of publications 173
Addresses of co-authors 174
Curriculum Vitae 175

Cha
pter
on
e

Introduction
1

Aboveground-belowground interactions
Terrestrial ecosystems consist of aboveground and belowground subsystems thatdiffer vastly in physical structure. The aboveground world is open and containsmainly air, while the belowground one consists of a matrix of soil particles andpores filled with water or air. This has major consequences for the mobility oforganisms living aboveground and belowground. Aboveground organisms mayexplore areas of several kilometers within a day, whereas most soil organisms areconstrained to areas of millimeters to centimeters in their whole lifetime andmostly stay in the vicinity of an individual plant (Mortimer et al. 1999, van derPutten et al. 2009).
Despite these large differences in scale, medium and mobility, aboveground andbelowground organisms interact because they are connected by plants that positiontheir functionally linked organs in both aboveground and belowground worlds andmediate flows or carbon, nutrients and energy between them (Bardgett and Wardle2003, Wardle et al. 2004). Plants provide organic carbon for decomposer organisms,as well as resources for root and shoot herbivores, pathogens and symbiotic mutu-alists. In turn, these aboveground and belowground organisms influence plantperformance and plant community composition via direct removal of plant mate-rial, by enhancing access to limiting resources, and by altering soil nutrient cycling.As a result, both aboveground and belowground organisms can be importantdrivers of plant community composition, structure and diversity (e.g. Grime et al.1987, Crawley 1989, Huntly 1991, Milchunas and Lauenroth 1993, Olff and Ritchie1998, van der Putten and van der Stoel 1998, van der Heijden et al. 1998b,Klironomos 2002, Wardle 2002, De Deyn et al. 2003, Bardgett and Wardle 2010).Moreover, by affecting plants aboveground and belowground organisms influenceeach others performance as well (e.g. Gange and Brown 1989, Masters and Brown1992, Masters et al. 1993, Masters et al. 2001, Bezemer et al. 2003, Soler et al. 2005,Soler et al. 2007). As a result, interactions between aboveground and belowgroundsubsystems will have major consequences for community structure and ecosystemfunctioning in terrestrial systems (Wardle et al. 2004, van der Putten et al. 2009).
Only few studies have investigated how aboveground-belowground interactionsaffected mixed plant communities (Brown and Gange 1989, Brown and Gange 1992,van Ruijven et al. 2005, Ilmarinen and Mikola 2009). These studies mainly focusedon effects of invertebrate aboveground and belowground organisms. How verte-brate aboveground grazers and soil organisms interact to drive plant communitystructure and ecosystem processes is still poorly understood. Therefore, in thisthesis I focus on consequences of interactions between aboveground vertebrateherbivores and soil organisms for plant community structure and composition.
8 Chapter 1

Aboveground vertebrate herbivores
Aboveground vertebrate grazers are identified as key determinants of communitycomposition and functioning of grassland systems worldwide (Olff and Ritchie1998, Knapp et al. 1999). Aboveground vertebrate herbivores affect plant commu-nity composition and ecosystem functioning via different pathways. Firstly theyremove aboveground biomass, which alters competitive interactions between plantspecies (Olff et al. 1997, Knapp et al. 1999). Secondly they alter the quality andquantity of nutrient input into the soil by changing root exudation patterns, litterquantity and quality, and the return of excreta (Bardgett and Wardle 2003). Finallythey affect the plant community and soil biotic and abiotic properties physically,for example, via trampling (Hobbs 1996, Knapp et al. 1999).
Depending on the scale of observation, herbivore size and ecosystem produc-tivity, aboveground vertebrate herbivores have contrasting effects on plant commu-nity structure and diversity. In productive grasslands, vegetation patches createdby vertebrate herbivores harbor a higher plant community diversity than ungrazedpatches, because the removal of foliar biomass by herbivores will often relax thecompetition for light between plant species (Bengtsson et al. 1994, Olff et al. 1997).This promotes subdominants to become more abundant which generally results inan increase in local plant community diversity (Collins et al. 1998, Knapp et al.1999, Bos et al. 2002, Bakker et al. 2003, Veen et al. 2008). Moreover, vertebratesincrease colonization possibilities by transporting seeds and disturbing soil (Olffand Ritchie 1998, Bakker and Olff 2003, Ozinga et al. 2009). In contrast, in unpro-ductive habitats, plants not always recover from grazing which leads to lowerdiversity (Proulx and Mazumder 1998). This can lead to a decrease in the localspecies pool and may reduce colonization possibilities for plants (Milchunas andLauenroth 1993, Olff and Ritchie 1998).
The body size of herbivores is also an important determinant of herbivoreeffects on the plant community. Digestive capabilities of herbivores increase withbody size. Therefore, small herbivores need to select for high quality food whilelarge vertebrate herbivores are dependent on high amounts of food, but can processrelatively low quality food (Demment and Van Soest 1985, Hopcraft et al. 2010).Consequently, larger vertebrate herbivores make foraging decisions on a coarsergrain (Ritchie and Olff 1999, Cromsigt and Olff 2006, Laca et al. 2010) and thereforetend to create more coarse-grained spatiotemporal patterns in the vegetation aswell (Bakker 2003, Cromsigt and Olff 2008). Still, large herbivores are able to createsmall-scale plant community patches (Veen et al. 2008), for example through theselective removal of plant species, revisitation of grazed patches with enhancedfood quality (Bakker et al. 1983), and patchy distribution of dung and urine(Steinauer and Collins 1995).
9Introduction

Plant-soil feedback
Effects of soil organisms on plants and plant communities can be understood by theconcept of plant-soil feedback. This is a two-step process where plant speciesmodify their soil biotic and abiotic environment (Bever et al. 1997, Yeates 1999),which in turn influences subsequent plant growth and the competitive ability ofplant species (van der Putten and Peters 1997, Bever 2003, Wardle et al. 2004,Ehrenfeld et al. 2005, Manning et al. 2008). The biotic component of plant-soil feed-back operates through direct, as well as indirect effects of soil organisms on plantgrowth (Wardle et al. 2004). Root herbivores, pathogens and symbiotic mutualistsuse and provide resources from plant tissues thereby directly affecting plants.Decomposer organisms drive soil nutrient cycling by converting organic materialinto inorganic nutrients, thereby regulating soil nutrient supply and, indirectly,growth of plants.
Plant-soil feedback effects can be highly species specific, particularly as a resultof specific associations between plant species and soil organisms (van der Putten etal. 1993). It may range from positive to negative, depending on the balance betweenbeneficial and parasitic interactions. On the one hand, symbiotic mutualists, suchas some mycorrhizal fungi and rhizosphere bacteria, enhance the access of plants tolimiting resources (van der Heijden et al. 2006). On the other hand, root herbivoresand pathogens, such as plant-feeding nematodes, directly remove nutrients fromplant tissues and reduce the capability of plants to take up soil nutrients, therebyreducing plant growth and competitive ability (van der Putten and Peters 1997).
Plant-soil feedback may enhance or reduce plant community diversity. Positiveinteractions between plants and symbiotic mutualists can promote seedling estab-lishment (van der Heijden 2004). In general however, plant species that experiencestrong positive plant-soil feedback have been shown to outcompete other plantspecies (Klironomos 2002, Callaway et al. 2004), which reduces plant communitydiversity (Hartnett and Wilson 1999, Bever 2003) and enhances stability (Revilla2009). In contrast, negative interactions reduce competitive exclusion (van derPutten and Peters 1997). A reduction in the competitive abilities of plants can stim-ulate replacement of plant species in space and time, which may result in increasedcoexistence, diversity and dynamics in the plant community (Olff et al. 2000, vander Putten 2003, Bever 2003, Kulmatiski et al. 2008, Revilla 2009).
Aboveground and belowground scale of operation
Effects of the various aboveground vertebrate herbivores and soil organisms takeplace at different spatial and temporal scales due to limited mobility belowgroundand less restrictions aboveground. This will have an important effect on the conse-
10 Chapter 1

quences of interactions between vertebrate herbivores and soil organisms for plantcommunity structure and composition (van der Putten et al. 2009). Previous workshowed that aboveground and belowground herbivores that use the same indi-vidual plant can influence each others performance (e.g. Gange and Brown 1989,Masters and Brown 1992, Masters et al. 1993, Masters et al. 2001, Bezemer et al.2003, Soler et al. 2005, Soler et al. 2007). However, aboveground vertebrate herbi-vores that operate across much larger scales than many soil organisms may not beable to respond to changes at the level of an individual plant, for example resultingfrom interactions with soil organisms. In that situation aboveground vertebrateherbivores may be expected to overrule or modify belowground effects on the plantcommunity.
Aim of this thesis
The main objective of this thesis is to explore how aboveground vertebrate herbi-vores and soil organisms interact to drive plant community composition, structureand diversity. I aim to understand the potential of soil organisms to drive plantcommunity dynamics and ecosystem processes in grazed grasslands. In particular Iaddress (1) via which pathways aboveground vertebrate herbivores modify soilcommunity composition, (2) how soil organisms in turn can drive plant communitycomposition and dynamics, (3) how soil organisms drive plant community structureand dynamics in the presence and absence of vertebrate herbivores, (4) how differ-ences in scale of operation of aboveground herbivores affect the outcome of above-ground-belowground interactions and (5) how large vertebrate herbivores affectsoil nutrient cycling.
Thesis outline
I start with examining the effects of cattle (Bos taurus) on soil community composi-tion (chapter 2). I use a long-term exclosure experiment to investigate if cattlegrazing changes species composition, functional group composition and diversity inthe nematode community of a river floodplain grassland. In a structural equationmodel I combine data on nematode community composition, plant communitycomposition and soil abiotic properties to explore via which pathway cattle modifythe soil community.
In turn, changes in soil community composition and structure may feed back tochange plant community composition and dynamics (chapter 3). I use a modelingapproach to study how plant-soil interactions drive plant community dynamics andstructure. I use an existing model describing plant-soil feedback effects (Bever
11Introduction

2003) and perform a detailed analysis on all possible interactions between plantsand soil organisms. Results from the analysis are used to interpret how soil organ-isms drive plant community dynamics and to discuss their possibility to enhance orreduce plant community diversity.
In chapters 4, 5 and 6 I study how the interactions between vertebrate herbi-vores and soil organisms influence plant community patterns in time and space. Iexplore the potential of soil organisms to drive spatiotemporal plant communitydynamics in the absence and presence of cattle (chapter 4). Cattle operate on a land-scape scale, whereas soil organisms act on the scale of an individual plant. Conse-quently, cattle may determine large-scale plant community patterns, therebyaltering the possibilities for soil organisms to affect plant community dynamics. Iuse a combination of a greenhouse and a field exclosure experiment to determinethe potential of soil organisms to affect plant community dynamics and to investi-gate plant community dynamics in different grazing regimes respectively. Inchapter 5 I study the interaction between aboveground grazers and soil organismsin more detail. In a full factorial greenhouse experiment I investigate how simu-lated grazing, presence of mounds of yellow meadow ants (Lasius flavus), and theactual presence of yellow meadow ants themselves affect plant community struc-ture and composition. In this greenhouse experiment aboveground clipping wasnon-selective to imitate cattle grazing. However, in the field different-sized above-ground vertebrate herbivores that are more or less selective co-occur. The degree ofselectivity, i.e. the scale of operation, of aboveground herbivores is expected toaffect the outcome of aboveground-belowground interactions. Therefore, to followup on the greenhouse experiment I study interactions between yellow meadow antsand different-sized aboveground vertebrate herbivores in the field (chapter 6). In afield experiment on the salt marsh of Schiermonnikoog I investigate plant commu-nity patches on mounds of subterranean yellow meadow ants (Lasius flavus) in thepresence of European brown hares (Lepus europaeus; small aboveground herbi-vores) and cattle (large aboveground herbivores).
Aboveground and belowground organisms interact via direct interactions withplant species (e.g. through consumption of living biomass) and via indirect path-ways (e.g. by affecting the soil decomposer food web and hence soil nutrientcycling). Soil nutrient cycling has been indicated as an important pathway viawhich large vertebrate herbivores and soil organisms interact (Bardgett and Wardle2003). Large herbivores have been shown to enhance or slow down nutrient cyclingby affecting the quality and quantity of resources (e.g. litter, herbivore excreta)entering the soil food web. However, contrasting effects of vertebrate herbivores onsoil nutrient cycling are not always satisfactorily explained by changes in resourceinput into the soil. In chapter 7 I use a literature review combined with empiricalexamples which shows that incorporating effects of vertebrate herbivores on soilphysical conditions into existing theories on nutrient cycling in grasslands will help
12 Chapter 1

us to better understand when herbivores speed up or slow down soil nutrientcycling.
In chapter 8 I synthesize the findings of this thesis. I first discuss direct andindirect pathways via which aboveground and belowground organisms interact.Then, I look at the consequences of aboveground-belowground interactions forplant community structure and composition, thereby particularly regarding effectsof differences in the scale of operation between aboveground and belowgroundorganisms. Finally, I indicate future challenges in aboveground-belowgroundresearch.
13Introduction

Cha
pter
tw
o

Vertebrate herbivores influence soilnematodes by modifying plant communities
Published in Ecology (2010) 91: 828-835
G.F. (Ciska) Veen, Han Olff, Henk Duyts, Wim H. van der Putten
2

Abiotic soil properties, plant community composition and herbivory all havebeen reported as important factors influencing the composition of soilcommunities. However, most studies thus far considered these factors inisolation, whereas they strongly interact in the field. Here, we study howgrazing by vertebrate herbivores influences the soil nematode communitycomposition of a floodplain grassland while accounting for effects of grazingon plant community composition and abiotic soil properties. Nematodes arethe most ubiquitous invertebrates in the soil. They include a variety offeeding types ranging from microbial feeders to herbivores and carnivoresand they perform key functions in soil food webs.
Our hypothesis was that grazing affects nematode community structureand composition through altering plant community structure and composi-tion. Alternatively, we tested whether the effects of grazing may, directly orindirectly, run via changes in soil abiotic properties. We used a long-termfield experiment containing plots with and without vertebrate grazers(cattle and rabbits). We compared plant and nematode community structureand composition, as well as a number of key soil abiotic properties andapplied structural equation modeling to investigate four possible pathwaysvia which grazing may change nematode community composition.
Aboveground grazing increased plant species richness and reduced bothplant and nematode community heterogeneity. There was a positive rela-tionship between plant and nematode diversity indices. Grazing decreasedthe number of bacterial feeding nematodes, indicating that in these grass-lands top-down control of plant production by grazing leads to bottom-upcontrol in the basal part of the bacterial channel of the soil food web.
According to the structural equation model, grazing had a strong effect onsoil abiotic properties and plant community composition, whereas plantcommunity composition was the main determinant of nematode communitycomposition. Other pathways, which assumed that grazing influenced nema-tode community composition by inducing changes in soil abiotic properties,did not explain variation in nematode community composition significantly. We conclude that grazing-induced changes in nematode community compo-sition mainly operated via changes in plant community composition. Influ-ences of vertebrate grazers on soil nematodes through modification ofabiotic soil properties were of less importance.
Abstract

Introduction
Grazing by aboveground vertebrate herbivores, abiotic soil properties and plantcommunity composition all have been reported to determine soil communitycomposition, function and diversity (see e.g. Stanton 1988, Yeates 1999, Wardle2002, Bardgett 2005). Most studies have considered the effects of herbivores (e.g.Wall-Freckman and Huang 1998, Guitian and Bardgett 2000, Mikola et al. 2001),plant species (e.g. Salamon et al. 2004, De Deyn et al. 2004b, Viketoft et al. 2005),and soil abiotic properties (e.g. Sarathchandra et al. 2001, Housman et al. 2007) onsoil biota independently, while their interactions have been rarely examined. One ofthe major complications in unraveling the individual effects and their interactionsis that effects of grazing, soil abiotic properties and plant community compositionare not independent. Therefore, it is still poorly understood whether effects ofgrazing on soil communities operate via plant community changes (e.g. Bardgett etal. 1998, Wardle et al. 2001, Bardgett and Wardle 2003) or altered soil abiotic prop-erties (e.g. Bazot et al. 2005). Previous studies on determinants of soil communitycomposition were carried out under controlled experimental conditions, i.e.common garden or pot experiments (e.g. Wardle et al. 1999, De Deyn et al. 2004b,Viketoft 2008), while little is known about field situations (Casper and Castelli2007).
The aim of our study was to examine if grazing effects on soil biota operatethrough modification of soil abiotic properties, through altered plant communitycomposition or through more complicated routes, for example when grazing causesplant-induced changes in soil abiotic properties. We collected plant and soil datafrom a long-term grazing exclusion experiment in the field and assessed the relativeimportance of alternative causal pathways by structural equation modeling (SEM).We used SEM because it can test the fit of data to a priori causal hypotheses when aparticular organization among variables is assumed (Shipley 2000, Grace 2006). Itallows testing of multivariate hypotheses in which some variables can act aspredictor and response variables at the same time.
To characterize the soil community, we focused on nematode communitycomposition, because this taxonomic group includes a wide variety of feeding types,including bacterial feeders, fungal feeders, plant feeders, omnivores and carnivores(Yeates et al. 1993). Consequently, the nematode community serves as a proxy forcommunity composition of other groups of soil organisms at different trophiclevels. Considering the variety of nematode feeding types in the soil, the possiblelimiting resources will also be variable, including plant roots, bacteria, fungi,mosses, other nematodes and insects. In general, lower trophic level organisms insoil food webs are supposed to be controlled by top-down forces, whereas highertrophic level organisms are controlled by bottom-up forces (de Ruiter et al. 1995).However, resource selectivity probably plays a more important role in soil food
17Vertebrate grazing affects soil biota

webs than previously supposed (Ruess et al. 2000, De Deyn et al. 2004b). Therefore,we considered that a myriad of bottom-up, top-down and competitive controlfactors, as well as resource specificity may be involved in determining the nema-tode community composition. We analyzed main pathways that could hypotheti-cally orchestrate grazing effects on this myriad of nematode control factors.
In order to test the hypothetical pathways that may explain grazing effects onnematode community composition, we constructed four competing conceptualmodels (Fig 2.1) and determined the closest fit with the best model resulting fromthe SEM analysis. The hypothetical pathways of grazer effects on nematodecommunity composition was based on literature information: (1) Soil abiotic condi-tions can affect nematode community composition (Yeates and Bongers 1999) andcan be changed by herbivore activities. For example, grazers change soil bulkdensity as a result of trampling and they locally alter soil pH, nutrient availabilityand N mineralization rates by dung and urine deposition (e.g. Ruess andMcNaughton 1987, Steinauer and Collins 1995, Hobbs 1996, McNaughton et al.1997a, Frank et al. 2000, Bakker et al. 2004). (2) Grazing-induced nematode commu-nity changes can be mediated by changes in plant community composition. As aresult of selective removal of plants, herbivores alter the extinction-colonizationbalance and competitive interactions between plants (e.g. Milchunas and Lauenroth1993, Olff and Ritchie 1998). Altered plant community composition may lead to adifferent nematode community composition, because nematodes are able torespond differently to specific plants (van der Putten and van der Stoel 1998, DeDeyn et al. 2007). Consequently, plant community composition, rather than plantdiversity determines community composition of soil nematodes (De Deyn et al.2004b, Viketoft et al. 2005). (3) Grazing can also affect nematode communitycomposition by altering soil abiotic properties indirectly via plant responses andchanges in plant community composition. This, in turn, influences the amount andquality of resources entering the soil via plant nutrient allocation and root exuda-tion (Holland and Detling 1990, Bardgett et al. 1998, Guitian and Bardgett 2000).Moreover, altered plant community composition often results in a different struc-tural and chemical composition of plant litter returned to the soil, and in differentdepletion patterns of soil resources like water and nutrients (Yeates 1999, Wardle2002). (4) Finally, the nematode community composition can be altered becausegrazers change soil abiotic properties, which change plant community composition,leading to changes nematode community composition.
To analyze the relative importance of the different pathways (Fig 2.1), weexcluded aboveground vertebrate grazers (cattle and rabbits) from a species-richfloodplain grassland and compared plant and nematode community composition, aswell as various soil abiotic properties between the grazed and ungrazed plots. Weexpected the effects of grazing by large aboveground vertebrate herbivores, soilabiotic properties and plant community composition on nematode community
18 Chapter 2

composition to be hierarchically structured according to the size of organismsinvolved (grazers>plants>soil biota) (Bradford et al. 2002, Ettema and Wardle2002, Bardgett et al. 2005). Therefore, the four alternative pathways proposedinclude unidirectional effects only. Although there may be feedback effects of thesoil community on the plant and herbivore community (e.g. Blomqvist et al. 2000,Bardgett and Wardle 2003, De Deyn et al. 2004a), we did not include these effects inour analysis.
Methods
Site descriptionThe study was conducted in the Junner Koeland area, a 100-ha nature reservealong the river Overijsselse Vecht in the Northeast of the Netherlands (52º32’N,6º36’E). The area includes a 50-ha floodplain, where our experiment was carriedout. This site used to be flooded regularly until canalization of the river Vecht(around 1910) and regulation of the water level. The Junner Koeland was commongrazing land, used by farmers from the village Junne, and has been grazed by live-stock for centuries. Nowadays, it is managed as a nature reserve by the NationalForestry Service (Staatsbosbeheer), and is grazed by cattle (Bos taurus) from Apriltill November at stocking rates of about 0.3 animals/ha. The most abundant naturalvertebrate herbivores in the area are European rabbits (Oryctolagus caniculus) andcommon voles (Microtis arvalis). Dominant plant species in the grasslands are thegraminoids Agrostis capillaris, Festuca rubra, Holcus lanatus, and Luzula cam-pestris. Frequently occurring dicots are Rumex acetosa and Trifolium repens. Also,the grasslands locally host several endangered plant species, such as Dianthusdeltoids, Succisa pratensis, Thymus serpyllum and Mentha pulegium (nomencla-ture follows van der Meijden 2005).
Experimental designIn 1994, a long-term exclosure experiment was set up consisting of 5 randomlyestablished blocks, each containing a fenced exclosure plot of 12 × 12m2 from whichcattle and rabbits were excluded (Ungrazed) and at 2 m distance an adjacent plot of12 × 12m2 to which cattle and rabbits had free access (Grazed). Within each plot 4permanent subplots of 2 × 2m2 were established to record long-term vegetation andabiotic responses to cattle and rabbit grazing. All 40 subplots were positioned atleast 1 m from the fences to avoid edge effects.
MeasurementsIn each of the 40 subplots of 2 × 2m2, we recorded plant species composition in July2006 at peak standing biomass. We estimated cover of each plant species visually
19Vertebrate grazing affects soil biota

according to the decimal Londo scale (Londo 1976). In the first week of November2006 we randomly selected three locations per subplot from each of which wecollected 2 kg of soil from the top 15 cm using a hand shovel. After gentle homoge-nization and removing of stones, we collected 2 subsamples of 100 g each. We usedone sample to isolate, identify and count nematodes and the other to measure soilorganic matter content (SOM) and soil texture. We extracted nematodes using Oost-enbrink elutriators (Oostenbrink 1960). A subsample of 10% of the extraction waspreserved, the nematodes were heat-killed and fixed (35% formaldehyde diluted to4%). In each sample we counted total number of nematodes and a minimum of 150nematodes were identified to family, genus or species level according to Bongers(1988). Nematodes were classified into feeding types according to Yeates et al.(1993): plant feeders, fungal feeders, bacterial feeders, carnivores and omnivoresand distributed into c-p (colonizer-persister) classes to calculate a maturity index,MI (Bongers 1990).
We determined soil organic matter content (SOM) of dry soil samples (achievedby drying for 24 hrs at 105ºC) by loss-on-ignition at 550ºC for 3 hrs. SOM wasexpressed as the relative weight difference before and after ignition. We deter-mined soil texture in freeze-dried soil as volume % particle size classes. The freeze-dried soil was first dispersed by ultrasonification and subsequently analyzed with acoulter counter LS230 (fluid module; Beckman Coulter Inc., USA).
Additionally, per subplot we collected two PVC cylinders filled with soil (diam-eter 4.3 cm, length 16 cm) to measure potential nitrogen (N) mineralization rates.We homogenized soil from half of all tubes within 24 h after collection to measuresoil moisture content (%), pH, and extractable concentrations of inorganic nitrogen(NO3– and NH4+). The remaining tubes were kept at 21ºC and constant soil mois-ture levels for 6 weeks. After 6 weeks the soil was homogenized and extractablelevels of NO3– and NH4+ were measured again. The differences between the firstand second analysis yield potential mineralization rates per subplot (Olff et al.1994). To determine NO3– and NH4+ concentrations 25g of soil was dissolved in60 ml 1 mol/L KCl. Concentrations were determined colorimetrically with a FlowSolution Autoanalyzer (Skalar Analytical, Breda, The Netherlands). We determinedsoil moisture content as the weight loss after drying soil at 105ºC for 24 hrs. Tomeasure pH we dissolved 15g of soil in 20 ml demineralized water and measuredthe samples with a Sentron pH meter (Sentron, Roden, The Netherlands).
Data analysisTo characterize plant and nematode community structure in each subplot (n = 40)we calculated plant species and nematode taxon richness (S, the total numberof plant species or nematode taxa per subplot), Shannon’s diversity index (H’,H’ = – ∑ pi ·1n(pi) where pi is the relative cover or abundance of species i(Magurran 2003) and evenness (E, E = H’/ ln(S)). We calculated plant and nematode
20 Chapter 2

community dissimilarity from Euclidian Distance (ED) using the percentage coverof each plant species or the abundance of each nematode taxon, respectively,according to the following formula:
ED = √∑(xi1 – xi2)2,
where S is species/taxon richness, xi1 is the percentage cover or abundance ofspecies i in plot 1 and xi2 is the percentage cover or abundance of species 1 in plot 2.We calculated ED by comparing all 4 subplots within one plot. Thus, in total we had5 replicated dissimilarity values for grazed and 5 for ungrazed areas. We testedcommunity structure and soil abiotics data for normality (Kolmogorov-Smirnovtest) and homogeneity of variances (Levene’s test). When necessary data werelog(x+1)-transformed.
We tested grazing effects on plant and nematode community structure (S, H’, E,ED, and MI) and soil abiotic properties using mixed model ANOVA’s with the metricsof community structure or soil abiotics as response variables. Grazing was used as afixed factor and block as a random factor. We tested the relationship betweennematode and plant community structure (S, H’, E, ED) using ANCOVA with metricsfor nematode community structure as response variables, grazing as a fixed factor,and metrics for plant community structure as continuous predictor variables.
To analyze via which of the four hypothetical pathways grazing was affectingnematode community composition (i.e., taxon and feeding type composition) weused structural equation modeling. Prior to the SEM procedure we reduced thenumber of variables for abiotic soil properties, plant community composition andsoil nematode community composition through principle component analyses (PCA)on each group of variables separately. For each group the first principle component(PC) was used in the subsequent SEM analysis to represent soil abiotic properties(PC1 explained ~70% of variation), plant community composition (PC1 explained~30% of variation) and soil nematode community composition (PC1 explained~25% of variation), respectively. All variables used in the SEM analysis wereobserved variables. We started the SEM procedure with the specification of aconceptual model of relationships in our system (Fig 2.1), based on a priori andtheoretical knowledge. In this model we hypothesized that grazing may alter soilabiotic properties and plant community composition, which in turn may affectnematode community composition. Soil abiotic properties and plant communitycomposition could influence each other as well. The conceptual model provided aframework for the actual SEM analysis and test of our four alternative pathways.The subplots in the grazing experiment were grouped into blocks (see experimentaldesign) to account for unmeasured variation due to the position of the plots on anenvironmental gradient which was determined by the distance to the river. In theSEM analysis we were not able to include the factor “block”. To account for poten-
21Vertebrate grazing affects soil biota
S
i=1

tial unmeasured effects of the block structure we added the variable “distance”(DIST; Fig 2.3) to the model. This variable describes the distance of each subplot tothe river, therefore serving as an indicator for subplot position on the gradient,which corresponds to the blocking structure in the experiment. As minimumsample size in SEM, Bentler and Chou (1987) recommend to use 15 cases per meas-ured variable, or even fewer when there are no missing values. In our study we justmet these recommendations as we measured three variables and our sample sizewas 40 without missing values.
In the SEM analysis we compared the model-implied variance–covariancematrix against the observed variance-covariance matrix. Data were fitted to themodels using the maximum likelihood estimation method. The χ2 goodness-of-fit
22 Chapter 2
Conceptual model
G
P
N
A
Hypothesis 1
G
N
A
Hypothesis 3
N
A
Hypothesis 2
P
N
Hypothesis 4
N
A
G
GG
P P
Figure 2.1 The top panel shows the conceptual model of pathways via which grazing may affectnematode community composition and diversity. The four bottom panels show the models for thefour alternative hypotheses outlining how aboveground grazing may affect nematode communitycomposition. Variables are: G, grazing treatment, (grazed or ungrazed), A, soil abiotic properties,P, plant community composition, N, nematode community composition. The four hypothesis are(1) grazing alters soil abiotic properties, which directly affect nematode community composition;(2) grazing changes plant community composition, which alters nematode community composition;(3) grazing changes plant community composition, which affects nematode community compositionindirectly by changing soil abiotic properties; and (4) grazing changes soil abiotic properties, whichaffect nematode community composition indirectly by changing plant community composition.

statistic and its associated P value were used to judge the model fit to the data. Alarge P value associated with the χ2 value indicates that the covariance structure ofthe data does not differ significantly from expected, based on the model. By step-wise removal of non-significant paths from the initial model (i.e., the model closestto our conceptual model), we selected the model that fitted our data best. Wecompared this SEM model to the conceptual models describing our hypotheticalpathways (Fig 2.1). This procedure enabled us to determine which proposed path-ways explained grazing effects on nematode community composition best. We alsotested the models with direct effects of grazing on nematode community composi-tion included to see whether this effect would explain significant amounts of varia-tion in nematode community composition.
All univariate statistical analyses were performed using STATISTICA (release7.1, Statsoft, Inc., Tulsa, Oklahoma USA). Multivariate statistical analyses (PCA)were performed using CANOCO for windows (version 4.5, ter Braak and S
v
milauer,Wageningen-UR, The Netherlands). SEM analyses were performed using AMOS5.0.1 student version (Amos Development, Spring House, PA, USA).
Results
Grazing effects on plant community composition, soil abiotic properties andnematodesIn grazed plots we found a significantly higher pH, whereas potential NH4+ miner-alization rates and soil organic matter content tended to be increased. However,potential NO3– mineralization rates were significantly lower in grazed plots (Table2.1). Grazing decreased heterogeneity (ED) in nematode communities and caused aclose to significant reduction of heterogeneity in plant communities. In the grazedplots, the vegetation was lower and plant species richness was higher than in theplots where grazing was excluded. The grazing regime did not influence taxon rich-ness in the nematode community. Grazing neither influenced evenness (E) anddiversity (H’) in both plant and nematode communities. The maturity index (MI) forthe nematode community tended to be lowest in the grazed plots (Table 2.1). Thegrazed plots had significantly fewer numbers of bacterial feeding nematodes (Fig2.2, F1,30 = 10.26, P = 0.033), whereas other nematode feeding groups showed thesame tendency, although not significant (P > 0.05).
Nematode community diversity (H’) was positively related to plant communitydiversity (P = 0.006, F1,37 = 8.54), and this relationship was not different betweengrazed and ungrazed plots (P = 0.307, F1,37 = 1.07). However, there was neither arelationship between plant species richness and nematode taxon richness (P = 0.159,F1,37 = 2.07), nor between indices of plant and nematode evenness (E) (P = 0.129;F1,37 = 2.40) and heterogeneity (ED; P = 0.181, F1, 7 = 2.20).
23Vertebrate grazing affects soil biota
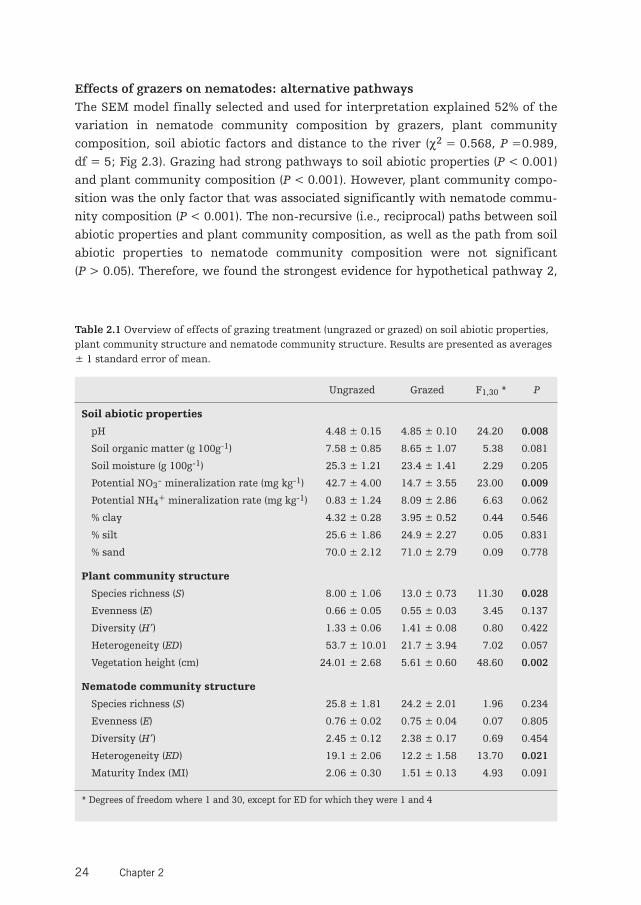
Effects of grazers on nematodes: alternative pathwaysThe SEM model finally selected and used for interpretation explained 52% of thevariation in nematode community composition by grazers, plant communitycomposition, soil abiotic factors and distance to the river (χ2 = 0.568, P =0.989,df = 5; Fig 2.3). Grazing had strong pathways to soil abiotic properties (P < 0.001)and plant community composition (P < 0.001). However, plant community compo-sition was the only factor that was associated significantly with nematode commu-nity composition (P < 0.001). The non-recursive (i.e., reciprocal) paths between soilabiotic properties and plant community composition, as well as the path from soilabiotic properties to nematode community composition were not significant(P > 0.05). Therefore, we found the strongest evidence for hypothetical pathway 2,
24 Chapter 2
Table 2.1 Overview of effects of grazing treatment (ungrazed or grazed) on soil abiotic properties,plant community structure and nematode community structure. Results are presented as averages± 1 standard error of mean.
Ungrazed Grazed F1,30 * P
Soil abiotic properties
pH 4.48 ± 0.15 4.85 ± 0.10 24.20 0.008
Soil organic matter (g 100g-1) 7.58 ± 0.85 8.65 ± 1.07 5.38 0.081
Soil moisture (g 100g-1) 25.3 ± 1.21 23.4 ± 1.41 2.29 0.205
Potential NO3- mineralization rate (mg kg-1) 42.7 ± 4.00 14.7 ± 3.55 23.00 0.009
Potential NH4+ mineralization rate (mg kg-1) 0.83 ± 1.24 8.09 ± 2.86 6.63 0.062
% clay 4.32 ± 0.28 3.95 ± 0.52 0.44 0.546
% silt 25.6 ± 1.86 24.9 ± 2.27 0.05 0.831
% sand 70.0 ± 2.12 71.0 ± 2.79 0.09 0.778
Plant community structure
Species richness (S) 8.00 ± 1.06 13.0 ± 0.73 11.30 0.028
Evenness (E) 0.66 ± 0.05 0.55 ± 0.03 3.45 0.137
Diversity (H’) 1.33 ± 0.06 1.41 ± 0.08 0.80 0.422
Heterogeneity (ED) 53.7 ± 10.01 21.7 ± 3.94 7.02 0.057
Vegetation height (cm) 24.01 ± 2.68 5.61 ± 0.60 48.60 0.002
Nematode community structure
Species richness (S) 25.8 ± 1.81 24.2 ± 2.01 1.96 0.234
Evenness (E) 0.76 ± 0.02 0.75 ± 0.04 0.07 0.805
Diversity (H’) 2.45 ± 0.12 2.38 ± 0.17 0.69 0.454
Heterogeneity (ED) 19.1 ± 2.06 12.2 ± 1.58 13.70 0.021
Maturity Index (MI) 2.06 ± 0.30 1.51 ± 0.13 4.93 0.091
* Degrees of freedom where 1 and 30, except for ED for which they were 1 and 4

that grazing changes plant community composition, which in turn alters nematodecommunity composition (Fig 2.1). The other pathways, which assumed that grazinginfluenced nematode community composition by inducing direct and indirectchanges in soil abiotic properties, were less important in explaining variation innematode community composition. Within the context of our SEM analysis we didnot find a direct effect of aboveground grazing on nematode community composi-tion (P = 0.926). Distance to the river (DIST) significantly affected both nematodeand plant community composition (Fig. 2.3), and therefore was kept in the model.
25Vertebrate grazing affects soil biota
0
10
20
30
40
50
nem
atod
e de
nsity
(no
./g d
ry s
oil)
ug g
PF
0
1
2
3
4
5
ug g
FF
0
5
10
15
20
25
ug g
BF
0.0
0.2
0.4
0.6
0.8
ug g
C
0
1
2
3
4
7
ug g
O
6
5
*
Figure 2.2 Density of nematodes (mean ± SE) per feeding type in each grazing treatment. Grazingtreatments are plotted on the x-axis (ug, ungrazed; g, grazed). The different graphs representdifferent nematode feeding types (PF, plant-feeding nematodes; FF, fungal-feeding nematodes; BF,bacterial-feeding nematodes; C, carnivorous nematodes; and O, omnivorous nematodes). TheAsterisk indicates a significant difference at P < 0.05.
Figure 2.3 Final model results of SEM analysis(χ2 = 0.57, P = 0.989, df = 5). Square boxesdisplay variables included in the model: G, grazingtreatment (grazed or ungrazed); A, soil abioticproperties (PC1); P, plant community composition(PC1), N = nematode community composition(PC1); and DIST, distance to river, used as an indi-cator for position on the environmental gradient.Solid arrows indicate significant effects (P < 0.05); dashed arrows represent effects that were notsignificant. Arrow width corresponds directly to the standardized path coefficient. R2-values asso-ciated with response variables indicate proportion of explained variation by relationships withother variables. Values associated with solid arrows represent standardized path coefficients.
0.30
G
P
N
A
DIST
0.350.56
-0.74 -0.85
R2=0.55
R2=0.52
R2=0.84

Discussion
Twelve years of excluding cattle and rabbits from an extensively managed grass-land changed soil abiotic properties, plant and nematode community structure.Aboveground grazing decreased the abundance of nematodes, specifically bacterialfeeders. Grazing reduced spatial heterogeneity (ED) in both plant and nematodecommunities. Diversity indices in both plant and nematode communities were posi-tively related, indicating structural linkages between plants and nematodes. SEMrevealed that grazing by cows and rabbits most likely influenced nematode commu-nity composition by altering plant community composition, instead of by alteringsoil abiotic properties. Therefore, our SEM approach supports conclusions fromplant addition experiments (De Deyn et al. 2004b, Viketoft et al. 2005) and plantremoval studies (Wardle et al. 1999) that nematode community compositiondepends on plant community composition. One previous study that also tried totease apart effects of plant community composition and soil abiotic properties onsoil microbial community composition and structure (Broughton and Gross 2000)was constrained by plant community composition changing with soil fertility. Thiswill be a usual limitation when performing field sampling along environmentalgradients. Our SEM approach based on a long-term grazing exclusion experiment,therefore, is the first to our knowledge to tease apart effects of grazing, plantcommunities and soil abiotic properties in influencing soil community composition.
The effects of plant community composition on nematode community composi-tion may result from effects directly related to living plant roots and indirect effectsas a result of root exudates and inputs of detritus and leaf litter into the soil food web(Wardle et al. 2004). Direct effects will work mostly through root-feeding nematodes.Since root-feeding nematodes may be host-specific (van der Putten and van der Stoel1998) a change in plant species composition will directly alter nematode compositionin this feeding group (Yeates and Bongers 1999). De Deyn et al. (2004b) showed thatparticular plant species enhanced the abundances of specific plant-feeding nematodetypes. Other nematode feeding types, such as bacterial and fungal feeders, areaffected indirectly by plant community change through altered inputs of rootexudates and plant litter, which first influence the soil microbial community andthen the bacterial and fungal feeding nematodes (Stanton 1988, Wardle et al. 2004).
We found higher numbers of bacterial feeding nematodes in ungrazed plots,which could result from an altered microbial community composition due tochanged plant species composition. Plant species may discharge different rootexudates, resulting in plant-specific microbial communities (Grayston et al. 1998,Johnson et al. 2003, Marschner et al. 2004). Relatively little is known about feedingselectivity of bacterial and fungal feeding nematodes, but considering the variety inmouth parts, it is possible that these nematodes have some degree of resourcespecialization or preference (Ruess et al. 2000). Therefore, altered bacterial commu-
26 Chapter 2

nity composition can be expected to result in a change in bacterial feeding nema-tode composition. Indeed, preliminary analysis of the microbial community in ourstudy system revealed that aboveground vertebrate grazing reduced bacterialactivity, which may explain lower numbers of bacterial feeding nematodes in grazedplots. Moreover, bacterial activity tended to be positively related to the number ofbacterial feeding nematodes in a plot (G.F. Veen, unpublished data). Previous studieson the consequences of aboveground vertebrate grazing for microbial biomass oractivity reported both positive (e.g. Bardgett et al. 1998, 2001, Wang et al. 2006) andnegative effects (e.g. Stark and Grellmann 2002, Sankaran and Augustine 2004). Areduction in microbial activity by aboveground vertebrate grazing can be explainedas a result from lower plant litter quality due to grazing-induced dominance ofunpalatable species (Bardgett and Wardle 2003) or from lower plant litter quantitydue to decreased litter production under cattle grazing (Bakker 2003).
The quality and quantity of plant litter input to the soil is affected by plantcommunity composition. High litter quality and inputs from herbivore droppingswill promote the bacterial decomposition chain of the soil food web, whereas lowerquality litter and the absence of droppings may enhance the fungal decompositionchain (Wardle et al. 2004). Interestingly, in our case grazing reduced bacterivorousnematodes, suggesting that the grazing pressure was too high to promote the bacte-rial food chain. Omnivores may be influenced similarly to the herbivores, bacterivo-rous and fungal feeding nematodes, whereas carnivores will be affected moreindirectly, i.e. via other nematode feeding groups, mites, collembolans, or alteredinsect communities in the soil (Yeates et al. 1993). As carnivores tended to bereduced as well in the grazed plots, grazing also appeared to influence highertrophic level organisms in the soil food web.
ConclusionWe conclude that effects of grazing by aboveground vertebrate herbivores on soilnematode community diversity, heterogeneity and composition mainly operate viaaltering plant community structure and composition. Abiotic soil properties were ofless influence on nematode community composition. Grazing effects showed up atvarious positions in the soil food web, as it reduced the numbers of bacterivorousand carnivorous nematodes. Grazing effects on the soil community as a result ofaltered plant community composition may be mediated by altered quality, quantityand distribution of resources into the soil.
AcknowledgementsThanks to Nelly Eck, Saskia de Vries and Rineke Gieles for their assistance with analysis ofsoil abiotic properties. Thanks to James B. Grace and T. Michael Anderson for their help onstructural equation modeling. We thank two reviewers for their useful comments onprevious versions of the manuscript. We are grateful to the National Forest Service (Staats-bosbeheer) for permission to perform our field work in the “Junner Koeland nature reserve”.
27Vertebrate grazing affects soil biota
Cha
pter
thr
ee

Plant-soil feedbacks and the coexistenceof competing plants
*These authors contributed equally to this paper
Tomás. A. Revilla*, G.F. (Ciska) Veen*, Maarten. B. Eppinga,Franz. J. Weissing
3
Plant-soil feedbacks can have important implications for the interactionsamong plants. Quantification of these effects is a major challenge since it isinherently difficult to measure and manipulate highly diverse soil communi-ties. There is a need for mathematical models to single out the parametersthat are crucial for a better understanding of plant-soil interactions. Herewe consider a pioneering plant-soil feedback model developed by Bever andcolleagues (1997, 1999, 2003). We analyze this model by means of a newgraphical method that provides a complete set of scenarios describing howplant competition may be altered through soil community effects. Due to thegraphical character of the method, the results are still relatively easy toobtain and understand.
We show that plant diversity can be explained by the interactions of twokey parameters which can be interpreted as measures of the direction andstrength of soil feedback and intensity of plant competition, respectively. Wepresent a detailed explanation of how negative soil feedback enhances therange of plant coexistence by means of competitive oscillations. Our analysisprovides a formal underpinning of earlier claims that plant-soil feedbacks,especially when they are negative, may enhance the diversity of plantcommunities.
The complete set of possible scenarios presented in this study can be usedto formulate hypotheses about the way soil community effects driveobserved plant competition dynamics. However, we have to be careful totranslate the model findings to natural systems because the representationof soil community dynamics is highly simplified, i.e., the soil community isassumed to be saturated always. Therefore, a combination between moremechanistic plant-soil feedback models and plant-soil feedback experimentswill provide a promising approach for future empirical research.
Abstract

3.1 Introduction
Ecologists have long recognized that interactions between plants are mediated bymany biotic (e.g. grazing, plant competition and facilitation) and abiotic factors (e.g.soil texture, nutrient availability, topography) (e.g. Harper 1977, Tilman 1988).More recent research has stressed the influence of the soil community on interac-tions between plants (Klironomos 2002, Callaway et al. 2004), by exerting positiveor negative effects on the growth of specific plants (e.g. van der Putten et al. 1993,Gange et al. 1993, van der Putten and van der Stoel 1998, van der Heijden et al.1998a, Olff et al. 2000, De Deyn et al. 2003, Klironomos 2003, van der Heijden et al.2003). These effects have been shown to influence species at higher trophic levels(e.g. plant herbivores and their predators) as well (Soler et al. 2005). Therefore,plant-soil interactions can potentially be of crucial importance for species composi-tion of plant communities and, more generally, the diversity of terrestrial ecosys-tems (van der Putten et al. 2001, Wardle et al. 2004).
The interaction between a plant and the soil community, referred to as plant-soil feedback, is a two-step process: the presence of a specific plant changes thecomposition of the soil community, which in turn alters the growth rate of thatspecific plant (Bever 2003, Reynolds et al. 2003). Quantifying the effect of soilorganisms on plant growth and vice versa is difficult due to the vast below-grounddiversity, and the technical problems inherent to measuring and manipulating soilcommunities (Bever 2003, van der Putten et al. 2009). Therefore, there is a need formathematical models to single out the parameters that are crucial for a betterunderstanding of plant-soil interactions (van der Putten et al. 2009).
Pioneering mathematical models of the effect of plant-soil feedback on plantdiversity were developed by James Bever and colleagues (Bever et al. 1997, Bever1999, 2003). These models are appealing to empirical plant-soil ecologists becausethey do not require specific knowledge on the diversity of soil communities, or theeffects of individual soil-borne species on plant growth. As a result, model predic-tions can be tested with relatively straightforward experiments (Bever 1994, Beveret al. 1997). Bever (2003) proposed a framework that introduces plant-soil feedbackinto the classical Lotka-Volterra competition model, which has motivated severalsubsequent model studies on similar topics (Bonanomi et al. 2005, Umbanhowarand McCann 2005, Eppinga et al. 2006, Eppstein et al. 2006, Eppstein and Molofsky2007).
Using this model framework, Bever (2003) highlighted two particular caseswhere plant-soil feedback affected the coexistence of two competing plant species:(1) negative plant-soil feedback facilitating coexistence between plants, and (2)negative plant-soil feedback driving oscillations in plant abundances (Bever 2003).Bever only performed a partial analysis of his model. Here we will provide a moresystematic and complete analysis of this model (henceforth called the “Bever
31Plant-soil feedback and plant coexistence

model”). Our analysis reveals that there are more ways in which plant-soil feed-backs affect coexistence and dynamics of competing plant species. Moreover, itshows that we need to redefine some of Bevers conclusions (e.g. the definition of hisfeedback parameter Is and the range in which plant-soil feedback drives oscillationsin plant abundances) to be able to explain all outcomes of the model. In this paperwe first introduce the Bever model (section 3.2), which we analyze with a graphicalmethod (section 3.3). In section 3.4 we describe the implications of our results forplant species coexistence and in section 3.5 we present a general discussion.
3.2. The Bever model
The "Bever model" (Bever 2003) studies the effect of two soil communities withdensities SA and SB on the growth of two competing plant species with densities NA
and NB. Figure 3.1 shows a schematic representation of potential interactionsbetween the two plant species and the two soil communities. Each soil communityin the model is specifically associated with one of the plant species (Yeates 1999,Wardle et al. 2004). The growth of a soil community is positively affected by thepresence of its associated plant species, while it is negatively affected by the pres-ence of the other plant species. On their turn, specific soil communities can haveboth positive and negative effects on the growth of both plant species (e.g. van derPutten and van der Stoel 1998, De Deyn et al. 2003, Klironomos 2003). Thedynamics of the system consisting of two plant populations and two soil communi-ties is described by the following system of four differential equations:
dNA = rANA(1 + αASA + βASB – NA + cBNB ) (1a)
dt KA
dNB = rBNB(1 + αBSA + βBSB – NB + cANA ) (1b)
dt KB
dSA = SASBNA – νNB (1c)
dt NA + NB
dSB = SASBνNB – NA (1d)
dt NA + NB
In the absence of the soil communities, the interaction of the two plant populationsis described by a Lotka-Volterra competition model (e.g. Case 2000); rA and rB
denote the intrinsic per capita growth rates of the plant species, KA and KB are thecarrying capacities of the plant species when growing in isolation, and cA and cB
are the competition coefficients which are expressed as the per capita effects ofeach species on the growth rate of the competitor species (interspecific competi-tion), relative to the per capita effect on the growth rate of its own population(intraspecific competition). SA and SB are the densities of the two soil communities,
32 Chapter 3

where SA is specifically associated with plant species A and SB with plant species B.The per capita growth rate of each plant species is affected by the presence of thetwo soil communities. The effect of the soil communities on plant growth is charac-terized by the parameters αA, αB, βA and βB respectively, which can be either posi-tive, negative or zero.
The Bever model represents soil community growth in a highly simplified way.The soil community is positively affected by the relative abundance of its associ-ated plant species and negatively affected by the relative abundance of the otherplant species. The parameter ν is a scaling factor that quantifies the relativestrength of the positive and negative effects of plant on soil community growth.
This implies that the total abundances of both soil communities are constant at alltimes. Without loss of generality we can assume that the total size of the soilcommunity is scaled to 1: SA + SB = 1. This allows us to express SB in terms of SA
(i.e., SB = 1 – SA) and to reduce the system (1) to a system of three differential equa-tions, which can be written in the form:
dNA = ρANA (1 – NA + cBNB ) (2a)
dt κA
dNB = ρBNB (1 – NB + cANA ) (2b)
dt κB
dSA = SA(1 – SA)( NA – νNB ) (1c)
dt NA + NB
The intrinsic growth rates ρA and ρB and the carrying capacities κA and κB of the
33Plant-soil feedback and plant coexistence
Notice that dSA + dSB = 0.dt dt
AcA
B
SA SB
cB
βB ναA1αB βA
-ν -1
Figure 3.1 Schematic representation of potential interactions between two plants and their associ-ated soil communities in the Bever model.

two plant species depend on the densities of the soil communities SA and SB = 1 – SA,and they are given by:
ρA = ρA(SA) = rA·(1+ αASA + βA(1 – SA)) (3a)ρB = ρB(SA) = rB·(1+ αBSA + βB(1 – SA)) (3b)κA = κA(SA) = KA·(1+ αASA + βA(1 – SA)) (3c)κB = κB(SA) = KB·(1+ αBSA + βB(1 – SA)) (3d)
The species-specific effects of the soil communities on their plants are αA and αB ,for plant A and B respectively and the non-specific effects are αB and βA, for plant Aand B respectively. These effects can take any sign, in correspondence with mutual-istic or pathogenic relationships. In mutualistic relationships plant growth may befavored by the presence of their symbionts, e.g. arbuscular mycorrhizal fungi(AMF), which enhance plant access to limiting resources. On the other hand, soilpathogens and root herbivores, e.g. root feeding nematodes, can negatively affectplant growth by direct removal of nutrients from root tissue and by reduction ofsoil nutrient uptake (Bever et al. 1997).
3.3. Graphical analysis
Our analysis of the Bever model will focus on equilibria and their stability. It willbe useful to perform the analysis in four steps. First, we discuss the effects of thesoil dynamics on plants growing in monoculture, which leads us to the concept ofsoil stability. Second, we consider the effects of a fixed soil composition on plantcompetition, which helps us to define the concept of competitive stability. Third, wetake into account the net effects of the plant-soil feedbacks, and how to distinguishwhether they are positive or negative. Fourth, we integrate our criteria for soilstability, competitive stability, and feedbacks in a graphical method for the analysisof the complete system (2).
3.3.1 Plant monoculturesLet us start by considering the absence of plant B, i.e. NB = 0. This means thatplant A is a monoculture that grows according to the logistic equation (2a). In theabsence of plant B, the soil dynamics (2c) simplifies to dSAdt = SA(1– SA). Theright-hand side is positive for 0 < SA < 1, which implies that SA converges to itsmaximal value SA = 1, while SB converges to zero. Hence in a monoculture of plantA the soil community associated with plant A completely eliminates the soilcommunity associated with plant B. As a consequence, in the long term plant Aattains an equilibrium density that is given by the carrying capacity NA = κA(1) =KA(1+αA ) that is characteristic for a soil where plant A’s soil biota is dominant.
34 Chapter 3

There is another monoculture equilibrium of plant A, corresponding to the situationthat plant A’s soil biota is absent (SA = 0), which is given by NA = κA(0) = KA(1+βA).This equilibrium is unstable, since the smallest deviation of SA from zero willinduce convergence to SA = 1. Accordingly, we call the two monoculture equilibriaof plant A soil-stable and soil-unstable, respectively. Obviously, the same argumentsapply, mutatis mutandis, to monocultures of plant species B. It will turn out thatthe concept of soil stability is also useful for judging the stability of communityequilibria that happen to be associated with an ‘extreme’ soil fauna (i.e., SA = 0 orSA = 1). For later reference, we give the four monoculture equilibria a name andsummarize our findings as follows:
AA: SA =1, NA = KA(1+αA) (soil-stable monoculture A) (4a)AB: SA =0, NA = KA(1+βA) (soil-unstable monoculture A) (4b)BA: SA =1, NB = KB(1+αB) (soil-unstable monoculture B) (4c)BB: SA =0, NB = KB(1+βB) (soil-stable monoculture B) (4d)
For the rest of this paper we assume αA ,βA ,αB,βB >–1, since the four monocultureequilibria only exist if this condition is satisfied.
3.3.2 Effect of a static soil community on plant competitionAssume for the moment that the density of soil organisms remains at a constantlevel SA. Then the dynamics of the plant species is fully described by the Lotka-Volterra competition model (2a, 2b), where the carrying capacities κA and κB
depend on the static level SA. It is a standard result from Lotka-Volterra theory (e.g.Case 2000) that there are four different scenarios for the dynamics and outcome ofcompetition. These scenarios can be characterized on the basis of the stability prop-erties of the two monoculture equilibria (NA = κA , NB = 0) and (NA = 0, NB = κB).The stability of such an equilibrium depends on whether or not the absent plantspecies can grow when rare. Take, for example, the monoculture of plant species A.In view of eqn (2b), plant species B has a positive growth rate whenever NB + cANA
< κB. Inserting the monoculture densities NA = κA and NB = 0 into this condition,we see that species B can invade the monoculture of species A if cAκA < κB. Simi-larly, plant species A can invade a monoculture of plant species B, if cBκB < κA.Equivalently, these stability conditions for monocultures can be phrased as:
cA < κBκA species B can invade monoculture of species A (5a)cB < κAκB species A can invade monoculture of species B (5b)
Based on (5a) and (5b), the dynamics of competition can be classified as follows (seeFigure 3.2):
35Plant-soil feedback and plant coexistence

I. cA > κBκA and cB < κAκB: species A can invade species B, but B cannotinvade A; A is competitively dominant over B and will in the long termcompletely displace B irrespective of the initial conditions.
II. cA < κBκA and cB > κAκB: B can invade A, but A cannot invade B; B is domi-nant over A and will displace A irrespective of initial conditions.
III. cA < κBκA and cB < κAκB: both monocultures can be invaded by the otherspecies and are hence unstable; there exists a unique “interior” equilibrium(also called “coexistence equilibrium” or “community equilibrium”) that isglobally stable; in the long run, both species will stably coexist at equilibrium.
IV. cA > κBκA and cA > κAκB: both monoculture equilibria cannot be invaded bythe other species and are therefore stable; there exists a unique interior equi-librium, but this equilibrium is unstable; in the long run, one plant specieswill displace the other, but the winner of the competition completely dependson the initial conditions.
Hence a community equilibrium does exist whenever cA – κBκA and cB – κAκB
have the same sign. By multiplying the left- and right-hand sides of the inequalitiesdefining scenarios III and IV, it is evident that a community equilibrium, if it exists,is stable whenever cAcB <1, a condition that is often interpreted as “interspecificcompetition is on average weaker than intraspecific competition.” Summarizing:
36 Chapter 3
cAcB <1
IV: mutialexclusion
A B
cA
cB
B does not invade B invades
A do
es n
otin
vade
A in
vade
s
II: B wins
III: stablecoexistenceI: A wins
cAcB <1
IV: mutialexclusion
y=KA/KBy=KA/KB
x=KB/KAx=KB/KA cA
cB
B does not invade B invadesA
does
not
inva
deA
inva
des
II: B wins
III: stablecoexistenceI: A wins
xy=1
xy=1
Figure 3.2 Outcomes of the Lotka-Volterra system (1a,1b). The plane is divided into four invasi-bility zones I, II, III, IV, such that B invades if x > cA and A invades if y > cB, where x ≡ κB/κA,y ≡κB/κA are the carrying capacity ratios in (5). (a) If cAcB < 1 stable equilibria exist at the intersectionof the hyperbola xy = 1 with zone III, in which A and B invade. (b) If cAcB > 1 unstable equilibriaexist at the intersection of xy = 1 with zone IV, where neither A or B can invade, and depending onthe initial conditions A or B wins the competition. Intersection at I or II do not result in equilib-rium, instead A or B always wins, respectively.

existence of community equilibrium: (cA – κBκA)(cB – κAκB) > 0 (6a)stability of community equilibrium: cAcB <1 (6b)
Figure 3.2 illustrates the conditions for equilibrium and stability in a plot where theco-ordinate axes correspond to the ratios of (soil dependent) carrying capacities:x = κBκA and y = κAκB. In view of (5), the relation between x and cA determineswhether B can invade the monoculture of A, while the relation between y and cB
determines whether A can invade the monoculture of B. The parameters x and yare not independent but constrained by xy = (κBκA)(κAκB) =1. In other words, allparameter combinations describing a competitive plant system actually lie on thehyperbola xy =1 in the xy plane. If cAcB <1 (Fig 3.2A), this hyperbola intersects thecoexistence region III (doubly hatched area), which means that stable coexistence ispossible for certain values of κBκA . But in case of cAcB >1 (Fig 3.2B), the hyperbolaintersects the mutual exclusion region IV and stable coexistence is not possible at all.
To characterize stability with respect to the competition among the plant speciesA and B, we will henceforth use the term competitive stability, which we define asfollows: a monoculture is competitively stable if it cannot be invaded by the otherplant species and competitively unstable otherwise; a community equilibrium iscompetitively stable if cAcB <1 and competitively unstable if cAcB >1.
3.3.3 Positive and negative plant-soil feedbackFor any fixed value of SA, the corresponding competitive system corresponds to asingle point on the hyperbola xy =1 in Figure 3.2. If we vary from 0 to 1, we obtainall feasible competitive systems. Graphically, these systems correspond to asegment of the hyperbola xy =1. This feasibility arc is illustrated in Figure 3.3,where also the direction of increasing is indicated by an arrow. The two endpointsof the feasibility arc have the coordinates:
SA =1: x = xA = κB (1)
= KB (1+αA)
, y = yA =1
= KA (1+αA)
(7a)κA (1) KA (1+αB) xA KB (1+αB)
SA =0: x = xB = κB (0)
= KB (1+βB)
, y = yB =1
= KA (1+βA)
(7b)κA (0) KA (1+βA) xB KB (1+βB)
As indicated in Figure 3.3, when increasing from SA = 0 to SA = 1, the system canmove along the feasibility arc either upward and left (Fig 3.3A) or downward andright (Fig 3.3B). In the first case, large values of SA correspond to that part of thefeasibility arc that is closest to parameter regime I where plant species A is competi-tively dominant, while large values of SB (i.e., small values of SA) shift the system toregime II where B is dominant. In other words, there is a positive plant-soil feed-back in the sense that dominance of one of the two soil communities favors the
37Plant-soil feedback and plant coexistence

competitive dominance of the associated plant species. Similarly, we say that thereis negative plant-soil feedback if the direction of the feasibility arc is downwardsand to the right. In that case, dominance of a soil community favors the competitivedominance of the plant species not associated with the dominant soil community.
The importance of the sign of the feedback was pointed out by Bever (Bever etal. 1997, Bever 1999) who argued that positive feedback tends to favor competitivedominance and, hence, species-poor plant communities, while negative feedbacktends to favor plant coexistence. To quantify plant-soil feedbacks, Bever introducedan interaction coefficient IS that is defined by
IS = αA + βB – αB – βA . (8)
As we will show in a moment, there are more reliable indicators for the sign ofthe feedback. As revealed by the graphical analysis, the feedback is positive if thefeasibility arc is directed upwards (as in Fig 3.3A). This means that y = κAκB isincreasing with SA or, in other words, that the derivative of y with respect to SA ispositive. This derivative is given by dydSA = (KAKBκB
2 )·JS, where
JS = (1+αA)(1+βB) – (1+αB)(1+βA) (9)
Hence, the plant-soil feedback is positive if JS > 0 and it is negative if JS < 0. In the
38 Chapter 3
JS > 0
A B
xA
xxB
yB
yA
y
SA=1
SA=0
JS < 0
xB
xxA
yA
yB
y
SA=0
SA=1
Figure 3.3 Effects of soil feedbacks on the feasibility of equilibria. Since soil composition SA isbounded by [0,1] the set of feasible Lotka-Volterra systems belong to a feasibility arc of the unithyperbola xy =1. (a) If ∂y/∂SA >0 (the arc points up) the net feedback is positive JS >0: plantsattain maximum relative densities when their associated soil biota are dominant, i.e. κA/κB ismaximum at SA =1, and κB/κA is maximum at SA =1. (B) If ∂y/∂SA <0 (the arc points down) netfeedback is negative JS <0: plants attain minimum relative densities when their associated soilbiota are dominant.

absence of plant-soil feedback (JS = 0), the feasibility arc collapses into a singlepoint, and we are in the situation described in section 3.3.2.
There is a simple relationship between JS and Bever’s coefficient IS:
JS = IS + αAβB – αBβA . (10)
JS generalizes Bever’s interaction coefficient IS to systems without parametersymmetry (i.e., αAβB ≠ αBβA). The difference between JS and IS is often small, but itis easy to construct examples where JS and IS differ in sign, that is, where Bever’scoefficient IS does not correctly indicate the sign of the feedback.
It will be useful to define a third interaction coefficient. Similar to Lotka-Volterra competition coefficients, the net feedback of soil community effects can bederived from the ratio between effects on the host plant (analogous to intraspecificcompetition) and cross-effects on the other plant (analogous to interspecific compe-tition):
HS = xByA = (1+αA)(1+βB)
. (11)(1+αB)(1+βA)
In view of (9), HS >1 implies that host-plant effects are more favorable than cross-effects, meaning that plant-soil feedback is positive (JS > 0). HS <1 implies thatcross-effects are more favorable than host plant effects, meaning that plant-soilfeedback is negative. As we will show below, the net feedback effect in the systemand the outcome of plant competition thus depend on the strength of interspecificand intraspecific effects of aboveground plant competition (eqn 6) and the strengthof soil community effects (eqn 11).
3.3.4 Combining plant and soil dynamicsCombining the plots in Figures 3.2 and 3.3 provides us with a graphical method thatis often sufficient for a complete characterization of the dynamics of the coupledplant-soil community described by equation (2). (This method is in the same spiritas the “recovery plane” analysis of Eppinga et al. (2006), in which κBκA – cA andκAκB – cB are plotted against each other.) As shown in Figure 3.4, there are 20different ways in which the feasibility arc can intersect the four parameterdomains corresponding to the plant competition scenarios I to IV, which are charac-terized by the monoculture invasion criteria (5). Here we will discuss two specialcases (Fig 3.5). Some interesting but more complex cases will be highlighted inSection 3.4. A complete overview of all 20 scenarios is given in the Appendix.
Figure 3.5A depicts case 12, where the feasibility arc lies completely withinregion II where only species B can invade. We can therefore conclude that irrespec-tive of the state of the soil only plant species B can grow in this scenario. Thus thesystem converges to the monoculture equilibrium BB in which SA = 0. In fact, in all
39Plant-soil feedback and plant coexistence

cases where the feasibility arc lies within regions I or II (cases 1, 2, 11 and 12) oneof the plants will always win, irrespective of the initial conditions. When the arclies in region III (cases 3 and 13), each plant species can invade the monoculture ofthe other species, implying that the two species will stably coexist at equilibrium.When the arc lies within region IV (cases 4 and 14) neither plant species can invadewhen rare. Both plant monocultures are stable, and the winner depends on theinitial conditions (founder control; (founder control; Bolker et al. 2003). Summa-rizing, we can conclude that in the eight scenarios where the feasibility arc liescompletely inside one of the four competition regions the qualitative outcome ofplant competition does not depend on the sign of the plant-soil feedback.
Figure 3.5B depicts case 15, which is more complex because the feasibility arcspans two invasion zones. However, the analysis is still straightforward. A mono-culture of plant B can never be stable, since the whole arc lies in the parameter
40 Chapter 3
IV
A B
CA
CB
II
IIII
CA
CB
IV II
IIII
net positive feedback
IV
CA
CB
II
IIII
CA
CB
IV II
IIII
IV
CA
CB
II
IIII
CA
CB
IV II
IIII
IV
CA
CB
II
IIII
CA
CB
IV II
IIII
net negative feedback
IV
CA
CB
II
IIII
CA
CB
IV II
IIII
IV
CA
CB
II
IIII
CA
CB
IV II
IIII
9
5
6
1
32
10
7
8
4
11
19
16
15
13
12
14
17
18
20
Figure 3.4 Intersection of the feasibility arc of Fig 3.3 with the invasion zones of Fig 3.2. The arc isrepresented as an arrow, thus indicating its orientation: the “head” (x = xA, y = yA) corresponds toSA =1 and the “tail” (x = xB, y = yB) to SA = 0. A monoculture of species A will follow the orienta-tion of the arc (SA increases), whereas a monoculture of plant B will move in the opposite sense (SA
increases). There are 20 intersection “cases”, differing in the relative position and arc orientationwith respect to the invasion zones. The location of the end points (head & tail) with respect to theinvasion zones determines if a species can invade or not.

region where A can invade such a monoculture. In parameter regime I, a monocul-ture of plant A is to be expected in the absence of plant-soil feedback. However, aslong as plant A is in monoculture, the associated soil community SA will increase.Hence the system will be shifted along the feasibility arc in the direction of thearrow, until the plant coexistence regime III is reached. We conclude that in thiscase the (negative) plant-soil feedback enables coexistence of the two plant species.
As indicated by Figure 3.5, the position of the end points of the feasibility arcwith respect to the invasion zones tells us whether a plant monoculture can beinvaded or not. For a monoculture of plant A, the "head" of the feasibility arc (SA =1)is relevant, which corresponds to the equilibrium state AA. This state can beinvaded by plant B if and only if cA < xA. By symmetry, a monoculture of plant Bcorresponds to the state BB, which is located at the "tail" of the feasibility arc (SA =0). This state can be invaded by plant A, if and only if cB < yB. Multiplying thesetwo inequalities and noticing that xAyB = ( xByA )-1 = HS
-1 we obtain a necessarycondition for mutual invasion of the two monoculture equilibria:
cAcB < HS-1 . (12)
In the absence of plant-soil feedback (JS = 0 or HS =1) this coincides with condition(6b) for the stable coexistence of the two plant species in the Lotka-Volterra compe-tition model. In line with the predictions of Bever (e.g. Bever et al. 1997, Bever
41Plant-soil feedback and plant coexistence
B wins
A B
xA
xxB
yB
yA
y
I
A
coexistence
xB
xxA
yA
yB
y
cA
cB
III
IV II
I III
IV II
B
cA
cB
A
B
Figure 3.5 Graphical analysis of two cases depicted in Fig 3.4. (A) In case 12 the feasibility arcoccurs in a zone where only species B can invade (II) and a coexistence equilibrium is not possible,thus species B always wins. (B) In case 15 the monoculture of species A would evolve towards theSA =1 end of the arc, which lies in a zone where species B can invade (III). The monoculture of Bwill instead evolve towards the SA = 0, located in the zone where species A can invade (I). As aconsequence both can grow when rare and coexist.

1999), inequality (12) leads to the conclusion that the conditions for plant coexis-tence are more stringent in the case of a positive feedback (where HS
-1<1), whilethey are more relaxed in the case of a negative plant-soil feedback.
It is important to realize that, in contrast to standard Lotka-Volterra theory,monoculture invasion conditions as those considered above do no longer provide acomplete picture of the outcome of plant competition. For example, we will demon-strate below that the two plant species can stably coexist even in cases wherecondition (12) for the mutual invasibility of the two plant monocultures is not satis-fied.
3.4. Implications for plant coexistence
In this section we employ the graphical method presented in section 3.3 to addresssome questions addressed in the literature on the implications of plant-soil interac-tion. First, we study the mechanism by which competitive oscillations emerge inthe Bever model. Second, we discuss the consequences of competitive oscillationsfor the maintenance of plant diversity. And third, we critically examine the gener-ality of results obtained by means of invasion analysis and our graphical method-ology.
3.4.1 When do plant-soil feedbacks drive community oscillations?Perhaps one of the most interesting results in Bever (2003) is a numerical exampleshowing that plant species that cannot coexist in the absence of feedback, can do soby means of competitive oscillations induced by negative plant-soil feedbacks.When running the same example, we did not find oscillations but instead conver-gence to a coexistence equilibrium. This is confirmed by a mathematical stabilityanalysis (Revilla 2009). Most probably, Bever’s Figure 3.4(C,D) is a numerical arti-fact due to the use of inappropriate integration methods. We therefore have toinvestigate anew whether and under what conditions oscillations arise in the Bevermodel.
Population cycles are frequently associated with predator-prey dynamics, butthey are also a common feature in Lotka-Volterra competition models (Gilpin 1975,May and Leonard 1975) and in resource competition models (Huisman and Weissing2001, Revilla and Weissing 2008). In these models, oscillations require at least threecompetitors such that species R outcompetes species S, S outcompetes P and Poutcompetes R, as in the Rock-Scissors-Paper game. Mathematically, the monocul-tures of R, P and S are connected by means of heteroclinic orbits, i.e. a sequence ofpaths R ➝ P ➝ S ➝ R that forms a cycle. Although the Bever model involves onlytwo plant competitors, it has in fact four monoculture states (AA,AB,BB,BA). Thisallows us to construct a heteroclinic cycle as follows.
42 Chapter 3

Consider the configuration corresponding to cases 19 or 20 in Figure 3.4, or to bemore specific case 20 as in Figure 3.6A. From the positioning of the end points ofthe feasibility arc in competition regimes I and II we can conclude that thefollowing inequalities are satisfied:
xB < cA < xA and yA < cB < yB. (13)
As discussed above, the inequalities cA < xA and cB < yB imply that both plantmonocultures can be invaded when their associated soil biota are dominant. Inother words, AA and BB are unstable against invasion. The inequalities xB < cA andyA < cB imply that the two monocultures cannot be invaded when the invader’s soilbiota is dominant. In other words, AA and BB are stable against invasion. However,as shown in Section 3.3.1, these two equilibria are not soil stable. Figure 3.6B illus-trates the potential implications of this configuration: 1. AA is competitively unstable: B invades and the system moves towards BA
2. BA is soil unstable: the system moves towards BB (where SA = 0)3. BB is competitively unstable: A invades and the system moves towards AB
4. AB is soil unstable: the system moves towards AA (where SA = 1)
43Plant-soil feedback and plant coexistence
parameter space
A B
xAxB
yB
yA
phase space
BB AB
SA=0 SA=0
I III
IV II
A
B
cA
cB
AB
IV (B grows)
IV (A grows)
BA AASA=1 SA=1
II
I
Figure 3.6 Competitive oscillations. (A) The monoculture of species A evolves from a non-invadable(I) to an invadable (II) condition, and the monoculture of B from non-invadable (II) to invadable (I);in both directions, the system passes through the zone of unstable community equilibria (IV).(B) The parameter space is mapped into a phase space where circles represent equilibria (white:unstable, gray:saddle) at the corresponding invasion zones (this mapping is explained in theAppendix). The diagonal line represents the A-B nullcline (species A grows towards the right Bgrows towards the left), and the dashed line is the soil nullcline (SA increases in the right, anddecreases in the left); their intersection corresponds to the internal equilibrium predicted in (A).Monocultures are competitively or soil stable, but not both: they are saddle points forming aheteroclinic cycle around the internal equilibrium AB which is competitively unstable. The systemoscillates permanently.
Hence one might expect the cyclic sequence AA ➝ BA ➝ BB ➝ AB ➝ AA of succes-sions or at least oscillations following this sequence.
This is confirmed by Figure 3.7 which shows the time course of the systemunder the above scenario. For Bever’s parameterization (Fig 3.7A), the systemexhibits damped oscillations that converge to a coexistence equilibrium. Byincreasing the intensity of competition, cAcB, this equilibrium becomes unstableand gives rise to a limit cycle (Fig.7B). With a further increase in competition inten-sity the cycle becomes heteroclinic, i.e. oscillations attain very low minima andmaxima for increasingly longer times (Fig 3.7C).
In Figure 3.7C, cAcB >1. As a consequence, the parameter configuration corre-sponds to case 20 in Figure 3.4, where the feasibility arc intersects parameterregion IV for mutual competitive exclusion (see also Fig 3.6A). In this region, thereexists a coexistence equilibrium, but this equilibrium is unstable. As a consequence,the above considerations concerning the monoculture equilibria tell the wholestory, and the system converges to the heteroclinic cycle AA ➝ BA ➝ BB ➝ AB ➝ AA
(see Fig 3.6B).In Figures 7A and 7B, cAcB <1 and the parameter configuration corresponds to
case 19 in Figure 3.4. Now the feasibility arc intersects parameter region III forstable competitive coexistence. In the case of pure plant competition, there exists astable coexistence equilibrium, but this equilibrium can be destabilized due to theaddition of soil dynamics. This is indeed the case if the competition intensity cAcB isjust below 1 (as in Fig 3.7B). In fact, it can be shown analytically (Revilla 2009) thatstable equilibrium coexistence (as in Fig 3.7A) is only possible if cAcB <1 – δ, whereis a positive quantity that can be calculated from the remaining system parameters.
Notice that the conditions (13) imply that HS = xByA < xAyB = HS-1, which is
only possible for HS <1 or, equivalently, JS < 0. As a consequence, the abovescenario for the development of oscillations can only occur in case of negativeplant-soil feedback. Since the analytical results of Revilla (2009) suggest that this isthe only route to oscillations in the Bever model, we conclude that competitiveoscillations will only occur if two requirements are met: (a) the plant-soil feedbackis negative; (b) the two soil-stable monoculture equilibria are mutually invadable.
3.4.2 Does negative soil feedback enhance coexistence?An important conclusion of (Bever 2003) is that net negative feedbacks enhancecoexistence and promote high diversity, while net positive feedbacks lead to exclu-sion and low diversity. This can be understood graphically as follows. In a mono-culture each species evolves towards its soil stable state, which is AA for plant A(located at the “head” of the feasibility arc) and BB for plant B (located at the “tail”of the arc). Coexistence between plant species A and B will be favored when eachplant species can invade in the monoculture of the other species, that is when eachspecies is able to grow when rare. Species A can invade a monoculture of species B
44 Chapter 3

when BB (the tail of the arc) is in zones I or III of Figure 3.2. Species B can invade amonoculture of species A when AA (the head of the arc) is in zones II or III. Inspec-tion of Figure 3.4 reveals that there are many scenarios of mutual invasion whenthe net feedback is negative (Fig 3.4 scenarios 11, 12, 13, 15, 16, 19, 20), comparedto when it is positive (Fig 3.4 scenarios 1, 2, 3). In fact, if we exclude the scenarioswhere feedback does not determine invasion (1, 2, 3, 11, 12, 13) we can see thatonly negative feedback allows mutual invasion. This supports the conclusion (Bever2003) that negative plant-soil feedback may favour the coexistence of plant species.
45Plant-soil feedback and plant coexistence
CB
0
0
1
0
100
SA
1000250 750500time
A
cAcB = 0.8673150
50plan
t den
sity
0 1000250 750500 0 1000250 750500
cAcB = 0.9849 cAcB = 1.029
Figure 3.7 Competitive oscillations due to a cyclic succession of competitive instability and soilinstability. The top row shows the densities of plant A (solid line) and B (dashed line), respectively;the bottom row depicts the density of the soil biota SA. The parameters in (a) are as in Bever’s(2003) Figure 3.4(c,d) (see below). From left to right, the competition coefficient cA is increased fromcA = 0.885 in (A) via cA = 1.005 in (B), to cA = 1.050 in (C), while cB = 0.980 in all three cases. Withincreasing intensity of competition, the asymptotic behavior of the system changes from conver-gence to a stable coexistence equilibrium in (A), via convergence to a limit cycle in (B) to conver-gence to a heteroclinic orbit in (C). In view of KA = 100, KB = 120, αA = βA = 0.10, βB = –0.20, thesoil-plant feedback is negative (JS = –0.434). Because of xA ≈ 1.36, yA ≈ 0.73, xB ≈ 0.87, yA ≈ 1.15,the conditions (13) for the cyclical succession AA ➝ BA ➝ BB ➝ AB ➝ AA are satisfied. In (A) and(B), cAcB <1 , corresponding to case 19 in Figure 3.4. In (C),cAcB >1 , corresponding to case 20.Remaining parameters: rA = 0.7, rB = 0.5, ν = 0.8.

However, this conclusion needs some qualification, since in case of negativefeedback mutual invasibility of the plant monocultures does not necessarily lead toequilibrium coexistence. Instead, oscillations can occur. If these oscillations takethe form of a limit cycle, the two plant species will still stably persist, be it not inequilibrium. But the oscillations can also take the form of a heteroclinic cycle,where the populations are repeatedly driven to very low densities. In the mathe-matical model, they still survive, but in the real world extinction would occur.Thus, in case of a heteroclinic cycle mutual invasibility of the two monocultureswill not result in long-term coexistence.
To assess the relative importance of limit cycles versus heteroclinic cycles, weinvestigated the pattern in Figure 3.7 numerically. Using continuation-bifurcationanalysis software (Ermentrout 2002) we found that as cAcB increases, regular oscil-lations start at cAcB = 0.977 (Hopf bifurcation). Already at cAcB = 0.998 these oscil-lations turn into a heteroclinic orbit. Oscillations persist until cAcB = 1.559 which isthe point at which the requirement for mutual invasion (12) does not hold anymore(the chain of heteroclinic orbits connecting the four monocultures is broken). Thus,while oscillations occur for 0.977 < cAcB < 1.559, a limit cycle does only occur forthe much smaller range 0.977 < cAcB < 0.998. About 96.4% of the parameter rangefor oscillations correspond to the occurrence of heteroclinic cycles, and, hence,eventual extinction. Accordingly, negative feedback has a much smaller potentialfor the facilitation of plant coexistence than Bever’s analysis seems to suggest. Oneshould notice, however, that in a spatial context, the risk of extinction via the large-amplitude oscillations associated with a heteroclinic cycle may be counteracted bythe repeated re-immigration of the extinct species. Under such conditions, also aheteroclinic cycle can allow the regional coexistence of the plant species.
3.4.3 Invasion requirements and coexistence requirementsWhen properly used, invasion criteria are very useful to predict the range ofdynamics that a dynamical system can possibly display. In the present context, wecan list all possible dynamics of Bever’s model (Table 3.1) by just consideringwhether AA and BB can be invaded or not (i.e. whether cA < xA, cB < yB hold or not),and the direction of the feedback (the sign of JS).
However, as illustrated by the following example an invasion analysis can alsohave its limitations. Consider the scenario in Figure 3.8a (case 5) where the feed-back is positive (JS > 0) and where cA < xA and cB < yB. In this case, criterion (12)for mutual invasibility does not hold: while plant species A is able to invade B(since cB < yB), plant species B cannot invade A (since cA < xA does not hold).However, coexistence may still be possible. As indicated in Figure 3.8A, the “tail” ofthe feasibility arc (SA > 0) lies in zone III, which means that for SA > 0 there is acompetitively stable community equilibrium. Following our previous notation, thisequilibrium will be denoted by ABB since the soil is dominated by B’s soil biota, as
46 Chapter 3

47Plant-soil feedback and plant coexistence
Table 3.1 Outcomes of plant community composition under different scenarios of plant invasionand net plant-soil feedback.
Net positive feedback Net negative feedback JS > 0 JS < 0
Both plants invade Stable coexistence with Stable coexistence with cA < xA , cB < yB SA = 1 Stable coexistence 0 < SA <1 Competitive
with SA = 0 Stable oscillations, limit cycles orcoexistence with SA = 0 heteroclinic cyclesor 1 depending on initial conditions
A invades cB < yB , A wins or stable A wins B does not cA > xA coexistence, depending on
initial conditions
B invades cA < xA B wins or stable B wins A does not cB > yB coexistence, depending on
initial conditions
None invade Winner depends on the Winner depends on thecA > xA , cB > yB initial conditions initial conditions
parameter space
A B
xBxA
yA
yB
phase space
BB AB
SA=0 SA=0
I III
IV II
A
B
cA
cB
ABB
BA AASA=1 SA=1
I
III AB
Figure 3.8 Alternative stable states (case 5 of Fig 3.4). (A) In this configuration a monoculture ofspecies A evolves from an invadable (III) to a non-invadable zone (I), whereas a monoculture of Bcan be invaded always: coexistence by means of mutual invasion is ruled out. However, there arecoexistence equilibria because the feasibility arc intersects the zone of mutual invasion (III). (B)The phase space shows the equilibria (white: unstable, black: stable, gray: saddle) and the invasionzones. The diagonal line representing the A-B nullcline (both species grow towards it) intersectsSA = 0 giving rise to the coexistence equilibrium ABB predicted in part (A). If the vertical dashedline representing the soil-nullcline (SA increases to the right, and decreases to the left) intersectsthe A-B nullcline there will be an internal equilibrium AB that is a saddle point; and depending onthe initial conditions the system moves towards the monoculture of AA dominated by A’s soil biota,or towards the coexistence equilibrium ABB dominated by B’s soil biota.

seen in Figure 3.8B. This equilibrium must be also soil stable in order to allow plantcoexistence, in other words SA must be kept at zero around the equilibrium ABB.This can only happen if the influence of plant B on its soil community relative tothat of A on its soil community (ν) is high enough, such that dSA / dt < 0 (to be moreexplicit, the ratio of plant densities in the equilibrium must be NA / NB < ν ). Thus,ABB becomes a local attractor because it is competitively stable and soil stable. Theother end point of the arc (SA =1), i.e. the “head” lies in zone I, where a coexistenceequilibrium is not possible and plant A attains a competitively stable and soil stablemonoculture AA. This is another local attractor. As a consequence, the system hastwo alternative stable states: the coexistence equilibrium ABB dominated by B’ssoil community and the soil-stable monoculture AA dominated by A’s soil commu-nity, as shown in Figure 3.8B.
In contrast, if at ABB nu is small (the density ratios are NA / NB > ν ) then ABB issoil unstable, while AA remains stable in both senses (soil and competitively). Inthis case A always wins, as predicted by the invasion criterion.
This example illustrates two things. The first is a limitation in our graphicalanalysis, which cannot address soil stability in all the cases, like it does with respectto competitive stability (in other words we cannot infer the magnitude of ν in thegraphs). Second, it shows the limitations of invasion analysis. Invasion analysis is apowerful technique for the analysis of dynamical systems in ecology and evolution(Case 2000), perhaps the best example is the classical Lotka-Volterra model wheremutual invasion and stable coexistence are synonymous. But if the model beingconsidered displays multiple equilibria and alternative stable states, as is the presentcase, it is erroneous to state that mutual invasion is a requisite for coexistence.
3.5. Discussion
In this paper we performed a more complete analysis of the Bever model (Bever2003) to get more insight in plant species coexistence and dynamics and the poten-tial role of plant-soil feedback affecting those. We found that plant species coexis-tence could be explained by an interaction between net soil feedback (JS) andcompetition strength (cA cB) between the plants, i.e., when feedback becomes morepositive competition coefficients have to be lower in order to allow plant coexis-tence. Thus more negative plant-soil feedback results in higher chances for coexis-tence. However, our analysis showed that negative plant-soil feedback alsoextended the range of plant coexistence by means of oscillations, in particular formore competitive plant species. Therefore, we conclude that negative plant-soilfeedback has the potential to enhance plant coexistence and hence plant commu-nity diversity, but for more competitive plant species it may also enhance stochasti-cally driven extinction of one of the plant species.
48 Chapter 3

Our main conclusions, that plant species coexistence is dependent on the inter-play between net plant-soil feedback and competition strength and that negativesoil feedback can enhance plant coexistence via oscillations, agree with Bever’smain conclusions (Bever 2003), however, some of our results disagreed with Bever’sfindings. First we found that Bever’s soil interaction coefficient IS does not predictnet plant-soil feedback effects right in all cases. We propose to use the soil feedbackinteraction coefficient JS. Second, we found that under positive feedbacks, ingeneral associated with species exclusion and loss of plant diversity, plant speciesare able to coexist if competition coefficients are low enough. Therefore, weconclude that mutual invasion is not a necessary requirement for coexistence, yet itdoes increase chances a lot. Third, we found a different range of parameters underwhich plant-soil interactions led to sustained oscillations in plant abundances.Although most of the insights gained from the Bever model and our new analysiscoincide, we still think we have to be careful translating these findings to the realworld. To single out the parameters that are crucial for a better understanding ofplant-soil interactions and their consequences for community dynamics and diver-sity, it would be useful to develop a more mechanistic model.
Positive plant-soil feedbacks may enhance the dominance of particular plantspecies. For example, it has been shown that the presence of arbuscular mycor-rhizal (AM) fungi may enhance the abundance of the dominant plant species,thereby reducing plant diversity (Hartnett and Wilson 1999). Moreover, exotic plantspecies that escaped from species-specific soil pathogens while still encounteringmutualistic root symbionts may be favored by positive plant-soil feedbacks in theirnew range (Klironomos 2002, Callaway et al. 2004) and as a result have the poten-tial become successful invaders. Although positive plant-soil feedbacks are gener-ally not considered to be important for coexistence of competing plant species atthe local scale (Bever 2003), several studies have shown that the presence of AMfungi may enhance plant diversity in grasslands (Grime et al. 1987, van der Heijdenet al. 1998b) by promoting seedling establishment and enhancing competitiveability of subordinate plant species (Grime et al. 1987, van der Heijden et al. 2008).
Negative plant-soil feedback has been suggested as one of the mechanisms toexplain plant species coexistence and consequently to maintain plant communitydiversity (Bever et al. 1997, van der Heijden et al. 2008). Results of different recentempirical studies, as well as a meta-analysis of more than 300 plant-soil feedbackexperiments, indeed provide evidence for this hypothesis (Bever 1994, Mills andBever 1998, De Deyn et al. 2003, Kulmatiski et al. 2008, Bradley et al. 2008). Resultsfrom the Bever-model show that negative plant-soil feedback enhanced plant coex-istence by increasing the range in which oscillations between the two plant speciesoccurred. That means that plant coexistence was possible under conditions thatwould otherwise lead to competitive exclusion of one of the two plant species, butalso oscillations occurred in situations that would otherwise lead to stable coexis-
49Plant-soil feedback and plant coexistence

tence of the two plant species. We are not aware of any empirical study directlytesting the effect of negative plant-soil feedback on plant oscillations. However,there are suggestions that soil-borne pathogens may play an important role deter-mining plant community dynamics (Olff et al. 2000), also during succession (van derPutten et al. 1993, De Deyn et al. 2003). Interestingly, our model suggests that apotential role of soil community effects on plant oscillation could be identified rela-tively easily with plant-soil feedback experiments (e.g. van der Putten et al. 1993,Bever 1994). More specifically, a necessary requirement for soil community-drivenoscillations is that both plant species lose competition when growing in soil occu-pied by their own soil community.
As illustrated in the above example, the complete set of possible scenariospresented in this study can be used to formulate hypotheses about the way soilcommunity effects drive observed plant competition dynamics. We have to becareful however to translate the findings of the Bever model to natural systems,because this model expresses soil community dynamics in a highly simplified way,i.e., the soil community is always saturated in the Bever model. Their will be a needfor more mechanistic models that describe soil community dynamics more specifi-cally and can better evaluate the consequences of plant-soil feedback effects forplant and soil community dynamics. Linking results of such models with plant-soilfeedback experiments will provide a promising approach for future empiricalresearch.
AcknowledgementsWe thank Wim van der Putten and Han Olff for comments on previous versions of the manu-script. TR was supported by a grant from the Netherlands Organization for ScientificResearch (NWO).
50 Chapter 3

Appendix: Graphical analysis
Figure 3.4 is useful for classifying and describing the main features of the dynamicsin terms of the invasion conditions. For example in cases 1, 2, 11 and 12 it is easy tosee that only one species A or B always wins, because only one of them is able togrow for any soil composition. In cases 4 and 14 any resident species will beprotected against invasion, and any equilibrium that may exist will be competi-tively unstable, for any soil composition.
However, cases 3, 5-10, 13, 15-20 are more complicated. In these situations, it issometimes useful to have a graphical representation in the familiar form of a phasespace and nullclines. Although this is possible for a three-dimensional system likethe Bever model, the following two-dimensional representation is more convenient:
51Plant-soil feedback and plant coexistence
3 (positive feedback)
BB AB
BA AA
BB AB
BA AA
BB AB
BA AA
ν
13 (negative feedback)
BB AB
BA AA
BB AB
BA AA
BB AB
BA AA
ν
5
BB AB
BA AA
BB AB
BA AA
ν
9 and 10
BB AB
BA AA
BB AB
BA AA
7
BB AB
BA AA
BB AB
BA AA
ν
15
BB AB
BA AA
BB AB
BA AA
ν
19 and 20
BB AB
BA AA
BB AB
BA AA
17
BB AB
BA AA
BB AB
BA AA
ν
A invades
B invades
stable node
unstable node
saddle point
unknown (probaly stable)?
?

The phase space is constructed according to the following rules: ● The horizontal axis indicates the plant composition: plant A is dominant on the
right, plant B on the left. The vertical axis indicates soil composition: A’s soilbiota is dominates on the top, B’s soil biota dominates on the bottom.
● The corners represent the plant monocultures, with AB,BB corresponding toSA = 0, and AA,BA corresponding to SA =1. Depending on the competitivestability conditions (7, 8, 11, 12) and their soil stability, the corners are classifiedas stable, unstable or saddle points.
● The invasion zones intersected by the feasibility arc become the domains ofattraction in the phase plot, placed in the same order as they are encountered bytraversing the arc from SA = 0 to 1 (and using the same fill patterns).
● If the arc intersects zones III or IV the corresponding domain of attraction in thephase plot is divided by a diagonal line. This line, representing coexistence equi-libria, is the plant nullcline, i.e. a nullcline for the plant composition, not theplant densities. In case of intersecting zone III, the plant composition movestowards the line (communities are competitively stable). In case of intersectionwith zone IV, the plant composition moves away from the line (communities arecompetitively unstable).
● The plane is divided by vertical that represents the non trivial soil nullcline:SA increases at the right of the line (NA > νNB in eq. 2), and decreases at the left(NA < νNB in eq. 2). The smaller the ν the bigger the portion of the plane whereSA increases, and vice versa. The top SA =1 and the bottom SA = 0 sides of theplane are trivial soil nullclines.
● A coexistence equilibrium corresponds to the intersection of the plant nullclinewith a soil nullcline, trivial or not. For this reason, there can be border equi-libria where SA = 0,SA =1 or an internal equilibrium where SA is intermediate.Depending on its location with respect to the attraction domains and the nontrivial plant nullcline, an equilibrium is declared stable, unstable or a saddlepoint.
Because of symmetry, we do not show cases 6, 8, 16 and 18 because they are quali-tatively equivalent to cases 5, 7, 17 and 18 (by swapping the “A” and “B” labels).Cases 3 and 13 are very similar in the stability of their monocultures, and becauseof having border equilibria. However, they display qualitatively different dynamics.Under net positive feedbacks (case 3) the system can display alternative stablestates: coexistence with dominance of plant A and its soil community or coexis-tence with dominance by plant B and its soil community. On the other hand, undernet negative feedbacks (case 13) there cannot be alternative stable states, and oscil-lations may develop (though we suspect they dampen out given the geometry of thenullclines).
The majority of cases under net positive feedback result in competitve exclu-sion. However, some can display alternative stable states, and coexistence
52 Chapter 3

depending on the initial conditions (5 and 6). On the other hand, the majority ofscenarios under net negative feedback promote mutual invasion and coexistence(17 and 18 are the exceptions), including coexistence through oscillations (19 and20).
53Plant-soil feedback and plant coexistence

Cha
pter
fou
r

Large vertebrate herbivores overrulenegative plant-soil feedback effects andstabilize spatiotemporal compositionof plant communities
G.F. (Ciska) Veen, Saskia de Vries, E.S. (Liesbeth) Bakker,Wim H. van der Putten, Han Olff
4
Interactions between plants, aboveground and belowground organisms haveimportant effects on the community composition and functioning of terres-trial ecosystems. Belowground interactions can be captured by measuringfeedback between plants and soil biota, however, it is poorly understoodhow large aboveground vertebrate herbivores affect plant-soil feedback andhow this influences plant community dynamics. Here we use a combinationof field and greenhouse experiments to study how plant-soil feedback mayinfluence spatiotemporal plant community patterns in the absence and pres-ence of aboveground vertebrate herbivores.
In the greenhouse we found that plants performed worse in field-collected soils pre-cultured by their own species compared to soils pre-cultured by another species, independent of cattle grazing of the soil origin.Such negative plant-soil feedback effects may increase spatiotemporal plantcommunity dynamics by altering interspecific competitive abilities resultingin local species replacements. We observed in the field that plant communitycomposition was most dynamic when large vertebrate herbivores had beenexcluded, whereas cattle grazing stabilized plant community composition inspace and time.
We suggest that plant-soil feedback has the potential to drive strongspatiotemporal plant community dynamics in natural communities, as foundin the ungrazed plots of our field experiment. However, large vertebrateherbivores seem to overrule such plant-soil feedback effects by stimulatingthe dominance of a few grazing tolerant plant species. In other words, plant-soil feedbacks seem to be conditional on the presence of larger herbivores.Therefore, to further understand the relative importance of plant-soil feed-back in natural communities, hierarchical relations between plant-soil feed-back and other ecological factors (such as environmental stress) need to beconsidered.
Abstract

Introduction
Interactions between aboveground and belowground organisms are importantdeterminants of community composition and dynamics in terrestrial ecosystems(Wardle et al. 2004). These interactions are often mediated by plants that link thespatially separated aboveground and belowground subsystems of terrestrial ecosys-tems. Plants provide organic carbon for decomposer organisms, as well as resourcesfor root and shoot herbivores, pathogens and symbiotic mutualists. In turn theseorganisms influence plant performance and thus plant community composition.Most studies that attempt to identify the biotic determinants of the structure anddynamics of whole plant communities have been either focusing on effects ofaboveground herbivores (e.g. Huntly 1991, Olff and Ritchie 1998, Adler et al. 2001)or belowground organisms (e.g. van der Putten 2003, Kardol et al. 2007, Harrisonand Bardgett 2010), although some studies have considered combined effects ofaboveground and belowground biota on plant community structure (Brown andGange 1989, Brown and Gange 1992, van Ruijven et al. 2005, Ilmarinen and Mikola2009). However, studies focusing on interactions between vertebrate herbivoresaboveground and soil organisms are hardly available. An exception is the work ofBardgett et al. (Bardgett et al. 1998) and Bardgett and Wardle (2003) who present aframework describing how plant communities respond to changes in the soildecomposer food web and accordingly in soil nutrient cycling as a result of verte-brate grazing. Here, we investigate empirically how large aboveground vertebrateherbivores and overall plant-soil feedback effects may interact as drivers ofspatiotemporal plant community dynamics. Such plant-soil feedbacks do not onlyinclude effects via nutrient cycling, but also take direct effects of for example rootherbivores into account.
Large aboveground vertebrate herbivores can enhance or reduce spatial andtemporal patterns in the vegetation depending on ecosystem productivity, herbivoreselectivity and scale of observation (Glenn et al. 1992, Adler et al. 2001, Bakker2003). Large herbivores forage at relatively large spatial scales and reduce shootbiomass of competitively dominant plant species in productive habitats (Olff et al.1997, Knapp et al. 1999). As a result, in these habitats large herbivores may pro-mote locally homogenous, but high diverse plant communities (Glenn et al. 1992,Bakker 2003, Bakker et al. 2006).
Plant species modify their biotic and abiotic environment in a species-specificway (Bever et al. 1997, Yeates 1999), which in turn affects growth and the competi-tive ability of themselves or their offspring (van der Putten and Peters 1997, Bever2003, Wardle et al. 2004, Ehrenfeld et al. 2005, Manning et al. 2008). This can becaptured by a plant-soil feedback approach, which is a two-step process whereplants influence the composition of soil communities and soil physical conditions,which in turn influences the performance plants and the composition of plant
57Vertebrate herbivores overrule plant-soil feedback

communities (Bever et al. 1997, van der Putten 2003). Plant species experiencingpositive plant-soil feedback may outcompete other plant species (Klironomos 2002,Callaway et al. 2004), which reduces local plant community diversity (Hartnett andWilson 1999, Bever 2003). In contrast, when a plant experiences negative plant-soilfeedback competitive abilities decline and other plant species may increase inabundance (van der Putten and Peters 1997, Bonanomi et al. 2005, Kardol et al.2007). Negative plant-soil feedback can result from the accumulation of plantspecies specific soil-borne pathogens and root herbivores (van der Putten et al.1993, Bever 1994, Olff et al. 2000), and can stimulate temporal and spatial replace-ment of plant species and therefore is generally thought to promote coexistence,diversity and local dynamics in the plant community (Olff et al. 2000, van derPutten 2003, Bever 2003, Kardol et al. 2006, Kulmatiski et al. 2008).
When acting in combination, different hypothesis for the effect of large above-ground herbivores on plant-soil feedback effects are possible (Bardgett and Wardle2003, Sørensen et al. 2008, Mikola et al. 2009, Ilmarinen and Mikola 2009). On theone hand, large herbivores may suppress the ability of plant species to respond toplant-soil feedback because they relax interspecific competition by removingcompetitively dominant plant species (Bengtsson et al. 1994, Olff and Ritchie 1998).Thus, large aboveground herbivores may then reduce the potential of plant-soilfeedback to drive community dynamics via effects on competitive abilities of plantspecies. Because large herbivores will generally be regulated in their population andhabitat choice on much larger spatial scales, we expect the large herbivores willsuppress small-scale effects of plant-soil feedback. Just the plant species that cantolerate aboveground grazing will dominate even though their growth may besuppressed by soil-borne pathogens. On the other hand, herbivores may alter plant-soil feedback indirectly by influencing the quality and quantity of nutrient returnto the soil (Bardgett and Wardle 2003). This can change composition (Viketoft et al.2009, Veen et al. 2010) and activity of the soil community (Holland et al. 1996,McNaughton et al. 1997a, Hamilton and Frank 2001) and may result in altered soilnutrient availability (Sørensen et al. 2008).
We use a combination of greenhouse and long-term field experiments to testeffects of aboveground herbivores on the stability of plant communities in time andspace and on the potential of soil organisms to drive spatiotemporal patterns viaplant-soil feedback. Our hypothesis is that large aboveground herbivores stabilizethe plant community in time and space (Bakker 2003), while plant-soil feedback caneither enhance or reduce stability, depending on the direction of the feedback effect.Such effects are mostly expected in the absence of large herbivores. Negative feed-back may reduce stability (Bever 2003), while we expect positive feedback to have astabilizing effect. In order to test this hypothesis, we link the abundance of plantspecies in the field to their direct growth and feedback response to field soil undercontrolled greenhouse conditions.
58 Chapter 4

Methods
Study siteWe performed our study in Junner Koeland, a 100-ha nature reserve along the riverOverijsselse Vecht in the Northeast of the Netherlands (52º32’N, 6º36’E). We carriedout our experiment on a 50-ha floodplain, which used to be flooded regularly untilcanalization of the river Vecht (around 1910) and regulation of the water level. TheJunner Koeland was common grazing land, used by farmers from the village Junne,and has been grazed extensively by livestock for centuries. Nowadays, it ismanaged as a nature reserve by the National Forestry Service (Staatsbosbeheer),and is grazed by cattle (Bos taurus) from April till November at stocking rates ofabout 0.3 animals/ha. The most abundant natural vertebrate herbivores in the areaare European rabbits (Oryctolagus caniculus) and common voles (Microtis arvalis).Dominant plant species in the grasslands are the graminoids Agrostis capillaris,Festuca rubra, Holcus lanatus, and Luzula campestris. Frequently occurring dicotsare Rumex acetosa and Trifolium repens. Also, the grasslands locally host severalendangered (red list) plant species, such as Carex caryophyllea, Dianthus deltoids,Platanthera chlorantha, Mentha pulegium, Succisa pratensis, and Thymus serpyl-lum (nomenclature follows van der Meijden 2005).
Field experimentIn 1994 we established a long-term exclosure experiment that consisted of 5randomly established blocks, with 2 different grazing treatments per block to studythe plant community response to vertebrate grazing. Each block contained a 12 ×
12m2 chicken-wire fenced exclosure plot from which cattle and rabbits wereexcluded (“Ungrazed”), and a plot of 12 × 12m2 to which all larger herbivores hadfree access (“Grazed”). Within each plot 4 permanent subplots of 2 × 2m2 wereestablished to record long-term vegetation responses to combined grazing by cattleand rabbits (see Fig 4.1). All subplots were positioned at least 1 m from the fences toavoid edge effects. In each of the 2 × 2m2 subplots, we recorded plant speciescomposition from 1995-2001 and from 2005-2008 at peak standing biomass (inJuly-august). We estimated cover of each plant species visually according to thedecimal Londo scale (Londo 1976) once a year in July.
Greenhouse experiment 1: growth potential on field soilIn greenhouse experiment 1 we tested the growth potential of four plant speciesthat were dominant in the Junner Koeland exclosure experiment. Dominant specieswere defined as species that had an average cover of >10% in one of the grazingtreatments averaged over all years and plots. Selected species were the grassesAgrostis capillaris, Festuca rubra, Holcus lanatus and the forb Rumex acetosa.Seeds of Holcus lanatus and Rumex acetosa were collected in the Junner Koeland
59Vertebrate herbivores overrule plant-soil feedback
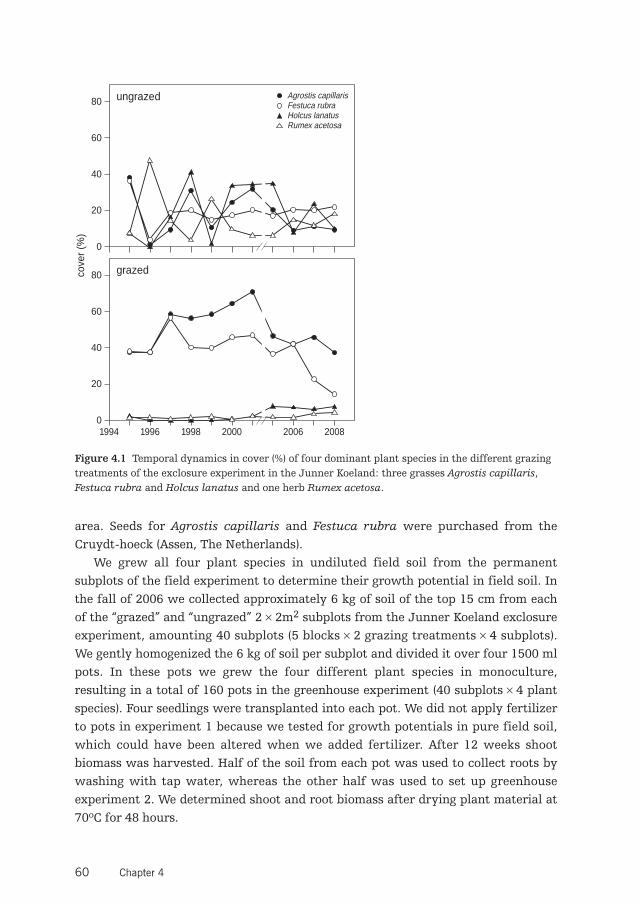
area. Seeds for Agrostis capillaris and Festuca rubra were purchased from theCruydt-hoeck (Assen, The Netherlands).
We grew all four plant species in undiluted field soil from the permanentsubplots of the field experiment to determine their growth potential in field soil. Inthe fall of 2006 we collected approximately 6 kg of soil of the top 15 cm from eachof the “grazed” and “ungrazed” 2 × 2m2 subplots from the Junner Koeland exclosureexperiment, amounting 40 subplots (5 blocks × 2 grazing treatments × 4 subplots).We gently homogenized the 6 kg of soil per subplot and divided it over four 1500 mlpots. In these pots we grew the four different plant species in monoculture,resulting in a total of 160 pots in the greenhouse experiment (40 subplots × 4 plantspecies). Four seedlings were transplanted into each pot. We did not apply fertilizerto pots in experiment 1 because we tested for growth potentials in pure field soil,which could have been altered when we added fertilizer. After 12 weeks shootbiomass was harvested. Half of the soil from each pot was used to collect roots bywashing with tap water, whereas the other half was used to set up greenhouseexperiment 2. We determined shoot and root biomass after drying plant material at70ºC for 48 hours.
60 Chapter 4
0
20
40
60
80cove
r (%
)
1994 2000
grazed
1996 1998 2006 2008
0
20
40
60
80 ungrazed Agrostis capillarisFestuca rubraHolcus lanatusRumex acetosa
Figure 4.1 Temporal dynamics in cover (%) of four dominant plant species in the different grazingtreatments of the exclosure experiment in the Junner Koeland: three grasses Agrostis capillaris,Festuca rubra and Holcus lanatus and one herb Rumex acetosa.

Greenhouse experiment 2: plant-soil feedbackIn greenhouse experiment 2 we tested plant-soil feedback of the four plant speciesthat were also used in experiment 1. Experiment 2 consisted of two differentgrowing phases: a soil conditioning phase and a feedback phase (Brinkman et al.2010). During the soil conditioning phase we let the plants build up a species-specific soil community. From the remaining half of each pot from greenhouseexperiment 1 we collected 500 g of soil that was gently mixed with 500 g of steril-ized field soil (γ-irradiation, 25 kGy, which eliminates all soil biota). A subsample of25 g was collected to determine soil moisture content of the mixed soil andremaining 975 g of soil was placed in 1500 ml pots. Each pot was planted with thesame plant species as in experiment 1 to further build up its species-specific soilcommunity. Plants were planted in monoculture using 3 seedlings per pot. After 10weeks aboveground biomass was harvested and dried at 70ºC for 48 hours. In thesoil conditioning phase we added sterilized soil which is known to have enhancedlevels of available nitrogen and phosphate (Olff et al. 2000). Therefore, we did notapply fertilizer to the plants in this phase of experiment 2.
In the second phase of experiment 2 we tested for plant-soil feedback effectsusing soil from the conditioning phase of experiment 2. We grew plants in soils pre-conditioned with their own species (“home”) or in soils pre-conditioned with theother three species (“foreign”). Home conditions were created by collecting andgently homogenizing half of the soil from each pot containing the soil community ofone specific plant species. Foreign soils were created by gently mixing soils fromeach of the other three plant species, in a 1:1:1 ratio. During soil preparation, wemade sure to keep the soils from the same field subplots together. All theseprepared soil samples were placed individually in pots of 750 ml. All plant specieswere grown in home and foreign soils, using 1 seedling per pot. In total the experi-ment consisted of 320 pots (40 subplots × 4 plant species × 2 soil (home and foreign)origins). In the feedback phase of experiment 2 we added a limited amount of nutri-ents to prevent nutrient limitation, but to interfere as little as possible with plant-soil feedback effects. From week 4 onwards we added 25 ml 25%-Hoagland solutionevery 2 weeks, which is relatively low when compared to the plant needs in suchgrowth conditions (van der Putten and Peters 1997). Shoots and roots wereharvested after 10 weeks. We determined shoot and root biomass after drying plantmaterial at 70ºC for 48 hours.
Greenhouse experiment 1 and 2: seedling germination and growth conditionsSeeds of the plant species used in both greenhouse experiments were germinated onglass beads in plastic containers in the greenhouse three weeks prior to the start ofeach experiment. After three weeks plants were transplanted into pots that wereplaced in the greenhouse at day/night rhythm of 15/9h at temperatures of 21/15ºC.Soil moisture content in all pots was kept constant at 25% w/w by watering 2–3
61Vertebrate herbivores overrule plant-soil feedback

times per week using demineralized water. To account for light and temperaturedifferences within the greenhouse the position of the pots was randomized once aweek. Pots were arranged in the greenhouse according to the experimental designin the field, i.e. pots containing soil from the same subplot and block were keptclose together in the greenhouse.
Soil biotic and abiotic propertiesAfter gentle homogenization of the soil from each subplot we collected onesubsample of 100 g to determine soil abiotic properties. We determined soil mois-ture content as the weight loss after drying soil at 105ºC for 24 hrs. To measure pHwe dissolved 15g of soil in 20 ml demineralized water and measured the sampleswith a Sentron pH meter. We determined soil organic matter content (SOM) of drysoil samples (achieved by drying for 24 hrs at 105ºC) by loss-on-ignition at 550ºCfor 3 hrs. SOM was expressed as the relative weight difference before and afterignition. We determined soil texture in freeze-dried soil as volume % particle sizeclasses. The freeze-dried soil was first dispersed by ultrasonification and subse-quently analyzed with a coulter counter LS230 (fluid module; Beckman CoulterInc., USA). Additionally, we collected 2 PVC cylinders filled with soil (diameter 4.3cm, length 16 cm) to measure potential nitrogen (N) mineralization rates. Wehomogenized soil from half of all tubes within 24 hrs after collection to measureconcentrations of inorganic nitrogen (NO3- and NH4+). The remaining tubes werekept at 21ºC and constant soil moisture levels for 6 weeks. After 6 weeks the soilwas homogenized and extractable levels of NO3- and NH4+ were measured again.The differences between the first and second analysis yield potential mineralizationrates per subplot (Olff et al. 1994). To determine NO3- and NH4+ concentrations 25gof soil was dissolved in 60 ml 1M KCl. Concentrations were determined colorimetri-cally with a Flow Solution Autoanalyzer (Skalar, The Netherlands).
Data analysisWe focus our data analysis on the four dominant plant species in the JunnerKoeland exclosure experiment to be able to compare between field and greenhousedata. For each of the four dominant plant species we calculated temporal andspatial stability in the field experiment. Temporal stability was the average cover ofa plant species over different years in an individual plot divided by the standarddeviation (Bezemer and van der Putten 2007). We used a general linear mixed modelwith temporal stability as response variable and plant species and grazing treat-ment as fixed factors. Subplot nested within grazing treatment within block wasused as a random factor (specified in R as block/grazing). Spatial stability was theaverage cover of a plant species over the four subplots within one grazing treat-ment within a block divided by the standard deviation. Hence, we had one value forspatial stability per grazing treatment within a block, resulting in 5 replicate spatial
62 Chapter 4

stability measures per grazing treatment for each year. To test spatial stability weused a general linear mixed model with spatial stability as response variable,grazing treatment and plant species as fixed factors, and block nested within yearas a random factor (specified in R as year/block).
The growth potential of each plant species in field soil (greenhouse experiment1) was determined as total biomass production per pot (root + shoot biomass) in thegreenhouse. We used regression analyses to determine the relationship betweengreenhouse biomass production and field abundance. In a previous study carriedout in the same year and same field plots as the present study we determined soilnematode community composition (Veen et al. 2010). We used the nematode abun-dance data from this study to determine the relationship between biomass produc-tion in the greenhouse and the number of plant feeding nematodes in the soil byregression analysis. We used multiple regression analyses to relate biomass produc-tion in the greenhouse to soil abiotic properties. Data were log-transformed whennecessary to obtain normality.
Plant-soil feedback effects were determined by comparing biomass productionon home and foreign soil of each plant species in growing phase 3 of the greenhouseexperiment. We calculated plant-soil feedback as: ln (biomass home soil/biomassforeign soil) (Brinkman et al. 2010). A negative value indicates that plants perform-ed worse on home soil than on foreign soil, a positive value indicates that plantsperformed better on home soil than on foreign soil. We performed one-samplet-tests to test whether potential feedback effects were significantly different fromzero, i.e. whether there was a significant positive or negative feedback. Weperformed a general linear mixed model to test whether potential feedback effectswere different in grazed and ungrazed soils. We used plant species and grazing asfixed factors and block as a random factor (specified in R as block/ grazing). Weused regression analyses to determine the relationship between plant-soil feedbackin the greenhouse and stability of a plant species in the field.
All data were analyzed using R, version 2.10.0. The lme4 package (Bates andMaechler 2009) was used to calculate general linear mixed models, using maximumlikelihood estimation. To determine effects of our fixed factors we compared modelswith and without the variable of interest (Crawley 2007) using a chi-square teststatistic. When interaction effects were significant we do not report the effects ofthe main factors (Crawley 2007).
Results
Temporal and spatial plant community stabilityTemporal and spatial stability of the four dominant plant species in the field experi-ment were affected by an interaction between grazing treatment and plant species
63Vertebrate herbivores overrule plant-soil feedback

(temporal Fig 4.2a: χ2=116.17, P < 0.001, df=3; spatial Fig 4.3: χ2=59.85, P < 0.001,df=3). Agrostis capillaris, Festuca rubra and Rumex acetosa were more stable overtime under large herbivore grazing, while Holcus lanatus was fluctuating in bothgrazed and ungrazed plant communities (Fig 4.1 and 2A). In space, Agrostis capil-laris and Festuca rubra were more stable in grazed than in ungrazed subplots.Holcus lanatus and Rumex acetosa were less stable, irrespective of the grazingtreatment (Fig 4.3). These results indicate that aboveground vertebrate grazersstabilized the plant community in time and space, mainly by promoting thestability of Agrostis capillaris and Festuca rubra. Consequently, small-scalespatiotemporal plant community heterogeneity arises in the absence of grazing.
64 Chapter 4
0
1
2
3
4
tem
pora
l sta
bilit
y(a
vera
ge/s
tand
ard
devi
atio
n)
Agrostis
A
B
ungrazedgrazed
de
a
*
Festuca
cd
b
P<0.1
Holcus
ede
* *
Rumex
de
c
* *
-2.0
-1.5
-1.0
-0.5
0.0
feed
back
effe
ct
P<0.1
b
a
b
ab
b
ab
ab
ab
Figure 4.2 (A) Temporal stability (average over all years/standard deviation over all years) for thefour dominant plant species in the different grazing treatments of the exclosure experiment in theJunner Koeland: three grasses Agrostis capillaris, Festuca rubra and Holcus lanatus and one herbRumex acetosa. Error bars display standard errors. Different letters indicate significant differencesat P < 0.05. (B) Feedback effects for the four dominant grass species in the Junner Koeland. Feed-back is expressed as the natural logarithm of the division between biomass produced on home soiland on foreign soil. Error bars display standard errors. Different letters indicate significant differ-ences between bars at P < 0.05. Asterisks above bars indicate feedback effects significantlydiffering from zero at P < 0.05.
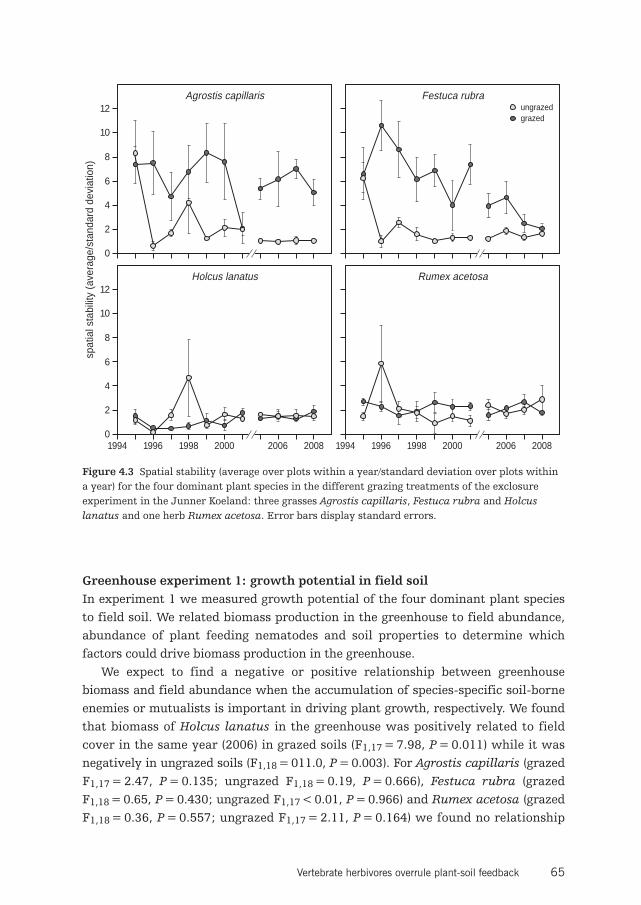
Greenhouse experiment 1: growth potential in field soilIn experiment 1 we measured growth potential of the four dominant plant speciesto field soil. We related biomass production in the greenhouse to field abundance,abundance of plant feeding nematodes and soil properties to determine whichfactors could drive biomass production in the greenhouse.
We expect to find a negative or positive relationship between greenhousebiomass and field abundance when the accumulation of species-specific soil-borneenemies or mutualists is important in driving plant growth, respectively. We foundthat biomass of Holcus lanatus in the greenhouse was positively related to fieldcover in the same year (2006) in grazed soils (F1,17 = 7.98, P = 0.011) while it wasnegatively in ungrazed soils (F1,18 = 011.0, P = 0.003). For Agrostis capillaris (grazedF1,17 = 2.47, P = 0.135; ungrazed F1,18 = 0.19, P = 0.666), Festuca rubra (grazedF1,18 = 0.65, P = 0.430; ungrazed F1,17 < 0.01, P = 0.966) and Rumex acetosa (grazedF1,18 = 0.36, P = 0.557; ungrazed F1,17 = 2.11, P = 0.164) we found no relationship
65Vertebrate herbivores overrule plant-soil feedback
0
2
4
6
8
spat
ial s
tabi
lity
(ave
rage
/sta
ndar
d de
viat
ion)
1994 2000
Holcus lanatus
1996 1998 2006 2008
10
12
grazedungrazed
0
2
4
6
8
Agrostis capillaris
10
12
1994 2000
Rumex acetosa
1996 1998 2006 2008
Festuca rubra
Figure 4.3 Spatial stability (average over plots within a year/standard deviation over plots withina year) for the four dominant plant species in the different grazing treatments of the exclosureexperiment in the Junner Koeland: three grasses Agrostis capillaris, Festuca rubra and Holcuslanatus and one herb Rumex acetosa. Error bars display standard errors.

between greenhouse biomass and field abundance. We also tested whether green-house performance was related to field abundance in the year before (2005) andafter (2007) the experiment, to quantify potential legacy effects of the soil commu-nity, or impacts still-to-come. Using the field data from the year before soilsampling, we found a positive relationship between biomass in the greenhouse andpercentage cover in the field in grazed soils for Holcus lanatus (F1,17 = 13.84,P = 0.002) and Rumex acetosa (F1,17 = 9.65, P = 0.006), and a negative relationshipfor Agrostis capillaris (F1,17 = 7.33, P = 0.015). In contrast, in ungrazed soils Holcuslanatus biomass production was negatively related to field cover (F1,18 = 11.5,P = 0.003), while Agrostis capillaris biomass production was positively related tofield cover (F1,18 = 5.20, P = 0.035). For 2007, we only found a positive relationshipbetween biomass production and field cover of Holcus lanatus (F1,17 = 7.30,P = 0.015). Lumping all species together, we did not find a general relationshipbetween biomass production in the greenhouse and plant abundance in the field.
In soils from grazed plant communities, we found a negative relationshipbetween greenhouse biomass and the number of plant feeding nematodes in the soilfor Holcus lanatus (F1,17 = 4.56, P = 0.048) and for Rumex acetosa (F1,18 = 8.15,P = 0.011). However, Agrostis capillaris (F1,17 = 2.44, P = 0.136) and Festuca rubra(F1,17 = 2.16, P = 0.159) did not show a clear relationship. In soils from ungrazedplant communities the relationships between plant biomass and plant-feedingnematodes were less strong for all four species (P >> 0.05). Again, these data didnot show a general link between greenhouse and field results for all plant species,
66 Chapter 4
Table 4.1 Results of multiple regression analysis on the relationship greenhouse biomass and keysoil abiotic properties.
Plant species pH SOM Potential N min.
t P t P t P
Grazed soils
Agrostis capillaris 2.16 0.047 * -1.26 0.229 1.62 0.126
Festuca rubra 1.74 0.102 -1.54 0.142 0.12 0.904
Holcus lanatus 0.74 0.469 -3.69 0.002 ** -1.77 0.098 .
Rumex acetosa 2.97 0.009 ** -2.75 0.014 * 0.03 0.980
Ungrazed soils
Agrostis capillaris -2.12 0.050 * -2.84 0.012 * 0.80 0.437
Festuca rubra 0.32 0.752 0.40 0.697 2.19 0.045 *
Holcus lanatus 3.45 0.003 ** -4.92 <0.001 *** -0.52 0.608
Rumex acetosa 1.04 0.315 -1.69 0.113 -0.35 0.728
Degrees of freedom (df) = 16 for Festuca and Rumex in grazed soils and for Agrostis and Holcus in ungrazedsoils. For other tests df = 15, because of missing data due to plant death in the greenhouse experiment.

however they indicate that in some cases the presence of soil-borne biota mayreduce plant production.
We found species-specific relationships between growth potential of the plantspecies and soil abiotic properties (Table 4.1). The biomass of Agrostis capillaris andRumex acetosa in soils from grazed plant communities and Holcus lanatus in bothsoils was increasing towards higher pH soils, while biomass of Agrostis capillaris inungrazed soil decreased towards higher pH. We found a negative relationshipbetween SOM content and greenhouse biomass in grazed soils for Holcus lanatusand Rumex acetosa and in ungrazed soils for Agrostis capillaris and Holcus lanatus.Potential N mineralization rate showed a positive relationship with Festuca rubrabiomass in soils from ungrazed plant communities only.
Greenhouse experiment 2: plant-soil feedbackIn greenhouse experiment 2 we tested for plant-soil feedback effects in pre-condi-tioned soil from the different grazing treatments. We found that plant-soil feedbackwas affected by an interaction between grazing treatment and plant species(χ2 = 9.24, P = 0.026, df = 3). For Agrostis capillaris plant-soil feedback effects werestronger in grazed than in ungrazed soils, while for the other three plant speciesthere were no significant differences between grazing treatments (Fig 4.2B).
We found significant negative plant-soil feedback effects for Agrostis capillaris(t = –3.48, P = 0.003, df = 19) in soils from grazed plant communities and for Holcuslanatus (grazed, t = –5.16, P < 0.001, df = 19; ungrazed, t = –4.29, P < 0.001, df = 18)and Rumex acetosa in both soils (grazed, t = –4.66, P < 0.001, df = 18; ungrazed,t = –4.06, P < 0.001, df = 19). Feedback effects for Festuca rubra also tended to benegative in both soils (grazed, t = –1.94, P = 0.067, df = 19; ungrazed, t = –1.74,P = 0.099, df = 18). Feedback effects in soils from ungrazed plant communities forAgrostis capillaris (t = –1.13, P = 0.272, df = 19) were not significantly differentfrom zero (Fig 4.2B). The results from experiment 2 show that all plant speciesexperience negative plant-soil feedback, which is generally not dependent on thegrazing origin of the soil.
Discussion
In the greenhouse experiment we found that all plant species performed worse insoils incubated with their own plant species compared to soils incubated with otherplant species. This indicated a general negative plant-soil feedback (Brinkman et al.2010) for all species in both grazing treatments. Negative plant-soil feedback mayresult from the accumulation of species-specific plant pathogens and herbivoresand can reduce competitive abilities of specific plant species (van der Putten et al.1993, Bever et al. 1997, Olff et al. 2000). Therefore, in both grazing treatments soil
67Vertebrate herbivores overrule plant-soil feedback

organisms are potential drivers of small-scale spatiotemporal plant communitypatterns by locally enhancing competitive replacement of plant species (Olff et al.2000, van der Putten 2003, Bever 2003). Yet, our field results showed that localplant community composition was highly stabilized by cattle grazing, despite theobservation that the dominant species clearly were subject to negative plant-soilfeedback. Such stabilizing effects of large herbivores on plant community composi-tion are well known (Glenn et al. 1992, Adler et al. 2001, Bakker 2003), but have notbeen viewed before in the light of plant-soil feedback. Our results showed thatcattle grazing apparently overruled the negative plant-soil feedback effects thatwere present in this community. The grazing-tolerant plant species Agrostis capil-laris and Festuca rubra reached high abundances and remained the most stableover space and time in grazed plots although both species differed strongly in theirsoil feedback. Plant-soil feedback for Festuca did not differ significantly from zeroand this plant species was relatively stable over time and space under grazed condi-tions. In contrast, Agrostis was also stable in grazed plots, even more than Festuca,while it experienced the strongest negative plant-soil feedback of all plant speciestested in soils originating from grazed plots (Fig 4.2B). Therefore, the experimen-tally inferred feedback strength did not explain the temporal stability of thesespecies in the field.
Our results suggest that vertebrate grazers overrule plant-soil feedback effects;so that species with a strong negative plant-soil feedback can still become abundantand remain stable when tolerant to aboveground grazing. This may be becausetheir successors in the community (species that are insensitive to the soil commu-nity of the species they replace) are more sensitive to aboveground biomass loss(grazing intolerant). Large vertebrate grazers often exert a homogeneous grazingpressure over relatively large spatial scales (Ritchie and Olff 1999, Haskell et al.2002), at least compared to the scale at which soil organisms and individual plantsusually operate. At these large scales aboveground vertebrate grazers have beenfound to prevent competitive exclusion between plants by removal of some poten-tial dominant grassland species (Olff et al. 1997, Olff and Ritchie 1998) and promotethe abundance of several grazing-tolerant (Olff et al. 1997) or subordinate plantspecies (Knapp et al. 1999). When grazers exert a strong control on the plantcommunity composition, tolerance of plants to aboveground grazers may thus bemore important as a factor determining plant abundance than plant tolerance tonegative feedback with soil communities. Therefore, grazing-tolerant plants mayperform better under grazing than plant species that are less grazing-tolerant, evenwhen they experience a reduction in competitive ability by negative plant-soil feed-back, as in the case of Agrostis capillaris.
Alternatively, tolerance to negative plant-soil feedback may be dependent on theplant species identity (Verschoor et al. 2002, De Deyn et al. 2003). Consequently,plants that become dominant under grazing could be tolerant to plant-soil feed-
68 Chapter 4

back. Similar mechanisms, such as high plant growth rates and flexible resourceallocation (Strauss and Agrawal 1999) can be favorable to become tolerant to bothaboveground grazers as well as root herbivores and pathogens. Therefore, it maywell be that the same species can grow well under grazing conditions by bothaboveground and belowground herbivores, which may result in stable abundancesof these species in grazed grasslands. Our results showed that biomass productionof the grazing-intolerant plant species Holcus lanatus and Rumex acetosa wasreduced when the number of plant feeding nematodes increased, while this was notthe case for the more grazing-tolerant species Agrostis capillaris and Festuca rubra.This indicates that plant species which are tolerant to aboveground grazing mayalso be more tolerant to belowground herbivores. Agrostis capillaris and Festucarubra are also longer-lived than Holcus lanatus and Rumex acetosa, as a result ofwhich it becomes more useful to be tolerant to soil-borne herbivores.
Large vertebrate grazers may not only overrule plant-soil feedback effects; theymay also modify the strength of plant-soil feedback effects (Sørensen et al. 2008), atleast in the case of Agrostis. This could be due to alteration of the quality and quan-tity of resource input into the soil, which changes the activity and composition ofthe soil community (Holland et al. 1996, McNaughton et al. 1997a, Bardgett andWardle 2003). Also, aboveground grazers may alter the soil community compositionindirectly through modifying the plant community composition (Veen et al. 2010),or by modifying soil physical conditions (Hobbs 1996). Plant species may respond tothe altered soil community because they are more or less sensitive to the soil organ-isms that become more abundant. Moreover, an altered composition of the soilcommunity may lead to changes in top-down control on belowground herbivores orpathogens by their enemies, resulting in a different pressure of soil-bornepathogens.
In spite of aboveground vertebrate herbivores which exert a strong control onplant community stability (Bakker 2003), negative plant-soil feedback may stillcontribute to drive plant community dynamics in grasslands in the absence ofaboveground vertebrate grazing. We found that in ungrazed plots the plant commu-nity was less stable, with alternating high and low abundances between years andplots for the four dominant plant species. Particularly, plant species that becomedominant in ungrazed situations, i.e. Holcus lanatus and Rumex acetosa, experi-enced negative plant-soil feedback in soils originating from ungrazed situations.Negative plant-soil feedback may contribute to the replacement of plant species(van der Putten 2003, Bever 2003). Previous studies showed that root herbivorescan reduce the total net primary production (NPP) in grasslands up to 30% (Stanton1988), and that this may vary between 1–40% depending on local abundances ofroot feeders (Verschoor 2002). Therefore, soil-borne herbivores may contribute toreduced spatiotemporal plant community stability by locally removing primaryproduction.
69Vertebrate herbivores overrule plant-soil feedback

When negative plant-soil feedback is important in driving natural plant commu-nities (Kulmatiski et al. 2008), we expected plants in the greenhouse to performworse in soils collected from field plots where their own species had been abundantdue to accumulation of species-specific soil-borne pathogens and root herbivores(van der Putten et al. 1993, Olff et al. 2000, Klironomos 2002, Bever 2003).However, we could not establish a direct, clear link between plant cover in the fieldand biomass production in the greenhouse. This may be due to differences in scalebetween the field and greenhouse study. Field data were collected on the plot level,while plant-soil feedback effects take place at the scale of individual plants. Also,effects that play out over longer time scales such as the influence of arbuscularmycorrhizal fungi and decomposers were not included in our experiment (Hart etal. 2003, Casper and Castelli 2007, Harrison and Bardgett 2010). Alternatively, inthe field plant-soil feedback effects may be modified by variation in biotic andabiotic environmental variables, such as soil type (Bezemer et al. 2006), soilnitrogen availability (Manning et al. 2008) and competitive interactions betweenplant species (Kardol et al. 2007, Casper and Castelli 2007). Our greenhouse dataindeed revealed that soil abiotic properties affected plant biomass production, andhence may be interfering with effects of soil biota on plant growth. The responsesof plant species to soil abiotic properties were not consistent across grazing treat-ments, which implies that also other factors in the soil, such as the presence of soilorganisms, may affect plant growth as well. Consequently, the relative importanceof plant-soil feedback in grazed, natural grasslands remains poorly understood.More field studies are needed quantifying the role of plant-soil feedback structuringnatural grasslands (Casper and Castelli 2007, Harrison and Bardgett 2010), particu-larly in the presence of vertebrate grazers.
ConclusionOur findings support the idea that negative plant-soil feedback can be importantfor structuring plant communities (Wardle et al. 2004, Kulmatiski et al. 2008,Mangan et al. 2010), but we show that in the field plant-soil feedback effects maybe modified or overruled by aboveground vertebrate herbivores. The strong stabi-lizing control of aboveground herbivores on the local plant community may ruleout the opportunities for soil organisms to enhance small-scale spatiotemporalplant community dynamics in grazed situations. Consequently, a strong negativeplant-soil feedback does not necessarily result in replacement of plant species andhence in cyclic plant community dynamics (Bever 2003) in the presence of above-ground vertebrate grazers. This suggests that in grassland ecosystems soil organ-isms have more opportunities to drive spatiotemporal dynamics in the absence ofaboveground vertebrate herbivores than when these herbivores are present.
70 Chapter 4

AcknowledgementsWe would like to thank Maurits Gleichmann, Yzaak de Vries, Verena Cordlandwehr, HarryOffringa and Carmen van der Veen for their help with collection of field data. Thanks toNelly Eck and Jacob Hogendorf for technical assistance in the laboratory and greenhouse.We are grateful to the National Forest Service (Staatsbosbeheer) for permission to performour field work in the “Junner Koeland nature reserve”.
71Vertebrate herbivores overrule plant-soil feedback

Cha
pter
fiv
e

Interactive effects of soil-dwelling antsand aboveground vertebrate grazers on localplant community composition
G.F. (Ciska) Veen, H. Olff
5

Interactions between aboveground and belowground organisms have beenacknowledged as important drivers of plant community structure andcomposition. Most studies focused on effects of such interactions on singleplant species, while the consequences for mixed plant communities are lesswell examined. In this study we investigate the consequences of interactionsbetween subterranean yellow meadow ants (Lasius flavus) and simulatedcattle grazing on biomass production and species composition in plantcommunities. We set up a greenhouse experiment using 10-l pots with intactsoil cores with their associated vegetation. In a full factorial design, westudied effects of simulated grazing (clipping), ant mound presence and theactual presence of ants themselves on changes in plant community structureand composition.
We found that plant biomass production on the short term was affectedby an interaction between simulated grazing and ant mound presence.Grazing homogenized production on and off ant mounds, while productionwas increased off mounds only after the cessation of grazing. Biomassproduction on the longer term, as well as plant species richness and plantcommunity composition during the whole experimental period wereexplained by simulated grazing only. Simulated grazing reduced long-termbiomass production, enhanced the cover of grazing-tolerant plant species,and maintained higher plant species richness. The actual presence of yellowmeadow ants did not affect biomass production and plant communitycomposition.
We conclude that simulated grazing may overrule effects of ant moundson plant biomass production. However, since biomass production shortlyafter the cessation of grazing was affected by ant mound presence, ourresults suggest that under low intensity grazing ant mounds may becomeimportant determining plant production. In such situations the interactionbetween ant mounds and grazing can potentially drive small-scale plantcommunity structure and composition.
Abstract

Introduction
Aboveground and belowground components of terrestrial ecosystems are linked byplants. Consequently, the interaction between aboveground and belowgroundorganisms is an important driver of plant community composition and structure(Wardle et al. 2004). Aboveground and belowground herbivores directly removeplant biomass, thereby altering the competitive ability of plant species and henceplant community composition (van der Putten and Peters 1997, Olff and Ritchie1998). Moreover, aboveground-belowground interactions modify soil nutrientcycling which feeds back to plant growth and community composition (Bardgettand Wardle 2003).
Most studies on aboveground-belowground interactions have focused organismsaffecting single plant species (e.g. Gange and Brown 1989, Masters and Brown1992, Masters 1995, Gange and Nice 1997, Bezemer et al. 2003, Soler et al. 2005,Soler et al. 2007). However, recent work suggests that interspecific competitionbetween plants can modify effects of belowground organisms (Kardol et al. 2007,Casper and Castelli 2007). Therefore, to understand the importance of above-ground-belowground interactions structuring plant communities it is essential tostudy whole communities (Harrison and Bardgett 2010).
In our study we focus on interactive effects of subterranean yellow meadowants (Lasius flavus) and aboveground vertebrate herbivores on structure andcomposition of plant communities. Yellow meadow ants are ecosystem engineersthat modify biotic and abiotic soil properties (Jones et al. 1994). They dig up freshsand to build nest mounds and thereby they create open, competition-free spacethat can be colonized by plants (King 1977b). Moreover, digging modifies abiotic soilconditions (such as pH, organic matter content, temperature and water avail-ability), changes soil community composition and reduces abundances of plant-parasitic pathogens (Blomqvist et al. 2000, Dauber and Wolters 2000, Dostal et al.2005). Also, ants ‘farm’ root aphids (which are root sap suckers) in their nestmounds, from which they harvest honey dew excretion (Pontin 1978), and whichthey consume as well. All these changes in biotic and abiotic environmental condi-tions induced by yellow meadow ants affect plant species directly and indirectlyand can alter the plant community composition on mounds (e.g. King 1977a, 1977b,Dean et al. 1997, Blomqvist et al. 2000). Both King (1977b) and Blomqvist et al(2000) showed that yellow meadow ants interact with aboveground vertebrategrazers. When tall grasses become dominant in the absence of vertebrate grazingants become more active and build higher mounds to keep up with the vegetationheight. This is probably done to maintain sufficient solar radiation reaching the soilsurface, and thus regulate the temperature in the mound. In turn, altered antactivity and mound structure may influence plant growth. We expect that the inter-action between vertebrate grazing and yellow meadow ants will be important in
75Simulated grazing and yellow meadow ants

determining small-scale plant community structure and composition. We tested ourhypothesis by addressing the following questions (1) how does the interactionbetween ants and aboveground biomass removal affect structure and compositionof a grassland plant community?, and (2) do ants alter plant community structurepredominantly by building nest mounds (and their associated effects on soil proper-ties) or does the actual presence of the ants themselves affect the plant communityas well (for example by tending root aphids)?
We set up a greenhouse experiment by collecting intact soil cores and their asso-ciated plant communities from the field. In a full factorial design, we studiedeffects of simulated grazing (clipping), ant mound presence and the actual presenceof ants themselves (ants were removed or not by poison addition) on changes inplant community structure and composition. During 9 months we measuredbiomass production and plant community composition.
Methods
Study siteWe set up a greenhouse experiment using soil cores from Junner Koeland, a 100-hanature reserve along the river Overijsselse Vecht (52º32’N, 6º36’E). The JunnerKoeland consists of a 50-ha floodplain area and of a heathland area. The floodplainarea was flooded regularly until 1910 when the river Vecht was canalized. The areahas been used as common grazing land by farmers from the village Junne, and hasbeen grazed extensively by livestock for centuries. Nowadays, it is managed as anature reserve by the National Forestry Service (Staatsbosbeheer), and is grazed bycattle (Bos taurus) from April till November at stocking rates of about 0.3 animals/ha. The most abundant natural vertebrate herbivores in the area are Europeanrabbits (Oryctolagus caniculus) and common voles (Microtis arvalis). Dominantplant species in the grasslands are the graminoids Agrostis capillaris, Festuca rubra,Holcus lanatus, and Luzula campestris. Frequently occurring dicots are Rumexacetosa and Trifolium repens. Also, the grasslands locally host several endangeredplant species, such as Dianthus deltoids, Succisa pratensis, Thymus serpyllum andMentha pulegium (nomenclature follows van der Meijden 2005). Yellow meadowants (Lasius flavus) are abundant subterranean invertebrates in the floodplainareas of Junner Koeland nature reserve. The soil consists of the loamy sand thathas been deposited there by the river. The site is flooded on an irregular basis (onceevery few years). The ants build obvious nest mounds by digging up fresh sandfrom deeper soil layers thereby changing biotic and abiotic soil properties (e.g. Deanet al. 1997, Blomqvist et al. 2000). In their nests, ants mutually live together withcertain species of root aphids, which are root herbivores that feed on phloem sap ofplants (Pontin 1978, Stadler and Dixon 2005). This can be viewed as an obligate
76 Chapter 5

symbiosis. The aphids excrete honeydew that serves as an important food sourcefor yellow meadow ants, and in return the ants tend these aphids in their nests byprotecting them from enemies, cleaning them from microbes and moving them tosuitable root sites (Pontin 1978, Stadler and Dixon 2005).
Experimental set upIn the Junner Koeland nature reserve we laid out a randomized block design for thecollection of soil samples, consisting of 6 blocks of 5 by 5 meter in the cattle-grazedfloodplain grassland. In September 2006 we randomly collected 4 paired soil coresof 10-l with a depth of approximately 30 cm, totaling 48 soil cores (6 blocks × 4pairs). One of the soil cores consisted of a whole ant mound and the other of matrixsoil. The cores were left intact and put into 10-litre pots.
We used these soil cores to set up a full factorial greenhouse experiment testingthree factors. (1) Clipping of aboveground biomass. In half of our pots abovegroundbiomass was clipped homogeneously every 2 weeks to a height of approximately 4cm to simulate repeated cattle grazing during the growing season. In the other halfbiomass was clipped every 3 months to prevent pots becoming limited for plantgrowth. (2) Presence of ant mounds. Half of the soil cores collected in the fieldcontained an ant colony. We collected small, probably young colonies, including thequeen, to be able to maintain complete colonies with its associated vegetation inthe 10-l pots. The other half of the pots contained soil cores that consisted of matrixsoil with its associated vegetation. (3) Presence of ants. To half of the ant mounds weadded ant poison baits (0.1% trichloorfenaldehyde). For this we placed 5 15-mlplastic cups on top of the soil at 2 and 4 weeks after the start of the experiment. Theants came to collect the poison themselves, consuming it and feeding it to theiroffspring. Therefore the poison specifically removed the ants without affecting othersoil fauna directly. To control for potential effects of ant poison on other soil organ-isms (if it would be collected by those at all), we also added poison baits to half thepots containing matrix soil cores. To check whether our ant removal treatment wassuccessful, we collected soil cores of the top 5-cm of the soil at the end of the experi-ment and separated all insects from the soil using a Tullgren (van Straalen andRijninks 1982). In these samples we counted the number of ants. We did not find anyants in pots that originally contained an ant mound and received poison bait, whileall pots with mounds that did not receive poison bait still did contain ants.However, we also found a few pots that originally contained matrix soil but werecolonized by yellow meadow ants. Regarding digging activity in the pots, coloniza-tion seemed very recent and happened probably towards the end of the experiment.
Our full-factorial set up resulted in 8 different treatments, each replicated 6times (i.e. 6 random blocks): (a) not clipped + no mounds + no poison, (b) notclipped + no mounds + poison, (c) not clipped + mounds + no poison, (d) notclipped + mounds + poison, (e) clipped + no mounds + no poison, (f) clipped + no
77Simulated grazing and yellow meadow ants

mounds + poison, (g) clipped + mounds + no poison, (h) clipped + mounds +poison.
The experiment was maintained in the greenhouse for 9 months at a day/nightrhythm of 15/9 hours at a temperature of 23/17ºC. Pots were watered automaticallywith demineralized water. Pots with soil cores originating from the same randomblock were kept together in the greenhouse. To control for differences in microcli-mate in the greenhouse the spatial arrangement of the pots was randomized onceevery 2 weeks.
MeasurementsClipped plant material was dried at 70ºC for 24h and weighed. Plant communitycomposition was measured in weeks 4, 6, 8, 10, 12, 14, 22, 28, and 39 of the experi-ment using a point quadrat method (Levy and Madden 1933, Goodall 1952). A framewith 52 holes was placed on top of the 10-l pots. Through each hole a metal pin waslowered slowly onto the vegetation. The first plant that was touched by the pin wasrecorded.
Data analysisWe calculated cumulative biomass production over the first 3 months and over thewhole experimental period of 9 months by adding up all biomass measures forthese periods respectively. Plant species richness was calculated as the number ofplant species per pot using the point quadrat data. We calculated plant species rich-ness after 3 and 9 months. Treatment effects on cumulative biomass productionand plant species richness were tested using a general linear model with clipping,presence of ant mounds and poison addition as fixed factors. Block was used as arandom factor (specified in R as block/clipping/mound). When interactions betweenthe fixed factors were strong we do not report the main effects (Crawley 2007).Data were distributed normally (Shapiro-Wilk normality test) and had homoge-neous variances (Levene’s test). Analyses were performed using R version 2.10.0.We implemented the lme4 package to perform general linear mixed models (Batesand Maechler 2009).
We used redundancy analysis (RDA) and principle response curves (PRC) toanalyze the extent and direction of plant community changes over time (van denBrink and ter Braak 1999, Lepsv and S
v
milauer 2003). RDA analysis is a constrainedform of principle component analysis (PCA). RDA and PCA find the best set ofpredictor variables (summarized in ordination axes) that explain a multivariatedata set. In contrast to PCA, in RDA the ordination axes are constrained to linearcombinations of predictor (environmental) variables. We used RDA analysis to testthe effect of our experimental treatments (clipping, mound presence and poisonaddition) on plant community development. We used treatment × sampling timeinteractions as explanatory (i.e. environmental) variables. Sampling time and block
78 Chapter 5

were used as covariables. Additionally, to test explanatory power of the separatetreatment levels on temporal changes in plant community composition weperformed a detailed RDA analysis where we used treatment × time interaction forone of our treatments as environmental variable, and treatment × time interactionsfor the other two as covariables.
We used principle response curves (PRCs) to graphically present plant commu-nity changes over time for each of our experimental treatments (van den Brink andter Braak 1999). In PRC analysis one of the treatments is used as reference treat-ment against which the changes in the other treatments are plotted. We usedclipped pots without mounds and poison as a reference, because this represents thedominant situation in the Junner Koeland nature reserve. PRC analysis is based ona partial RDA where the interactions between time and each treatment combina-tion (i.e. our full-factorial combination of all treatment levels), except for the refer-ence treatment, are used as explanatory variables. Sampling time was added ascovariable. The vertical scores of the first-order PRCs are based on the scores ofenvironmental variables on the first axis of the RDA analysis. In the PRC diagramwe included a 1-D plot that shows the plant species scores on the first RDA axis. Acombination of the PRCs with the 1-D species plot illustrates changes in speciesabundance in the different treatments over time.
The significance of treatment × sampling time interactions in all RDA analyseswas tested using Monte Carlo permutation tests with 999 permutations. Withinblocks permutations were restricted by a split-plot design that represented thetemporal structure of the data. We allowed whole plots (data that were collected inthe same pot at the same time) to permute at random, while split-plots (differentpots at different times) were not permuted. To test the significance of higher orderordination axes we added the lower-order axes as covariables. We only presentanalyses results for the first ordination axes, because in all cases higher-order axeswere found to be not significant (P >0.05).
RDA and PRC analyses were carried out using CANOCO version 4.5 for Windows(ter Braak and S
v
milauer 2002).
Results
BiomassAfter 3 months, cumulative biomass production was affected by an interactionbetween clipping and the presence of ant mounds (χ2=4.16, df=1, P=0.041, Fig5.1A). Only in pots without mounds that were left unclipped biomass productionwas increased. This indicates that under clipping there was neither an effect of thepresence of mounds nor of poison on biomass production, while in the absence ofclipping it did matter whether mounds were present or not. Both clipping (χ2=8.25,
79Simulated grazing and yellow meadow ants

df=1, P=0.004, Fig 5.1A) and the presence of ant mounds (χ2=14.31, df=1,P<0.001, Fig 5.1A) reduced biomass production. The addition of ant poison did notaffect biomass production after 3 months (χ2=1.02, df=1, P=0.313, Fig 5.1A).After 9 months, cumulative biomass production was affected by clipping only. Inclipped pots less biomass was produced after 9 months (χ2=15.28, df=1, P<0.001,Fig 5.1B). Neither the presence of ant mounds (χ2=0.036, df=1, P=0.850, Fig 5.1b),nor of poison (χ2=1.107, df=1, P=0.292, Fig 5.1B) affected total biomass.
Standing crop after 3 and 9 months showed similar patterns as cumulativebiomass production after 3 and 9 months. After 3 months standing crop wasaffected by an interaction between clipping and ant mounds (χ2=11.98, df=1,P<0.001, Fig 5.2A). Clipping reduced standing crop and in clipped treatments therewas no effect of ant mounds on standing crop. In unclipped treatments ant moundsreduced standing crop. After 9 months standing crop was affected by the clipping
80 Chapter 5
0
10
20
30
40
50
biom
ass
prod
uctio
n 9
mon
th (g
DW
)
no mound
70
60
no poisonpoison
A
B
abca
mound
abc ab
unclipped
no mound
cc
mound
bc c
clipped
0
2
4
6
8
10
biom
ass
prod
uctio
n 3
mon
th (g
DW
) 14
12
a
ab
bc
c bcbc
c c
Figure 5.1 Cumulative biomass production (g dry weight) per treatment after (A) 3 months and (B)9 months. Treatments represent a full-factorial design with three factors: aboveground biomasswas left or removed by clipping (unclipped vs. clipped), ant mounds were absent or present (nomound vs. mound), and ants were left or removed (no poison vs. poison). Error bars display stan-dard errors. Different letters above bars indicate significant differences at P<0.05.

treatment only (χ2=18.97, df=1, P<0.001, Fig 5.2B), while there was no effect ofant mound (χ2=0.48, df=1, P=0.504 Fig 5.2B) or poison addition (χ2=0.27, df=1,P=0.606, Fig 5.2B).
Our results indicate that on the short term (3 months) clipping overruled effectsof ant mounds on biomass production and standing crop. Only in unclipped situa-tions the ants may have acted as a “consumer” in reducing the total biomassproduction, similar to clipping. However, on the longer term clipping was the onlydeterminant of biomass production and standing crop, because effects of antmounds in unclipped situations disappeared.
Plant species richnessAfter 3 months species richness was affected by an interaction between clippingand the presence of ant mounds (χ2=3.96, df=1, P=0.047, Fig 5.3A). Only in pots
81Simulated grazing and yellow meadow ants
0
4
8
12
16
stan
ding
cro
p 9
mon
th (g
DW
)
no mound
24
20
no poisonpoison
A
B
ab a
mound
aa
unclipped
no mound
c bc
mound
cc
clipped
stan
ding
cro
p 3
mon
th (g
DW
)a
ab
bc
c
d d d d
0
2
4
6
8
10
14
12
Figure 5.2 Standing crop (g dry weight) per treatment after (A) 3 months and (B) 9 months. Treat-ments represent a full-factorial design with three factors: aboveground biomass was left orremoved by clipping (unclipped vs. clipped), ant mounds were absent or present (no mound vs.mound), and ants were left or removed (no poison vs. poison). Error bars display standard errors.Different letters above bars indicate significant differences at P<0.05.

with clipping and without mounds we found a higher number of species. Clippingsignificantly increased plant species richness (χ2=9.27, df=1, P=0.002, Fig 5.3A)from 4.5 species in unclipped pots to 5.9 species on average in clipped pots. Nor thepresence of ant mounds (χ2=0.106, df=1, P=0.744, Fig 5.3A), neither the actualpresence of the ants themselves (χ2=1.56, df=1, P=0.211, Fig 5.3A) affected plantspecies richness after 3 months. After 9 months we found a very similar pattern.The interaction between clipping and the presence of mounds tended to affectspecies richness (χ2=3.45, df=1, P=0.063, Fig 5.3B), because species richness washigher in the pots with clipping and without mounds only. Again, clipping increasedspecies richness from 4.4 species in unclipped pots to 5.6 species clipped pots(χ2=5.86, df=1, P=0.015, Fig 5.3B). Neither the presence of ant mounds(χ2=0.617, df=1, P=0.432, Fig 5.3B), nor of poison affected species richness(χ2=0.20, df=1, P=0.653, Fig 5.3B). These results show that clipping is the main
82 Chapter 5
0
2
4
6
spec
ies
richn
ess
9 m
onth
(# s
peci
es p
er p
ot)
no mound
8
no poisonpoison
A
B
ab
b
mound
ab ab
unclipped
no mound
a
ab
mound
ab
ab
clipped
0
1
2
3
4
5
spec
ies
richn
ess
3 m
onth
(# s
peci
es p
er p
ot)
7
6
ab
b
ab ab
aa
abab
Figure 5.3 Plant species richness (number of plant species per pot) after (A) 3 months and (B) 9months. Treatments represent a full-factorial design with three factors: aboveground biomass wasleft or removed by clipping (unclipped vs. clipped), ant mounds were absent or present (no moundvs. mound), and ants were left or removed (no poison vs. poison). Error bars display standarderrors. Different letters above bars indicate significant differences at P<0.05.

determinant of the number of plant species, because the effect of the interactionbetween clipping and mound was weak and we did not find consistently differenteffects of mounds under certain clipping treatments.
Plant community compositionOur experimental treatments significantly explained plant community changes overtime (F=33.80, P<0.001). Detailed analysis showed that this was due to the effectof clipping on temporal plant community patterns (F=34.89, P=0.036). Neither thepresence of mounds (F=16.06, P=1.000) nor the addition of poison (F=5.91,P=0.555) could significantly explain plant community development. Figure 5.4clearly shows that the principle response curves (PRCs) separate out based on theclipping treatments only, while there is little effect of the presence of ant moundsor poison addition. PRCs of clipped pots do not differ much from the reference
83Simulated grazing and yellow meadow ants
0
-0.2
-0.1
0.0
0.1
0.2
0.3
0.4
0.5
0.6P
RC
1
10 20 30 40time (weeks)
Holcus lanatus
C– M– P–
Rumex acetosa
Ranunculus acris
Festuca rubraLuzula campestris
Agostis spec
C– M+ P+C– M– P+ C– M+ P+C+ M– P– C+ M+ P–C+ M– P+ C+ M+ P+
Figure 5.4 Principle response curves showing the extent and direction of plant communitychanges in our greenhouse experiment along the first RDA axis (PRC1: F=33.704, P=0.002). Curvesare plotted relative to changes in C+M-P- (clipping, no mound, no poison), which serves as thereference treatment (striped line). Different symbols represent the different treatments: C-M-P-unclipped, no mound, no poison (closed grey circle); C-M-P+ unclipped, no mound, poison (opengrey circle); C-M+P- unclipped, mound, no poison (closed black circle); C-M+P+ unclipped,mound, poison (open black circle); C+M-P+ clipped, no mound, no poison (open grey square);C+M+P- clipped, mound, no poison (closed black square); C+M+P+ clipped, mound, poison (openblack square). The vertical 1-D plot represents the scores the plant species on the first RDA axis. Apositive value means that a species increases as compared to the control treatment (C+M-P-);while a negative value means a decrease. For clarity, only species with the best fit to the first ordi-nation axis are included in the diagram (“Lower axis minimum fit” was set to 4).

treatment that was clipped as well, while unclipped pots have a divergent commu-nity composition. Clipped treatments had higher abundances of grazing-tolerantplant species such as Festuca rubra and Agrostis capillaris while unclipped pots hadhigher abundances of plant species that become dominant in ungrazed situations,such as Holcus lanatus and Rumex acetosa (Fig 5.4).
Discussion
We found that simulated grazing overruled effects of yellow meadow ants on small-scale plant community structure on the short term. Simulated grazing homogenizedbiomass production and standing crop on and off mounds. In the absence of simu-lated grazing biomass production and standing crop were enhanced and werehigher off than on ant mounds. On the longer term, biomass production andstanding crop were only affected by simulated grazing because the influence of antmounds in unclipped situations disappeared. Consequently, plant species richnessand plant community composition were mainly driven by simulated grazing, whileant mound presence and poison addition had little influence.
Effects of aboveground grazers on plant species richness and plant communitycomposition have been well-established (Milchunas and Lauenroth 1993, Olff andRitchie 1998, Proulx and Mazumder 1998). In general, in productive ecosystemsgrazers have been shown to increase plant diversity (Bakker 1989, Collins et al.1998, Bakker et al. 2006). The removal of aboveground biomass enhances lightavailability and relaxes competition for light between plant species (Olff andRitchie 1998). This promotes the cover of subordinates (Glenn and Collins 1990, Olffet al. 1997, Knapp et al. 1999, Veen et al. 2008) and may enhance regenerationopportunities for plant species (Grubb 1977, Bakker and de Vries 1992, Bakker andOlff 2003).
In addition to the clear and well-established effects of biomass removal on plantcommunity composition, we expected to find altered plant species richness andcommunity composition on and off ant mounds as well. Previous field studiesshowed that plant community composition on ant mounds is different from thesurroundings due to more open vegetation and changes in soil biotic and abioticproperties (King 1977a, Dean et al. 1997, Blomqvist et al. 2000). Ant moundsprovide altered abiotic conditions (Dean et al. 1997, Blomqvist et al. 2000, Dostal etal. 2005) but also a reduction in the abundance of soil-borne pathogens and herbi-vores (Blomqvist et al. 2000) and changes in the soil microbial community (Dauberand Wolters 2000) which may favor different plant species than in surroundingvegetation. Species richness on ant mounds may either increase when the reductionin biomass that we measured on the mounds favors subdominants (Grime 1973,Goldberg and Miller 1990) or it may decrease when plants that are sensitive to ant
84 Chapter 5

activity decline (Dean et al. 1997). However, we did neither find differences in plantspecies richness nor in plant community composition on and off ant mounds.
Different factors may explain the lack of an effect of yellow meadow ants onplant community composition. It could be that our grazing treatments were tooextreme so that the effect of ants and ant mounds did not become expressed. Simu-lated grazing may have been too intensive resulting in the promotion of grazing-tolerant plant species thereby overruling other factors driving plant communitycomposition. Indeed we did find a clear increase in Festuca rubra and Agrostiscapillaris in the clipped pots. In contrast the cessation of simulated grazing resultedin the increase of tall grasses, such as Holcus lanatus. An increase of tall grassesmay stimulate ant activity, but when the ants cannot keep up with the grass heightcolonies get extinct (King 1977b). In our experiment the ants had little opportuni-ties to access new soil to keep up with vegetation changes in the absence of simu-lated grazing, which may explain the disappearance of their effects in thissituation. Therefore, our experimental pots may have been too limited to be able toquantify ant and mound effects.
Even if the previous explanations for the absence of ant effects hold, we wouldhave expected to find differences on and off mounds at the start of our experiment(Dean et al. 1997, Blomqvist et al. 2000). However, also in the first weeks plantcommunities on and off mounds were very similar (Fig 5.3). The mounds wecollected in the field were very small, but soil heaping of yellow meadow ants inyoung mounds smothers existing vegetation and leads to the invasion of a new setof plant species directly (King 1977b). Therefore we suggest that in the field cattlegrazing may have homogenized the local plant community (Glenn et al. 1992, Adleret al. 2001, Bakker 2003) by locally exerting a strong grazing pressure, therebyoverruling effects of yellow meadow ants. Under conditions of more extensivegrazing effects of ants on plant community structure and composition may becomeexpressed however. Our data confirm this, because cessation of simulated grazingresulted in altered plant productivity on and off mounds, but only on the shortterm. Moreover, in field sites in central Germany that were mown once a year,resembling extensive removal of biomass, mounds of yellow meadow ants had analtered plant community composition (Dean et al. 1997).
The effects of yellow meadow ants that were expressed in our experiment, i.e. areduction in biomass production and standing crop, were governed by the presenceof ant mounds and not by the actual presence of the ants (and therefore also rootaphids) themselves. Effects of mounds on the vegetation may operate through soilturbation by the ants (Jones et al. 1994). Digging activities alter biotic and abioticsoil conditions, such as water availability, pH and nutrient availability, which influ-ence plant community composition (Dean et al. 1997, Blomqvist et al. 2000). Incontrast, effects of ants themselves may run via mutualistic relationships betweenants and aphids. In European grasslands about one-third of the aphid species is
85Simulated grazing and yellow meadow ants

tended by ants (Stadler and Dixon 2005). Aphids feed on the phloem sap of plants,which is rich in sugar but low in nitrogen. To obtain enough nitrogen the aphidsingest large quantities of sap and excrete the excess as sugar-rich honeydew whichis a main food source of some ant species. In turn, ants may provide protection forthe aphids (Stadler and Dixon 2005), keep their eggs in their nests and carry aphidsto good feeding places (Pontin 1978). Yellow meadow ants are amongst the antspecies that mutually live together with root aphids which can result in increasednumber of aphids in their nest mounds (Pontin 1978). Associations between yellowmeadow ants and aphids may be species-specific and obligatory for some of theaphid species (Pontin 1978). Therefore, removal of yellow meadow ants may reduceaphid performance and affect plant growth and composition. However we couldnot identify such effects in our experiment. It can be that aphid numbers were notincreased in the mounds that we collected, that aphid performance only declinedafter longer periods without ant attendance, or that aphid-induced changes in theplant community composition take more time. To investigate effects of interactionsbetween ants and aphids on plant community structure and composition it will beuseful to set up long-term ant removal experiments in the field or to perform adetailed full-factorial greenhouse experiment where single plants or mixed plantcommunities are grown on soils with known numbers of aphids in the absence andpresence of ants.
ConclusionIn intensively grazed or ungrazed situations effects of yellow meadow ants and antmounds were not expressed in plant community structure and composition.However, our results show that shortly after the cessation of grazing biomassproduction is different on and off ant mounds. Therefore, in situations of extensivevertebrate grazing differences in biomass production on and off mounds maybecome expressed and yellow meadow ants may then become important drivers ofsmall-scale plant community structure and composition.
AcknowledgementsWe thank Renate Otter, Jacob Hogendorf and Nelly Eck for assistance during the greenhouseexperiment. Matty Berg helped with the Tullgren analysis. We are grateful to Staatsbosbe-heer (National Forestry) for permission to collect soil cores in the Junner Koeland naturereserve.
86 Chapter 5

87Simulated grazing and yellow meadow ants

Cha
pter
six

Small-scale plant community compositionaffected by interactions between above-and belowground organisms that operateon different spatial scales
G.F. (Ciska) Veen, Elzemiek Geuverink, Han Olff
6

Aboveground and belowground organisms influence plant communitycomposition by local interactions and their scale of impact may vary frommillimeters belowground to kilometers aboveground. However, it still poorlyunderstood how differences in spatial scale of operation affect the outcomeof aboveground-belowground interactions on plant community hetero-geneity. Here, we investigate the formation of small-scale heterogeneity invegetation composition created by subterranean yellow meadow ants(Lasius flavus) in the presence of aboveground herbivores that makeforaging decisions on a fine grain (European brown hares – Lepus europaeus)and on coarse grain (cattle – Bos taurus). We hypothesize that small above-ground vertebrate herbivores (hares), with local and selective diet selection,will enforce heterogeneity in vegetation composition that is created by soil-dwelling ants, while large aboveground herbivores (cattle) will homogenizesuch heterogeneity.
Ant mounds that were only grazed by hares had a very different commu-nity composition compared to their surroundings; the cover of the grazing-intolerant grass Elytrigia atherica was reduced, whereas the cover of themore grazing-tolerant and palatable grass Festuca rubra was enhanced.Combined grazing by hares and cattle, on the other hand, resulted in homog-enization of the plant community composition on and off ant mounds, withhigh overall cover of Festuca rubra.
We conclude that the smaller, more selectively foraging abovegroundherbivore that we studied promotes small-scale plant community hetero-geneity by responding at the same spatial scale to local ant-soil-vegetationinteractions. When exposed to both a selective and a larger, less selectiveaboveground herbivore, patterns of small-scale vegetation heterogeneitytriggered by ant-soil-vegetation interactions disappeared.
Abstract

Introduction
It is widely acknowledged that aboveground and belowground communitiesinteract using plants as intermediates (van der Putten et al. 2001, Wardle et al.2004). However, where many studies have shown that aboveground or below-ground organisms may influence the spatial and temporal composition of plantcommunities (e.g. Milchunas and Lauenroth 1993, Dobson and Crawley 1994, Olffand Ritchie 1998, van der Heijden et al. 1998b, Olff et al. 2000, Bradford et al. 2002,Klironomos 2002, De Deyn et al. 2003), relatively few studies have examined theircombined effects in a community context. Most previous research on aboveground-belowground interactions has focused on single plant species with specific above-ground and belowground organisms affecting the plant and each other (e.g. Gangeand Brown 1989, Masters and Brown 1992, Masters 1995, Gange and Nice 1997,Bezemer et al. 2003, Soler et al. 2005, Soler et al. 2007). However, in natural situa-tions these interactions occur in diverse communities.
The available studies that did investigate above-belowground interactions indiverse plant communities showed that the interactive above-belowground effectson plant community structure are not always simply additive (Brown and Gange1992, Blomqvist et al. 2000, van Ruijven et al. 2005). For instance, in an experi-mental community, neutral effects of aboveground herbivores and positive effectsof belowground herbivores on plant diversity became negative when these herbi-vores were added in combination (van Ruijven et al. 2005). Also, it has been shownthat mounds of subterranean yellow meadow ants (Lasius flavus) harbor differentplant communities than their surroundings and that mound building activity washigher with than without large vertebrate herbivores (King 1977b, Blomqvist et al.2000). Hence, the potential of belowground ant activities to drive small-scale plantpatterns is dependent on the activities of aboveground organisms.
An important aspect of combined aboveground-belowground effects in naturalcommunities is the huge difference in spatial scale at which most soil biota affect plantscompared to some aboveground organisms, such as vertebrate grazers, due to limitedmobility belowground and fewer restrictions aboveground (van der Putten et al. 2009).However, it is not yet clear to what extent aboveground herbivores that operate at avery different spatial scale than soil organisms influence the outcome of above-below-ground interactions. We expect that aboveground organisms that operate across muchlarger scales than soil organisms will interact less with the soil organisms which mayresult in lower small-scale spatial heterogeneity in plant community composition. Incontrast, aboveground organisms that affect plants on a more comparable scale tosoil organisms may interact to increase small-scale plant community heterogeneity.Here, we investigate how interactions between soil organisms that operate at smallspatial scales and two aboveground vertebrate herbivores that forage at relativelysmall and large spatial scales respectively affect plant community heterogeneity.
91Herbivore selectivity and plant patterns on ant mounds

The scale at which aboveground herbivores affect plants and the plant commu-nity is generally related to their body size, food quality and quantity requirements,and associated selectivity. Aboveground herbivores in grasslands vary in an orderof magnitude in body mass from arthropods (0.01 – 10 g) to small rodents (10 – 100g) to lagomorphs (1 – 5 kg) to large grazing mammals (50 – 1500 kg). Larger speciesare expected to have larger home ranges (Haskell et al. 2002), neglect detail in theirenvironment and food when foraging (Ritchie and Olff 1999), and require a lowerquality diet and less energy per unit body mass than small herbivores which have ashorter residence time of food in their digestive system (Demment and Van Soest1985, Gordon and Illius 1994). This forces small herbivores to choose their forageselectively while large herbivores can be less selective in their diet selection (Olff etal. 2002, Hopcraft et al. 2010). Therefore, effects of small herbivores on vegetationcomposition are more localized, specific and small scale, while effects of largerherbivores are often more generic, less specific and large scale (Ritchie and Olff1999, Haskell et al. 2002, Cromsigt and Olff 2006, Mouissie et al. 2008, Laca et al.2010). We will summarize these patterns through the phrase that larger herbivores‘operate on larger spatial scales’.
In a field experiment on the island of Schiermonnikoog (the Netherlands) westudied plant community patches on mounds of subterranean yellow meadow ants(Lasius flavus) in the presence of European brown hares (Lepus europaeus) and cattle(Bos taurus). Yellow meadow ants are subterranean social insects that locally alterabiotic and biotic soil properties by digging up fresh soil to build nest mounds (Deanet al. 1997, Blomqvist et al. 2000, Dauber and Wolters 2000, Dostal et al. 2005) of 0.1to 1 m in diameter, up to 0.5 m tall. They tend root aphids in their nest for honey dewexploitation (Pontin 1978). This results under some conditions in a different plantcommunity composition on and off yellow meadow ant mounds and hence in small-scale plant community patches (e.g. Dean et al. 1997, Blomqvist et al. 2000). Thesocial nature of ants causes them to operate at larger spatial scales than many othersoil biota and therefore their effects are easier to study in a natural situation.
We expect that hares and cattle respond differently to plant patches created byyellow meadow ants, because they operate on a different scale with different selec-tivity, as outlined before. Consequently, when plant quality is increased on moundsof yellow meadow ants, e.g. due to increased mineralization rates (Blomqvist et al.2000), hares may be attracted to these small high-quality patches, whereas cattlemay not select for them particularly. This can affect plant community hetero-geneity at the local scale (Olff et al. 1999, Bakker 2003, Cromsigt and Olff 2008). Wetested the hypothesis that small-scale plant community patches created by below-ground organisms will be more distinct in the presence of selective-feeding above-ground vertebrate herbivores, while plant community patches will morehomogeneous when aboveground vertebrates forage on a coarser grain, i.e., operateacross larger spatial scales.
92 Chapter 6
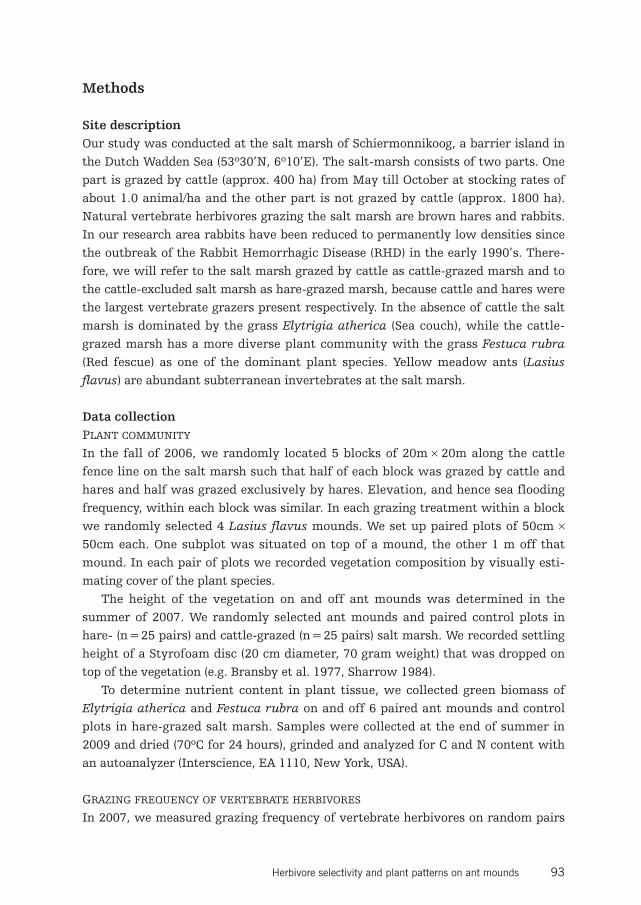
Methods
Site descriptionOur study was conducted at the salt marsh of Schiermonnikoog, a barrier island inthe Dutch Wadden Sea (53º30’N, 6º10’E). The salt-marsh consists of two parts. Onepart is grazed by cattle (approx. 400 ha) from May till October at stocking rates ofabout 1.0 animal/ha and the other part is not grazed by cattle (approx. 1800 ha).Natural vertebrate herbivores grazing the salt marsh are brown hares and rabbits.In our research area rabbits have been reduced to permanently low densities sincethe outbreak of the Rabbit Hemorrhagic Disease (RHD) in the early 1990’s. There-fore, we will refer to the salt marsh grazed by cattle as cattle-grazed marsh and tothe cattle-excluded salt marsh as hare-grazed marsh, because cattle and hares werethe largest vertebrate grazers present respectively. In the absence of cattle the saltmarsh is dominated by the grass Elytrigia atherica (Sea couch), while the cattle-grazed marsh has a more diverse plant community with the grass Festuca rubra(Red fescue) as one of the dominant plant species. Yellow meadow ants (Lasiusflavus) are abundant subterranean invertebrates at the salt marsh.
Data collectionPLANT COMMUNITY
In the fall of 2006, we randomly located 5 blocks of 20m × 20m along the cattlefence line on the salt marsh such that half of each block was grazed by cattle andhares and half was grazed exclusively by hares. Elevation, and hence sea floodingfrequency, within each block was similar. In each grazing treatment within a blockwe randomly selected 4 Lasius flavus mounds. We set up paired plots of 50cm ×
50cm each. One subplot was situated on top of a mound, the other 1 m off thatmound. In each pair of plots we recorded vegetation composition by visually esti-mating cover of the plant species.
The height of the vegetation on and off ant mounds was determined in thesummer of 2007. We randomly selected ant mounds and paired control plots inhare- (n=25 pairs) and cattle-grazed (n=25 pairs) salt marsh. We recorded settlingheight of a Styrofoam disc (20 cm diameter, 70 gram weight) that was dropped ontop of the vegetation (e.g. Bransby et al. 1977, Sharrow 1984).
To determine nutrient content in plant tissue, we collected green biomass ofElytrigia atherica and Festuca rubra on and off 6 paired ant mounds and controlplots in hare-grazed salt marsh. Samples were collected at the end of summer in2009 and dried (70ºC for 24 hours), grinded and analyzed for C and N content withan autoanalyzer (Interscience, EA 1110, New York, USA).
GRAZING FREQUENCY OF VERTEBRATE HERBIVORES
In 2007, we measured grazing frequency of vertebrate herbivores on random pairs
93Herbivore selectivity and plant patterns on ant mounds

of ant mounds and control plots (n=25 pairs per grazing treatment). We set up oneplot of 1m × 0.1m on an ant mound and the other 1 meter away from that antmound. Each plot consisted of 10 subplots of 0.1m × 0.1 m. In all subplots werandomly counted 10 tillers (or all tillers when there were less than 10) of Elytrigiaatherica and Festuca rubra (which were the dominant plant species) and recordedhow many of those were grazed. Moreover, we recorded the number of hare drop-pings present in each plot, which is regarded a good measure for hare grazing pres-sure within a specific habitat (Langbein et al. 1999). Finally, in each subplot werecorded plant species cover to determine plant species richness and diversity.
ABIOTIC SOIL PROPERTIES AND ANT MOUND CHARACTERISTICS
In 2006 and 2007 we collected one soil sample from the top 5 cm of the soil in thepaired plots (n=9 and n=24 pairs per grazing treatment, respectively). Soil mois-ture content was determined by the weight difference between fresh samples andsamples that were dried at 105°C for 24 hours. We determined soil organic mattercontent (SOM) of dry soil samples (achieved by drying for 24 hrs at 105ºC) by loss-on-ignition at 550ºC for 3 hrs. SOM was expressed as the relative weight differencebefore and after ignition.
In 2007 only we dissolved 15 grams of soil in 37 grams of water and sampleswere homogenized regularly by shaking. After 24 hours we measured pH with aSentron pH meter (Sentron, Roden, The Netherlands) and EC (mS·m-1) with aportable EC meter (WTW, Retsch, The Netherlands) in these samples.
Soil temperature was measured in 2007 using I-buttons (Thermochron DS1921K,MAXIM Inc., Sunnyvale CA, USA) that were placed in the top 5-cm of the soil (n=26paired plots per grazing treatment). The I-button recorded a temperature measureevery 10 minutes for 24 hours. For data analysis we used the minimum and themaximum soil temperature measured.
We measured the thickness of the organic top layer of the soil in the 2007 pairedplots (n=26 paired plots per grazing treatment). The top layer is defined as a fine-grained layer on top of the continuous base layer of coarse sand. In the plotscontaining ant mounds we also measured ant mound diameter and height, thelatter defined as the distance between the highest point of the mound to the soilsurface.
In 2009 we measured the diameter, Festuca rubra cover percentage and numberof hare droppings of more than 400 mounds in the hare-grazed area to establish therelationship between mound size, plant cover and hare visitation.
Data analysisIn our experiment Elytrigia atherica, Festuca rubra and bare soil represented themost dominant groups with their cover percentages adding up to 82% (cattle-grazed, off mound), 93% (cattle-grazed, on mound), 102% (hare-grazed, off mound)
94 Chapter 6

and 89% (hare-grazed, on mound) in the four treatments. Therefore, we focus dataanalysis of the plant community on the dominant plant species Elytrigia athericaand Festuca rubra only.
To determine plant community structure we calculated plant species richness(S, the total number of plant species per subplot) and Shannon’s diversity index(H’ , H’ = – ∑ pi ·1n(pi) where pi is the relative cover or abundance of species i(Magurran 2003).
For the temperature data we used the relative difference between soil (Tsoil) andair (Tair) temperature: (Tsoil – Tair)) /Tair) as response variable to be able to comparemeasurements that were collected on different days with different air tempera-tures. We calculated the differences between maximum and minimum soil and airtemperature respectively. Air temperature data were obtained from the KNMI(Royal Dutch Meteorological Institute) database using the data from the Lauwer-soog weather station.
We analyzed the cover values of the dominant plant species and the number ofhare droppings with a generalized linear mixed model assuming a Poisson errordistribution and log-link function, because data were counts. Grazing frequencywas analyzed with a logistic regression with a logit link function, because tillerscounted were either grazed or ungrazed. Plant species richness, plant diversity,vegetation height, plant quality (expressed as percentage N measured in leaves andas C/N ratio), and the metrics for abiotic (soil) properties and mound characteristicswere analyzed using a general linear mixed model. Data on ant mound height andSOM content were log-transformed to improve normality (Shapiro test) and homo-geneity of variances (Levene’s test). In all analyses grazing treatment and antmound presence were used as fixed factors and the experimental setup wasdescribed by a random factor. For plant community analyses the random factor wasdescribed by nesting paired plot in grazing treatment in block, i.e., block/grazingtreatments/paired plot. For data on grazing frequency the random factor wasdescribed by nesting subplot within paired plot within grazing treatment, i.e.,grazing treatment/paired plot/subplot. For the other analyses we only used pairedplot nested within grazing treatment as a random factor, i.e., grazing treatment/paired plot, because data were not collected according to the randomized blockdesign.
To analyze the relationship between ant mound diameter and Festuca rubracover and between mound diameter and number of hare droppings, we used linearregression analysis. Mound diameter was used as a predictor variable, and F. rubracover and number of hare droppings as a response variable. We included data fromhare-grazed salt marsh only because here we observed a plant community shift.
All data were analyzed using R, version 2.10.0. The lme4 package (Bates andMaechler 2009) was used to calculate general and generalized linear mixed modelsand logistic regression, using maximum likelihood estimation. To determine effects
95Herbivore selectivity and plant patterns on ant mounds

of our fixed factors we used a likelihood ratio test to compare models with andwithout the variable of interest (Crawley 2007) using a chi-square test statistic.When interaction effects were significant we do not report the effects of the mainfactors (Crawley 2007). Post-hoc comparisons were made using a Tukey’s test.
Results
Plant community responsesAn interaction between the presence of yellow meadow ants and grazing treatmentaffected the cover of the dominant salt marsh plants. Elytrigia atherica cover washigher off ant mounds in hare-grazed salt marsh only (χ2=184.61, df=1, P<0.001;Fig 6.1). Festuca rubra cover was increased in the cattle-grazed salt marsh ingeneral, with a maximum cover off ant mounds under cattle grazing (χ2=4.92,df=1, P=0.026; Fig 6.1). The relative cover of Festuca rubra (cover Festuca/(coverFestuca + Elytrigia)) was significantly lower off ant mounds in hare-grazed saltmarsh only (χ2=131.43, df=1, P<0.001; Fig 6.1), indicating a shift in plant domi-nance from Festuca rubra to Elytrigia atherica off ant mounds under hare grazing.In contrast, in cattle-grazed salt marsh ant mounds and surroundings were bothdominated by Festuca rubra.
Plant species richness was higher in cattle-grazed than in hare-grazed saltmarsh plots (χ2=8.76, df=1, P=0.003; table 6.1). Plant community diversity (H’)was determined by an interaction between grazing treatment and the presence ofant mounds (χ2=4.24, df=1, P=0.040; table 6.1). Diversity was higher in cattle-
96 Chapter 6
0
20
40
60
cove
r (%
)
hares
100
80
b b
cattle
a
ab
Festuca rubra
hares
a
b
cattle
b
b
Elytrigia atherica
hares
b
a
cattle
a
ab
relative cover F. rubra
off moundon mound
Figure 6.1 Cover of the dominant plant species on and off ant mounds in hare-grazed and cattle-grazed salt marsh is represented in the first two graphs. The third graph represents the relative ofFestuca rubra compared to the sum of the cover of Festuca rubra and Elytrigia atherica (coverFestuca/(cover Festuca + Elytrigia)). Error bars represent the standard error. Different lettersabove the bars indicate significant differences at P<0.05.

grazed salt marsh, regardless of the presence of ant mounds. In hare-grazed saltmarsh diversity was generally lower and was most reduced on ant moundscompared to off mounds.
Vegetation height also was affected by an interaction between grazing treatmentand mound presence (χ2=31.41, P<0.001, df=1; table 6.1). Vegetation was higheroff mounds in hare-grazed marsh only, while there was no difference between
97Herbivore selectivity and plant patterns on ant mounds
Table 6.1 Overview of effects of grazing treatment (hare grazing vs. cattle grazing) and ant moundpresence (on vs. off ant mounds) on plant community characteristics, vertebrate grazers, soilabiotic properties and mound properties. Mean values are displayed with SE between brackets.Different letters behind mean values indicate significant differences at P<0.05.
Hare grazed, Hare grazed, Cattle grazed, Cattle grazed,off mound on mound off mound on mound
Plant community characteristics
Species richness 1.71 (0.13) b 1.26 (0.15) b 3.84 (0.16) a 3.95 (0.29) a
Diversity (H’) 0.42 (0.04) b 0.29 (0.04) b 0.99 (0.04) a 1.01 (0.07) a
%N F. rubra 1.57 (0.01) b 2.20 (0.08) a ND1) ND1)
C/N ratio F. rubra 26.8 (0.68) b 20.4 (1.83) a ND1) ND1)
%N E. atherica 1.19 (0.03) a 1.38 (0.03) a ND1) ND1)
C/N ratio E.atherica 37.7 (2.71) a 32.5 (2.05) a ND1) ND1)
Vegetation height 28.9 (1.24) a 8.8 (1.41) b 8.39 (1.34) b 6.31 (0.90) b
Soil abiotic properties
pH 8.53 (0.07) ab 8.44 (0.05) ab 8.21 (0.08) b 8.57 (0.07) a
EC (mS·m-1) 0.72 (0.11) a 0.59 (0.08) ab 1.46 (0.21) a 0.53 (0.06) b
Soil organic matter 13.8 (1.50) ab 4.12 (0.82) c 26.5 (2.80) a 5.00 (0.50) bc
(%) May 2006
Soil organic matter 4.13 (0.30) b 4.15 (0.23) b 10.1 (0.93) a 6.64 (0.85) b
(%) July 2007
Soil moisture content 48.1 (2.30) b 20.7 (2.18) c 56.3 (2.89) a 23.4 (2.09) c
(%) May 2006
Soil moisture content 32.2 (2.77) ab 28.1 (3.05) ab 37.6 (2.00) a 32.7 (1.84) b
(%) July 2007
Relative maximum temp. -0.09 (0.02) c 0.17 (0.03) a 0.08 (0.01) b 0.17 (0.02) a
temperature
Relative minimum temp. 0.09 (0.02) b 0.03 (0.02) c 0.18 (0.02) a 0.09 (0.01) bc
Top layer thickness (cm) 7.35 (0.99) b 19.6 (0.87) a 7.48 (0.58) b 14.3 (0.81) a
Mound properties
Mound height (cm) ND1) 14.6 (0.83) a ND1) 10.4 (0.87) a
Mound diameter (cm) ND1) 97.7 (5.90) a ND1) 50.8 (3.77) b
1) No data available

vegetation height on hare-grazed mounds and on and off cattle-grazed mounds.This indicates that plots off mounds in hare-grazed salt marsh were grazed lessoften than all other plots.
Plant quality on ant mounds was enhanced (table 6.1). For Festuca rubrapercentage of nitrogen in leaf tissue was higher on ant mounds (χ2=8.67, df=1,P=0.003) and C/N ratio was reduced (χ2=8.88, df=1, P=0.003). For Elytrigiaatherica percentage of nitrogen also tended to be increased in leaf tissue on antmounds (χ2=3.61, df=1, P=0.057) and C/N ratio tended to be lower (χ2=3.23,df=1, P=0.072).
Grazing frequencyGrazing frequency on Festuca rubra was lower off than on ant mounds in hare-grazed salt marsh only (χ2=16.59, P=0.001, df=1; Fig 6.2). This shows that haresalone were exerting high grazing pressure on ant mounds in hare-grazed marsh,resembling that of cattle and hares together in cattle-grazed marsh. Cattle-grazingpressure did not differ significantly on and off ant mounds. Elytrigia athericatended to be grazed more frequently in cattle-grazed marsh and tended to be grazedleast frequent off mounds in hare-grazed salt marsh (χ2=2.83, P=0.092, df=1).
Counts of hare droppings revealed a similar pattern as grazing frequency data(Fig 6.3). We found most hare droppings per m2 on ant mounds in hare-grazed saltmarsh (χ2=15.39, P<0.001, df=1), while almost no droppings were observed bothoff ant mounds in the hare-grazed marsh and in the cattle-grazed marsh. This indi-cates that hares are specifically attracted to ant mounds in the absence of cattle.
98 Chapter 6
0.00
0.05
0.10
graz
ing
frequ
ency
hares
0.15
b
a
cattle
a a
Festuca rubra
hares
b
ab
cattle
ab
a
Elytrigia atherica
off moundon mound
Figure 6.2 Grazing frequency by vertebrate herbivores on and off ant mounds in hare-grazed andcattle-grazed salt marsh. Error bars represent the standard error. Different letters above the barsindicate significant differences at P<0.05.
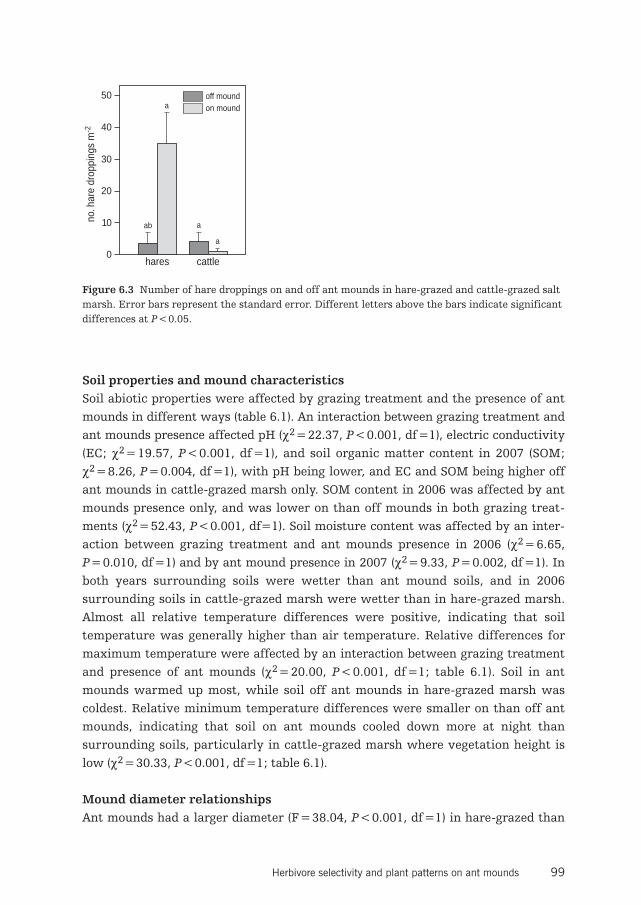
Soil properties and mound characteristicsSoil abiotic properties were affected by grazing treatment and the presence of antmounds in different ways (table 6.1). An interaction between grazing treatment andant mounds presence affected pH (χ2=22.37, P<0.001, df=1), electric conductivity(EC; χ2=19.57, P<0.001, df=1), and soil organic matter content in 2007 (SOM;χ2=8.26, P=0.004, df=1), with pH being lower, and EC and SOM being higher offant mounds in cattle-grazed marsh only. SOM content in 2006 was affected by antmounds presence only, and was lower on than off mounds in both grazing treat-ments (χ2=52.43, P<0.001, df=1). Soil moisture content was affected by an inter-action between grazing treatment and ant mounds presence in 2006 (χ2=6.65,P=0.010, df=1) and by ant mound presence in 2007 (χ2=9.33, P=0.002, df=1). Inboth years surrounding soils were wetter than ant mound soils, and in 2006surrounding soils in cattle-grazed marsh were wetter than in hare-grazed marsh.Almost all relative temperature differences were positive, indicating that soiltemperature was generally higher than air temperature. Relative differences formaximum temperature were affected by an interaction between grazing treatmentand presence of ant mounds (χ2=20.00, P<0.001, df=1; table 6.1). Soil in antmounds warmed up most, while soil off ant mounds in hare-grazed marsh wascoldest. Relative minimum temperature differences were smaller on than off antmounds, indicating that soil on ant mounds cooled down more at night thansurrounding soils, particularly in cattle-grazed marsh where vegetation height islow (χ2=30.33, P<0.001, df=1; table 6.1).
Mound diameter relationshipsAnt mounds had a larger diameter (F=38.04, P<0.001, df=1) in hare-grazed than
99Herbivore selectivity and plant patterns on ant mounds
0
10
20
30
no. h
are
drop
ping
s m
-2
hares
50
40
ab
a
cattle
a
a
off moundon mound
Figure 6.3 Number of hare droppings on and off ant mounds in hare-grazed and cattle-grazed saltmarsh. Error bars represent the standard error. Different letters above the bars indicate significantdifferences at P<0.05.

in cattle-grazed marsh, but did not differ in height (F=2.20, P=0.141, df=1; table6.1). Mounds with a larger diameter in hare-grazed marsh had a higher percentageof Festuca rubra cover (F1,410=51.02, P<0.001, R2=0.11, Fig 6.4A). Moreover,mound diameter was positively related with the total number of hare droppings permound (F1,410=49.35, P<0.001, R2=0.11, Fig 6.4B). This is not only caused bylarger mounds having more space, because also the number of hare droppings perm2 increased with ant mound diameter (F1,410=158.5, P<0.001, R2=0.28). Thisindicates that hares spend more time foraging on larger ant mounds.
100 Chapter 6
0
0
10
20
30
40
50
num
ber
of h
are
drop
ping
s
150100 200 25050mound diameter (cm)
A
B
0
20
40
60
80
100
Fest
uca
rubr
a co
ver
(%)
Figure 6.4 Relationship between ant mound diameter and (A) Festuca rubra cover and (B) the totalnumber of hare droppings per mound for n=412 ant mounds. The regression line represents alinear fit, and the dotted lines represent a 95% confidence interval. For clarity in the graph datawere averaged for size classes of ant mound diameters (0–20 cm, 21–40 cm, 41–60 cm etc). Dotsrepresent averages of the measurements within each size class.

Discussion
Our study showed that small-scale plant community mosaics depend on the type ofaboveground herbivores that interact with soil organisms. This has been shown formodel systems where it was found that root herbivore identity determined plant-mediated interactions between root and shoot herbivores (Wurst and van derPutten 2007), but has not been shown in a field situation. We found that grazing byhares alone resulted in distinct plant community patches on mounds of yellowmeadow ants, while grazing by cattle and hares in combination resulted in morehomogeneous plant community composition.
Yellow meadow ants are ecosystem engineers (Jones et al. 1994, 1997) thatmodify biotic and abiotic soil properties which can enhance small-scale plantcommunity mosaics (Dean et al. 1997, Olff et al. 2000, Blomqvist et al. 2000). In ourstudy site soil abiotic properties, such as soil moisture content, soil organic mattercontent, top layer thickness and temperature, were consistently different on and offant mounds, regardless of vertebrate grazing treatment. However, these changes insoil abiotic conditions did not per se lead to clear plant community patches, becausethe interplay between ants and aboveground herbivores was important drivingsmall-scale plant community composition on ant mounds as well.
Small vertebrate herbivores need higher amounts of energy per unit body massthan large vertebrate herbivores (Demment and Van Soest 1985, Hopcraft et al.2010). As a results, small grazers, such as hares, depend on high quality food andselect their forage on a fine grain, while large herbivores, such as cattle that arerestricted more by food quantity and operate on a coarser grain (Ritchie and Olff1999, Haskell et al. 2002, Laca et al. 2010). Ants speed up local mineralization ratesthrough higher soil aeration (Blomqvist et al. 2000) and fragmentation of soilorganic matter which can lead to a enhanced nitrogen content in plants growing onmounds. We showed that plant nitrogen content on mounds was higher and thathares specifically selected for these small-scale patches with better food quality.Increased grazing pressure of hares on ant mounds locally reduced the dominanceof the grazing-intolerant and unpalatable plant species Elytrigia atherica andenhanced Festuca rubra, a grazing-tolerant plant species of higher nutritional value(Kuijper et al. 2004). As Festuca rubra is a preferred food plants of hares (Kuijper etal. 2008) ant mounds will become increasingly attractive to hares. This results in aprogressive shift in community composition towards a domination of Festucarubra. Therefore, ants and hares interact through a positive feedback, because bothaffect plant quality in the same local patch, which ultimately leads to clearlypronounced small-scale plant community patches of high nutritional value that aredominated by more grazing-tolerant plant species.
In contrast, in cattle-grazed salt marsh vertebrate grazing frequency on and offant mounds was not different, indicating that neither cattle nor hares selected plant
101Herbivore selectivity and plant patterns on ant mounds

patches on ant mounds particularly. Cattle have been shown to reduce the cover ofElytrigia atherica and enhance the cover of high-quality and grazing-tolerantFestuca rubra on a landscape scale (Olff et al. 1997). As a result, cattle facilitatehares by increasing food quality on the landscape scale (Kuijper et al. 2008) andtherefore hares do not have to select for specific small patches on ant mounds tomeet their energy requirements. The more homogeneous grazing pressure of verte-brates across large spatial scales leads to less pronounced small scale plant commu-nity patches on ant mounds. Hence, herbivores that select their forage on largerspatial scales than patches created by soil organisms, may overrule the effects ofsoil organisms on plant community composition. How strong the overruling effectsof aboveground vertebrates are will probably also depend on herbivore type andherbivore density.
We showed that differences in the scale of operation between above- and below-ground organisms are important determining the outcome of their interactions forvegetation patterns. On the one hand, when aboveground organisms, such as hares,selectively choose patches created by belowground organisms, plant communitypatterns driven by aboveground-belowground interactions may become enforced.On the other hand, when aboveground organisms operate on a much larger scalethan belowground organisms, such as cattle, aboveground-belowground interac-tions may become less important determining plant community patterns. In thissituation aboveground herbivores may overrule and homogenize plant communitypatterns created by soil organisms. In other studies it has been shown that organ-isms that operate at relatively similar spatial scales can also influence each otherspatch selection which may drive plant community patterns. For example, prairiedogs, which are digging, social, vertebrate herbivores, build colonies that can rangeover more than 100 hectares. At these scales the prairie dogs alter plant communitycomposition and increase the nutritional value of the vegetation (Coppock et al.1983a). Bison, which are large vertebrate grazers, have been shown to selectivelyforage in habitats affected by prairie dog colonies, probably due to changes in plantcommunity structure and increased food quality (Coppock et al. 1983b).
To further investigate the importance of differences in the scale of operationbetween aboveground and belowground organisms it would be useful to perform afull-factorial field experiment. Our current experiment was lacking a treatmentwithout vertebrate herbivores, because long-term hare exclosures were not avail-able near to our study plots. However, previous work on Schiermonnikoog showedthat exclusion of all aboveground vertebrate grazers (i.e. cattle and hares) resultedin a homogeneous stand of Elytrigia atherica (Olff et al. 1997, Bos et al. 2002,Kuijper et al. 2004, Kuijper and Bakker 2005). This confirms the idea that an inter-action between aboveground and belowground organisms both operating at a rela-tively small scale can drive local plant community mosaics.
102 Chapter 6

ConclusionsThe interaction between subterranean yellow meadow ants and hares resulted in ashift in plant community composition, because hares specifically selected for highquality patches on ant mounds. In contrast, cattle exerted a more homogeneousgrazing pressure on and off ant mounds thereby overruling effects of ants on plantcommunity composition. We conclude that the promotion of small-scale plantcommunity heterogeneity as a result of aboveground-belowground interactions isdependent on the selectivity of aboveground herbivores.
AcknowledgementsWe would like to thank Jan P. Bakker for his inspiration during the set up of the field experi-ment. We thank Wim H. van der Putten for valuable comments on earlier versions of thismanuscript. Thanks to all students from the University of Groningen (the Netherlands) andOldenburg (Germany) that helped in the field. We would like to thank Jacob Hogendorf fortechnical assistance and Nelly Eck for laboratory analyses. Maarten Schrama collected grasssamples on Schiermonnikoog. Thanks to Dick Visser for drawing the figures. We are gratefulto the “Vereniging Natuurmonumenten” for permission to do field work at the salt marsh ofSchiermonnikoog.
103Herbivore selectivity and plant patterns on ant mounds

Cha
pter
sev
en

Contrasting effects of large herbivores onnitrogen mineralization across ecosystems:integrating effects of soil physical properties.
Maarten J.J. Schrama, G.F. (Ciska) Veen, E.S. (Liesbeth) Bakker,Jasper L. Ruifrok, Jan P. Bakker, Han Olff
7

The general view of the role of large herbivores in grassland ecosystem func-tioning is that they speed up nutrient cycling, especially nitrogen (N) miner-alization. This classic ‘grazing lawn’ effect is thought to arise because faecaland urine inputs by herbivores increase soil microbial activity and thus Nmineralization, which promote plants with leaf N concentrations, whichfinally again attracts herbivores. However, field experiments increasinglyshow that large herbivores often reduce soil N mineralization rates insteadof increasing them.
We explain this through effects of large herbivores on soil physicalprocesses, which under some conditions are found to outweigh positiveeffects on N mineralization. We expect these effects to be strongest in wet,fine-textured soils. In such soils compaction causes periods of soil hypoxiaduring which aerobic decomposers (both microbes and soil macrofauna) areinhibited which may result in a reduction in N mineralization.
We use long-term field data from experiments in temperate grasslandswith different grazing and mowing treatments to substantiate this proposedrole of soil compaction in slowing N turnover and promoting soil hypoxia.These experiments reveal that plant species adapted to periods of soilhypoxia and to low N availability generally have higher abundances in morecompacted soils.
We conclude that the effect of large herbivores on N mineralizationdepends on a critical balance between a set of positive and negative effects.Including herbivore effects on soil physical properties into current theorieson N cycling in grassland will advance our understanding of contrastingresults of herbivores on mineralization rates.
Abstract
Introduction
Large vertebrate herbivores play a key role in determining the community struc-ture and functioning of grassland ecosystems. They influence nitrogen (N) mineral-ization rates, thereby altering plant productivity (Georgiadis et al. 1989, Frank andMcNaughton 1993, Frank et al. 2000), as this is often limited by N availability(Schlesinger 1991, Vitousek and Howarth 1991). The prevailing theory is that largeherbivores locally enhance the productivity of grasslands through promoting Nmineralization. As herbivores enhance the primary production and improve grassquality of the grass, which again attracts more herbivores, this can be viewed as agrazer-induced positive feedback loop on their own density (McNaughton 1984,Pastor et al. 2006). Increased N availability caused by large herbivores has thereforebeen proposed as a form of self-facilitation where herbivores improve the avail-ability and quality of their food plants in specific locations that are inherently notvery different from their surroundings (McNaughton 1984, Belsky 1986, Fryxell1991, McNaughton et al. 1997a). Indeed, several studies where large herbivoreswere excluded from plots demonstrate a decreased availability of N in the absenceof large herbivores (McNaughton et al. 1997b, Frank and Groffman 1998, Knapp etal. 1999). However, other field studies show an increase of N mineralization in theabsence of large herbivores (Pastor et al. 1993, Ritchie et al. 1998, van Wijnen et al.1999, Bakker et al. 2004), indicating that the positive feedback loop of herbivore-induced increased N availability is not universal.
Several authors have tried to explain contrasting effects of herbivores on Nmineralization as a function of herbivore-induced changes on the quality ofresources entering the soil food web (Pastor et al. 1993, Hobbs 1996, Ritchie et al.1998, Pastor et al. 2006). Yet field tests could not confirm the predictions of thesetheories (Bakker et al. 2006, Bakker et al. 2009). Apparently, the effect of largeherbivores on N mineralization in grasslands is still not fully understood.
Existing hypotheses on contrasting effects of grazing on N cycling in naturalgrasslands have so far largely ignored the physical effects of large herbivores on soilparameters. For example by trampling and the removal of aboveground plantbiomass herbivores can have an important influence on e.g. soil moisture, soil aera-tion and soil temperature. Changes in these soil properties may have major conse-quences for nutrient cycling, and hence for plant productivity and plant N con-centrations, and thus again for herbivores attraction. Recent evidence suggests thatthis may be a promising avenue for explaining many of the seemingly contradictoryresults (Sankaran and Augustine 2004, Hamza and Anderson 2005, Startsev andMcNabb 2007, Sørensen et al. 2009). Empirical studies that have taken tramplingeffects of herbivores into account have done so in a very narrow window of abioticsoil parameters and have therefore not been able to show effects on N cycling (Curlland Wilkins 1983, Mikola et al. 2009). Here we propose a general framework that
107Large herbivores, N-mineralization and soil compaction

incorporates effects of herbivores on soil physical parameters into current theoriesof N cycling (Fig 7.1). This will advance our understanding of contrasting results ofgrazing on N mineralization rates in natural grasslands. To illustrate how largeherbivores can modify N cycling by means of trampling induced soil compaction,we use data on soil parameters and vegetation composition from long term fieldexperiments.
Explaining contrasting effects of herbivores on mineralizationSeveral mechanisms have been suggested to explain contrasting effects of largeherbivores on N mineralization (see Fig 7.1). The main focus has been on herbivoreeffects on the quality of resources entering the soil food web. First, herbivores mayspeed up or slow down N mineralization by returning excreta to the soil. On theone hand, herbivore excreta provide easily available N which stimulates theactivity of soil microbes (McNaughton et al. 1997a, 1997b). On the other hand,herbivores return N in different forms, i.e. as urea and faeces which have differentdecomposition rates, also dependent on microclimate conditions (Hobbs 1996). Ureaprovides rapidly degradable N, whereas faeces are much slower to decompose,sometimes even slower than plant detritus. Therefore, N excreted in faeces mayreduce N mineralization rates (Pastor et al. 2006).
108 Chapter 7
Excreta
SOM C/N
Soil fauna Soil aeration
Plant C/N
NO3- NH4
-
Largeherbivores
Litter C/N
Microbes
Figure 7.1 Overview of the influence of large herbivores on the nitrogen (N) cycle in grasslands.This diagram depicts three main pathways via which herbivores can influence soil N mineralization.Prevailing theories mainly focus on the two pathways via which herbivores alter the quality ofresources entering the soil food web, i.e., by excreting dung and urine and by changing plant quality.The third pathway focuses on herbivore effects on soil physical properties. For example, trampling-induced soil compaction may decrease aeration and consequently alter soil N mineralization. Inthis figure we integrate the three pathways which will lead to a better understanding of N cyclingin terrestrial ecosystems.

Second, a combination of plant quality and herbivore selectivity may explaincontrasting results of herbivores on N mineralization (Ritchie et al. 1998, Pastor etal. 2006). When quality of the dominant plant species is high, herbivores can forageunselectively and return N in urea, which favours growth of fast-growing grazing-tolerant plants (Olff and Ritchie 1998). This can lead to the formation of grazinglawns and to a general increase in N mineralization. However, when the dominantplants are of poor quality, herbivores selectively feed on the high quality subordi-nate species (as legumes vs. grasses in grasslands, or deciduous tree saplings vs.conifers in forests), which then leads to a shift in community composition towardspoor quality species (Pastor et al. 2006). A decrease in plant quality will lead toreduced litter quality and hence may slow down decomposition and mineralizationrates (see Table 7.1, Berendse et al. 1989, Wardle et al. 2004, Bardgett 2005). Conse-quently, herbivores may affect N mineralization in contrasting ways along agradient of soil fertility. At high fertility sites, where plant quality is high, herbi-vores may change community composition through inducing a positive feedback ontheir own abundance by increasing N mineralization and at low fertility sites withlow plant quality they may induce a negative feedback (Pastor et al. 1993, Ritchie etal. 1998, Augustine et al. 2003). Whereas examples can be found that support thistheory (Pastor et al. 1993, Ritchie et al. 1998), contrasting results are found in otherstudies. For example, at sites with high soil fertility and high plant quality, such assalt marshes and river floodplains, herbivores have been shown to reduce N miner-alization instead of improve it (van Wijnen et al. 1999, Bakker et al. 2004). Hence,both mechanisms described above do still not satisfactorily explain contrastingeffects of herbivores on N cycling and neither explicitly take effects of large herbi-vores on soil physical parameters into account.
Changes in soil physical properties can have a major influence on nutrientmineralization (Hamza and Anderson 2005, Startsev and McNabb 2007) and theeffects may be dependent on environmental conditions. For example, in arid envi-ronments biomass removal by herbivores can reduce plant cover and litter inputto the soil, which may lead to reduced water holding capacity of the soil andincreased soil evaporation (van de Koppel et al. 1997). Moreover, in these systemssoil compaction by trampling can reduce infiltration of water into the soil. Conse-quently, in arid environments soil organic matter and water may become limitingfor N mineralization in grazed conditions. Herbivores may also affect soil tempera-ture by modifying the insulating capacities of the vegetation through the removalof biomass (Gornall et al. 2009). In cold systems reduced vegetation cover may leadto cooling down of the soil in cold periods, thereby decreasing N mineralization,while in warm periods, soils with low vegetation cover may heat up quickly,which favours mineralization. These examples show that herbivores can modifysoil physical properties, which can have important consequences for soil Ncycling.
109Large herbivores, N-mineralization and soil compaction

Therefore, we propose that adding herbivore impact on soil physical propertiesto current models of herbivore effects on N mineralization rates will stronglyimprove our understanding of the contrasting effects of herbivores on N mineral-ization (Fig 7.1). From here onwards we will discuss our proposed integratedapproach using consequences of soil compaction in temperate grassland as anexample showing how this integrated approach may advance our understanding ofN cycling in grazed ecosystems.
How trampling-induced soil compaction can reduce N mineralizationin grasslandsIn every soil some pores will contain water and others will contain air. The amountof water a soil can hold depends on many different factors. Water holding capacityis increased when clay and organic matter content are high or when the fraction ofsmall pores is large (see Bardgett 2005). When soils get compacted, for example as aresult of trampling by large herbivores, pore size is reduced, which enhances thefraction of small pores and hence increases water holding capacity (Wolkowski1990). Generally, when more than 60% of pores are water-filled, diffusion of oxygenis severely hampered because diffusion in water happens 10,000 times slower thanin air (Russell 1973). Consequently, in compacted soils oxygen may become limitingfor microbial processes, but also for soil fauna and metabolism of plant roots. Thismay lead to lower N availability because on the one hand nutrient mineralization isslowed down (Breland and Hansen 1996, Jensen et al. 1996, De Neve and Hofman2000) and on the other hand because denitrification is sped up under anaerobicconditions (e.g. Haunz et al. 1992, De Klein and Van Logtestijn 1994, Lipiec andStepniewski 1995). Wollersheim et al (1987) showed experimentally that increasedbulk density resulted in reduced soil aeration which led to elevated soil moisturelevels and denitrification rates.
As the amount of small pores increases in compacted soils, pores available tosoil fauna are reduced (Breland and Hansen 1996). Moreover, organic material andmicrobial biomass become physically protected against attack by soil fauna andmicrobial feeders, respectively (Breland and Hansen 1996). Consequently, soil faunadensities are found to decrease in more compacted or trampled soils (Whalley et al.1995, Bouwman and Arts 2000, Sørensen et al. 2009). Higher trophic level soilfauna do not directly mineralize nutrients, i.e. convert organic matter into inor-ganic forms, but they may affect mineralization rates of microbes and hence theavailability of mineral nutrients in the soil (Table 7.1, Osler and Sommerkorn 2007).Several studies report a contribution of soil fauna to nutrient mineralization rates(Verhoef and Brussaard 1990, de Ruiter et al. 1993, Bardgett and Chan 1999, Berg etal. 2001). Particularly, in situations where the microbial community is N limited,the contributions of soil fauna to net N mineralization rates may be relatively high(Osler and Sommerkorn 2007).
110 Chapter 7

111Large herbivores, N-mineralization and soil compaction
Tab
le 7
.1O
verv
iew
of
proc
esse
s de
term
inin
g n
utr
ien
t m
iner
aliz
atio
n. D
irec
tion
in w
hich
the
se p
roce
sses
are
infl
uen
ced
by s
oil c
ompa
ctio
n is
indi
cate
du
sin
g si
gns.
Fact
ors
affe
ctin
g m
iner
aliz
atio
nm
ain
expl
anat
ion
dire
ctio
na
Pla
nts
plan
t qu
alit
y+
enha
nce
d av
aila
bili
ty o
f n
utr
ien
ts s
tim
ula
tes
deco
mpo
ser
acti
vity
a)
oxyg
en t
ran
spor
t th
rou
gh r
oots
+m
arsh
pla
nts
use
aer
ench
ym t
o tr
ansp
ort
oxyg
en, l
ocal
ly in
crea
sin
g ba
cter
ial p
rodu
ctio
n b
)ro
ot e
xuda
tes
+in
put
of c
arbo
n in
to t
he s
oil c
ause
s hi
gher
mic
robi
al p
rodu
ctio
n c
)
Lar
ge h
erb
ivor
esde
foli
atio
n o
f ve
geta
tion
+de
foli
atio
n r
esu
lts
in h
ighe
r ro
ot e
xuda
tion
an
d li
tter
qu
alit
y ca
usi
ng
high
er d
ecom
posi
tion
d)e
)du
ng
and
uri
ne
prod
uct
ion
+n
itro
gen
in w
aste
s be
com
es e
asil
y av
aila
ble
to m
icro
orga
nis
ms
and
plan
ts f
) g)
chan
gin
g pl
ant
spec
ies
com
mu
nit
y+
/-pr
efer
enti
al f
eedi
ng
on h
igh/
low
qu
alit
y re
sult
s in
hig
h/lo
w q
ual
ity
vege
tati
on a
nd
litt
er i)
tram
plin
g+
/-+
lit
ter
avai
labi
lity
to
deco
mpo
sers
incr
ease
s h)
- h
igh
tram
plin
g re
sult
s in
an
oxic
soi
l whi
ch in
hibi
ts d
ecom
posi
tion
(thi
s pa
per)
Soil
fau
na
incr
ease
d or
gan
ic m
atte
r av
aila
bili
ty
+so
il f
aun
a pe
llet
s se
rve
as f
avou
rabl
e m
iner
aliz
atio
n s
etti
ng
j)to
mic
robe
sst
imu
lati
ng
min
eral
izat
ion
in g
ut
+gu
ts o
f ea
rthw
orm
s, t
erm
ites
, mic
roar
thro
pods
sti
mu
late
soi
l mic
robi
al d
ecom
posi
tion
k),
l)ex
cret
ing
exce
ss n
utr
ien
ts
+by
for
agin
g on
mic
robe
s, s
oil f
aun
a ac
cele
rate
s n
utr
ien
t m
iner
aliz
atio
n ("
mic
robi
al lo
op")
m)
biot
urb
atio
n+
term
ites
, mic
e, e
arth
wor
ms,
an
ts c
reat
e m
acro
pore
s by
dig
gin
g an
d bu
rrow
ing
acti
viti
es n
), o)
Soil
par
amet
ers
soil
fer
tili
ty+
/-hi
gh s
oil f
erti
lity
yie
lds
high
min
eral
izat
ion
, low
soi
l fer
tili
ty le
ads
to lo
wer
min
eral
izat
ion
p)
com
pact
ion
in c
lay
soil
-co
mpa
ctio
n c
ause
s lo
wer
soi
l aer
atio
n r
esu
ltin
g in
hig
h de
nit
rifi
cati
on a
nd
low
min
eral
izat
ion
q)
com
pact
ion
in s
andy
soi
l+
com
pact
ion
cau
ses
high
er li
tter
infi
ltra
tion
an
d th
eref
ore
high
er n
utr
ien
t av
aila
bili
ty t
o so
ilde
trit
ivor
es q
)so
il m
oist
ure
+
/-m
iner
aliz
atio
n w
orks
opt
imal
un
der
inte
rmed
iate
moi
stu
re c
ondi
tion
s. B
oth
in d
ry a
nd
very
wet
soi
ls m
iner
aliz
atio
n is
impe
ded.
r)
aIn
dica
tes
whe
ther
min
eral
izat
ion
is g
ener
ally
enh
ance
d (+
) or
decr
ease
d (-
)
a) (W
ardl
e 19
98);
b) (
Vart
apet
ian
and
Jack
son
1997
); c
) (B
ardg
ett
et a
l. 19
98);
d) (
Bri
ske
et a
l. 19
96);
e) (
Ferr
aro
and
Oes
terh
eld
2002
); f
) (A
fzal
and
Ada
ms
1992
); g
)(B
ogae
rt e
t al
. 200
0);
h) (Z
ache
is e
t al
. 200
1, 2
002)
; i)
(Rit
chie
et
al. 1
998,
War
dle
2002
); k
) (T
rigo
et
al. 1
999)
; l)
(Dan
iel a
nd A
nder
son
1992
); m
) (C
larh
olm
198
5);
n)(L
avel
le e
t al
. 199
7);
o) (B
row
n et
al.
2000
); p
) (Sa
nkar
an a
nd A
ugus
tine
200
4);
q) (R
asia
h an
d K
ay 1
998)
; r)
(Bar
dget
t 20
05)

Effects of trampling on plant growthSoil compaction may have severe consequences for the growth of plants. Moststudies report negative effects of grazer-induced soil compaction on plant growth(Abdelmagid et al. 1987b, Menneer et al. 2005, Hamza and Anderson 2005, Drewryet al. 2008). On the one hand, N mineralization rates in compacted soils may bereduced which will result in a decrease in plant production and a higher dominanceof plant species performing better on soils with lower N availability. On the otherhand physical effects of soil compaction may lead to oxygen limitation and water-logging, resulting in increased abundance of plant species better adapted to thesecircumstances. When the available oxygen gets used up by soil microbes other elec-tron acceptors will be used for bacterial metabolism. Anoxic oxidation processesresult in a lower redox potential because of the production of reduced compounds(Laanbroek 1990). These compounds (Mn2+, H2S, Fe2+) together with the lack ofoxygen may severely harm root metabolism. This often leads to root death (Jacksonand Armstrong 1999), sometimes within a few hours (Elzenga and van Veen 2010).Plant species may adapt to hypoxia and waterlogging in compacted soils by formingaerenchym, which serves as an alternative pathway for supply of oxygen to theroot other than diffusion through soil pores (Table 7.1, Jackson and Armstrong1999). Consequently, on wet soils that have been compacted, we expect an increasein plant species with aerenchym in their roots, as well as a shift towards plantsperforming better under conditions of lower nutrient availability.
Soil compaction along environmental gradientsEffects of soil compaction on nitrogen mineralization are often reported to be nega-tive (Hamza and Anderson 2005). However, the strength and direction of soilcompaction effects depend on different soil properties including soil type and soilmoisture content (Table 7.1, Kiehl et al. 2001, Hamza and Anderson 2005). There-fore, contrasting effects of herbivores on N mineralization may be explained bycontrasting effects of large herbivores on soil compaction along environmentalgradients of soil type, rainfall and temperature.
In sandy soils, compaction may enhance soil nutrient availability as a result ofhigher nutrient diffusion rates (Voorhees et al. 1985, Rasiah and Kay 1998, Xu et al.2008), less leaching of nutrients (Xu et al. 2008) and better water retention. Thepositive consequences of compaction in sandy soils become negative when consid-ering soils that are rich in silt and clay (Rasiah and Kay 1998), because fine-textured soils are much more compactable by trampling than sandy soils. Thisyields an interesting effect where the positive effects of finer texture on nutrientavailability can be undone by the negative effects of soil compaction under grazing.Soil moisture content is also an important determinant of effects of soil compactionon nutrient cycling. In very dry soils herbivores may enhance water availabilitybecause compaction may increase water retention and disturbances of the soil top
112 Chapter 7
layer can increase water infiltration (Abdelmagid et al. 1987a) which results inhigher mineralization rates. In contrast, in wet soils compaction may reduce oxygenavailability thereby decreasing mineralization rates. The effect of soil type ofteninteracts with hydrological conditions, because clay and peat soils commonly occurunder wetter conditions (e.g. high groundwater tables, flooding) than sandy soils.
The effects of soil compaction can be organized along the axes of soil type andsoil moisture. Across these axes, soil compaction in dry and sandy soils has small,stimulating effects on N mineralization. In wet and clay soils effects will be largerbecause they are more susceptible to compaction and compaction will often lead toa reduction of N mineralization. Consequently, we expect that the effect of tram-pling-induced soil compaction on mineralization rates varies across environmentalgradients. Trampling may have little or no effect on mineralization in habitats withnon-compactable sandy soils, while they may strongly reduce mineralization onwet and clayey soils.
Herbivore effects on plant community composition through modification ofsoil physical properties– examplesEmpirical studies that try to explain contrasting results of herbivores on N cyclingin natural systems through herbivore effects on soil physical properties are stilllacking. Most recent studies that have attempted to quantify the relative impor-tance of soil compaction on N mineralization rates focused on agricultural systemswith supposedly proper drainage facilities (Curll and Wilkins 1983, deBruyn andKingston 1997, Mikola et al. 2009). However, effects of soil compaction via water-logging and oxygen limitation on plant communities may play a more importantrole in areas without artificial drainage. Therefore, we analyzed data from existinglong-term management experiments in Dutch grassland systems to get first insightin effects of herbivores on soil compaction and hence on plant community composi-tion. From the plant community responses we aim to imply the consequences for Nmineralization, as these were not directly measured in these studies. We specificallyaddress (1) how herbivores affect soil compaction, (2) how increased soil compactionresults in a shift in plant community composition, and (3) what these changes in soilcompaction and plant community composition imply for N mineralization rates.
Experimental set up and data analysisWe used data from a grazing experiment on the salt marsh of Schiermonnikoog(53º30’N, 6º10’E), which was set up in the 1970s on a clay soil. We studied soilphysical properties and plant community composition in a cattle-grazing treatment(stocking rate 1 cow ha-1), and a hand-mowing treatment. In both treatmentsaboveground biomass was removed, but the treatments potentially differed inlevels of soil compaction. We collected soil cores in 2010 to measure herbivoreeffects on soil physical properties (Table 7.2). In addition, we used data from three
113Large herbivores, N-mineralization and soil compaction

mowing experiments located in the river valley of the Drentsche Aa (53ºN, 6º43’E),also set up around 1970. In these experiments no cattle-grazing treatments wereavailable, but there were plots that were mown with heavy machines and plotsthat were hand mown. Therefore, we could use these experiments to confirmwhether soil compaction affected plant community composition, because on bothmowing treatments aboveground biomass was removed, while levels of soilcompaction potentially differed. The three sites were located on different soil types,i.e. an organic soil (Lammertshem), a sandy soil (Loefvledder B), and an interme-diate (Loefvledder A). Experiments in Loefvledder A and B are still maintained, butthe experiment at Lammertshem was terminated in 1983 because the site wasrewetted. We collected soil cores in 2010 in Loefvledder A and B to measure soilphysical properties in the different mowing regimes. More details on setup of thefour field experiments that we used can be found in (Bakker 1989).
In wet areas, like our study sites, soil compaction usually leads to higher soilmoisture and hypoxia. Therefore we tested vegetation responses by comparing thecover of aerenchym and non-aerenchym producing plant species in the differentmanagement regimes (Justin and Armstrong 1987). For Schiermonnikoog, and theLoefvledder A and B sites we used recent plant cover data (1994-2003) because itmay take some time for plant communities to respond to the management regimes.For Lammertshem we used data from 1980-1983 since the experiment was notcontinued after 1983. To study the potential impact of soil compaction and hypoxiaon N mineralization we used Ellenberg indicator values for nitrogen (Ellenberg etal. 1992) for the data from Loefvledder A and B only, because in these sites Ellen-berg indicator values are well calibrated and commonly used for wet river valleysites (Ozinga et al. 2009). A shift towards lower Ellenberg N values would indicate areduction in the cover of nitrophilous plant species and hence may imply loweravailability of mineral N in the soil and possibly slower nutrient cycling.
Results
On the salt marsh of Schiermonnikoog we found significantly increased levels ofsoil bulk density (i.e. the herbivores compacted the soil) in the grazed sites, soilmoisture and soil organic matter content (Table 7.2). The plant communityresponded to the altered soil physical conditions with a shift in community compo-sition. In grazed, i.e. more compacted, plots we found significantly higher coveragesof aerenchym producing plant species (Fig 7.2A), which are adapted to periods oflow oxygen availability in the soil.
In Loefvledder A we did find increased levels of soil bulk density in machine-mown plots, but differences in weight per volume between soil organic matter andsand masked the much higher degree of compaction probably present at the site
114 Chapter 7

115Large herbivores, N-mineralization and soil compaction
Table 7.2 Soil physical properties for Schiermonnikoog in cattle-grazed and hand-mown plots.Values are averages ± standard error. Asterisks indicate level of significance: * P<0.05, ** P<0.01,*** P<0.001
Cattle-grazed Hand-mown N t
Soil physical properties
Soil moisture content (%) 55.1 ± 3.6 42.7 ± 4.5 6 3.7 **
Soil organic matter content (%) 8.4 ± 2.4 4.2 ± 0.8 6 2.3 *
Bulk density (g dry weight/ml soil) 0.60 ± 0.05 0.52 ± 0.03 6 4.0 **
00
120
20
40
60
80
100
% c
over
pla
nts
with
out a
eren
chym
10 20 30 40 50
% cover plants with aerenchym
A B
C Dcompacted treatmentnon-compacted treatment
0
120
20
40
60
80
100
00
20
40
60
80
20 40 60 80
60
20
30
40
50
0 20 40 60 80 0 10 20 30 40 50
n = 6t = 1.54P = ns
n = 6t = 2.95P < 0.05
n = 6t = 4.17P < 0.01
n = 4t = 1,54P < 0.05
Figure 7.2 Cover of plant species without aerenchym plotted against the cover of plant specieswith aerenchym in four different study sites under different management regimes and hencedifferent levels of soil compation. a) salt-marsh Schiermonnikoog, b) Loefvledder A in theDrentsche Aa river valley , c) Loefvledder B in the Drentsche Aa river valley, and d) the Lammerts-hem in Drentsche Aa river valley. Closed circles represent compacted treatments (cattle-grazed ormachine-mown) and open circles represent non-compacted treatments (hand-mown). In a), b) andc) each data point represents the average cover of plant species per plot over the last 10 years ofthe experiments (1994-2003). In d) each data point represents the average cover of plant speciesover the last 4 years (1980-1983).

(Table 7.3). In Loefvledder B soil physical properties were not different between themanagement regimes (Table 7.3), probably because this site was situated on a moresandy soil, which is less compactable. The observed soil physical conditions werereflected in the plant community composition. In Loefvledder A (Fig. 7.2B), as wellas the Lammertshem (Fig. 7.2D) we found a significant shift towards highercoverage of aerenchym species in machine-mown compared to hand-mown plots,while in Loefvledder B there was no difference between the mowing treatments(Fig 7.2C). Similarly, Ellenberg N indicator values at the Loefvledder A site weresignificantly lower in machine-mown than in hand-mown plots (Table 7.3), whilewe did not find a difference in Loefvledder B plots (Table 7.3).
Conclusion of the examplesThe long term experiment on Schiermonnikoog shows that herbivores alter soilphysical conditions in such a way that lower N mineralization rates are expected;and these changes in soil properties are reflected in the plant community. Theanalysis of the Drentsche Aa data confirmed that changes in soil physical propertiesas a result of soil compaction may show up in the plant community. It also showedthat cover of nitrophilous plant species was reduced suggesting that N mineraliza-tion may be lower in compacted soils. Moreover, it implied that the influence ofcompacting agents (in this case heavy machines) on levels of compaction, plantcommunity composition, and N mineralization rates depends on environmentalconditions like soil type and soil moisture content, because on sandy, thus less-compactable, soils we did not measure a response to soil compaction.
116 Chapter 7
Table 7.3 Soil physical properties and Ellenberg N indicator values for Loefvledder A and B inmachine-mown and hand-mown plots. Asterisks indicate level of significance: * P<0.05, ** P<0.01,*** P<0.001. We present Ellenberg indicator values as a weighted average per mowing treatment.For each plot we multiplied the N indicator value by the % vegetation cover with that value.
Machine-mown Hand-mown N t
Soil physical properties Loefvledder A
Soil moisture content (%) 73.7 ± 2.3 66.7 ± 2.4 6 7.6 ***
Soil organic matter content (%) 46.7 ± 5.2 38.5 ± 4.9 6 4.5 **
Bulk density (g dry weight/ml soil) 0.42 ± 0.05 0.41 ± 0.03 6 0.6 NS
Soil physical properties Loefvledder B
Soil moisture content (%) 59.7 ± 1.7 59.9 ± 2.6 6 -0.1 NS
Soil organic matter content (%) 13.2 ± 0.9 11.6 ± 1.0 6 2.5 NS
Bulk density (g dry weight/ml soil) 0.67 ± 0.05 0.68 ± 0.05 6 0 NS
Ellenberg N indicator values
Loefvledder A 17.3 ± 4.5 28.6 ± 1.8 6 -3.5 **
Loefvledder B 36.7 ± 5.2 32.8 ± 4.2 6 0.6 NS

Conclusion
Combination of the modification of soil physical properties by herbivores with thelonger known effects of reducing organic matter C/N ratios allows for the under-standing of contradictory results observed so far of large herbivore impacts onnutrient cycling in grasslands. An integrated framework allows us to study the rela-tive importance of herbivore effects on nutrient cycling via changes in plantcommunities, return of dung and urine to the soil and trampling (Fig 7.1). Whetheroverall effects of herbivores on N mineralization are positive or negative dependson the balance between different mechanisms affecting nutrient cycling (Fig 7.1).When positive effects of grazing on soil organic matter quality via dung, urine andlitter return outbalance negative effects via modification of physical properties, weexpect an overall increase in mineralization rates. On the other hand, negativeeffects may outbalance positive effects, for example in the case of trampling onfine-textured soils. We propose that in temperate ecosystems, the outcome of thebalance is too a large extent predictable because it depends on the interactionbetween soil type and soil moisture content. In systems where soils are not verycompactable, i.e. systems with dry or sandy soils, it is likely that positive effects ofgrazing will dominate. In contrast, in systems where soils are compactable, i.e.systems with organic or clay soils, negative effects may be most important.Different effects are expected when large herbivores have strong impacts on soiltemperature or drought as in arctic or arid ecosystems, but this requires furtheranalysis. To single out whether changes in plant community composition as a resultof soil compaction by herbivores are really related to a lower N mineralization andwhether such effects of herbivores are different along gradients of soil compact-ibility there is a need for field experiments. Such experiments should directly inves-tigate herbivore effects on nutrient cycling, mineralization rates and other soilphysical properties in soil types with different susceptibility to compaction.
The framework presented allows us to understand some of the contradictoryresults in N mineralization that have been found in grasslands previously, but couldnot be explained with the current theories. Analysis of four long-term data setsconfirmed that soil compaction may play a crucial role in explaining nutrientcycling and plant community composition in natural grasslands. However, thereis a need for field experiments directly investigating the relative importance oftrampling-induced soil compaction for nutrient cycling along a gradient of soiltypes.
AcknowledgementsWe thank Theo Elzenga for discussion on our ideas. We are grateful to Yzaak de Vries whocollected 38 years of high quality field data on Schiermonnikoog and in the Drentsche Aa.
117Large herbivores, N-mineralization and soil compaction

Cha
pter
eig
ht

General discussion
G.F. (Ciska) Veen
8

Introduction
Aboveground and belowground organisms structure plant communities (e.g. Grimeet al. 1987, Crawley 1989, Huntly 1991, Milchunas and Lauenroth 1993, Olff andRitchie 1998, van der Putten and van der Stoel 1998, van der Heijden et al. 1998b,Klironomos 2002, Wardle 2002, De Deyn et al. 2003, Bardgett and Wardle 2010).They both influence competitive interactions between plant species, plant growthand plant community composition directly by the removal of plant nutrients andbiomass (Olff et al. 1997, van der Putten and Peters 1997), as well as indirectlythrough the regulation of soil nutrient cycling (Bardgett and Wardle 2003, Wardle etal. 2004). As a result, aboveground and belowground organisms interact with eachother using plants as mediators, which has major consequences for the structureand functioning of terrestrial ecosystems (Wardle et al. 2004). For example, interac-tions between invertebrate aboveground and belowground herbivores have beenfound to be important drivers of species composition and diversity in the plantcommunity (e.g. Brown and Gange 1989, Brown and Gange 1992, van Ruijven et al.2005). The consequences of interactions between vertebrate herbivores and soilorganisms are much less well studied. In my thesis I therefore explored how theinterplay between aboveground vertebrate herbivores and invertebrate soil organ-isms affected plant community composition, structure and diversity in grasslandecosystems. In this chapter I discuss the main results. I address via which path-ways interactions between aboveground vertebrates and soil organisms can bemediated and I discuss the role of soil organisms to drive plant community compo-sition and ecosystem processes in grasslands grazed by vertebrate herbivores. Atthe end of this chapter I will indicate challenges for future aboveground-below-ground research and synthesize the key findings of my thesis.
Pathways of aboveground-belowground interactions
Aboveground effects on the soil communityGrazing by aboveground vertebrate herbivores can affect the activity of soil organ-isms and may change soil community composition (Bardgett et al. 1997, Wall-Freckman and Huang 1998). Such effects of grazing can be mediated via differentpathways. On the one hand aboveground herbivores remove shoot biomass whichalters competitive interactions between plant species and can drive changes inplant community composition (Olff et al. 1997, Olff and Ritchie 1998, Knapp et al.1999). Altered plant community composition may lead to a different soil communitycomposition due to species-specific associations between plants and soil organisms(Yeates 1999, De Deyn et al. 2004b, Viketoft et al. 2005, 2009). On the other handaboveground herbivores alter soil physical conditions and nutrient availability as a
120 Chapter 8

result of trampling, local deposition of dung and urine and changes in plant litterquality and quantity (chapter 7, Steinauer and Collins 1995, Hobbs 1996, Bardgettand Wardle 2003). This in turn can affect soil community composition (Yeates andBongers 1999, Bardgett and Wardle 2003). In chapter 2 I investigated the relativeimportance of these pathways via which herbivores can affect the nematodecommunity composition, a diverse and often highly responsive group of soil biota. Ishowed that herbivore-induced changes in plant community composition weremore important determining the community composition of nematodes than path-ways that involved changes in soil physical conditions. This suggests that the asso-ciation between plants and soil organisms is, at least to some extent, speciesspecific, so that the presence (De Deyn et al. 2004b, Viketoft et al. 2005, 2009) orabsence (Wardle et al. 1999) of certain plant species can alter the soil communitycomposition.
Other studies showed that effects of plant species identity on soil microbialcommunity properties can vary with soil fertility, (Bardgett et al. 1999, Innes et al.2004) and may even be predominantly be determined by soil type and fertility(Harrison and Bardgett 2010). Therefore, it is still preliminary to generalize thatchanges in soil community composition are mediated by plant species composition,instead of by soil physical conditions. Yet, recently Bezemer et al (2010) studiedentire soil food webs and showed that individual plants in a multi-species commu-nity develop their own species-specific soil food web. Zooming in on the nematodecommunity revealed that the same plant species in different communities had moresimilar nematode communities, than different plant species in the same community(Bezemer et al. 2010). Although this study did not investigate the relative impor-tance of soil physical conditions it does confirm that plant species identity, prob-ably as a result of species-specific differences in root traits (e.g. root morphology,exudates, fungal symbionts), is a very important factor driving the composition ofentire soil communities.
Effects of herbivore-induced changes in soil community composition may beaffected by changes in soil abiotic conditions, as well as in plant communitycomposition. Effects of these two pathways may be hierarchically ordered; hencetheir relative importance for driving soil community composition will be dependenton the scale of observation (Ettema and Wardle 2002). At smaller spatial scales asused in many field experiments, (chapter 2, De Deyn et al. 2004b, Viketoft et al.2005, 2009) soil physical conditions may vary too little to allow a vastly differentsubset of the soil community to develop and plant species identity is the mostimportant factor driving soil communities (Fig 8.1, chapter 2, Ettema and Wardle2002). Nevertheless, over longer environmental gradients or time scales changes insoil physical properties will certainly be important selecting a subset of the soilcommunity which can persist under the specific environmental conditions (Fig 8.1).For example, a recent meta-analysis found broad-scale patterns in microbial
121General discussion

biomass and community composition across seven of the major biomes on earth(Fierer et al. 2009). At the ecosystem level distributions of soil biota are often clus-tered according to large-scale landscape gradients (Ettema and Wardle 2002). Largeaboveground vertebrate herbivores could drive such large-scale variation in soilphysical conditions by grazing relatively homogeneously across large scales,thereby affecting large-scale patterns of soil abiotic conditions and resource inputinto the soil food web. This will in turn have an important influence on soilcommunity composition and activity (chapter 7). Thus, depending on the scale ofobservation, vertebrate herbivores are expected to determine large-scale patternsin soil community composition and activity by altering large-scale soil physicalconditions (chapter 7), while small-scale changes in plant growth and communitycomposition become more important determining small-scale species compositionin the soil community (chapter 2, Ettema and Wardle 2002, De Deyn et al. 2004b,Viketoft et al. 2005, 2009, Bezemer et al. 2010).
Plant-soil feedback effectsPlant-induced changes in soil community composition and activity, as well as insoil abiotic conditions, may feed back to change plant performance and plantcommunity composition, a process referred to as plant-soil feedback (Bever et al.1997). Plant-soil feedback effects can be either positive or negative, depending on
122 Chapter 8
long gradientshort gradient
Figure 8.1 Pathways driving soil community composition over long and short environmentalgradients. The symbols belowground indicate soil organisms. Symbols with a different color aresoil organisms belonging to different soil communities (selected for by soil abiotic conditions).Symbols with different shapes are different species of soil organisms (selected for by different plantspecies).

the balance between mutualistic and parasitic interactions in the soil and will bemediated by direct and indirect soil community interaction pathways to plants(Wardle et al. 2004). Direct pathways involve interactions with root herbivores,pathogens and symbiotic mutualists and indirect pathways encompass changes insoil nutrient cycling driven by the decomposer food web (Wardle et al. 2004), aswell as changes in soil abiotic conditions. While direct associations between plantsand root herbivores and pathogens can be highly species-specific (van der Putten etal. 1993), it is generally assumed that indirect interactions in the decomposer foodweb are less species-specific (Yeates et al. 1993, Didden 1993). Such generalistfeeders will therefore be less sensitive to changes in plant and soil communitycomposition. However, plant species identity has been found to also affect generalsoil microbes and decomposers (Grayston et al. 1998, Bezemer et al. 2010). This maybe because the identity of a plant species is important for determining the qualityand quantity of resources entering the soil food web (Bardgett and Wardle 2003).Consequently, even indirect associations between plants and soil decomposers canbe species-specific (Bardgett and Wardle 2010).
The relative importance of direct and indirect pathways mediating plant-soilfeedback is still not fully understood. Also, the contribution of biotic plant-soilfeedback effects for shaping plant communities relative to soil physical conditionsremains largely unknown (Ehrenfeld et al. 2005, Casper et al. 2008), due to thecomplexity of the systems involved. A few recent studies aimed to unravel part ofthese open questions. It has been found that the strength and direction of plant-soilfeedback can be dependent on environmental factors such as soil type (Bezemer etal. 2006) and soil nutrient availability (Manning et al. 2008). These results showthat plant-soil feedback effects can be highly context dependent. Instead, anotherstudy showed that plant-soil feedback effects were generally independent of soiltype and soil fertility (Harrison and Bardgett 2010). Therefore, to better understandthe consequences of plant-soil feedback for plant community structure it will benecessary to focus on interactions between biotic and abiotic, and between directand indirect, components of plant-soil feedback.
Consequences of aboveground-belowground interactions for theplant community
Interactions between aboveground and belowground organisms, either via direct orvia indirect pathways, can have important consequences for plant communitystructure and composition. Spatially separated herbivores may modify each othersimpact on the plant community, because different herbivores can affect plantspecies performance in a specific way. Many studies on consequences of above-ground-belowground interactions for the plant community have been focusing on
123General discussion

invertebrate herbivores (Brown and Gange 1989, Brown and Gange 1992, vanRuijven et al. 2005). These studies revealed that interactive effects of invertebrateaboveground and belowground herbivores on plant community diversity weredifferent from the sum of the separate effects. For example, van Ruijven et al.(2005) found that neutral effects of aboveground grasshoppers on plant diversityand positive effects of belowground wireworms became negative when plantcommunities were exposed to a combination of these herbivores. The impact ofbelowground invertebrate herbivores on plant community structure was modifiedby the presence of aboveground organisms, and vice versa, probably as a result ofchanges in indirect interactions within the plant community.
Such non-additive effects of aboveground-belowground interactions can also beexpected when considering aboveground vertebrate herbivores and soil organisms.Both vertebrate herbivores and soil organisms can remove plant biomass and nutri-ents which affects competitive abilities of plant species (Olff et al. 1997, van derPutten and Peters 1997). Moreover, they may influence soil decomposer activity bychanging the quality and quantity of resource input into the soil food web (Bardgettand Wardle 2003). These changes ultimately result in altered plant growth, speciescomposition in the plant and soil community and patterns of soil nutrient cycling,which in turn may modify net plant-soil feedback effects (chapter 3; Bardgett andWardle 2003), as well as foraging patterns of aboveground vertebrate herbivores(McNaughton 1984, McNaughton et al. 1997a). In chapter 4 – 7 I investigated howaboveground vertebrate grazing modified effects of plant-soil interactions on plantcommunity structure and composition.
Plant-soil feedback effects are mediated via indirect interactions between plantsand soil physical properties, soil decomposers and soil nutrient cycling, as well asvia direct interactions between plants and their root herbivores, pathogens andsymbiotic mutualists (Bever et al. 1997). The net effect of all interactions betweenplants and their associated soil community can be either positive or negative. Ingeneral, plants that experience an overall positive effect (e.g. via interactions witharbuscular mycorrhizal fungi), may be competitively dominant over other species.This will reduce plant diversity (chapter 3, Hartnett and Wilson 1999, Klironomos2002, Bever 2003, Callaway et al. 2004) and will lead to a relatively stable speciescomposition in the plant and soil community (chapter 3). In contrast, negativeplant-soil interactions reduce the competitive abilities of a plant species (van derPutten and Peters 1997), thereby promoting coexistence, diversity (De Deyn et al.2003), spatial heterogeneity (Olff et al. 2000), year-to-year oscillations (chapter 3and 4, Olff et al. 2000, Bever 2003) and succession (van der Putten et al. 1993,Kardol et al. 2006, 2007) in the plant community.
Studies investigating how aboveground vertebrates influence the outcome ofplant-soil feedback have been mainly focusing on changes in soil decomposeractivity and soil nutrient cycling (Bardgett and Wardle 2003). It has been widely
124 Chapter 8

accepted that vertebrate herbivores alter the quality and quantity of resourcesentering the soil food web by affecting root exudation patterns, litter quality andquantity and the deposition of dung and urine. Moreover, vertebrate herbivoreschange soil physical conditions, e.g. soil aeration and soil temperature (chapter 7).These herbivore-induced changes in resource quality and the abiotic environmentcan influence the activity and species composition in the soil food web, whichdrives soil nutrient cycling and determines soil nutrient availability and plantgrowth (chapter 7, Holland and Detling 1990, McNaughton et al. 1997a, Frank andGroffman 1998, Bardgett and Wardle 2003, Sørensen et al. 2008). In many systemsvertebrate herbivores have been suggested to speed up nutrient cycling byproviding easily available resources to decomposers in the form of dung and urine(McNaughton 1984) In contrast, vertebrate herbivores can have a negative influ-ence on nutrient cycling because selective grazing on palatable plants can lead to areduction in plant and litter quality (Ritchie et al. 1998, Pastor et al. 2006). More-over, depending on soil texture and soil moisture levels, trampling by vertebrateherbivores may compact the soil which can reduce the abundance of soil organismsand may result in soil hypoxia. Such changes in plant quality and soil physicalconditions can accordingly inhibit decomposition and mineralization rates (chapter7). Whether herbivores stimulate or slow down soil nutrient cycling depends on thebalance between positive and negative effects of grazing on the decomposer foodweb and soil mineralization rates (chapter 7). The net effect of herbivores on soilnutrient cycling potentially alters the overall strength and direction of plant-soilfeedback effects, because a stimulation of soil nutrient cycling will result in morepositive plant-soil feedback, and vice versa. Thus, herbivores can modify plant-soilfeedback interactions via the indirect pathway of soil nutrient cycling, which hasimportant consequences for plant growth on the short term (Bardgett and Wardle2003, Sørensen et al. 2008) and for plant community composition on the long term(chapter 7; Bardgett and Wardle 2003).
Vertebrate herbivores not only modify plant-soil feedback via indirect associa-tions between plants and soil decomposers; they may also change the speciescomposition and abundance of root herbivores, pathogens and symbiotic mutualiststhat are directly associated with plant roots. Direct interactions between roots andsoil organisms can be highly species-specific (van der Putten et al. 1993), and there-fore plant species identity can be a major determinant of species composition in thesoil community (De Deyn et al. 2004b, Viketoft et al. 2005, 2009, Bezemer et al.2010). Consequently, herbivore-induced changes in plant species composition mayalter soil community composition (chapter 2). Moreover, in response to grazing,plants can alter biomass allocation among roots and shoots (e.g. van der Maarel andTitlyanova 1989), which affects the availability of resources for root consumers andhence the abundance of root mutualists and antagonists in the soil. Changes in thespecies composition in the soil community and in the abundances of root herbi-
125General discussion

vores, pathogens and mutualists may affect the strength and direction of plant-soilfeedback. For example, when the abundance of deleterious soil pathogens is stimu-lated plant soil feedback effects can become more negative, while it becomes morepositive when pathogen pressure is reduced.
The previous examples indicate that vertebrate herbivores have the potential tomodify the strength and direction of plant-soil feedback effects. However, howvertebrate herbivores affect net plant-soil feedback interactions and how plant-soilfeedback effects in turn drive plant community composition in different vertebrategrazing regimes is still largely unknown, particularly because direct interactionsbetween plants and root consumers have been rarely considered in this context. Iused a greenhouse experiment to investigate the response of plant species to soilsthat had a different vertebrate grazing history and that were either incubated withconspecific or with heterospecific plant species (chapter 4). I found that all plantspecies performed worse in soils from conspecifics than in soils from hetero-specifics, regardless of grazing history of these soils. Thus, plant-soil feedbackeffects were generally negative and not modified by the vertebrate grazing regime(chapter 4). Such negative species-specific effects of soil organisms on competitiveabilities of plants can result in small-scale heterogeneity in the plant community inboth space and time (van der Putten and van der Stoel 1998, Olff et al. 2000, vander Putten 2003, Bever 2003). However, I found that spatiotemporal plant commu-nity patterns in the field were relatively stable under vertebrate grazing, even ifplant species experienced strong negative plant-soil feedback (chapter 4). Probablyvertebrate herbivores can exert such a strong control on the plant community thatsoil organisms have little opportunity to drive plant species composition (chapter 4and 5). Particularly when herbivores intensively feed on dominant, grazing-intol-erant plant species, these plant species will not get the opportunity to reach highabundances in the plant community or may even be removed when they can notrecover from being grazed (Fig 8.2B). In such situations only plants that tolerategrazing well will be able to maintain themselves in the community, regardless ofplant-soil feedback effects (chapters 4 and 5, Fig 8.2B). In the absence of largeaboveground vertebrates soil organisms may take over the control on plant commu-nity composition and dynamics, at least partly. In that situation, strong negativeplant-soil feedback may reduce the competitive ability of specific plant species, sothat other species can outcompete them (Fig 8.2A, van der Putten et al. 1993, vander Putten and Peters 1997), which can promote small-scale spatiotemporal plantcommunity patterns (chapter 4, Fig 8.2A, van der Putten and van der Stoel 1998,van der Putten 2003, Bever 2003). Not only in the absence of vertebrate herbivores,but also under more extensive grazing conditions or in the presence of very selec-tive vertebrates that specifically respond to plant community changes induced byplant-soil feedback effects, soil organisms can become important drivers of plantcommunity composition and dynamics (chapters 5 and 6, Dean et al. 1997, Lenoir
126 Chapter 8

127General discussion
AHerbivore
Herbivore HerbivoreC D
B
Plant A Plant B
Soil A Soil B
Plant A Plant B
Soil A Soil B
Plant A Plant B
Soil A Soil B
Plant A Plant B
Soil A Soil B
Figure 8.2 Different scenarios showing how plant-soil feedback may drive the dynamics of twoplant species in the absence (A) and presence (B, C and D) of aboveground vertebrate herbivores.Boxes represent the organisms involved in the particular scenarios. Boxes are connected by arrowsshowing effects of one organism on another. The thickness of the arrows indicate the strength ofeffects and “+” and “–” the direction of the effects. Plant A represents a certain plant species A,associated with its species-specific soil community Soil A. Similarly, Plant B is species B, associatedwith its species-specific soil community soil B. (A) Cyclic dynamics. Both plants experience nega-tive plant-soil feedback. B has the opportunity to replace A when competitive abilities of A declinedue to deleterious effects of its soil organisms, and vice versa. This will lead to cyclic dynamics inthe absence of aboveground vertebrate herbivores. When herbivores are present they may overrule(B) or modify plant-soil feedback effects (C, D) thereby potentially altering the potential of plant-soil feedback to drive plant community dynamics. (B) Herbivores prefer to forage on one of theplant species, for example species A.When plant species A does not tolerate grazing well, species Bwill be the only one that can maintain itself in the community, regardless of plant-soil feedback. Inthis situation, herbivores can overrule plant-soil feedback effects. (C) Herbivores can stimulate soilnutrient cycling through deposition of dung and urine, resulting in more positive plant soil feed-back effects. Such effects may be profitable for all plant species and either the plant species thatcompetes best for the nutrients or the one that tolerates grazing best will become dominant. (D)Herbivores may alter the abundance of soil-borne plant pathogens by changing plant speciescomposition and resource allocation roots and shoots. This may lead to species-specific changes instrength or direction of plant-soil feedback effects. For example, negative plant-soil feedback forplant species B could be increased, while A is still preferred by aboveground herbivores. In such asituation, plant species A and B could coexist through cyclic dynamics or either A or B could domi-nate depending on their competitive interactions and the strength of the negative effects they expe-rience from aboveground and belowground herbivores respectively. (Adapted from: van der Puttenand van der Stoel 1998, van der Putten 2003, Bever 2003).

2009). I will explain this in more detail in the paragraph on “the scale of operationand herbivore selectivity’.
My study revealed that net plant-soil feedback effects, as measured in thegreenhouse experiment, were generally not modified by vertebrate herbivores(chapter 4). This confirms other recent studies that were testing effects of homoge-neous aboveground removal of biomass, i.e. a simulation of vertebrate grazing, anddid not find modified plant-soil feedbacks (Sørensen et al. 2008, Ilmarinen andMikola 2009). However, for one plant species in my experiment, Agrostis capillaris,plant-soil feedback was stronger (more negative) in soils from cattle-grazed situa-tions than in soils from ungrazed situations (chapter 4). These results indicate thatvertebrate herbivores could modify the strength of the feedback, by changing bioticor abiotic soil properties.
Since most plant species experienced negative plant-soil feedback in the green-house, I would have expected that plants performed worse in soils where theirconspecifics had been growing in the field. However, I could not establish a directlink between greenhouse performance and the abundance of plant species in thefield. On the one hand, in a natural situation these plant-soil feedback interactionsmay be overruled by the presence of aboveground vertebrate herbivores, asdiscussed above (chapters 4, 5 and 6). On the other hand, it may be difficult to linkgreenhouse effects to plant community dynamics in the field, because of differencesin the spatiotemporal scale of measurement. Plant-soil feedback effects will behighly local, because individual plant species in a mixed community build up theirown specific soil community (Bezemer et al. 2010), while most data on plantcommunity dynamics are collected over larger scales (e.g. as in chapter 4). Also,plant-soil feedback effects that run via arbuscular mycorrhizal fungi and nutrientcycling may play out over relatively long time scales and hence can become under-estimated in short-term greenhouse experiments (Bardgett and Wardle 2010).Consequently, plant community dynamics in the field may be regulated morestrongly by positive effects of soil nutrient cycling on plant growth than expectedbased on plant-soil feedback experiments in the greenhouse (Fig 8.2C, Bardgett andWardle 2010). Alternatively, plant-soil feedback effects in the field could be directlymodified by grazing as a result of altered resource availability for root herbivoresand pathogens, due to changes in resource allocation within plants or changes inplant community composition (Fig 8.2D). Such direct effects of herbivores on plant-soil feedback effects may not play out in a greenhouse experiment that only takesthe grazing history of a soil into account, and not the actual presence of herbivores(e.g. as in chapter 4). Summarizing, net plant-soil feedbacks that plants experiencein the field may differ from net plant-soil feedback effects that are measured in ashort-term greenhouse experiment. Moreover, in the field plant species can escapehighly local, deleterious effects of soil organisms by shifting to a neighboring patchwhere their own soil-borne pathogens are less abundant (Olff et al. 2000). As a
128 Chapter 8

result, even in plant communities that appear to be relatively stable on the plotscale (chapter 4) plant-soil feedback effects may drive micro-scale dynamics at thescale of individual plants.
In systems that contain few plant species, such as agricultural systems (Bullock1992), as well as natural, species-poor ecosystems (van der Putten et al. 1993) itmay be more straightforward to determine the role of plant-soil feedback in fieldsituations. In these systems it has been clearly shown that soil-borne plantpathogens directly reduce performance and competitive abilities of plant species,which can lead to the decline of entire plant populations and speeding up of vegeta-tion succession (van der Putten et al. 1993). In such assemblages of one or a fewspecies, specific deleterious soil organisms become abundant across a large areaand species cannot escape negative plant-soil feedback effects in space. To betterunderstand the role of plant-soil feedback for entire plant communities in species-rich grasslands it will be necessary to explore local effects of plant-soil feedback ina community context.
Scale of operation and herbivore selectivityLarge vertebrate grazers can overrule plant-soil feedback effects (chapter 4). Theymay exert a strong control on plant species composition over relatively large scales,thereby homogeneously promoting grazing-tolerant species. In such a situationhighly local plant-soil feedback interactions may not be important anymore forstructuring the plant community (chapter 4). These results indicate that differencesin the temporal and spatial scales of operation between aboveground vertebrateherbivores and soil organisms could be important for explaining why large verte-brate herbivores can overrule effects of soil organisms on plant community compo-sition.
Soil organisms live in a micro world of soil particles and pores filled with wateror air, which limits their mobility. Many invertebrate and microbial soil organismsare restricted to a home range of a few centimeters or meters in their whole life-time and generally only explore the vicinity of an individual plant (Mortimer et al.1999). In contrast, aboveground organisms live in an open world consisting of airwith little resistance to movement. They are more mobile and may explore areas ofseveral square kilometers within a day. As a result, individual soil organismsinteract mostly with one or a few plants, while vertebrate herbivores can interactwith multiple plants and different plant species. This has important consequencesfor the spatial scales at which soil organisms and vertebrate herbivores affect plantspecies distribution and thus for the influence of aboveground-belowground inter-actions on plant community structure and ecosystem functioning (De Deyn and vander Putten 2005, van der Putten et al. 2009).
The distribution of soil organisms is determined by a hierarchy of factors. Atlarge spatial scales soil biota are aggregated according to landscape gradients in soil
129General discussion

physical conditions, while at more local scales patchiness in plant species composi-tion and differences in growth rate between individual plants are key drivers(Ettema and Wardle 2002). The patterning of soil organisms drives the spatialdistribution of soil nutrient supply, and of soil-borne plant mutualists andpathogens. That in turn determines the scale at which soil biota affect ecosystemprocesses, plant species distribution and plant community composition (Ettema andWardle 2002). For example, social subterranean invertebrates such as termites andants show a clear spatial aggregation across the landscape. They create physicalstructures, and the spatial distribution of these structures drives spatial patterningin the plant community (Spain and McIvor 1988, Blomqvist et al. 2000).
The scale at which aboveground vertebrate herbivores affect the plant commu-nity is generally associated to their body size. Large vertebrate herbivores needhigh quantities of food, but require less energy per unit body mass than small ones(Demment and Van Soest 1985). Therefore, large herbivores can forage less selec-tively (Olff et al. 2002, Hopcraft et al. 2010), are expected to have large home ranges(Haskell et al. 2002) and will neglect detail in their environment (Ritchie and Olff1999, Laca et al. 2010). They forage at a coarser grain and may avoid fine-scaleplant patches (Cromsigt and Olff 2006). As a result, effects of large, unselectivevertebrate herbivores on the plant community are will appear on a larger scalethan effects of small, selective vertebrate herbivores, which can be highly localized(Bakker 2003).
The spatial scale at which aboveground and belowground organisms perceiveand affect plant patterns will determine how they respond to each other changes inplant growth and plant species composition. Large, less selective vertebrate herbi-vores that forage on a coarse grain may not perceive and respond to local effects ofsoil organisms on the plant community. As a result, they are not particularlyattracted to small, high-quality patches (Cromsigt and Olff 2006), such as plantpatches on ant mounds (chapter 6) and exert a relatively constant grazing pressureacross large spatial scales (chapter 6). As a result, large vertebrates homogenizesmall-scale plant community patterns (chapter 6, Bakker 2003), thereby overrulinghighly local plant-soil feedback effects (chapters 4, 5, and 6, Fig 8.3, Fig 8.4). Incontrast, vertebrate herbivores are not expected to overrule interactions betweenplants and soil organisms when they operate across scales more similar to thescales at which soil organisms affect the plant community (chapter 6, Fig 8.3, Fig8.4). For example, small selective vertebrate herbivores can specifically select nutri-tious patches created by soil-dwelling ants (chapter 6). As a result, small above-ground vertebrates and ants interact trough a positive feedback loop where bothaffect plant community composition in the same patch, leading to very pronouncedsmall-scale plant community patterns (chapter 6, Fig 8.3). Similarly, in Africansavannas foraging patterns of large aboveground vertebrate herbivores were deter-mined by large-scale changes in decomposition rates, food plant quality and plant
130 Chapter 8
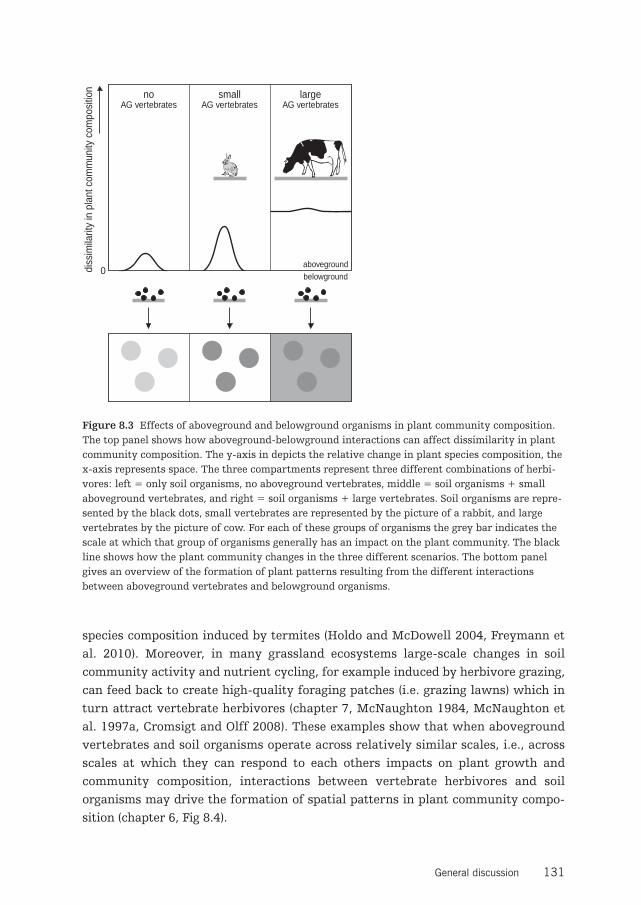
species composition induced by termites (Holdo and McDowell 2004, Freymann etal. 2010). Moreover, in many grassland ecosystems large-scale changes in soilcommunity activity and nutrient cycling, for example induced by herbivore grazing,can feed back to create high-quality foraging patches (i.e. grazing lawns) which inturn attract vertebrate herbivores (chapter 7, McNaughton 1984, McNaughton etal. 1997a, Cromsigt and Olff 2008). These examples show that when abovegroundvertebrates and soil organisms operate across relatively similar scales, i.e., acrossscales at which they can respond to each others impacts on plant growth andcommunity composition, interactions between vertebrate herbivores and soilorganisms may drive the formation of spatial patterns in plant community compo-sition (chapter 6, Fig 8.4).
131General discussion
0diss
imila
rity
in p
lant
com
mun
ity c
ompo
sitio
n
aboveground
noAG vertebrates
smallAG vertebrates
largeAG vertebrates
belowground
Figure 8.3 Effects of aboveground and belowground organisms in plant community composition.The top panel shows how aboveground-belowground interactions can affect dissimilarity in plantcommunity composition. The y-axis in depicts the relative change in plant species composition, thex-axis represents space. The three compartments represent three different combinations of herbi-vores: left = only soil organisms, no aboveground vertebrates, middle = soil organisms + smallaboveground vertebrates, and right = soil organisms + large vertebrates. Soil organisms are repre-sented by the black dots, small vertebrates are represented by the picture of a rabbit, and largevertebrates by the picture of cow. For each of these groups of organisms the grey bar indicates thescale at which that group of organisms generally has an impact on the plant community. The blackline shows how the plant community changes in the three different scenarios. The bottom panelgives an overview of the formation of plant patterns resulting from the different interactionsbetween aboveground vertebrates and belowground organisms.

The scale at which plant community patterns are created by aboveground-below-ground interactions will depend on the scale of operation of aboveground andbelowground organisms (Ettema and Wardle 2002). Differences or similarities in thescale of operation between aboveground and belowground organisms may affectthe outcome of aboveground-belowground interactions at many different levels oforganization from individual plants to large-scale plant community patches (Fig8.4). Along all these levels of organization aboveground and belowground organismsthat operate across more similar scales are likely to be able to respond to eachothers changes in plant growth and plant species composition (chapter 6, Fig 8.4),which may result in more pronounced effects of aboveground-belowground interac-tions on plant community structure and composition. In contrast, abovegroundherbivores that operate across much larger scales than soil organisms may not
132 Chapter 8
solitary AG herbivorousinsects
solitary BG herbivorous insects,plant feeding nematodes
AG
BG
< 10 mm
< 10 mmmatch
e.g. Gange and Brown 1989,Masters and Brown 1992,Gange and Nice 1997,Bezemer et al. 2003,Soler et al. 2007
small AG vertebrate herbivorous(e.g. voles rabbits, hares)
herbivorous BG insects,plant feeding nematodes
AG
BG
1 cm – 1 m
< 10 mmmismatch no studies available
small AG vertebrate herbivorous(e.g. voles rabbits, hares)
small BG vertebrate herbivorous(e.g. moles, pocket gophers) small-scale social BG insects (e.g. ants)
AG
BG
1 cm – 1 m
1 cm – 1 mmatch (chapter 6)
large AG vertebrate grazers(e.g. cattle, wildebeest, bison)
small BG vertebrate herbivorous(e.g. moles, pocket gophers) small-scale social BG insects (e.g. ants)
AG
BG
1 m – 1 km
1 cm – 1 mmismatch e.g. Steuter et al. 1995,
(chapter 6)
large AG vertebrate grazers(e.g. cattle, wildebeest, bison)
large scale social BG organisms
AG
BG
1 m – 1 km
1 m – 1 kmmatch
e.g. Coppock et al. 1983,Ruggiero and Fay 1994,Holdo and McDowell 2004
large AG vertebrate grazers(e.g. cattle, buffalo, bison)
herbivorous BG insects,plant feeding nematodes
AG
BG
1 m – 1 km
< 10 mmmismatch e.g. Wardle et al. 2001,
Veen et al. 2010
Scale Scale match vs. mismatch Organisms Examples
Figure 8.4 A conceptual overview showing how aboveground (AG) belowground (BG) interactionsmay depend on aboveground and belowground scales of operation. When aboveground organismsoperate across much larger scales than belowground organisms (scale mismatch) they may overrulebelowground effects. When aboveground and belowground organisms act on a more similar scale(scale match) they may affect each other and the plant community, without effects in one directionbeing dominant over the other. For different spatial scales of operation (left column) I show howaboveground and belowground organisms may affect each other (middle-left column). I give exam-ples of organisms that may be involved in the interactions (middle-right column) and support theseexamples with references from the literature when available (right column).

perceive changes in plant growth and community composition induced by soilorganisms. They will graze homogeneously on and off plants or plant patchesaffected by soil organisms, thereby potentially overruling plant-soil feedback inter-actions (chapter 4 and 6, Fig 8.4).
Future challenges
Plant-soil feedback in the fieldThe framework of plant-soil feedback has been mainly developed and tested ingreenhouse experiments using individual plant species. Such experiments usuallyconsist of two growing phases, where first a plant is grown to develop a species-specific soil community, and than the soil is used to test effects on subsequent plantgrowth (Brinkman et al. 2010). Such experiments reveal overall effects of plant-soilinteractions for individual plant species, i.e. a positive effect when mutualisticinteractions outbalance parasitic ones and a negative effect in the opposite case.These feedback effects often are extrapolated to predict consequences for plantcommunity composition and diversity in field situations. However, it is not alwaysstraightforward to translate greenhouse results to a field situation (chapter 4). Thismay be because, for example, interactions between plant species (Kardol et al. 2007,Casper and Castelli 2007), soil nitrogen availability (Manning et al. 2008) and soiltype (Bezemer et al. 2006) can modify plant-soil feedback effects. For example,Kardol et al (2007) showed that negative feedback effects experienced by earlysuccessional plant species were enhanced when these plants were grown in mixedplant communities with later succession species. Another study found that negativefeedback effects experienced by plant species in monoculture can be eliminated byinterspecific competition (Casper and Castelli 2007). Moreover, as discussed previ-ously, it may be difficult to link greenhouse plant-soil feedback effects to plantcommunity dynamics in the field, because of differences in the spatiotemporal scaleof measurement. In field experiments highly local effects on plant communitydynamics may not be registered, while in short-term greenhouse experiments long-term effects of soil nutrient cycling on plant growth may be underestimated (Bard-gett and Wardle 2010). Therefore, it is necessary to consider the context in whichplants are growing in the field to be able to conclude whether plant-soil feedbackeffects are important determinants of the composition and dynamics of whole plantcommunities (Harrison and Bardgett 2010).
In order to gain knowledge on context-dependent effects, future studies shouldconsider how the environment modifies plant-soil feedback effects. Ideally plant-soil feedback experiments should be carried out in field situations, although thismay technically be very difficult since it is hard to control and measure soilcommunities. A first step may be to transplant species in the field and to compare
133General discussion

plant performance on locations where conspecifics had been growing withperformance on locations where heterospecifics had been growing. Such transplantexperiments can include manipulation of environmental variables as well. Forexample, nutrient availability can be modified via application of fertilizer, competi-tion may be altered by removing or adding or plant species, and the presence ofaboveground herbivores may be manipulated using exclosures. Including such envi-ronmental manipulations will help us to understand the consequences of plant-soilfeedback relative to soil physical conditions, plant competition, and abovegroundgrazing in a community context.
Modeling aboveground-belowground interactionsAlthough field experiments will be necessary to advance our knowledge of above-ground-belowground interactions in natural communities, it is hard to measure andmanipulate soil communities. Therefore, it remains a major challenge to quantifyeffects of soil organisms on plant community structure and composition in naturalecosystems. This is where mathematical models become very useful to increase ourunderstanding of aboveground-belowground interactions and their consequencesfor the plant community. Such models can help us to single out crucial parametersthat affect the strength and direction of interactions between aboveground andbelowground organisms. That will help to generate focused questions for newempirical, preferably field, experiments.
Recently different models that study plant-soil interactions have been developed(Bever et al. 1997, Bever 2003, Umbanhowar and McCann 2005, Eppinga et al.2006, Eppstein et al. 2006, Eppstein and Molofsky 2007), but very few modelsconsidered the influence of aboveground herbivores (or higher trophic organisms) atthe same time. Only Meyer et al (2009) use an aboveground-belowground multi-trophic approach. They show that third-trophic levels and decomposers can have aconsiderable influence on plant and herbivore performance. These results revealthat is important to include high-order multitrophic interactions to understandpossible consequences of aboveground-belowground interactions for speciescomposition in natural communities. This example illustrates that models mayimprove our understanding and a combined theoretical-empirical approach mayhelp us to take the next step in aboveground-belowground empirical research.
Key issues in aboveground-belowground research that can be addressed using atheoretical approach are (1) how does the complexity of possible interactions affectaboveground-belowground interactions, (2) how do abiotic environmental condi-tions modify biotic plant-soil feedback effects, and (3) how do differences in thescale of operation between aboveground and belowground organisms play out (vander Putten et al. 2009). Knowledge on these important issues will help us to betterunderstand how aboveground-belowground interactions shape plant communities.
134 Chapter 8

Conclusion and synthesis
Aboveground-belowground interactions can be mediated via direct associationsbetween plants and herbivores (van der Putten et al. 2001, Wardle et al. 2004) or viaindirect effects of plants and herbivores on soil nutrient cycling and soil physicalconditions (chapter 7, Bardgett and Wardle 2003, Wardle et al. 2004). Abovegroundeffects on the soil community are predominantly determined by species-specificinteractions between plant species and soil organisms (chapter 2, De Deyn et al.2004b, Viketoft et al. 2005, 2009, Bezemer et al. 2010). However, over larger spatialor temporal scales indirect pathways including soil physical conditions can becomeimportant as well (Ettema and Wardle 2002, Fierer et al. 2009). Changes in the soilcommunity may feed back to alter plant community composition via species-specific effects of root herbivores on the competitive ability of plants or via modifi-cations of soil nutrient cycling (Bever et al. 1997).
Plant-soil feedback effects have been suggested to drive plant species coexis-tence, plant community composition, diversity and dynamics (van der Putten andPeters 1997, Klironomos 2002, De Deyn et al. 2003, Wardle et al. 2004). In general,negative plant-soil feedback will enhance local replacement of plant species andmay increase plant diversity and small-scale spatiotemporal plant communitypatches (chapters 3 and 4, van der Putten et al. 1993, Olff et al. 2000, Bever 2003,Kardol et al. 2006). However, effects of plant-soil feedback on plant communitystructure and composition may play out differently under vertebrate grazing. Ingrazed grasslands localized effects of soil organisms on the vegetation can be over-ruled by large vertebrate herbivores (chapter 4, 5 and 6), because large herbivoresforage on a coarse grain and may not be able to respond to belowground-drivenpatches specifically (chapter 6). Moreover, when the control on the plant commu-nity is strong, grazing-tolerant plants maintain in the community, regardless of thestrength and direction of plant-soil feedback effects (chapter 4). When grazing pres-sure is lower or absent, plant-soil feedback may become an important factor deter-mining plant community structure and dynamics (chapter 4 and 5).
Vertebrate herbivores will not always overrule plant-soil feedback effects; theycan also modify the strength and direction of plant-soil interactions. Whethervertebrate herbivores will overrule or modify interactions between plants and soilorganisms is dependent on the scale at which vertebrate herbivores and soil organ-isms operate (chapter 6). Soil biota can affect the plant community across a range ofspatial scales, depending on their spatial distribution. Large-scale patterns in theaggregation of soil biota are determined by landscape gradients in soil physicalconditions, while at local scales patchiness in plant species composition becomesmore important (chapter 2, Ettema and Wardle 2002). Vertebrate herbivores thatchoose their forage more selectively may be able to respond to small-scale changesin plant quality and community composition (Ritchie and Olff 1999, Olff et al. 2002,
135General discussion

Laca et al. 2010, Hopcraft et al. 2010) driven by local aggregations of soil organisms(chapter 6). Such interactions between aboveground vertebrates and soil organismsthat operate across relatively similar scales, i.e., across scales at which they canrespond to each others impacts on plant growth and community composition, maydrive spatial patterning and species composition in the plant community (chapter 6and 7, Coppock et al. 1983b, McNaughton 1984, Bardgett and Wardle 2003, Holdoand McDowell 2004, Cromsigt and Olff 2008, Freymann et al. 2010). In contrast,when vertebrate herbivores are less selective and forage across coarse grains, theymay not perceive small-scale differences in the plant community and exert a rela-tively homogeneous grazing pressure across large scales (chapter 6, Ritchie and Olff1999, Olff et al. 2002, Laca et al. 2010, Hopcraft et al. 2010). When abovegroundvertebrates operate across much larger scales than belowground organisms; theycan overrule local plant-soil feedback effects (chapter 4, 5 and 6).
In conclusion, my research shows that aboveground vertebrate herbivores can bean important driver of soil community composition by altering plant communitycomposition. Such changes in the soil community may in turn feed back to driveplant species composition. As a result, plant-soil feedback can be important shapingplant communities, because it may enhance temporal dynamics and spatialpatterning in plant species composition. In grazed grasslands however, above-ground vertebrate herbivores alter the effect of plant-soil feedback on plantcommunity composition. On the one hand, herbivores enhance spatial patterns inthe plant community created by plant-soil interactions when they selectivelyrespond to changes in plant quality or community composition induced by soilorganisms. On the other hand, vertebrate herbivores overrule effects of soil organ-isms when they operate across much larger scales and graze intensively and homo-geneously on and off plant patches affected by plant-soil feedback effects.Therefore, the potential of soil organisms to drive plant community structure andcomposition in natural grasslands is to a large extent dependent on the presence,identity, and grazing intensity of aboveground vertebrate herbivores.
136 Chapter 8

137General discussion

Ref
eren
ces

References

AAbdelmagid, A.H. et al. 1987a. Soil bulk density and water infiltration as affected by grazing
systems. Journal of Range Management 40: 307-309.Abdelmagid, A.H. et al. 1987b. Soil and vegetation responses to simulated trampling. Journal of
Range Management 40: 303-306.Adler, P.B. et al. 2001. The effect of grazing on the spatial heterogeneity of vegetation. Oecologia
128: 465-479.Afzal, M. and Adams, W.A. 1992. Heterogeneity of soil mineral nitrogen in pasture grazed by
cattle. Soil Science Society of America Journal 56: 1160-1166.Augustine, D.J. et al. 2003. Feedbacks between soil nutrients and large herbivores in a managed
savanna ecosystem. Ecological Applications 13: 1325-1337.BBakker, C. et al. 2003. Does resource availability, resource heterogeneity or species turnover
mediate changes in plant species richness in grazed grasslands? Oecologia 137: 385-391.Bakker, E.S. 2003. PhD Thesis. Herbivores as mediators of their environment, the impact of large
and small species on vegetation dynamics. University of Wageningen.Bakker, E.S. et al. 2009. Cross-site comparison of herbivore impact on nitrogen availability in
grasslands: the role of plant nitrogen concentration. Oikos 118: 1613-1622.Bakker, E.S. and Olff, H. 2003. Impact of different-sized herbivores on recruitment opportuni-
ties for subordinate herbs in grasslands. Journal of Vegetation Science 14: 465-474.Bakker, E.S. et al. 2004. Impact of herbivores on nitrogen cycling: contrasting effects of small
and large species. Oecologia 138: 91-101.Bakker, E.S. et al. 2006. Herbivore impact on grassland plant diversity depends on habitat
productivity and herbivore size. Ecology Letters 9: 780-788.Bakker, J.P. Nature management by grazing and cutting. Geobotanica 14. 1989., Kluwer Acad-
emic Publishers, Dordrecht.Bakker, J.P. and de Vries, Y. 1992. Germination and early establishment of lower salt marsh
species in grazed and mown salt marsh. Journal of Vegetation Science 3: 247-252.Bakker, J.P. et al. 1983. Micro-patterns in grassland vegetation created and sustained by sheep
grazing. Vegetatio 55: 153-161.Bardgett, R.D. 2005. The biology of soil: A community and ecosystem approach. Oxford University
Press.Bardgett, R.D. and Chan, K.F. 1999. Experimental evidence that soil fauna enhance nutrient
mineralization and plant nutrient uptake in montane grassland ecosystems. Soil Biology &Biochemistry 31: 1007-1014.
Bardgett, R.D. et al. 2001. Soil microbial community patterns related to the history and inten-sity of grazing in sub-montane ecosystems. Soil Biology & Biochemistry 33: 1653-1664.
Bardgett, R.D. et al. 1997. Seasonality of the soil biota of grazed and ungrazed hill grasslands.Soil Biology & Biochemistry 29: 1285-1294.
Bardgett, R.D. et al. 1999. Plant species and nitrogen effects on soil biological properties oftemperate upland grasslands. Functional Ecology 13: 650-660.
Bardgett, R.D. and Wardle, D.A. 2003. Herbivore-mediated linkages between aboveground andbelowground communities. Ecology 84: 2258-2268.
Bardgett, R.D. and Wardle, D.A. 2010. Aboveground-belowground linkages: biotic interactions,ecosystem processes, and global change. Oxford University Press.
Bardgett, R.D. et al. 1998. Linking above-ground and below-ground interactions: How plant re-sponses to foliar herbivory influence soil organisms. Soil Biology & Biochemistry 30: 1867-1878.
Bardgett, R.D. et al. 2005. Patterns and determinants of soil biological diversity. In: Bardgett,R.D., Usher, M.B. and Hopkins, D.W. (eds.), Biological diversity and function in soils.Cambridge University Press, pp. 100-118.
140 References

Bates, D. and Maechler, M. lme4: Linear mixed-effects models using S4 classes. 2009., Rpackage, version 0.99.
Bazot, S. et al. 2005. Defoliation-induced changes in carbon allocation and root soluble carbonconcentration in field-grown Lolium perenne plants: do they affect carbon availability,microbes and animal trophic groups in soil? Functional Ecology 19: 886-896.
Belsky, A.J. 1986. Does herbivory benefit plants - a review of the evidence. American Naturalist127: 870-892.
Bengtsson, J. et al. 1994. Competition and coexistence in plant communities. Trends in Ecology& Evolution 9: 246-250.
Bentler, P.M. and Chou, C.P. 1987. Practical issues in structural modeling. Sociological Methods& Research 16: 78-117.
Berendse, F. et al. 1989. A comparative study on nutrient cycling in wet heathland ecosystems.2. litter decomposition and nutrient mineralization. Oecologia 78: 338-348.
Berg, M.P. et al. 2001. Community food web, decomposition and nitrogen mineralisation in astratified Scots pine forest soil. Oikos 94: 130-142.
Bever, J.D. 1994. Feedback between plants and their soil communities in an old field commu-nity. Ecology 75: 1965-1977.
Bever, J.D. 2003. Soil community feedback and the coexistence of competitors: conceptualframeworks and empirical tests. New Phytologist 157: 465-473.
Bever, J.D. 1999. Dynamics within mutualism and the maintenance of diversity: inference froma model of interguild frequency dependence. Ecology Letters 2: 52-62.
Bever, J.D. et al. 1997. Incorporating the soil community into plant population dynamics: theutility of the feedback approach. Journal of Ecology 85: 561-573.
Bezemer, T.M. et al. 2010. Divergent composition but similar function of soil food webs beneathindividual plants: plant species and community effects. Ecology 3027-3036.
Bezemer, T.M. et al. 2006. Plant species and functional group effects on abiotic and microbialsoil properties and plant-soil feedback responses in two grasslands. Journal of Ecology 94:893-904.
Bezemer, T.M. and van der Putten, WH 2007. Ecology - Diversity and stability in plant commu-nities. Nature 446: E6-E7.
Bezemer, TM et al. 2003. Interactions between above- and belowground insect herbivores asmediated by the plant defense system. Oikos 101: 555-562.
Blomqvist, M.M. et al. 2000. Interactions between above- and belowground biota: importancefor small-scale vegetation mosaics in a grassland ecosystem. Oikos 90: 582-598.
Bogaert, N. et al. 2000. Within-field variability of mineral nitrogen in grassland. Biology andFertility of Soils 32: 186-193.
Bolker, B.M. et al. 2003. Spatial dynamics in model plant communities: What do we reallyknow? American Naturalist 162: 135-148.
Bonanomi, G. et al. 2005. Negative plant-soil feedback and species coexistence. Oikos 111: 311-321.Bongers, T. 1988. De nematoden van Nederland. Pirola.Bongers, T. 1990. The maturity index - an ecological measure of environmental disturbance
based on nematode species composition. Oecologia 83: 14-19.Bos, D. et al. 2002. Long-term vegetation changes in experimentally grazed and ungrazed back-
barrier marshes in the Wadden Sea. Applied Vegetation Science 5: 45-54.Bouwman, L.A. and Arts, WBM 2000. Effects of soil compaction on the relationships between
nematodes, grass production and soil physical properties. Applied Soil Ecology 14: 213-222.Bradford, M.A. et al. 2002. Impacts of soil faunal community composition on model grassland
ecosystems. Science 298: 615-618.Bradley, D.J. et al. 2008. Pathogens promote plant diversity through a compensatory response.
Ecology Letters 11: 461-469.
141References

Bransby, D.I. et al. 1977. Disk meter for rapid estimation of herbage yield in grazing trials.Agronomy Journal 69: 393-396.
Breland, T.A. and Hansen, S. 1996. Nitrogen mineralization and microbial biomass as affected bysoil compaction. Soil Biology & Biochemistry 28: 655-663.
Brinkman, E.P. et al. 2010. Plant–soil feedback: experimental approaches, statistical analysesand ecological interpretations. Journal of Ecology 98: 1063-1073.
Briske, D.D. et al. 1996. Contribution of flexible allocation priorities to herbivory tolerance in C-4 perennial grasses: An evaluation with C-13 labeling. Oecologia 105: 151-159.
Broughton, L.C. and Gross, K.L. 2000. Patterns of diversity in plant and soil microbial communi-ties along a productivity gradient in a Michigan old-field. Oecologia 125: 420-427.
Brown, G.G. et al. 2000. Regulation of soil organic matter dynamics and microbial activity in thedrilosphere and the role of interactions with other edaphic functional domains. EuropeanJournal of Soil Biology 36: 177-198.
Brown, V.K. and Gange, A.C. 1992. Secondary plant succession - how is it modified by insectherbivory. Vegetatio 101: 3-13.
Brown, V.K. and Gange, A.C. 1989. Differential effects of above ground and below ground insectherbivory during early plant succession. Oikos 54: 67-76.
Bullock, D.G. 1992. Crop-Rotation. Critical Reviews in Plant Sciences 11: 309-326.CCallaway, R.M. et al. 2004. Soil biota and exotic plant invasion. Nature 427: 731-733.Case, T. 2000. An illustrated guide to theoretical ecology. University Press.Casper, B.B. et al. 2008. Plant-soil feedback: Testing the generality with the same grasses in
serpentine and prairie soils. Ecology 89: 2154-2164.Casper, B.B. and Castelli, J.P. 2007. Evaluating plant-soil feedback together with competition in
a serpentine grassland. Ecology Letters 10: 394-400.Clarholm, M. 1985. Interactions of bacteria, protozoa and plants leading to mineralization of soil
nitrogen. Soil Biology & Biochemistry 17: 181-187.Collins, S.L. et al. 1998. Modulation of diversity by grazing and mowing in native tallgrass
prairie. Science 280: 745-747.Coppock, D.L. et al. 1983a. Plant-herbivore interactions in a North-American mixed-grass
prairie .1. effects of black-tailed prairie dogs on intraseasonal above ground plant biomassand nutrient dynamics and plant species diversity. Oecologia 56: 1-9.
Coppock, D.L. et al. 1983b. Plant-herbivore interactions in a North-American mixed-grass prairie.2. responses of bison to modification of vegetation by prairie dogs. Oecologia 56: 10-15.
Crawley, M.J. 1989. Insect herbivores and plant-population dynamics. Annual Review of Ento-mology 34: 531-564.
Crawley, M.J. The R Book. 2007., John Wiley & Sons Ltd, Chichester, England.Cromsigt, J.P.G.M. and Olff, H. 2006. Resource partitioning among savanna grazers mediated by
local heterogeneity: An experimental approach. Ecology 87: 1532-1541.Cromsigt, J.P.G.M. and Olff, H. 2008. Dynamics of grazing lawn formation: an experimental test
of the role of scale-dependent processes. Oikos 117: 1444-1452.Curll, M.L. and Wilkins, R.J. 1983. The comparative effects of defoliation, treading and excreta
on a Lolium perenne trifolium repens pasture grazed by sheep. Journal of AgriculturalScience 100: 451-460.
DDaniel, O. and Anderson, J.M. 1992. Microbial biomass and activity in contrasting soil materials
after passage through the gut of the earthworm Lumbricus terrestris. Soil Biology &Biochemistry 24: 465-470.
Dauber, J. and Wolters, V. 2000. Microbial activity and functional diversity in the mounds ofthree different ant species. Soil Biology & Biochemistry 32: 93-99.
142 References
De Deyn, G.B. et al. 2004a. Plant community development is affected by nutrients and soil biota.Journal of Ecology 92: 824-834.
De Deyn, G.B. et al. 2004b. Plant species identity and diversity effects on different trophic levelsof nematodes in the soil food web. Oikos 106: 576-586.
De Deyn, G.B. et al. 2003. Soil invertebrate fauna enhances grassland succession and diversity.Nature 422: 711-713.
De Deyn, G.B. et al. 2007. Above- and belowground insect herbivores differentially affect soilnematode communities in species-rich plant communities. Oikos 116: 923-930.
De Deyn, G.B. and van der Putten, W.H. 2005. Linking aboveground and belowground diversity.Trends in Ecology & Evolution 20: 625-633.
De Klein, C.A.M. and Van Logtestijn, R.S.P. 1994. Denitrification in the top soil of managed grass-lands in the Netherlands in relation to soil type and fertilizer level. Plant and Soil 163: 33-44.
De Neve, S. and Hofman, G. 2000. Influence of soil compaction on carbon and nitrogen mineral-ization of soil organic matter and crop residues. Biology and Fertility of Soils 30: 544-549.
de Ruiter, P.C. et al. 1995. Energetics, Patterns of Interaction Strengths, and Stability in RealEcosystems. Science 269: 1257-1260.
de Ruiter, P.C. et al. 1993. Calculation of nitrogen mineralization in soil food webs. Plant andSoil 157: 263-273.
Dean, W.R.J. et al. 1997. The role of ant nest-mounds in maintaining small-scale patchiness indry grasslands in Central Germany. Biodiversity and Conservation 6: 1293-1307.
deBruyn, L.A.L. and Kingston, T.J. 1997. Effects of summer irrigation and trampling in dairypastures on soil physical properties and earthworm number and species composition.Australian Journal of Agricultural Research 48: 1059-1079.
Demment, M.W. and Van Soest, P.J. 1985. A nutritional explanation for body-size patterns ofruminant and non-ruminant herbivores. American Naturalist 125: 641-672.
Didden, W.A.M. 1993. Ecology of terrestrial enchytraeidae. Pedobiologia 37: 2-29.Dobson, A. and Crawley, W. 1994. Pathogens and the Structure of Plant-Communities. Trends in
Ecology & Evolution 9: 393-398.Dostal, P. et al. 2005. Ant-induced soil modification and its effect on plant below-ground
biomass. Pedobiologia 49: 127-137.Drewry, J.J. et al. 2008. Pasture yield and soil physical property responses to soil compaction
from treading and grazing - a review. Australian Journal of Soil Research 46: 237-256.EEhrenfeld, J.G. et al. 2005. Feedback in the plant-soil system. Annual Review of Environment
and Resources 30: 75-115.Ellenberg, H., Weber, H.E., Paulissen, D., Werner, W. and Duell, R. Zeigerwerte von Pflanzen in
Mitteleuropa. Scripta Geobotanica 18. 1992.Elzenga, J.T.M. and van Veen, H. 2010. Waterlogging and plant nutrient uptake. In: Mancuso, S.
and Shabala, S. (eds.), Waterlogging, signalling and tolerance in plants. Springer-Verlag Berlin. Eppinga, M.B. et al. 2006. Accumulation of local pathogens: a new hypothesis to explain exotic
plant invasions. Oikos 114: 168-176.Eppstein, M.J. et al. 2006. Spatio-temporal community dynamics induced by frequency
dependent interactions. Ecological Modelling 197: 133-147.Eppstein, M.J. and Molofsky, J. 2007. Invasiveness in plant communities with feedbacks.
Ecology Letters 10: 253-263.Ermentrout, B. 2002. Simulating, analyzing, and animating dynamical systems: a guide to
XPPAUT for researchers and students. Society for Applied and Industrial Mathematics.Ettema, C.H. and Wardle, D.A. 2002. Spatial soil ecology. Trends in Ecology & Evolution 17: 177-
183.
143References
FFerraro, D.O. and Oesterheld, M. 2002. Effect of defoliation on grass growth. A quantitative
review. Oikos 98: 125-133.Fierer, N. et al. 2009. Global patterns in belowground communities. Ecology Letters 12: 1238-
1249.Frank, D.A. and Groffman, P.M. 1998. Ungulate vs. landscape control of soil C and N processes in
grasslands of Yellowstone National Park. Ecology 79: 2229-2241.Frank, D.A. et al. 2000. Ungulate stimulation of nitrogen cycling and retention in Yellowstone
Park grasslands. Oecologia 123: 116-121.Frank, D.A. and McNaughton, S.J. 1993. Evidence for the promotion of aboveground grassland
production by native large herbivores in Yellowstone National Park. Oecologia 96: 157-161.Freymann, B.P. et al. 2010. Spatial and temporal hotspots of termite-driven decomposition in the
Serengeti. Ecography 33: 443-450.Fryxell, J.M. 1991. Forage quality and aggregation by large herbivores. American Naturalist
138: 478-498.GGange, A.C. and Brown, V.K. 1989. Effects of root herbivory by an insect on a foliar-feeding
species, mediated through changes in the host plant. Oecologia 81: 38-42.Gange, A.C. et al. 1993. Vesicular arbuscular mycorrhizal fungi - a determinant of plant commu-
nity structure in early succession. Functional Ecology 7: 616-622.Gange, A.C. and Nice, H.E. 1997. Performance of the thistle gall fly, Urophora cardui, in relation
to host plant nitrogen and mycorrhizal colonization. New Phytologist 137: 335-343.Georgiadis, N..J et al. 1989. Ecological conditions that determine when grazing stimulates grass
production. Oecologia 81: 316-322.Gilpin, M.E. 1975. Limit cycles in competition communities. American Naturalist 109: 51-60.Glenn, S.M. and Collins, S.L. 1990. Patch structure in tallgrass prairies - dynamics of satellite
species. Oikos 57: 229-236.Glenn, S.M. et al. 1992. Disturbances in tallgrass prairie: local and regional effects on commu-
nity heterogeneity. Landscape Ecology 7: 243-251.Goldberg, D.E. and Miller, T.E. 1990. Effects of different resource additions on species diversity
in an annual plant community. Ecology 71: 213-225.Goodall, D.W. Some considerations in the use of point quadrats for the analysis of vegetation.
Australian Journal of Scientific Research, Series B, Biological Sciences 5, 1-41. 1952.Gordon, I.J. and Illius, A.W. 1994. The functional significance of the browser-grazer dichotomy
in African ruminants. Oecologia 98: 167-175.Gornall, J.L. et al. 2009. Herbivore impacts to the moss layer determine tundra ecosystem
response to grazing and warming. Oecologia 161: 747-758.Grace, J.B. 2006. Structural equation modeling and natural systems. Cambridge University Press.Grayston, S.J. et al. 1998. Selective influence of plant species on microbial diversity in the
rhizosphere. Soil Biology & Biochemistry 30: 369-378.Grime, J.P. 1973. Competitive exclusion in herbaceous vegetation. Nature 242: 344-347.Grime, J.P. et al. 1987. Floristic diversity in a model system using experimental microcosms.
Nature 328: 420-422.Grubb, P.J. 1977. Maintenance of species richness in plant communities - importance of regen-
eration niche. Biological Reviews of the Cambridge Philosophical Society 52: 107-145.Guitian, R. and Bardgett, R.D. 2000. Plant and soil microbial responses to defoliation in
temperate semi-natural grassland. Plant and Soil 220: 271-277.HHamilton, E.W. and Frank, D.A. 2001. Can plants stimulate soil microbes and their own nutrient
supply? Evidence from a grazing tolerant grass. Ecology 82: 2397-2402.
144 References
Hamza, M.A. and Anderson, W.K. 2005. Soil compaction in cropping systems - A review of thenature, causes and possible solutions. Soil & Tillage Research 82: 121-145.
Harper, J.L. 1977. Plant population biology. Academic press New York.Harrison, K.A. and Bardgett, R.D. 2010. Influence of plant species and soil conditions on plant-
soil feedback in mixed grassland communities. Journal of Ecology 98: 384-395.Hart, M.M. et al. 2003. Plant coexistence mediated by arbuscular mycorrhizal fungi. Trends in
Ecology & Evolution 18: 418-423.Hartnett, D.C. and Wilson, G.W.T. 1999. Mycorrhizae influence plant community structure and
diversity in tallgrass prairie. Ecology 80: 1187-1195.Haskell, J.P. et al. 2002. Fractal geometry predicts varying body size scaling relationships for
mammal and bird home ranges. Nature 418: 527-530.Haunz, F.X. et al. 1992. Effect of soil compaction on the dynamics of soil and fertilizer nitrogen
under winter wheat. Zeitschrift fur Pflanzenernahrung und Bodenkunde 155: 129-134.Hobbs, N.T. 1996. Modification of ecosystems by ungulates. Journal of Wildlife Management
60: 695-713.Holdo, R.M. and McDowell, L.R. 2004. Termite mounds as nutrient-rich food patches for
elephants. Biotropica 36: 231-239.Holland, E.A. and Detling, J.K. 1990. Plant-response to herbivory and belowground nitrogen
cycling. Ecology 71: 1040-1049.Holland, J.N. et al. 1996. Herbivore-induced changes in plant carbon allocation: Assessment of
below-ground C fluxes using carbon-14. Oecologia 107: 87-94.Hopcraft, J.G.C. et al. 2010. Herbivores, resources and risks: alternating regulation along
primary environmental gradients in savannas. Trends in Ecology & Evolution 25: 119-128.Housman, D.C. et al. 2007. Heterogeneity of soil nutrients and subsurface biota in a dryland
ecosystem. Soil Biology & Biochemistry 39: 2138-2149.Huisman, J. and Weissing, F.J. 2001. Biological conditions for oscillations and chaos generated
by multispecies competition. Ecology 82: 2682-2695.Huntly, N. 1991. Herbivores and the dynamics of communities and ecosystems. Annual Review
of Ecology and Systematics 22: 477-503.IIlmarinen, K. and Mikola, J. 2009. Soil feedback does not explain mowing effects on vegetation
structure in a semi-natural grassland. Acta Oecologica-International Journal of Ecology 35:838-848.
Innes, L. et al. 2004. The impacts of individual plant species on rhizosphere microbial communi-ties in soils of different fertility. Biology and Fertility of Soils 40: 7-13.
JJackson, M.B. and Armstrong, W. 1999. Formation of aerenchyma and the processes of plant
ventilation in relation to soil flooding and submergence. Plant Biology 1: 274-287.Jensen, L.S. et al. 1996. Effects of soil compaction on N-mineralization and microbial-C and -N
.1. Field measurements. Soil & Tillage Research 38: 175-188.Johnson, D. et al. 2003. Plant community composition affects the biomass, activity and diversity
of microorganisms in limestone grassland soil. European Journal of Soil Science 54: 671-677.Jones, C.G. et al. 1994. Organisms as ecosystem engineers. Oikos 69: 373-386.Jones, C.G. et al. 1997. Positive and negative effects of organisms as physical ecosystem engi-
neers. Ecology 78: 1946-1957.Justin, S.H.F.W. and Armstrong, W. 1987. The anatomical characteristics of roots and plant
response to soil flooding. New Phytologist 106: 465-495.KKardol, P. et al. 2006. Temporal variation in plant-soil feedback controls succession. Ecology
Letters 9: 1080-1088.
145References

Kardol, P. et al. 2007. Microbe-mediated plant-soil feedback causes historical contingency effectsin plant community assembly. Ecological Monographs 77: 147-162.
Kiehl, K. et al. 2001. The impact of sheep grazing on net nitrogen mineralization rate in twotemperate salt marshes. Plant Biology 3: 553-560.
King, T.J. 1977a. Plant ecology of ant hills in calcareous grasslands .1. patterns of species inrelation to ant hills in Southern England. Journal of Ecology 65: 235-&.
King, T.J. 1977b. Plant ecology of ant hills in calcareous grasslands .2. succession on mounds.Journal of Ecology 65: 257-278.
Klironomos, J.N. 2003. Variation in plant response to native and exotic arbuscular mycorrhizalfungi. Ecology 84: 2292-2301.
Klironomos, J.N. 2002. Feedback with soil biota contributes to plant rarity and invasiveness incommunities. Nature 417: 67-70.
Knapp, A.K. et al. 1999. The keystone role of bison in North American tallgrass prairie - Bisonincrease habitat heterogeneity and alter a broad array of plant, community, and ecosystemprocesses. BioScience 49: 39-50.
Kuijper, D.P.J. and Bakker, J.P. 2005. Top-down control of small herbivores on salt-marsh vege-tation along a productivity gradient. Ecology 86: 914-923.
Kuijper, D.P.J. et al. 2008. Time-scale effects in the interaction between a large and a smallherbivore. Basic and Applied Ecology 9: 126-134.
Kuijper, D.P.J. et al. 2004. Herbivory and competition slow down invasion of a tall grass along aproductivity gradient. Oecologia 141: 452-459.
Kulmatiski, A. et al. 2008. Plant-soil feedbacks: a meta-analytical review. Ecology Letters 11:980-992.
LLaanbroek, H.J. 1990. Bacterial cycling of minerals that affect plant growth in waterlogged soils
- A review. Aquatic Botany 38: 109-125.Laca, E.A. et al. 2010. Allometry and spatial scales of foraging in mammalian herbivores.
Ecology Letters 13: 311-320.Langbein, J. et al. 1999. Techniques for assessing the abundance of Brown Hares Lepus euro-
paeus. Mammal Review 29: 93-116.Lavelle, P. et al. 1997. Soil function in a changing world: the role of invertebrate ecosystem engi-
neers. European Journal of Soil Biology 33: 159-193.Lenoir, L. 2009. Effects of ants on plant diversity in semi-natural grasslands. Arthropod-Plant
Interactions 3: 163-172.Lepsv , J. and S
v
milauer, P. 2003. Multivariate analysis of ecological data using CANOCO. CambridgeUniversity Press.Levy, E.B. and Madden, E.A. The point measure of pasture analysis. New Zealand Journal of
Agriculture 46, 267-279. 1933..Lipiec, J. and Stepniewski, W. 1995. Effects of soil compaction and tillage systems on uptake
and losses of nutrients. Soil & Tillage Research 35: 37-52.Londo, G. 1976. Decimal scale for releves of permanent quadrats. Vegetatio 782: 61-64.MMagurran, A.E. 2003. Measuring biological diversity. Blackwell publishing.Mangan, S.A. et al. 2010. Negative plant-soil feedback predicts tree-species relative abundance
in a tropical forest. Nature in press.Manning, P. et al. 2008. Nitrogen enrichment modifies plant community structure via changes to
plant-soil feedback. Oecologia 157: 661-673.Marschner, P. et al. 2004. Development of specific rhizosphere bacterial communities in relation
to plant species, nutrition and soil type. Plant and Soil 261: 199-208.
146 References

Masters, G.J. 1995. The effect of herbivore density on host-plant mediated interactions betweentwo insects. Ecological Research 10: 125-133.
Masters, G.J. and Brown, V.K. 1992. Plant-mediated interactions between two spatially sepa-rated insects. Functional Ecology 6: 175-179.
Masters, G.J. et al. 1993. Plant Mediated Interactions Between Aboveground and BelowgroundInsect Herbivores. Oikos 66: 148-151.
Masters, G.J. et al. 2001. Host-plant mediated effects of root herbivory on insect seed predatorsand their parasitoids. Oecologia 127: 246-250.
May, R.M. and Leonard, W.J. 1975. Nonlinear aspects of competition between 3 species. SiamJournal on Applied Mathematics 29: 243-253.
McNaughton, S.J. 1984. Grazing lawns, animals in herds, plant form, and coevolution. Amer-ican Naturalist 124: 863-886.
McNaughton, S.J. et al. 1997a. Promotion of the cycling of diet-enhancing nutrients by Africangrazers. Science 278: 1798-1800.
McNaughton, S.J. et al. 1997b. Ecosystem catalysis: soil urease activity and grazing in theSerengeti ecosystem. Oikos 80: 467-469.
Menneer, J.C. et al. 2005. Animal treading stimulates denitrification in soil under pasture. SoilBiology & Biochemistry 37: 1625-1629.
Meyer, K.M. et al. 2009. Quantifying the impact of above- and belowground higher trophic levelson plant and herbivore performance by modeling(1). Oikos 118: 981-990.
Mikola, J. et al. 2009. Defoliation and patchy nutrient return drive grazing effects on plant andsoil properties in a dairy cow pasture. Ecological Monographs 79: 221-244.
Mikola, J. et al. 2001. Effects of defoliation intensity on soil food-web properties in an experi-mental grassland community. Oikos 92: 333-343.
Milchunas, D.G. and Lauenroth, W.K. 1993. Quantitative effects of grazing on vegetation andsoils over a global range of environments. Ecological Monographs 63: 327-366.
Mills, K.E. and Bever, J.D. 1998. Maintenance of diversity within plant communities: Soilpathogens as agents of negative feedback. Ecology 79: 1595-1601.
Mortimer, S.R. et al. 1999. Insect and nematode herbivory below-ground: interactions and rolein vegetation succession. In: Olff, H., Brown, V.K. and Drent, R.H. (eds.), Herbivores: BetweenPlants and Predators. Blackwell Academic Publishing, pp. 205-238.
Mouissie, A.M. et al. 2008. Creation and preservation of vegetation patterns by grazing. Ecolog-ical Modelling 218: 60-72.
OOlff, H. et al. 1994. Changes in nitrogen mineralization, tissue nutrient concentrations and
biomass compartmentation after cessation of fertilizer aqpplication to mown grassland.Journal of Ecology 82: 611-620.
Olff, H. et al. 1997. Vegetation succession and herbivory in a salt marsh: changes induced by sealevel rise and silt deposition along an elevational gradient. Journal of Ecology 85: 799-814.
Olff, H. et al. 2000. Small-scale shifting mosaics of two dominant grassland species: the possiblerole of soil-borne pathogens. Oecologia 125: 45-54.
Olff, H. and Ritchie, M.E. 1998. Effects of herbivores on grassland plant diversity. Trends inEcology & Evolution 13: 261-265.
Olff, H. et al. 2002. Global environmental controls of diversity in large herbivores. Nature 415:901-904.
Olff, H. et al. 1999. Shifting mosaics in grazed woodlands driven by the alternation of plantfacilitation and competition. Plant Biology 1: 127-137.
Oostenbrink, M. 1960. Estimating nematode populations by some selected methods. In: Sasser,N.J. and Jenkins, W.R. (eds.), Nematology. University of Noth Carolina press, pp. 85-101.
147References

Osler, G.H.R and Sommerkorn, M 2007. Toward a complete soil C and N cycle: Incorporating thesoil fauna. Ecology 88: 1611-1621.
Ozinga, W.A.. et al. 2009. Dispersal failure contributes to plant losses in NW Europe. EcologyLetters 12: 66-74.
PPastor, J. et al. 2006. The role of large herbivores in ecosystem nutrient cycles. In: Dannell, K.,
Bergstrom, R., Duncan, P. and Pastor, J. (eds.), Large Herbivore Ecology, Ecosystem Dynamicsand Conservation. Cambridge University Press.
Pastor, J. et al. 1993. Moose browsing and soil fertility in the boreal forests of Isle RoyaleNational Park. Ecology 74: 467-480.
Pontin, A.J. 1978. Numbers and distribution of subterranean aphids and their exploitation byant Lasius flavus. Ecological Entomology 3: 203-207.
Proulx, M. and Mazumder, A. 1998. Reversal of grazing impact on plant species richness innutrient-poor vs. nutrient-rich ecosystems. Ecology 79: 2581-2592.
RRasiah, V. and Kay, B.D. 1998. Legume N mineralization: Effect of aeration and size distribution
of water-filled pores. Soil Biology & Biochemistry 30: 89-96.Revilla, T. 2009. Multispecies resource competition. Dissertation. University of Groningen.Revilla, T. and Weissing, F.J. 2008. Nonequilibrium coexistence in a competition model with
nutrient storage. Ecology 89: 865-877.Reynolds, H.L. et al. 2003. Grassroots ecology: Plant-microbe-soil interactions as drivers of
plant community structure and dynamics. Ecology 84: 2281-2291.Ritchie, M.E. and Olff, H. 1999. Spatial scaling laws yield a synthetic theory of biodiversity.
Nature 400: 557-560.Ritchie, M.E. et al. 1998. Herbivore effects on plant and nitrogen dynamics in oak savanna.
Ecology 79: 165-177.Ruess, L. et al. 2000. Food preferences of a fungal-feeding Aphelenchoides species. Nematology
2: 223-230.Ruess, R.W. and McNaughton, S.J. 1987. Grazing and the dynamics of nutrient and energy regu-
lated microbial processes in the Serengeti Grasslands. Oikos 49: 101-110.Ruggiero, R.G. and Fay, J.M. 1994. Utilization of termitarium soils by elephants and its ecolog-
ical implications. African Journal of Ecology 32: 222-232.Russell, E.W. Soil condition and plant growth (10th Ed.). 1973., Longman, London.SSalamon, J.A. et al. 2004. Effects of plant diversity on Collembola in an experimental grassland
ecosystem. Oikos 106: 51-60.Sankaran, M. and Augustine, D.J. 2004. Large herbivores suppress decomposer abundance in a
semiarid grazing ecosystem. Ecology 85: 1052-1061.Sarathchandra, S.U. et al. 2001. Effect of nitrogen and phosphate fertilisers on microbial and
nematode diversity in pasture soils. Soil Biology & Biochemistry 33: 953-964.Schlesinger, W.H. Biogeochemistry: an analysis of global change. -443 pp. 1991., Academic, San
Diego, California.Sharrow, S.H. 1984. A simple disc meter for measurement of pasture height and forage bulk.
Journal of Range Management 37: 94-95.Shipley, B. 2000. Cause and correlation in biology: A user's guide to path analysis, structural
equations and causal inference. Cambridge University Press.Soler, R. et al. 2007. Impact of foliar herbivory on the development of a root-feeding insect and
its parasitoid. Oecologia 152: 257-264.Soler, R. et al. 2005. Root herbivore effects on above-ground herbivore, parasitoid and hyperpar-
asitoid performance via changes in plant quality. Journal of Animal Ecology 74: 1121-1130.
148 References

Sørensen, L.I. et al. 2008. Soil feedback on plant growth in a sub-arctic grassland as a result ofrepeated defoliation. Soil Biology & Biochemistry 40: 2891-2897.
Sørensen, L.I. et al. 2009. Trampling and spatial heterogeneity explain decomposer abundancesin a Sub-Arctic grassland subjected to simulated reindeer grazing. Ecosystems 12: 830-842.
Spain, A.V. and McIvor, J.G. 1988. The nature of herbaceous vegetation associated with termi-taria in northeastern Australia. Journal of Ecology 76: 181-191.
Stadler, B. and Dixon, A.F.G. 2005. Ecology and evolution of aphid-ant interactions. AnnualReview of Ecology Evolution and Systematics 36: 345-372.
Stanton, N.L. 1988. The underground in grasslands. Annual Review of Ecology and Systematics19: 573-589.
Stark, S. and Grellmann, D. 2002. Soil microbial responses to herbivory in an arctic tundra heathat two levels of nutrient availability. Ecology 83: 2736-2744.
Startsev, A.D. and McNabb, D.H. 2007. Effects of compaction on aeration and morphology ofboreal forest soils in Alberta, Canada. Canadian Journal of Soil Science 89: 45-56.
Steinauer, E.M. and Collins, S.L. 1995. Effects of urine deposition on small-scale patch structurein prairie vegetation. Ecology 76: 1195-1205.
Steuter, A.A. et al. 1995. Distribution and Diet of Bison and Pocket Gophers in A SandhillsPrairie. Ecological Applications 5: 756-766.
Strauss, S.Y. and Agrawal, A.A. 1999. The ecology and evolution of plant tolerance to herbivory.Trends in Ecology & Evolution 14: 179-185.
Tter Braak, C.J.F. and S
v
milauer, P. 2002. Canoco for Windows 4.5. Biometrics.Tilman, D. 1988. Plant strategies and the dynamics and structure of plant communities.
Princeton University Press.Trigo, D. et al. 1999. Mutualism between earthworms and soil microflora. Pedobiologia 43: 866-
873.UUmbanhowar, J. and McCann, K. 2005. Simple rules for the coexistence and competitive domi-
nance of plants mediated by mycorrhizal fungi. Ecology Letters 8: 247-252.Vvan de Koppel, J. et al. 1997. Catastrophic vegetation shifts and soil degradation in terrestrial
grazing systems. Trends in Ecology & Evolution 12: 352-356.van den Brink, P.J. and ter Braak, C.J.F. 1999. Principal response curves: Analysis of time-
dependent multivariate responses of biological community to stress. Environmental Toxi-cology and Chemistry 18: 138-148.
van der Heijden, M.G.A. 2004. Arbuscular mycorrhizal fungi as support systems for seedlingestablishment in grassland. Ecology Letters 7: 293-303.
van der Heijden, M.G.A. et al. 2008. The unseen majority: soil microbes as drivers of plant diver-sity and productivity in terrestrial ecosystems. Ecology Letters 11: 296-310.
van der Heijden, M.G.A. et al. 1998a. Different arbuscular mycorrhizal fungal species are poten-tial determinants of plant community structure. Ecology 79: 2082-2091.
van der Heijden, M.G.A. et al. 1998b. Mycorrhizal fungal diversity determines plant biodiver-sity, ecosystem variability and productivity. Nature 396: 69-72.
van der Heijden, M.G.A. et al. 2006. The mycorrhizal contribution to plant productivity, plantnutrition and soil structure in experimental grassland. New Phytologist 172: 739-752.
van der Heijden, M.G.A. et al. 2003. Different arbuscular mycorrhizal fungi alter coexistenceand resource distribution between co-occurring plant. New Phytologist 157: 569-578.
van der Maarel, E. and Titlyanova, A. 1989. Aboveground and belowground biomass relations insteppes under different grazing conditions. Oikos 56: 364-370.
van der Meijden, R. 2005. Heukels' Flora van Nederland. Wolters-Noordhoff.
149References

van der Putten, W.H. 2003. Plant defense belowground and spatiotemporal processes in naturalvegetation. Ecology 84: 2269-2280.
van der Putten, W.H. et al. 2009. Empirical and theoretical challenges in aboveground-below-ground ecology. Oecologia 161: 1-14.
van der Putten, W.H. and Peters, B.A.M. 1997. How soil-borne pathogens may affect plantcompetition. Ecology 78: 1785-1795.
van der Putten, W.H. and van der Stoel, CD 1998. Plant parasitic nematodes and spatio-temporalvariation in natural vegetation. Applied Soil Ecology 10: 253-262.
van der Putten, W.H. et al. 1993. Plant-specific soil-borne diseases contribute to succession inforedune vegetation. Nature 362: 53-56.
van der Putten, W.H. et al. 2001. Linking above- and belowground multitrophic interactions ofplants, herbivores, pathogens, and their antagonists. Trends in Ecology & Evolution 16: 547-554.
van Ruijven, J. et al. 2005. Interactions between spatially separated herbivores indirectly alterplant diversity. Ecology Letters 8: 30-37.
van Straalen, N.M. and Rijninks, P.C. 1982. The efficiency of tullgren apparatus with respect tointerpreting seasonal changes in age structure of soil arthropod populations. Pedobiologia24: 197-209.
van Wijnen, H.J. et al. 1999. The impact of herbivores on nitrogen mineralization rate: conse-quences for salt-marsh succession. Oecologia 118: 225-231.
Vartapetian, B.B. and Jackson, M.B. 1997. Plant adaptations to anaerobic stress. Annals ofBotany 79: 3-20.
Veen, G.F. et al. 2008. Influence of grazing and fire frequency on small-scale plant communitystructure and resource variability in native tallgrass prairie. Oikos 117: 859-866.
Veen, G.F. et al. 2010. Vertebrate herbivores influence soil nematodes by modifying plantcommunities. Ecology 91: 828-835.
Verhoef, H.A. and Brussaard, L. 1990. Decomposition and nitrogen mineralization in natural andagroecosystems - the contribution of soil animals. Biogeochemistry 11: 175-211.
Verschoor, B.C. 2002. Carbon and nitrogen budgets of plant-feeding nematodes in grasslands ofdifferent productivity. Applied Soil Ecology 20: 15-25.
Verschoor, B.C. et al. 2002. Could plant-feeding nematodes affect the competition between grassspecies during succession in grasslands under restoration management? Journal of Ecology90: 753-761.
Viketoft, M. 2008. Effects of six grassland plant species on soil nematodes: A glasshouse experi-ment. Soil Biology & Biochemistry 40: 906-915.
Viketoft, M. et al. 2009. Long-term effects of plant diversity and composition on soil nematodecommunities in model grasslands. Ecology 90: 90-99.
Viketoft, M. et al. 2005. Plant species effects on soil nematode communities in experimentalgrasslands. Applied Soil Ecology 30: 90-103.
Vitousek, P.M. and Howarth, R.W. 1991. Nitrogen limitation on land and in the sea - how can itoccur. Biogeochemistry 13: 87-115.
Voorhees, W.B. et al. 1985. Effect of preplant wheel traffic on soil compaction, water use, andgrowth of spring wheat. Soil Science Society of America Journal 49: 215-220.
WWall-Freckman, D. and Huang, S.P. 1998. Response of the soil nematode community in a short-
grass steppe to long-term and short-term grazing. Applied Soil Ecology 9: 39-44.Wang, K.H. et al. 2006. Cattle grazing increases microbial biomass and alters soil nematode
communities in subtropical pastures. Soil Biology & Biochemistry 38: 1956-1965.Wardle, D.A. 2002. Communities and ecosystems: Linking the aboveground and belowground
components. Princeton University Press.
150 References

Wardle, D.A. 1998. Controls of temporal variability of the soil microbial biomass: A global-scalesynthesis. Soil Biology & Biochemistry 30: 1627-1637.
Wardle, D.A. et al. 2004. Ecological linkages between aboveground and belowground biota.Science 304: 1629-1633.
Wardle, D.A. et al. 2001. Introduced browsing mammals in New Zealand natural forests: Above-ground and belowground consequences. Ecological Monographs 71: 587-614.
Wardle, D.A. et al. 1999. Plant removals in perennial grassland: Vegetation dynamics, decom-posers, soil biodiversity, and ecosystem properties. Ecological Monographs 69: 535-568.
Whalley, W.R. et al. 1995. Biological effects of soil compaction. Soil & Tillage Research 35: 53-68.
Wolkowski, R.P. 1990. Relationship between wheel-traffic-induced soil compaction, nutrientavailability, and crop growth - A Review. Journal of Production Agriculture 3: 460-469.
Wollersheim, R. et al. 1987. Effect of bulk density and soil water tension on denitrification inthe rhizosphere of spring wheat (Triticum vulgare). Biology and Fertility of Soils 5: 181-187.
Wurst, S. and van der Putten, W.H. 2007. Root herbivore identity matters in plant-mediatedinteractions between root and shoot herbivores. Basic and Applied Ecology 8: 491-499.
XXu, Y.Q. et al. 2008. Impacts of grazing intensity on denitrification and N2O production in a
semi-arid grassland ecosystem. Biogeochemistry 88: 103-115.YYeates, G.W. 1999. Effects of plants on nematode community structure. Annual Review of
Phytopathology 37: 127-149.Yeates, G.W. and Bongers, T. 1999. Nematode diversity in agroecosystems. Agriculture Ecosys-
tems & Environment 74: 113-135.Yeates, G.W. et al. 1993. Feeding-habits in soil nematode families and genera - an outline for soil
ecologists. Journal of Nematology 25: 315-331.ZZacheis, A. et al. 2001. Effects of migratory geese on plant communities of an Alaskan salt
marsh. Journal of Ecology 89: 57-71.Zacheis, A. et al. 2002. Nitrogen dynamics in an Alaskan salt marsh following spring use by
geese. Oecologia 130: 600-608.
151References
Sum
mar
ySa
men
vatt
ing

SummarySamenvatting

Summary
Aboveground and belowground organisms interact with each other using plants asintermediates. Plants provide organic carbon for decomposer organisms, as well asresources for root and shoot herbivores, pathogens and symbiotic mutualists. Inturn, these aboveground and belowground organisms influence plant performanceand plant community composition via direct removal of plant material, by enhanc-ing access to limiting resources, and by altering soil nutrient cycling. As a result,interactions between aboveground and belowground subsystems will have majorconsequences for community structure and ecosystem functioning in terrestrialecosystems.
Most studies have been focusing on aboveground-belowground interactions in-volving single plant species, or on the interplay between aboveground and below-ground invertebrates. However, how vertebrate aboveground grazers and soilorganisms interact to drive plant community structure and ecosystem processes ismuch less well investigated. Aboveground vertebrate herbivores and soil organismsdiffer largely in their mobility and scale of operation, particularly as a result of vastdifferences in body size and the physical structure between the aboveground andbelowground subsystems. This may have important consequences for effects of above-ground-belowground interactions on plant community structure and composition.
In this thesis I study how the interplay between aboveground vertebrate herbi-vores and soil organisms determines plant community structure and composition.The main aim of my thesis is to explore the potential of soil organisms to driveplant community structure and composition under different vertebrate grazingregimes. I am particularly interested in finding out how differences in the scale ofoperation between organisms influence the outcome of above-belowground interac-tions. I use a combination of field studies in a floodplain grassland (Junner Koeland,the Netherlands) and a salt marsh (Schiermonnikoog, the Netherlands), greenhouseexperiments and mathematical modeling to investigate effects of vertebrate herbi-vores on the soil community, how soil organisms in turn feed back to alter plantcommunity composition and dynamics, and how interactions between vertebrateherbivores and soil organisms drive plant community composition and structure.
Grazing by vertebrate herbivores is a key determinant of plant community compo-sition and ecosystem processes in grasslands worldwide. On the one hand, verte-brate herbivores alter plant community composition by affecting competitiveinteractions between plant species through the removal of aboveground plantbiomass. On the other hand, they alter soil physical conditions and soil nutrientcycling as a result of trampling, local deposition of dung and urine, changes in rootexudation patterns and altered plant litter quality and quantity. Such changes inthe soil physical environment, as well as in the plant species composition, can have
154 Summary

important consequences for the community composition and dynamics of soilorganisms. Soil organisms often prefer or avoid specific soil physical conditions, butare also known to be specifically associated with certain plant species. In an exclo-sure experiment in the Junner Koeland nature area I investigated which of thesefactors was most important in driving effects of combined cattle and rabbit grazingon the local taxonomic composition in the soil nematode community (chapter 2). Ifound that vertebrate grazing affected soil physical conditions, as well as plantspecies composition, while the soil nematode composition was determined only byherbivore-induced changes in plant community composition. This indicates thatspecies-specific associations between plants and soil organisms were more impor-tant driving the local composition in the belowground community in our experi-ment, than was variation soil physical conditions.
Changes in the soil community, as well as in soil abiotic conditions, mediated bythe plant community, may in turn feed back to influence plant growth and thecompetitive ability of plant species. This process is referred to as plant-soil feed-back. The biotic component of plant-soil feedback is mediated by direct and indirectinteractions between plant roots and soil organisms. Root herbivores directlyremove plant tissue, pathogens and mutualists may drain or provide resources,while decomposer organisms indirectly affect plant growth by promoting soilnutrient cycling. Plant-soil feedback effects can be highly species-specific as aresult of specific associations between plants and soil organisms. They may rangefrom positive to negative, depending on the balance between beneficial and antago-nistic interactions. In general, plants that experience strong positive plant-soil feed-back will outcompete other species, which reduces plant community diversity andmay enhance community stability (chapter 3). In contrast, when the plant-soil feed-back effect is negative, the competitive ability of a plant species is reduced. In thissituation replacement of plant species in space and time is stimulated, resulting inincreased coexistence, diversity, and temporal variability in the plant community(chapter 3). However, the mathematical model in chapter 3 revealed that plantspecies can still coexist under positive plant-soil feedback, when interspecific plantcompetition is very low. Moreover, negative plant-soil feedback increased plantcoexistence by increasing the parameter range in which oscillations between plantspecies occurred. This means that coexistence was possible under conditions thatwould otherwise lead to competitive exclusion, but also that oscillations occurredin situations that would otherwise lead to stable coexistence between plant species.Such oscillations induced by negative plant-soil feedback enhanced coexistencethrough replacement of species in time and hence increased plant diversity, butcould easily drive plant species to extinction in natural situations resulting in adecline in diversity.
In natural ecosystems the effects of vertebrate herbivores and plant-soil feed-back interactions often operate simultaneously. Aboveground and belowground
155Summary

organisms can alter the strength and direction of each others effects on plantcommunity structure and composition. As a result, the sum of their separate effectscan be different from the effect they have in combination. I used a greenhouse andfield experiment (in the Junner Koeland nature reserve) to investigate the potentialof plant-soil interactions to control plant species composition in the absence andpresence of vertebrate herbivores. I grew four dominant plant species from theJunner Koeland floodplain grassland in soils originating from plots grazed by cattleand rabbits and in soils originating from ungrazed plots. Half of the soils were incu-bated with conspecifics plant species, the other half with heterospecifics plantspecies. All plant species performed worse in soils incubated by conspecifics,regardless of vertebrate grazing history in the field where the soil originated from.In other words, all plant species experienced a negative plant-soil feedback inpreviously grazed and ungrazed soils (chapter 4). Such negative plant-soil feedbackeffects may stimulate spatiotemporal dynamics in plant communities in the field,because deleterious soil organisms will reduce the competitive abilities of plantspecies, leading to replacement by other species. In ungrazed situations I foundsuch dynamics, however, in grazed situations species composition in the plantcommunity was relatively stable in time and space. This indicates that large verte-brate herbivores can overrule negative plant-soil feedback interactions (chapter 4).Probably the effect of herbivores on the plant community was so strong that onlygrazing-tolerant plant species can become dominant in the plant community,regardless of the plant-soil feedback effects they experience.
To date, it is still very difficult to quantify effects of soil organisms on plantcommunity composition under field conditions, because soil organisms are hard tomeasure and manipulate. Moreover, the vast majority of soil organisms has notbeen identified yet. Effects of subterranean, mound building, social insects, such astermites in African savannas and yellow meadow ants (Lasius flavus) in NorthwestEuropean grasslands, are easier to recognize and hence easier to study. They affectplant community structure and composition on a larger scale than most soil organ-isms and they create visible small-scale plant patterns. Therefore, to get moreinsight in the potential of soil organisms to drive plant community structure ingrazed grasslands, I investigated how yellow meadow ants and vertebrate grazersinteractively influenced plant community composition and heterogeneity (chapter 5and 6). Yellow meadow ants are subterranean ecosystem engineers that stronglymodify their biotic and abiotic environment. They dig up fresh sand for buildingnest mounds, thereby creating competition-free space for plant species. Moreover,digging activities were previously found to alter abundances of root pathogens andsoil physical conditions. Finally, ants tend root aphids for honey dew production,thereby potentially actively affecting belowground grazing pressure. In chapter 5 Istudied in a greenhouse experiment how simulated grazing (clipping), the presenceof yellow meadow ant mounds and the presence of yellow meadow ants themselves
156 Summary

affected the structure and species composition of the plant community. Short-termplant biomass production was altered by an interaction between simulated grazingand ant mounds. In the presence of grazing production on and off mounds wassimilar, while in the absence of grazing production was enhanced off mounds. Inthe long run, both biomass production and species composition were affected bysimulated grazing only. The actual presence of ants did not have any effects. Thisexperiment shows that ants can potentially drive local variation in plant biomassproduction, but when grazing is too intensive or absent for longer periods of time,these effects can disappear. Again, these results imply that grazing by abovegroundvertebrates has the potential to overrule plant-soil feedback effects.
As explained before, aboveground and belowground organisms operate at verydifferent spatial and temporal scales. Many soil organisms are limited in theirmobility and spend their whole life in the vicinity of one or a few individual plants,while large vertebrate herbivores can explore areas of a few hectares in one day. As aresult, soil organisms will affect plants and the plant community locally, whereaseffects of large herbivores can play out across much larger scales. In chapter 6 Iinvestigated whether such differences in scale of operation can explain why verte-brate herbivores can overrule plant-soil feedback interactions. On the salt marsh ofSchiermonnikoog I studied plant community changes on mounds of yellow antsunder hare grazing (Lepus europaeus) and under combined grazing by hares andcattle. Small vertebrate herbivores, such as hares, preferentially select higher qualityfood. They will therefore select their forage very specifically, distinguishing betweenfine-grained differences in local plant quality. In contrast, large herbivores, such ascattle, are less selective because they mainly depend on high quantities of food andhence choose their food on a much coarser grain. Also they can be less selective duetheir larger muzzle size. As a result, hares and cattle may respond differently to localchanges in the plant community induced by ants. In chapter 6 I showed that plantspecies composition on and off mounds of yellow meadow ants was strongly alteredunder hare grazing. On mounds the cover of Elytrigia atherica decreased, while therelative cover of Festuca rubra increased. Hares grazed more intensively on themounds than off the mounds, probably due to their response to small-scale differ-ences in food quality. The combination of hare and cattle grazing resulted in a morehomogeneous plant species composition on and off mounds, with a general increasein Festuca rubra cover. Grazing intensity was also similar between mounds and thesurroundings. These results also show that large vertebrate grazers can overruleeffects of soil organisms, because they operate across large scales and graze homoge-neously on and off patches created by soil organisms. However, when vertebrateherbivores operate across a scale more similar to the one of belowground organisms,they can selectively respond to local heterogeneity in the plant community inducedby soil organisms. In such a situation the feedback between aboveground and below-ground organisms can enhance the formation of spatial plant community patterns.
157Summary

Large vertebrate grazers do not always overrule effects of soil organisms. Theymay respond to plant-soil feedback interactions when effects of these interactionsplay out on a large spatial scale. An example is the formation of grazing lawns inAfrican savannas. Large vertebrates have been suggested to increase soil microbialactivity and nutrient cycling in large patches. This enhances plant quality andhence the foraging patterns of the herbivores. In contrast, in other ecosystems ithas been shown that large herbivores can reduce soil nutrient cycling. Existingtheories explain these contrasting results by the net effect of herbivores on thequantity and quality of organic matter input into the soil food web. Herbivoresenhance nutrient cycling when they increase the quality of organic matter by excre-tion of dung and urine, by stimulation of root exudation and by enhancing plantlitter quality. They decrease the quality of organic matter when selectivelyremoving nutrient rich plant species, thereby decreasing the quality of remainingplant litter. These theories do not take effects of herbivores on soil physical condi-tions into account, while such effects can be of major importance driving nutrientcycling in many terrestrial ecosystems (chapter 7). For example, in wet, fine-textured soils trampling by grazers can reduce soil aeration and increase soil mois-ture levels. This may reduce the abundance and activity of soil microbes and hencehas a negative on nutrient cycling. Therefore, it is very important to include effectsof herbivores on soil physical conditions into current theories on soil nutrientcycling in grazed grassland. This will advance our understanding of the impacts ofherbivores on soil organisms and the processes that these organisms drive.
ConclusionIn my thesis I have shown that aboveground vertebrate herbivores can be animportant driver of soil community composition by altering plant communitycomposition. Such changes in the soil community may in turn feed back to driveplant species composition. As a result, plant-soil feedback can be important shapingplant communities, because it may enhance temporal dynamics and spatial pattern-ing in plant species composition. In grazed grasslands however, aboveground verte-brate herbivores alter the effect of plant-soil feedback on plant communitycomposition. On the one hand, herbivores enhance spatial patterns in the plantcommunity created by plant-soil interactions when they selectively respond tochanges in plant quality or community composition induced by soil organisms. Onthe other hand, vertebrate herbivores overrule effects of soil organisms when theyoperate across much larger scales and graze intensively and homogeneously on andoff plant patches affected by plant-soil feedback effects. Therefore, the potential ofsoil organisms to drive plant community structure and composition in naturalgrasslands is to a large extent dependent on the presence, identity, and grazingintensity of aboveground vertebrate herbivores.
158 Summary

Samenvatting
Organismen die onder- en bovengronds leven beïnvloeden elkaar doordat ze viaplanten met elkaar in verbinding staan. Planten leveren voedingsstoffen voor orga-nismen die organisch materiaal verteren en voor onder- en bovengrondse planten-eters (herbivoren), plantpathogenen en mutualisten. Op hun beurt hebben onder- enbovengrondse organismen een invloed op de groei van planten en de samenstellingvan de plantengemeenschap, omdat ze plantenmateriaal eten, zorgen dat planteneen betere toegang hebben tot voedingsstoffen of omdat ze de nutriëntenkringloopin de bodem kunnen veranderen. Dit samenspel tussen onder- en bovengrondseorganismsen bepaalt hoe goed planten het doen in een gemeenschap en dat heeftbelangrijke gevolgen voor de soortensamenstelling in de plantengemeenschap envoor het functioneren van terrestrische ecosystemen.
In de meeste studies zijn de effecten van het samenspel tussen ondergrondse enbovegrondse organismen op één specifieke plantensoort onderzocht, of zijn interac-ties tussen onder- en bovengrondse ongewervelde (invertebrate) organismen onder-zocht, zoals plantenetende insecten of organismen die organisch materiaal verteren.Er is veel minder bekend over de gecombineerde invloed van gewervelde (verte-brate) herbivoren en bodemorganismen op de soortensamenstelling en structuurvan een plantengemeenschap. Een belangrijk verschil tussen bovengrondse verte-braten en bodemorganismen is de schaal waarop ze planten en plantengemeen-schappen beïnvloeden. Bodemorganismen zijn meestal kleiner en leven in eenwereld die bestaat uit een netwerk van bodemdeeltjes gevuld met water en lucht.Ze zijn daardoor beperkt in hun mobiliteit en blijven hun hele leven vooral in debuurt van een enkele plant. Vertebrate hebivoren kunnen daarentegen binnen ééndag meerdere kilometers afleggen, waardoor hun invloed op de plantengemeen-schap zich over veel grotere afstanden uitstrekt. Deze verschillen in mobiliteit enschaal van invloed kunnen in grote mate bepalen hoe bovengrondse vertebrateherbivoren en bodemorganismen reageren op elkaars veranderingen in groei ensoortensamenstelling van planten.
In dit proefschrift beschrijf ik hoe het samenspel tussen bovegrondse vertebrateherbivoren en bodemorganismen de structuur en soortensamenstelling van de plan-tengemeenschap beïnvloedt. Het belangrijkste doel van mijn promotie-onderzoek iste onderzoeken in hoeverre bodemorganismen de soortensamenstelling en struc-tuur in de plantengemeenschap bepalen in verschillende bovengrondse begrazings-regimes en welke rol schaalverschillen tussen onder- en bovengrondse effectendaarbij spelen. Ik gebruik een combinatie van veldstudies in een overstromings-grasland (Junner Koeland, Nederland) en een kwelder (Schiermonnikoog, Neder-land), kasexperimenten, en wiskundige modellen om te bestuderen hoe vertebrateherbivoren de bodemgemeenschap beïnvloeden, hoe bodemorganismen op hunbeurt de soortensamenstelling en structuur van de plantengemeenschap kunnen
159Samenvatting

veranderen en hoe effecten van plant-bodem interacties worden beïnvloed doorbovengrondse vertebrate herbivoren.
Begrazing door vertebrate herbivoren speelt een sleutelrol bij het vormen van gras-landen wereldwijd. Vertebrate herbivoren beïnvloeden de soortensamenstelling inde plantengemeenschap. Aan de ene kant eten ze bovengronds plantenmateriaal endat verandert de concurrentiepositie van plantensoorten. Aan de andere kantveranderen ze bodemfysische eigenschappen en de kringloop van voedingsstoffen inde bodem doordat ze de bodem vertrappen, mest en urine uitscheiden, wortelexu-datiepatronen veranderen en de kwaliteit en hoeveelheid dood plantenmateriaal,die moet worden verteerd, beïnvloeden. Veranderingen in bodemfysische conditiesen in de soortensamenstelling van planten hebben een groot effect op de soortensa-menstelling van bodemorganismen. Bodemorganismen komen voor in een bepaaldbodemfysisch milieu, maar het is ook bekend dat ze soortspecifieke associatiesvormen met planten. In hoofdstuk 2 beschrijf ik hoe begrazing door koeien enkonijnen (vertebrate herbivoren) de lokale soortensamenstelling van nematoden(ook wel aaltjes genoemd) in de bodem verandert door bodemfysische condities tewijzigen of door de soortensamenstelling van planten te beïnvloeden. Het onder-zoek liet zien dat begrazing door vertebraten een groot effect had op zowel bodem-fysische factoren als de soortensamenstelling in de plantengemeenschap. Echter,alleen de veranderingen in de plantengemeenschap bepaalden de soortensamenstel-ling in de nematodengemeenschap, terwijl veranderingen in bodemfysische eigen-schappen geen effect hadden. Daarom lijken soortspecifieke associaties tussenplanten en bodemorganismen belangrijker voor het bepalen van de lokale soorten-samenstelling in de bodemgemeenschap in ons veldexperiment dan de fysischeeigenschappen van de bodem.
Veranderingen in de soortensamenstelling in de bodemgemeenschap (biotisch),maar ook in de bodemfysische eigenschappen (abiotisch), hebben op hun beurt eeninvloed op de groei en de concurrentiepositie van planten. Dit proces wordt ook welplant-soil feedback (plant-bodem terugkoppeling) genoemd. De biotische componentvan plant-bodem terugkoppeling bestaat uit directe en indirecte interacties tussenplantenwortels en bodemorganismen. Aan de ene kant beïnvloeden ondergrondseherbivoren, pathogenen en mutualisten planten direct door het verwijderen vanplantenmateriaal of door het aanleveren van limiterende voedingsstoffen. Aan deandere kant hebben organismen die plantenmateriaal verteren een indirect effectop plantengroei. Zij sturen de nutriëntenkringloop aan en beïnvloeden daarbij debeschikbaarheid van voedingsstoffen in de bodem. Effecten van plant-bodem terug-koppeling kunnen zeer soortspecifiek zijn, doordat bepaalde bodemorganismen enplantsoorten specifieke associaties vormen met elkaar. De effecten kunnen variërenvan positief tot negatief, afhankelijk van de balans tussen voordelige en schadelijkeorganismen in de bodem. Als het netto effect van bodemorganismen op een plant
160 Samenvatting
positief is, kan zo’n plant andere plantensoorten vaak wegconcurreren omdat haarconcurrentiepositie beter is. Dit leidt tot een lagere soortenrijkdom en een hogerestabiliteit in de plantengemeenschap (hoofdstuk 3). Als daarentegen het netto effectnegatief is, wordt de concurrentiepositie van een plantensoort verminderd. Andereplantensoorten in de gemeenschap die minder gevoelig zijn voor de soortspecifiekeschadelijke bodemorganismen kunnen deze plant wegconcurreren en vervangen.Als de nieuwe plant vervolgens ook haar eigen schadelijke bodemorganismenstimuleert, zal zij uiteindelijk weer worden vervangen door een andere plant.Daardoor neemt de dynamiek in een plantengemeenschap toe en is er niet één plantdie heel dominant wordt. Plantensoorten kunnen naast elkaar in een gemeenschapvoortbestaan, waardoor soortenrijkdom en diversiteit wordt verhoogd (hoofdstuk3). Toch kunnen onder positieve plant-bodem terugkoppelingen plantensoorten ooksamen in een gemeenschap voortbestaan, als ze weinig met elkaar concurreren.Bovendien kunnen negatieve plant-bodem terugkoppelingen ook leiden tot eenlagere diversiteit, als schadelijke bodemorganismen zorgen dat plantensoorten uiteen plantengemeenschap verdwijnen. De verhoogde dynamiek die wordt veroor-zaakt door de aanwezigheid van schadelijke organismen kan er namelijk toe leidendat sommige plantensoorten zo slecht gaan presteren dat ze zich niet meer kunnenherstellen in een gemeenschap.
In natuurlijke ecosystemen werken de invloeden van vertebrate herbivoren enplant-bodem terugkoppelingen vaak gelijktijdig. Onder- en bovengrondse orga-nismen kunnen de sterkte en richting van elkaars effect op de plantengemeenschapveranderen. Daardoor kan de optelsom van de afzonderlijke effecten van herbi-voren en bodemorganismen op de plantengemeenschap verschillen van het effectdat ze hebben in combinatie. Om dit te onderzoeken heb ik in een gecombineerdkas- en veldexperiment (Junner Koeland) gekeken hoe plant-bodem terugkoppe-lingen de dynamiek in de soortensamenstelling van planten controleren in de aan-en afwezigheid van bovengrondse vertebrate herbivoren (hoofdstuk 4). In de kasheb ik vier dominante plantensoorten uit het Junner Koeland laten groeien inbodems afkomstig uit proefvlakken begraasd door koeien en konijnen en uit proef-vlakken die niet werden begraasd door deze herbivoren. De helft van deze bodemswas eerder begroeid door soortgenoten, terwijl de andere helft was begroeid doorandere plantensoorten. Onafhankelijk van de begrazingshistorie van de bodemgroeiden alle planten slechter in bodems waarop soortgenoten hadden gegroeid, danin bodems waarop andere plantensoorten hadden gegroeid. Dit betekent dat alleplantensoorten beïnlvoed werden door negatieve plant-bodem terugkoppelingen endat deze terugkoppelingen over het algemeen niet werden veranderd door dehistorie van bovengrondse begrazing (hoofdstuk 4). Zulke negatieve plant-bodemterugkoppelingen stimuleren dynamiek in de plantensamenstelling omdat soortspe-cifieke schadelijke bodemorganismen de concurrentiepositie van een plant zodanigkunnen verminderen dat die afneemt in aantal en wordt vervangen door andere
161Samenvatting

plantensoorten. In het veld vond ik een dergelijke dynamiek, waar verschillendesoorten elkaar afwisselen in de tijd en ruimte, in onbegraasde situaties, terwijlbegrazing de soortensamenstelling van de vegetatie stabiliseerde. Hieruit blijkt datvertebrate herbivoren de negatieve effecten van plant-bodem terugkoppelingenteniet kunnen doen (hoofdstuk 4). Waarschijnlijk is de invloed van vertebrate herbi-voren op de plantengemeenschap in het veld zo sterk dat bodemorganismen weinigkansen krijgen om de plantensamenstelling te sturen. Herbivoren aten bij voorkeurde smakelijke planten die slecht bestand zijn tegen begrazing. Daardoor stimu-leerden ze de toename van plantensoorten die begrazing goed kunnen weerstaan,zelfs als deze begrazingstolerante soorten negatieve effecten van hun eigen bodem-gemeenschap ondervonden.
Het is moeilijk om effecten van bodemorganismen op de plantengemeenschap tekwantificeren in het veld, omdat er heel veel soorten bodemorganismen zijn, omdateen groot deel van die bodemorganismen nog niet is geïdentificeerd en omdat hetlastig is om ondergrondse gemeenschappen experimenteel te manipuleren. Effectenvan ondergrondse sociale insecten, zoals termieten in Afrikaanse savannes en geleweidemieren (Lasius flavus) in noordwest Europese graslanden, op de plantenge-meenschap zijn makkelijker te bestuderen in het veld, omdat die zich vaak afspelenop een grotere schaal en een grote invloed hebben op de ruimtelijke variatie inplantensoortensamenstelling. Daarom heb ik het samenspel tussen vertebrateherbivoren en gele weidemieren onderzocht (hoofdstuk 5 en 6) om de effecten vanplant-bodem terugkoppelingen op soortensamenstelling in de plantengemeenschapbeter te begrijpen. Gele weidemieren zijn ecosystem engineers (ecosysteembouwers:organismen die hun omgeving zelf creëren of sterk veranderen). Ze leven onder-gronds en hebben een grote invloed op de biotische en abiotische eigenschappenvan hun omgeving. Om nestbulten te bouwen graven ze zand op. Dit zorgt vooropen plekken in de plantengemeenschap waar nieuwe soorten zich kunnenvestigen. Daarnaast veranderen graafwerkzaamheden de doorluchting van debodem en de hoeveelheid voedingsstoffen, vocht, organisch materiaal en wortelpa-thogenen in de bodem. Verder houden de mieren actief wortelluizen, ondergrondseplanteneters, in hun nestbulten, zoals mensen koeien kunnen houden. Ze“melken”de luizen voor hun honingdauw, een belangrijke voedselbron voor demieren, en in ruil beschermen ze de luizen in hun nest. Mieren beïnvloeden deplantengemeenschap daarom zowel via de fysieke structuur van de nestbulten alsvia het effect van hun aanwezigheid op het welzijn van de wortelluizen. In hoofd-stuk 5 beschrijf ik een kasexperiment waarmee ik heb bestudeerd hoe nagebootstebegrazing (door middel van wegknippen van bovengronds plantenmateriaal), deaanwezigheid van nestbulten van gele weidemieren (Lasius flavus) en de aanwezig-heid van gele weidemieren zelf de structuur en soortensamenstelling in de planten-gemeenschap beïnvloeden. Op de korte termijn (na 3 maanden) werd de biomassa-productie van planten bepaald door de combinatie van nagebootste begrazing en de
162 Samenvatting

aanwezigheid van mierenbulten. Als de planten niet werden geknipt was debiomassaproductie hoger op dan naast mierenbulten, terwijl er geen verschil inproductie was als planten wel werden geknipt. Daarentegen, werden de soorten-rijkdom en de soortensamenstelling in de plantengemeenschap op de lange termijn(na 9 maanden) alleen beïnvloed door nagebootste begrazing en niet door de aanwe-zigheid van mierenbulten. De aan- of afwezigheid van de mieren zelf had geeneffect op biomassa productie, soortenrijkdom en soortensamenstelling. Dit experi-ment laat zien dat mieren lokale variatie in biomassaproductie kunnen aansturen,maar dat begrazing deze effecten teniet kan doen. Als begrazing intensief is, of voorlange tijd afwezig is, verdwijnen effecten van bodemorganismen op de plantenge-meenschap. Deze resultaten bevestigen dat grote, bovengrondse, vertebrate herbi-voren effecten van bodemorganismen op de plantengemeenschap teniet kunnendoen.
De schalen waarop onder- en bovengrondse organismen opereren, verschillensterk. Veel bodemorganismen brengen hun hele leven door in de nabijheid van éénof een paar planten, terwijl grote vertebrate herbivoren gebieden van een paarhectaren binnen één dag kunnen gebruiken. Daardoor zullen de meeste bodemorga-nismen de plantengemeenschap lokaal beïnvloeden, terwijl effecten van groteherbivoren zich op een grotere schaal uiten. In hoofdstuk 6 beschrijf ik hoe derge-lijke schaalverschillen kunnen verklaren waarom grote, minder selectieve grazersplant-bodem terugkoppelingen teniet kunnen doen. Op de kwelder van Schiermon-nikoog heb ik de plantengemeenschap op en naast mierenbulten van gele weide-mieren (Lasius flavus) onderzocht onder begrazing door hazen (Lepus europaeus) enonder gecombineerde begrazing door hazen en koeien. Kleine herbivoren, zoalshazen, zijn afhankelijk van een hoge voedselkwaliteit. Ze selecteren hun voedselheel precies en maken keuzes op een kleine schaal. Koeien daarentegen zijn afhan-kelijk van grote hoeveelheden voedsel. Ze zijn minder selectief en maken hun voed-selkeuze op een grotere schaal. Bovendien zijn ze minder selectief omdat ze eengrotere bek hebben. Hazen en koeien kunnen daarom verschillend reageren opvegetatiepatronen die worden gemaakt door gele weidemieren. Ik heb laten zien datde soortensamenstelling van de plantengemeenschap op en naast mierenbultensterk verschilde wanneer alleen hazen voorkwamen. Op de bulten was de bedek-king van zeekweek (Elytrigia atherica) sterk afgenomen, terwijl de bedekking vanrood zwenkgras (Festuca rubra) was toegenomen. Hazenbegrazing was intensieverop mierenbulten dan ernaast, waarschijnlijk doordat de voedselkwaliteit op debulten hoger was. Wanneer hazen en koeien samen voorkwamen, was de soortensa-menstelling van planten op en naast mierenbulten vergelijkbaar en was er overaleen hoge bedekking van rood zwenkgras. De begrazingsintensiteit op en naastmierenbulten was even hoog. De resultaten van dit veldexperiment laten zien datselectieve vertebrate herbivoren lokale heterogeniteit in de plantengemeenschapkunnen stimuleren door selectief te reageren op effecten van plant-bodem terug-
163Samenvatting

koppelingen. Grote grazers daarentegen maken hun voedselkeuze op een veelgrotere schaal en doen de effecten van bodemorganismen teniet, waardoor de lokaleplantengemeenschap homogener wordt.
Grote, minder selectieve, vertebrate herbivoren doen het effect van bodemorga-nismen niet altijd teniet. Wanneer plant-bodem terugkoppelingen plaatsvinden opeen grote schaal, veranderen ze de plantengemeenschap ook op een grote schaal enkunnen grote herbivoren eventueel specifiek reageren op effecten van bodemorga-nismen. Zo kunnen grote vertebrate herbivoren bijvoorbeeld een sterke invloedhebben op de nutriëntenkringloop in de bodem. Dit verandert de kwaliteit en soor-tensamenstelling van planten op een grote schaal en bepaalt vervolgens de voedsel-keuze van de grote herbivoren. Een goed voorbeeld hiervan is de vorming vanzogenaamde grazing lawns in Afrikaanse savannes. In deze systemen versnellengrote grazers de nutriëntenkringloop waardoor ze de kwaliteit van de vegetatie, endus hun eigen voedsel, verhogen. Echter, in andere ecosystem is aangetoond datgrote grazers de nutriëntcyclus in de bodem juist afremmen. Bestaande theorieënverklaren deze tegenovergestelde effecten van grazers op nutriëntcycli in de bodemvoornamelijk door het netto effect van herbivoren op de kwaliteit en kwantiteit vanhet organisch materiaal dat de basis vormt van het bodemvoedselweb. Wanneer denetto kwaliteit van het organisch materiaal verhoogd is doordat een deel van hetorganische materiaal in de vorm van mest en urine, of door de stimulatie vanwortelexudatie in de bodem terecht komt, evenals doordat de kwaliteit van hetdode plantenmateriaal hoger is, wordt de activiteit van bodemorganismen gestimu-leerd en de nutriëntcyclus versneld. Echter, wanneer de netto kwaliteit van hetorganisch materiaal negatief wordt beïnvloedt, bijvoorbeeld doordat herbivorenplanten van hoge kwaliteit selectief weggrazen waardoor de kwaliteit van hetoverige plantenmateriaal omlaag gaat, kan de nutriëntcyclus worden afgeremd.Deze theorieën houden geen rekening met de mogelijke effecten van herbivoren opbodemfysische condities, terwijl in veel ecosystemen zulke effecten van grootbelang zijn voor het sturen van de nutriëntenkringloop (hoofdstuk 7). In natte,kleiige bodems kan vertrapping door grote herbivoren bijvoorbeeld zorgen voor eentoename van vocht en een afname van doorluchting in de bodem. Hierdoor wordtde activiteit van veel bodemorganismen geremd en dus ook de kringloop van nutri-ënten. Hoofdstuk 7 laat daarom zien dat het belangrijk is om de effecten van herbi-voren op bodemfysische parameters op te nemen in bestaande theorieën overeffecten van herbivoren op nutriëntencycli. We leren dan beter begrijpen hoe begra-zing de bodemorganismen en de processen beïnvloeden, die zij uitvoeren in ecosy-stemen.
ConclusieIn dit proefschrift heb ik laten zien dat bovengrondse vertebrate herbivoren desoortensamenstelling in de bodemgemeenschap beïnvloeden door de soortensamen-
164 Samenvatting

stelling in de plantengemeenschap te veranderen. Zulke veranderingen in debodemgemeenschap kunnen op hun beurt de groei en soortensamenstelling vanplanten veranderen. Plant-bodem terugkoppelingen hebben daardoor een belang-rijke invloed op de dynamiek en ruimtelijke patronen in de soortensamenstellingvan de plantengemeenschap. In begraasde graslanden kunnen vertebrate herbi-voren het effect van plant-bodem terugkoppelingen op de plantengemeenschapechter veranderen. Aan de ene kant kunnen ze ruimtelijke patronen die bodemorga-nismen creëren versterken, als ze selectief reageren op lokale veranderingen in deplantenkwaliteit of de soortensamenstelling die worden veroorzaakt door bodemor-ganismen. Aan de andere kant kunnen vertebrate herbivoren effecten van bodemor-ganismen teniet doen als ze op een grotere schaal opereren dan bodemorganismenen de vegetatie intensief en homogeen begrazen. De potentie van bodemorganismenom de structuur en soortensamenstelling van een plantengemeenschap in een gras-land te bepalen is daarom voor een groot deel afhankelijk van de aanwezigheid,selectiveit en begrazingsintensiteit van bovengrondse vertebrate herbivoren.
165Samenvatting


DankwoordAcknowledgements
Het proefschrift is af! Dit zou zeker niet gelukt zijn zonder de hulp, steun en inspi-ratie van heel veel mensen. Op deze plek wil ik iedereen bedanken die, in welkevorm dan ook, een steentje heeft bijgedragen. Een aantal van jullie wil ik in hetbijzonder noemen.
Allereerst natuurlijk mijn promotoren Prof. Dr. Han Olff en Prof. Dr. Wim vander Putten. Jullie zijn totaal verschillend, en komen uit hele andere werelden,respectievelijk boven- en ondergronds. Het was ideaal om daar tussenin te zitten en“een beetje van twee walletjes te eten”. Han, je was altijd een enorme inspiratiebronmet veel ideeën. Ik heb veel van je geleerd over het opzetten en analyseren vangoede en creatieve experimenten. Niet alles pakte altijd zo uit als gehoopt, maardaardoor heb ik alweer veel nieuwe inspiratie. Wie weet ga ik ooit nog eens verdermet grote grazers en van die “Wim-experimenten”. Ik wil je heel erg bedanken vooralle vrijheid, zowel tijdens het praktische- als het schrijfwerk. Ik vond het ontzet-tend fijn dat je me in het laatste jaar de mogelijkheid hebt gegeven om in de groepvan Wim op het NIOO te werken. Dit maakte het voor mij veel makkelijker om hetschrijven te combineren met het gezinsleven, maar het was ook heel leerzaam omde wetenschappelijke sfeer in de groepen van jullie allebei van dichtbij te kunnenmeemaken. Wim, ik wist niet veel van bodemorganismen toen ik begon als AiO (zijndie belangrijk dan?), maar ik heb een heleboel geleerd (ja, ze zijn belangrijk, somsdan!). In de eerste jaren kwam ik af en toe langswaaien in Heteren om nieuweideeën en resultaten van uitgevoerde experimenten door de nemen. Je commentaarwas nuchter, concreet en vaak ook heel direct, maar altijd opbouwend en bruik-baar. Het laatste jaar heb ik volledig in jouw groep doorgebracht. Heel erg bedanktvoor die periode! Het snelle en grondige commentaar op manuscripten heeft megeholpen om mijn proefschrift op tijd af te ronden. Soms bleef er geen spaan heelvan de eerste versies (“ga maar even zitten”). Niet altijd wat ik wilde horen in delaatste fase, maar het kwam de kwaliteit van het werk altijd ten goede (somseindigt een stuk dan ineens in Ecology!). Je stimuleerde me om terug te gaan naarde basis en om vragen en hypotheses nog net even iets scherper te formuleren.
Jan Bakker, je was niet officieel betrokken bij mijn project, maar indirect heb jewel veel bijgedragen. Het begon al lang geleden, toen je mijn studiebegeleider werd.Je hebt me op het spoor van plant-dier interacties gezet, gestimuleerd om deel tenemen aan de TBA cursus in Oeganda en om een doctoraalonderwerp op Konza tegaan doen. Hierdoor is mijn enthousiasme voor onderzoek zeker aangewakkerd,bedankt daarvoor. Tijdens mijn AiO project ben je vooral betrokken geweest bij deprojecten op Schiermonnikoog. Bedankt voor de inspirateie in het veld, en voor demotiverende veldcursussen.
Het praktische werk dat de basis vormt voor dit proefschrift heb ik niet allemaalalleen uitgevoerd. De belangrijkste bijdrage kwam van de studenten die een docto-raalonderwerp bij mij hebben gedaan, in chronologische volgorde waren dat SybrenBouwer, Renate Otter, Saskia de Vries en Elzemiek Geuverink. Daarnaast zijn er
168 Dankwoord

vele mensen die een enkele of een aantal dagen hebben meegeholpen tijdens hetveld-, lab- en kaswerk: Verena Cordlandwehr, Henk Duyts, Henk van der Jeugd,Harry Offringa, Maarten Schrama, Carmen van der Veen, Roos Veeneklaas, Yzaakde Vries en de studenten van de Biodiversity research cursus. Yzaak, zonder jouwas het herkennen van de soorten in het veld een stuk langzamer gegaan en ookveel minder leuk geweest. Fijn dat je alle jaren een dagje mee wilde om de plantens-oorten weer even op te frissen. En natuurlijk heb je in 2008 (samen met Verena) allevegetatieopnamen voor mij gemaakt, omdat ik zelf niet het veld in kon. Bedankt!
In het Junner Koeland ontbrak een echt veldstation, maar gelukkig was er in2007 “De Dampol”. Aniek, Jasper en Harry, bedankt voor de leuke en inspirerendetijd in dit “high-tech” onderkomen! Aniek, we hebben in datzelfde jaar veel metmieren “geprutst” om te kijken hoe we een gezamenlijk experiment zouden kunnenopzetten om mieren-luizen-planten interacties te bestuderen. Jij hebt je vooral ergingezet om uit te zoeken wat de beste methodes waren om luizen en mieren inallerhande potjes en bakjes te houden. Jammer dat het definitieve experimentuiteindelijk niet van de grond is gekomen, want leuk blijven die mieren en luizenwel. Wie weet komt er ooit nog iets van in de toekomst. Harry, in 2007 heb jij eenaantal weken meegelopen in het veld. Naast dat het gewoon erg gezellig was omsamen veldwerk te doen, was het voor mij ook erg leerzaam om te horen hoebeheerders tegen hun terreinen en vooral ook tegen onderzoekers aan kijken. OpSchiermonnikoog was er wel een heus veldstation. De experimenten op de kwelderwaren voor mij vooral een extraatje en daarom heb ik niet veel tijd doorgebracht op“De Herdershut”. De dagen dat ik er wel was heb ik het ontzettend naar mijn zingehad. Alle “vaste” bewoners en studenten, bedankt voor de leuke tijd!
Naast veldwerk was het de bedoeling dat ik ook een model zou opzetten omonder-bovengrondse interacties beter te kunnen begrijpen. The theoretical worldwas fairly new to me, and I could not have set up and analyzed models without thehelp of Franjo Weissing and Tomàs Revilla. Thanks for the effort you put into above-ground-belowground models! The collaboration already resulted in one manuscript.Unfortunately, the model on herbivore-plant-soil interactions did not yet make intothis thesis, but hopefully it will lead to another paper in the near future.
De meeste tijd van mijn AiO project heb ik doorgebracht bij COCON (Communityand Conservation Ecology) in Groningen. Ik heb daar altijd met heel erg veel pleziergewerkt. Iedereen, heel erg bedankt! Naast het stimulerende, wetenschappelijkewerkklimaat, herinner ik mij vooral ook heel veel leuke, sociale momenten. Natuur-lijk de dagelijkse koffie- en lunchpauzes, en vooral ook de theepauzes op de LEDA-kamer (dank je wel, Irma), maar ook de vrijdagmiddagborrels, etentjes, Sinterklaasen labuitjes. All colleague PhD students and post-docs, thanks for the inspiration and“gezelligheid”: Mariska, Verena, Roos, Cleo, Esther, Joris, Jan, Grant, Irma, Renée,Chris, Patrick, Nina, Alejandro, Maarten, Jasper, Fons, Agata, Mike, Erustus, Alma,Kelly, Elske, Carol, Sanne and Bernd. In particular, I would like to thank Mariska,
169Acknowledgements

Verena, Roos and Cleo for sharing rooms, baby-issues, many dinners, and (left-over)chocolate (Mariska, de la kon ik nog net weerstaan, maar niet de chocola op de planktoen je voor een paar maanden naar Afrika was…). Verena, ondanks dat we laatstejaren officieel een kamer deelden heb ik je niet veel gezien omdat ik naar Wageningenverhuisde. Toch was het altijd leuk en gezellig als ik er wel was. Ik ben blij dat jemijn paranimf bent! In de vakgroep was ook alle praktische ondersteuning aanwezigdie nodig was om goed onderzoek te kunnen doen. Nelly Eck, bedankt voor het analy-seren van mijn monsters in het lab. Ik herinner me nog dat ik in 2006, net voor jouwzomervakantie, onverwacht met een heleboel grondmonsters aan kwam waarin ikminerale stikstof wilde meten. Je hebt alles op alles gezet om binnen 2 dagen deanalyses af te maken. Echt geweldig! Jacob Hogendorf, bedankt voor alle hulp in dekas en voor het klaarzetten van veldmaterialen. Ik wil Marjan Boertje, Joyce Riet-veld en Ingeborg Jansen heel erg bedanken voor de administratieve ondersteuning.
Tijdens het laatste jaar ben ik van Groningen naar Wageningen verhuisd en hebik mijn boekje afgemaakt in de vakgroep TE (Terrestrial Ecology) op het NIOO inHeteren. Vanaf het eerste moment heb ik me daar erg welkom gevoeld. Een gewel-dige omgeving om een proefschrift te schrijven en zowel wetenschappelijk alssociaal heel inspirerend. Tess, Annelein en Elly, ik vond het fijn om de laatsteloodjes met jullie te delen. Tibor en Koen, ik vond het heel leuk en gezellig om metjullie een kantoor te delen. Bedankt voor het inzicht in het leven van een post-doc.Hoewel ik vooral artikelen heb geschreven tijdens het laatste jaar op het NIOO, hebik ook nog een kasexperiment uitgevoerd. Gregor, bedankt voor de praktischeondersteuning. Roel, ik verhuisde een experiment mee vanuit Groningen dat eenluizenbesmetting had. Ondanks dat het al 5 uur ’s middags, en nog een graad of 30,was toen ik aankwam vanuit het hoge noorden, was jij bereid om het experimentdirect te behandelen zodat het meteen de kas in kon. Super!
Ik wil Staatsbosbeheer en Natuurmonumenten, in het bijzonder Ruud Jonker enOtto Overdijk, bedanken voor de toestemming om veldwerk te doen in het JunnerKoeland en op Schiermonnikoog. Dick Visser, heel erg bedankt voor de opmaak vanhet proefschrift. Ik weet zeker dat het zonder jouw hulp lang niet zo mooi zou zijngeworden!
Natuurlijk is alle praktische en wetenschappelijke hulp ontzettend belangrijk voorhet succesvol afronden van een proefschrift. Maar minstens zo onmisbaar zijn vriend-schap en ondersteuning van iedereen in mijn naaste omgeving en van het thuisfront.
Allereerst wil ik de “biologen” heel erg bedanken, want met jullie ben ik hetgrote wetenschappelijke avontuur begonnen. Carmen, Nienke, Willemien, Sonja,Eva, Douwe-Jaap, Janneke, Sander, Melian, Peter en Marloes superbedankt vooralle etentjes, spelletjes, films, Sellingen-weekenden en Bernlef-feestjes. Carmen, ikzie je niet zoveel meer omdat Groningen en Wageningen eigenlijk wel ver uit elkaarzijn. Toch blijf je altijd speciaal! Als je letterlijk samen in “de shit” hebt gezeten
170 Dankwoord

moet dat ook wel. Bedankt voor alle geweldige veldmomenten, gesprekken, wijn entiramisu (“delen, hoezo?!?”). Hopelijk ook in de toekomst.
De “dames” Marleen, Willemien, Nienke, Eva en Sonja, heel erg bedankt vooralle weekendjes van de laatste jaren! Eten (en nog meer eten), lachen, thee leuten enlange (!) wandelingen. Marleen, jou ken ik al heel erg lang. We hebben heel veelstappen in ons leven samen gezet en hopelijk volgen er ook nog vele. Bijna alleshebben we samen gedeeld: opdrachtjes, school, fietsongelukken, werk, studeren, opkamers gaan en familie. Het is echt heel speciaal om iemand zo lang te kennen! Ikben heel erg blij dat je mijn paranimf wilt zijn.
De (ex-)Groningers wil ik bedanken voor heel veel gezelligheid buiten het lab: Leo& Corine, Joris & Mariska, Cleo & Jan, Roos,Verena en Christophe & Marije (Marije,bedankt voor alle spontane lunches en baby-speel acties. Christophe, bedankt voorhet heerlijke eten, 44, en andere lekkere brouwsels: altijd goed voor de maag :)!),
Papa, mama en Martijn jullie stonden altijd voor me klaar en niks was te gek.Even heen-en-weer om koffie drinken in Groningen, mij opvissen uit een inge-sneeuwd Arnhem toen ik vanuit Heteren kwam (en heel Nederland de hele nacht inde file heeft gestaan), klussen in Groningen, nog meer klussen, verhuizen en nogmeer klussen (ik zal beloven dat we voorlopig niet meer gaan verhuizen ofverbouwen), op Julia passen als Henk en ik naar een congres gingen, honderdenzakjes met hertenpoep in een oude koelkast in de garage, herteningewandenophalen ergens midden op de Veluwe op weg naar een familiebezoekje en op welketijd je ook thuis komt (want het is en blijft thuis) er is altijd eten en een bed. Echtalles kan! Heel erg bedankt voor alle steun. Natuurlijk wil ik op deze plek ook defamilie van der Jeugd, Mia, Hubert, Marga, Tessa en Floor, bedanken voor de gezel-lige etentjes en weekendjes van de afgelopen jaren. Mijn “kunstfamilie” Breen wil ikheel erg bedanken voor het vormen van een extra thuis gedurende mijn hele leven.
Tot slot mijn eigen kleine thuis, Henk, Julia en Hanna. Henk, natuurlijk haddenwe het soms over wetenschap, statistiek en papers, maar thuis was toch vooral deplek om even niet met mijn promotie bezig te zijn. Heerlijk genieten van de kleineen grote dingen in het leven, een goed glas wijn, lekker eten, gezellig kletsen, mooiereizen (met de motorboot voor dag en dauw naar Storholmen om ganzen te kijken,helemaal alleen kamperen aan een bergmeer in Colorado, mooie gesprekken op deoneindige zandvlakte in Rusland en samen keihard kanoën in de branding van deBarentszzee blijven dierbare herinneringen!). En nu natuurlijk “onze meisjes”! Juliazoals je altijd zei voordat je “grote zust” werd: “Ik ben nog maar een kleintje”.Hanna, je bent er nog maar net en ook nog heel klein. Maar, het zijn de kleinedingen die het doen! Julia en Hanna, van jullie heb ik geleerd wat echt belangrijk isin het leven! Bedankt voor jullie steun en het vormen van een warm thuis. Ik hoopdat we nog vele jaren samen kunnen zijn!
Ciska Veen 15 februari 2011, Wageningen
171Acknowledgements


Publications in peer-reviewed journals- Veen, G.F., H. Olff, H. Duyts, W.H. van der Putten (2010) Vertebrate herbivores
influence soil nematodes by modifying plant communities. Ecology 91: 828-835- Veen, G.F., J.M. Blair, M.D. Smith & S.L. Collins (2008) Influence of grazing and
fire frequency on small-scale plant community structure and resource vari-ability in tallgrass prairie. Oikos 117: 859-866
- Van der Graaf, A.J., J. Stahl, G.F. Veen, R.M. Havinga & R.H.Drent (2007) Patchchoice of avian herbivores along a migratory trajectory – from Temperate toArctic. Basic and Applied Ecology 8: 354-363
- Mouissie, A.M., C.E.J. van der Veen, G.F. Veen, R. van Diggelen (2005) Ecologicalcorrelates of seed survival after ingestion by Fallow Deer. Functional ecology19: 284-290.
Other publications- Mousissie, A.M., G.F. Veen & R. van Diggelen (2005) Seed dispersal by roe deer,
red deer and fallow deer: a survey of pellet groups and the digestive tract ofshot deer. In dissertation: A.M. Mouissie. 'Seed dispersal by large herbivores:implications for the restoration of plant biodiversity. University of Groningen ,Groningen
In the media- VPRO Noorderlicht webdocument: “Behoud de mier”
http://noorderlicht.vpro.nl/dossiers/35813434/hoofdstuk/35813435/
173List of publications
List of publications

E.S. (Liesbeth) Bakker, Department of Aquatic Ecology, Netherlands Institute of Ecology,
Postbus 50, 6700 AB, Wageningen, The Netherlands
Jan P. Bakker, Community and Conservation Ecology Group, Centre for Ecological and
Evolutionary Studies, University of Groningen, P.O. Box 11103, 9700 CC, Groningen
Henk Duyts, Terrestrial Ecology Group, Netherlands Institute of Ecology, Postbus 50, 6700
AB, Wageningen, The Netherlands
Maarten B. Eppinga, Department of Innovation and Environmental Sciences, University of
Utrecht, P.O. Box 80.155, 3508 TC Utrecht, the Netherlands; Department of Plant Biology,
University of Vermont, Burlington, VT 05401, United States of America
Elzemiek Geuverink, Community and Conservation Ecology Group, Centre for Ecological
and Evolutionary Studies, University of Groningen, P.O. Box 11103, 9700 CC, Groningen
Han Olff, Community and Conservation Ecology Group, Centre for Ecological and Evolu-
tionary Studies, University of Groningen, P.O. Box 11103, 9700 CC, Groningen
Wim H. van der Putten, Department of Terrestrial Ecology, Netherlands Institute of
Ecology, Postbus 50, 6700 AB, Wageningen, The Netherlands; Laboratory of Nematology,
Wageningen University, PO Box 8123, 6700 ES Wageningen, The Netherlands
Tomàs. A. Revilla, Theoretical Biology Group, Centre for Ecological and Evolutionary
Studies, University of Groningen, P.O. Box 11103, 9700 CC, Groningen
Jasper L. Ruifrok, Community and Conservation Ecology Group, Centre for Ecological and
Evolutionary Studies, University of Groningen, P.O. Box 11103, 9700 CC, Groningen
Maarten J.J. Schrama, Community and Conservation Ecology Group, Centre for Ecological
and Evolutionary Studies, University of Groningen, P.O. Box 11103, 9700 CC, Groningen
Saskia de Vries, Community and Conservation Ecology Group, Centre for Ecological and
Evolutionary Studies, University of Groningen, P.O. Box 11103, 9700 CC, Groningen
Franz. J. Weissing, Theoretical Biology Group, Centre for Ecological and Evolutionary
Studies, University of Groningen, P.O. Box 11103, 9700 CC, Groningen
174 Affiliation of co-authors
Affiliation of co-authors

Geertje Franciska (Ciska) Veen was born on the 20th of March 1981 in Apeldoorn,the Netherlands. She attended high school (VWO) at “De Heemgaard” in Apeldoorn.In 1999 she started to study biology at the University of Groningen. For her Mastersshe performed three main research projects focusing on interactions betweenplants and animals. She first studied seed dispersal by deer in the Netherlands.Then she investigated the foraging ecology of Barnacle geese (Branta leucopsis) andspent two months on Gotland in Sweden to perform field work. Her last projectwas carried out at Kansas State University, (Manhattan, USA) under the supervisionof Prof. Dr. John M. Blair. She studied the interactive effects of fire and bisongrazing on plant community heterogeneity in the tallgrass prairie. During herMasters, she followed the course tropical biology in Kibale Forest, Uganda, whichwas organized by the Tropical Biology Association (Cambridge, UK). In February2005 she received her Masters degree and graduated cum laude.
From April 2005 – September 2010 Ciska worked on her PhD project with Prof.Dr. Han Olff (University of Groningen) and Prof. Dr. Wim H. van der Putten (Nether-lands Institute of Ecology) on the interactions between aboveground vertebrateherbivores and soil organisms which led to this thesis. Besides that, she has beenjoining an Arctic expedition in 2007 to work for one month as a field assistant tocatch, color-ring and collect observations on breeding Barnacle geese at the Russiantundra.
From September – December 2010 Ciska has been working as a post-docresearcher together with Prof. Dr. Wim H. van der Putten and Dr. T. MartijnBezemer (Netherlands Institute of Ecology). She investigated long-term temporalvariation in functional diversity in a biodiversity field experiment (CLUE).
175Curriculum vitae
Curriculum vitae
