assessing belowground plant diversity in wetland soil
TRANSCRIPT

Assessing Belowground Plant Diversity in Wetland Soil through DNA Metabarcoding: Impact of DNA Marker Selection and Analysis of Temporal
Patterns
by
Nicole Allison Fahner
A Thesis presented to
The University of Guelph
In partial fulfillment of requirements for the degree of Master of Science
in Integrative Biology
Guelph, Ontario, Canada
© Nicole Fahner, December, 2015

ABSTRACT
ASSESSING BELOWGROUND PLANT DIVERSITY IN WETLAND SOIL THROUGH DNA METABARCODING: IMPACT OF DNA MARKER SELECTION AND ANALYSIS OF TEMPORAL PATTERNS
Nicole Allison Fahner Advisor: University of Guelph, 2015 Professor Mehrdad Hajibabaei This thesis is an investigation of the DNA metabarcoding approach to biodiversity assessment of
vascular plant diversity. Specifically, the investigation focused on DNA metabarcoding of environmental
DNA extracted from unsorted soil samples. There were two main research goals: to evaluate the
suitability of four established DNA marker regions – matK, rbcL, ITS2, and the P6 loop of the trnL intron –
for biodiversity assessment of vascular plants and to examine community turnover in total belowground
vascular plant diversity. Based on the relative annotation, resolution and recovery ability of the DNA
markers, rbcL and ITS2 were recommended for future biodiversity assessments. Annual variability in
belowground diversity was consistent in magnitude with previous aboveground observations suggesting
that accumulation of plant tissues is not a major restriction for soil-based biodiversity assessments.
Finally, an interaction between DNA marker and observed community turnover was identified and
positively correlated with length of DNA marker.

iii
Contents
LIST OF TABLES ..................................................................................................................................................... IV
LIST OF FIGURES ..................................................................................................................................................... V
ACKNOWLEDGEMENTS ......................................................................................................................................... VI
GENERAL INTRODUCTION ...................................................................................................................................... 1
CHAPTER ONE - RELATIVE PERFORMANCE OF FOUR DNA MARKERS FOR SURVEYING VASCULAR PLANT DIVERSITY FROM SOIL ENVIRONMENTAL DNA ........................................................................................................................ 4
ABSTRACT ..................................................................................................................................................................... 4 INTRODUCTION .............................................................................................................................................................. 5 MATERIALS AND METHODS ............................................................................................................................................ 10
Study Site ............................................................................................................................................................ 10 In silico – Analysis of Database Sequences ......................................................................................................... 10 In situ – Analysis of Soil Cores ............................................................................................................................. 13
RESULTS ..................................................................................................................................................................... 17 In silico – Analysis of Database Sequences ......................................................................................................... 17 In situ – Analysis of Soil Cores ............................................................................................................................. 18
DISCUSSION ................................................................................................................................................................ 24 In silico – Analysis of Database Sequences ......................................................................................................... 24 In situ – Analysis of Soil Cores ............................................................................................................................. 29 Conclusions ......................................................................................................................................................... 34
TABLES AND FIGURES .................................................................................................................................................... 36
CHAPTER TWO – DNA METABARCODING ASSESSMENT OF TEMPORAL VARIABILITY IN BELOWGROUND PLANT DIVERSITY IN A DELTAIC WETLAND ...................................................................................................................... 42
ABSTRACT ................................................................................................................................................................... 42 INTRODUCTION ............................................................................................................................................................ 43
Hypotheses and Predictions ................................................................................................................................ 46 METHODS ................................................................................................................................................................... 46
Statistical Methods ............................................................................................................................................. 48 RESULTS ..................................................................................................................................................................... 50 DISCUSSION ................................................................................................................................................................ 54 FIGURES ..................................................................................................................................................................... 63
GENERAL CONCLUSIONS ...................................................................................................................................... 67
LITERATURE CITED ............................................................................................................................................... 70
APPENDIX A – METABARCODING METHODOLOGY .............................................................................................. 75
Sample Collection ................................................................................................................................................ 75 Subsampling ........................................................................................................................................................ 75 DNA Extraction .................................................................................................................................................... 75 PCR Amplification ................................................................................................................................................ 76 Library Preparation and Sequencing ................................................................................................................... 78 Sequence Processing ........................................................................................................................................... 79
APPENDIX B – DATABASE COVERAGE .................................................................................................................. 87
APPENDIX C – SEQUENCING PROCESSING OUTPUT .............................................................................................. 92
APPENDIX D – TAXONOMIC ASSIGNMENT DATA ............................................................................................... 100
APPENDIX E – STATISTICAL OUTPUT SUMMARY TABLES .................................................................................... 112

iv
List of Tables Chapter 1
Table 1 Database coverage by DNA marker 36
Table 2 Total numbers of taxa observed across the four PAD sites 37
Appendix A
Table 3 Primer sequences and expected amplicon sizes 82
Table 4 Optimized PCR conditions used for first round amplification 83
Table 5 Thermocycler programs 84
Table 6 Optimized PCR conditions for amplification with Illumina tailed primers 85
Table 7 Search criteria used to build reference databases 86
Appendix B
Table 8 List of previously observed taxa and associated sequence database coverage 87
Appendix C
Table 9 Sequence processing and filtering output for the OTU pipeline 92
Table 10 Sequencing processing and filtering output for the taxonomy pipeline 96
Appendix D
Table 11 Taxonomic assignments passing all filters at order, family and genus levels 100
Appendix E
Table 12 Statistical test output for nearest neighbour distance comparison 112
Table 13 Statistical test output for comparison of DNA marker sequence recovery 113
Table 14 Statistical test output for comparison of DNA marker taxonomic resolution 115
Table 15 Statistical test output for comparisons of variability across replicate soil 116
Table 16 Statistical test output for comparison of pooled soil core richness among DNA markers 119
Table 17 Variation component analysis of vascular plant diversity 120
Table 18 Statistical test output for comparison of composition estimates at the site level 121
Table 19 Statistical test output for comparison of belowground and aboveground richness 122
Table 20 Statistical test output for comparison of temporal variability in richness 124
Table 21 Statistical output for linear mixed effects models for CV and DNA marker length 125
Table 22 Statistical test output for comparison of temporal simple beta diversity 126
Table 23 Statistical output for linear mixed effects models for simple beta diversity and DNA marker length 127
Table 24 Statistical test output for comparison of temporal multivariate dispersion 128
Table 25 Statistical output for linear mixed effects models for multivariate dispersion and DNA marker length 129
v
List of Figures Chapter 1
Figure 1 Accuracy of taxonomic assignments of known sequences 38
Figure 2 Sequence recovery using the BLAST taxonomy or OTU approaches 39
Figure 3 Taxonomic resolution of assignments for recovered sequences 40
Figure 4 Heat map of observations of genera belonging to vascular plant orders 41
Chapter 2
Figure 5 Comparison of aboveground and belowground vascular plant richness 63
Figure 6 Annual variability in vascular plant richness and composition 64
Figure 7 Temporal variability in belowground vascular plant richness and composition versus length of DNA fragment used in each assessment 65
Figure 8 Ratio of among year variability in belowground vascular plant diversity to average within year variability among soil cores 66
vi
Acknowledgements There are many individuals to acknowledge and thank for the past three years in Guelph. To
those that have helped me with my research and, of equal importance, those who have been my support group outside of the lab:
I could not have done it without you.
To my advisor, Mehrdad, thank you for the chance to develop my own research ideas for this project as well as the opportunities to explore new technologies and travel to multiple conferences. Thank you to the other members of my advisory committee, Tom Hsiang and Brian Husband, for your helpful advice and feedback on my research proposal through to this final thesis. And of course, a big thank you to all members of the Hajibabaei lab, past and present. You taught me invaluable technical and analytical skills and were always available for insightful, intellectual discussions. I must specifically thank Shadi Shokralla because without him, there would have been no sequences for me to analyze. Thank you as well to Donald Baird and the other members of the Biomonitoring 2.0 team for establishing the framework for my project, collecting the soil samples, and providing me with Environment Canada and Parks Canada data.
Friends from Guelph – Andrew Kohlenberg, Mike Wright, Anne Chambers, Kayla Deasley,
Morgan Randall, Jose Maloles, Katie Hotke, Meaghan Luis, Glynis Perrett, and so many more – you kept me sane! Helping to form the IB Graduate Student Council was one of my favourite experiences and I am grateful to all the dedicated grad students that were a part of that initiative. I am also proud to have been a volunteer with Let’s Talk Science. There’s no better exercise in scientific communication than trying to explain your research to grade three students! Finally, thank you to my mom, dad, and brother for your never-ending support, whether it was moving assistance or sending me home with leftovers.
I have learned so much in this time, most of which you will not even see in this thesis, but I know the knowledge, skills, and experiences I have gained here will lead me to new and exciting opportunities.

1
General Introduction
Global change and biodiversity loss are increasingly the focus of scientific research and drawing
international attention (1, 2). Notably, the United Nations have declared this the Decade on Biodiversity
in support of the Convention on Biological Diversity. With increased global change, there is an increased
urgency to monitor ecosystem trends because the goods and services provided by ecosystems depend
on maintenance of ecosystem properties (2, 3). Changes in these properties or functions, such as rates
of nutrient cycling and primary production, have in turn been linked with changes in biodiversity (2, 4).
Thus we can evaluate ecosystem responses to various anthropogenic stressors by monitoring changes in
biodiversity at a site over time – referred to as “biomonitoring” (5-7). For this approach to be successful,
however, there needs to be efficient characterization and measurement of biodiversity within sites.
Biodiversity assessments conventionally rely on morphological identifications of a few target
groups of species which can be labour intensive and require taxonomic expertise (5, 8, 9). The
introduction of DNA barcoding whereby a standardized region of the genome is sequenced and
compared against a reference database in order to identify specimens means that any organism can
potentially be identified by a non-expert (10). Standard DNA barcoding can be applied across all
taxonomic groups, but still depends on collecting individual specimens. Recent advances in sequencing
technology have led to the development of environmental DNA barcoding or DNA metabarcoding in
which unsorted environmental samples like soil, water, or benthos can be directly sequenced. Using
taxonomically broad primers for a few loci, DNA metabarcoding is able to describe whole communities
from these environmental samples, often in absence of intact specimens (5, 9, 11, 12). This approach
has the potential to transform biodiversity assessments by increasing the scale, scope, and efficiency of
surveys (5, 9, 12). In other words, more biodiversity information can be recovered for more sites in a
timely manner. High throughput sequencing of environmental samples has been used extensively to

2
study microbiomes (e.g. 13) but studies of animal (9, 12) and plant diversity (8) are starting to be
conducted using this approach.
In this thesis, I investigate DNA metabarcoding of soil for biodiversity assessment of plants in a
wetland study system. Wetland ecosystems are important targets of monitoring initiatives because they
play essential roles in carbon sequestration, reduction in flood risk, water quality improvement, and
maintenance of food webs (14). Within wetlands, plants are a focal monitoring group and multiple
indices to describe the integrity or quality of wetland sites are based on plant composition (15, 16).
Unlike standard vegetation surveys, DNA metabarcoding is not limited to the subset of plant diversity
actively growing aboveground at the time of the assessment with identifiable morphological features
(17-19). Seeds, pollen, dormant roots or rhizomes, and detritus are all potential sources of DNA in the
soil that can be identified (8, 18, 20). DNA metabarcoding theoretically captures total plant diversity at a
site from a single survey and has the capacity to improve assessment of plant communities in wetlands
and other ecosystems.
The research presented here addresses two major knowledge gaps associated with DNA
metabarcoding of plants for biodiversity assessments. First, there is no current consensus regarding
which DNA markers are best suited to DNA metabarcoding of plants. Two chloroplast genes, rbcL and
matK, were selected as the official DNA barcode for plants based on Sanger sequencing of individual
specimens (21) but due to differences in sequencing platforms and requirements of environmental
samples, other DNA markers continue to be used for DNA metabarcoding (8, 22). In the first chapter,
four established plant DNA markers are compared to determine which are best suited to biodiversity
assessment through DNA metabarcoding. Secondly, by using soil samples for assessments, there is a
shift in focus from aboveground plant diversity to belowground diversity. Since biomonitoring depends
on identifying changes in biodiversity at a site over time, it is necessary to understand how community
turnover dynamics belowground may differ from aboveground dynamics. As well, since short DNA

3
fragments are known to persist for long periods of time from studies of ancient DNA (23, 24), it is
important to determine if differences in DNA marker traits such as length can influence the observation
of temporal changes. The second chapter of this thesis is a preliminary investigation of temporal
variability in belowground plant diversity and the potential interactions between DNA marker and
resolution of short term changes. This research will contribute to development of improved biodiversity
detection that is applicable to a wide range of ecological studies and biomonitoring programs.
Additionally, this work will provide new data on the study site – the Peace-Athabasca Delta – which is
both a Ramsar wetland of international importance and a UNESCO World Heritage Site.

4
Chapter One - Relative performance of four DNA markers for surveying vascular plant diversity from soil environmental DNA
Abstract
Biomonitoring programs depend on the availability of accurate and efficient biodiversity
assessments. To increase both scale and scope of assessments, methods are moving away from
identification of individual specimens and instead processing unsorted environmental samples through
DNA metabarcoding. For plants, environmental DNA (eDNA) extracted from soil samples potentially
includes taxa represented by active and dormant tissues, seeds, pollen, and detritus but it is not clear
which DNA markers are best used for DNA metabarcoding to capture this diversity. Four established
DNA markers (matK, rbcL, ITS2, and the P6 loop of the trnL intron) were evaluated for their effectiveness
in DNA metabarcoding based on rates of sequence recovery, annotation, and sequence resolution
among taxa. Evaluations were completed both in silico and with 35 soil samples collected from four
wetland sites in Wood Buffalo National Park in Alberta through the Biomonitoring 2.0 project
(www.biomonitoring2.org). DNA marker matK had the lowest recovery, both in terms of number of
sequences per sample and taxonomic breadth. Both rbcL and trnL showed high taxonomic breadth but
trnL displayed the least taxonomic resolution of sequences resulting from a combination of low
sequence divergence and annotation difficulties. Additionally, of the four markers, the trnL intron P6
loop showed the least similarity in vascular plant genus composition at the sites. As well, while ITS2,
trnL, and rbcL had comparable sequence recovery, ITS2 demonstrated the greatest taxonomic resolution
and annotation. Based on the criteria tested in this framework, rbcL and ITS2 are recommended for DNA
metabarcoding of vascular plants from eDNA.

5
Introduction
Ecological biomonitoring identifies changes in biological diversity over time and space in order
to infer ecosystem trends in response to stressors. This ecosystem monitoring approach therefore relies
on the availability of accurate and efficient biodiversity assessments (5-7). Conventional methods for
plant diversity assessment involve aboveground surveys which can only assess the existing plant growth
along transects or in quadrats being observed (18, 19). Typically plants are identified using morphology
but this limits taxonomic resolution in cases of new shoots or in absence of flowers or other diagnostic
features (17). Low taxonomic precision, however, limits the power to detect correlations with
environmental variables or stressors and restricting studies to a few taxonomic groups can lead to
autocorrelation due to shared evolutionary history of closely related taxa (5). Ideally, all taxa should be
identified to obtain the most information on biodiversity for sites being monitored, and molecular
methods such as DNA barcoding are increasingly being used to help alleviate bottlenecks in taxonomic
identification of specimens (25).
Standard DNA barcoding – taxonomic identification of a specimen by characterizing a
standardized genomic region and comparing it against a reference database of known sequences – can
improve taxonomic resolution but still requires collection of individual specimens (26). Even if all taxa
are identified to species-level through either morphology or DNA, aboveground vegetation surveys fail
to observe ephemeral plants that have already finished their short growth cycles or not yet begun.
Similarly, other types of dormant plant life are also missed (18, 27). In order to capture total vegetation
diversity in this way, surveys may be required a few times throughout the growing season over multiple
years.
More recently plant surveys have begun to look at belowground diversity which includes both
active and dormant taxa. Roots and rhizomes are nearly impossible to identify from morphology but
DNA-based methods make taxonomic identification feasible (18). Plants are also represented

6
belowground by the collection of viable seeds known as the seed bank and these seeds can either be
germinated for morphological identification or identified through DNA-based methods. While the seed
bank may contain plant species not seen aboveground, as many as two-thirds of the aboveground
species may be absent from the seed bank (28). Both of these belowground surveys require tedious
excavation or separation of plant tissues from the soil substrate making them unsuitable for largescale
biodiversity assessments.
Preliminary work and proof of concept studies have shown the potential for environmental DNA
barcoding, also referred to as DNA metabarcoding, to increase the efficiency and scale of biomonitoring
initiatives (5, 7, 9, 11, 12). Instead of collecting, sorting, and identifying individual specimens,
environmental DNA (eDNA) is extracted directly from bulk samples such as soil or benthos and DNA
barcodes are obtained using taxonomically broad primers and next-generation sequencing platforms.
While preliminary studies have focused largely on benthic invertebrates, vascular plants are a key group
and important in wetland monitoring (e.g. 29). This is because vascular plants are the main terrestrial
primary producers, associated with carbon cycling and hydrological regimes, and are correlated with
diversity in other groups such as herbivores and pollinators (1, 30).
Unlike conventional aboveground surveys that only capture a snapshot of plant diversity
growing at the time of the survey, eDNA extracted from soil samples can come from active and dormant
plant tissues, seeds, pollen and plant detritus (8, 18, 20). eDNA provides not only an integrated view of
total plant diversity, but also may supplant the need for separate seedbank surveys or additional
aboveground surveys. The study by Yoccoz, et al. (8) was the first to make use of this technique for
assessing current plant biodiversity from soil eDNA. They were able to detect plant diversity consistent
with aboveground surveys in temperate, boreal, and tropical systems using a single DNA marker region.
Exactly which DNA marker regions are best used for environmental DNA barcoding of plants, however,
remains an area of contention.

7
Establishing a standard DNA barcode for plant species has proven difficult because plants tend
to have less sequence divergence between species than animals either due to slower rates of evolution
or a prevalence of incomplete sorting of ancestral polymorphisms and gene exchange (31). Previous
methods of selecting DNA barcoding regions focused on generating barcodes from individual specimens
using Sanger sequencing (32-34). The chloroplast genes rbcL and matK were chosen as the official two-
locus plant DNA barcode by the Consortium for the Barcode of Life (CBOL) Plant Working Group in 2009
based on the criteria of universality (taxonomic breadth), sequence quality and coverage of bidirectional
Sanger reads, and species discrimination power (21). Of these two DNA markers, rbcL was found to have
the highest universality and sequence quality but weaker species discrimination while matK had good
species discrimination but lower sequence quality and reduced PCR success (possibly due to lack of
appropriate PCR primers) with seedless plants (21). These findings were further confirmed by a study
conducted in 2011 by the China Plant Barcode of Life (BOL) Group which employed a much greater
sample size (34).
Despite the selection of matK and rbcL by the CBOL Plant Working Group, several other DNA
regions continue to be used for plant identification (21). This includes the chloroplast trnL (UAA) intron
as well as the nuclear ribosomal internal transcribed spacer (ITS), both of which are non-coding (e.g. 8,
35). Nuclear ribosomal ITS, which is currently used for DNA barcoding of fungi, is proposed for improved
species resolution of plants (21, 36, 37). ITS is located between nuclear 18S and 28S ribosomal RNA
genes and consists of two regions, ITS1 and ITS2, separated by the 5.8S ribosomal RNA gene. Eukaryotic
genomes can have hundreds of copies of this cistron with an average of 35 variants per species (37). The
study conducted in 2011 by the China Plant BOL Group (36) demonstrated that ITS together with a
plastid DNA marker can identify 69.9-79.1% of species in a sample of over 1700 plant species while matK
and rbcL only discriminated approximately 50% of the species. Potential difficulties involved with using
ITS include the risk of fungal contamination due to very high sequence conservation in primer binding

8
regions, overestimation of operational taxonomic units (OTUs) due to sequence differences among
paralogs, and reduced amplification and sequencing success (34). Unlike plastid DNA markers that are
strictly maternally inherited, nuclear DNA markers like ITS can be amplified from pollen (34).
The trnL intron is being promoted as a plant DNA marker that can be used with highly degraded
samples, particularly if only the smaller P6 loop of the intron (10-143 bp) is targeted (32). The whole
intron (254-767 bp) was shown to identify 67.3% of the 706 species that had available reference
sequences on GenBank, but when using just the P6 loop, only 19.5% of the 11404 species with available
reference sequences on GenBank could be identified to species level (32). This locus is known to have
difficulty discriminating species in the families Poaceae, Cyperaceae, and Asteraceae (18) but when
searched on a database of only the local flora, the P6 loop provides up to 50% species resolution (38,
39). For example, 47.2% of 106 species from an Arctic plant collection were successfully identified with
the P6 loop (32).
Here, I evaluate the utility of these four established DNA markers (matK, rbcL, ITS2, and P6 loop
of the trnL intron) for DNA metabarcoding to determine the suitability of these DNA markers for
biodiversity assessments of vascular plants from bulk samples. I argue that the relative performance of
the four DNA markers and evaluation criteria for DNA metabarcoding are distinct from standard single-
specimen DNA barcoding because we are working with presumably degraded, mixed templates
representing an unknown number of taxa (40). Additionally, in mixed template eDNA analysis, multiple
sequences from each specimen cannot be used to generate a concatenated data matrix as in molecular
phylogenetic analysis from single specimens (e.g. 41). The community profile or taxonomic composition
observed at a site from eDNA is based on the culmination of three factors: sequence recovery, sequence
resolution among taxa, and annotation. In other words, are sequences of sufficient quality and length
recovered for all taxa present at a site? Is there enough molecular divergence at the locus to distinguish
taxa from one another? And what taxonomic information can be annotated to a sequence?
9
Recovery might differ among DNA markers during amplification, sequencing, and sequence
filtering stages. Drop-out of sequences from any particular taxa during these stages would result in false
negatives whereas retention of non-target sequences or sequences with errors may lead to false
positives (40). Previous comparisons of DNA markers for metabarcoding have focused on how PCR bias
and primer specificity to target groups influence recovery (22, 42, 43) but a comprehensive evaluation
must also consider how all stages of sequence generation and processing influence the recovered plant
diversity. Selection of loci with sufficient levels of sequence divergence among taxa to allow for
discrimination or delineation of taxa is important to both standard DNA barcoding and metabarcoding
(22, 42, 43). With low sequence diversity among plant taxa, two species may have identical sequences at
one locus and be counted as one molecular operational taxonomic unit (OTU) but show divergence at
another locus and be resolved as two separate OTUs. Lastly, reference database coverage and quality
may vary between DNA markers thus taxonomic annotation is limited by which taxa are present in the
database for a particular DNA marker and prevalence of misidentified sequences (42, 44-46). Together
these factors explain why different DNA markers may report different plant communities for the same
sample.
Previous investigations in marker selection for DNA metabarcoding of plants emphasized in
silico approaches and only considered short (<200 bp) DNA fragments (22, 43). The goal of this study is
to recommend which DNA marker(s) to use to assess vascular plant diversity from bulk samples based
on a more comprehensive analysis. First, in silico tests with reference database sequences are
performed to evaluate annotation and sequence resolution when taxonomic identities are known.
Second, in situ tests with soil samples are used to compare sequence recovery, annotation, and taxon
resolution. Finally, I examine taxonomic breadth and overall complementarity of each DNA marker
resulting from cumulative differences in recovery, annotation, and resolution. DNA markers are rejected

10
for metabarcoding of vascular plants if they show significant or consistent underperformance across
these categories relative to the other DNA markers.
Materials and Methods
Study Site
Biomonitoring 2.0 (http://biomonitoring2.org) is a large-scale pilot project for eDNA-based
biomonitoring taking place in the Peace-Athabasca Delta (PAD) wetlands of Wood Buffalo National Park
in northern Alberta. Since vegetation at the study sites had been previously described, the soil samples
collected through this project provided an ideal opportunity to test the relative performance of the four
DNA markers on environmental samples representing natural communities. Four of eight PAD sites were
chosen based on the availability of soil cores and aboveground vegetation reference data. Sites PAD 03
and 04 are on the south, Athabasca River side of the delta and PAD 14 and 33 are on the north, Peace
River side of the delta. Surficial material in the delta consists of deltaic alluvial deposits and soils, which
are mainly silty with some clay, are considered characteristic of prairie wetland (47).
In silico – Analysis of Database Sequences
Annotation – Database Coverage
Reference sequence databases for each locus were downloaded from GenBank using the search
strings outlined in Appendix A without any geographic filtering. The total number of available sequences
for each locus and the number of vascular plant species represented by these sequences were recorded
to estimate overall database coverage. A sample of sequences for each locus were then downloaded
separately to measure database coverage of the local PAD assemblage as well as provide a subset of
sequences to measure the relative sequence diversity across loci. The local assemblage was based on a
list of vascular plant species previously observed in the Peace-Athabasca Delta region compiled from
aboveground survey data collected by Parks Canada from 1993-2008 (unpublished monitoring data) and
11
public data from the Alberta Biodiversity Monitoring Institute (accessed October 2013,
http://www.abmi.ca/). Proxy sequences were found for higher taxonomic groups for which no
sequences for target species were available. For example, if no rbcL sequences were available for the
target species in a genus, then a few sequences from any other species in the genus were downloaded
since it was assumed that sequences from within a genus are more similar to each other than sequences
from different genera.
Resolution – Nearest Neighbour Distances
Sequences representing the local assemblage were used to measure the relative sequence
diversity between species across the four loci. First, identical sequences were removed within each
species file using substring dereplication from Usearch version 5.2.32 (48) to reduce the number of
sequences being analyzed. Sequences were aligned to each other in MEGA version 6.06 (49) using the
built-in ClustalW and/or MUSCLE algorithms with default settings and then cropped to the target
amplicon region. Alignment of protein coding regions (matK and rbcL) was completed using the
translated amino acid sequences after identifying the appropriate reading frame for all sequences. Due
to the variable sizes of the non-coding regions and prevalence of indels, trnL intron and ITS2 alignments
were visually inspected to make sure the conserved primer binding sites were aligned. With ITS2 in
particular, MUSCLE could not find an appropriate global alignment for these highly variable sequences.
After using MUSCLE to make a preliminary alignment using stricter gap opening (-525) and gap
extending (-10) parameters, sequence regions between more conserved elements were aligned in
blocks and then manually adjusted if discrepancies in alignment of highly similar sequences were still
observed.
Due to sequencing length limitations of the Illumina MiSeq, the two longest DNA markers (rbcL
and matK) were not expected to have overlapping paired ends. Accordingly, a middle section of these
aligned sequences was removed to correspond with the minimum expected gap. For rbcL, the gap

12
corresponded with a 250 bp paired end sequencing kit while the gap for matK corresponded with a 300
bp paired end sequencing kit. This was done to ensure the sequences being compared were
representative of the expected MiSeq sequencing output for these loci.
Sequences were grouped by species and only those species with sequences for all four loci were
included in the analysis. Mean between group uncorrected pairwise distances (with pairwise deletions
for missing data) were calculated for each locus in order to assess sequence dissimilarity among species.
The distance to each species’ nearest neighbour (i.e. the minimum distance value) was then extracted
from the distance matrix for each locus. Significant differences in nearest neighbour distances (NNDs)
among DNA markers were identified using the Friedman test and post hoc Wilcoxon signed rank test in
R version 3.1.2 (50) to account for repeated NND measures for each species.
Annotation and Resolution – Taxonomic Assignment Accuracy
Relative accuracy of taxonomic assignments under ideal conditions – i.e. when an exact match
exists in the database – was measured for each locus. Correct assignments in this case are associated
with sequence resolution across the global database and the quality of the database entries. All of the
cropped reference sequences were searched using megaBLAST version 2.2.25 (51) against total available
GenBank sequences for the locus (see Appendix A for search strings used to build the reference
databases). The megaBLAST search for matK, rbcL, and ITS2 was run using the default word size of 28
and reported hits with a minimum 98 percent identity and E-value threshold of 10-20. These high
stringency match parameters were used previously in other environmental DNA barcoding studies (7, 9,
11). Due to the small size of the trnL P6 loop sequences, different megaBLAST parameters were
required for this DNA marker. It was determined that a word size of 12 and E-value threshold of 0.1 with
the minimum of 98 percent identity helped to maximize total number of sequence assignments while
minimizing incorrect assignments. Taxonomy was consolidated and reported for the hits tying for top
score with any conflicts reported as “ambiguous”. This taxonomy was compared against the known

13
taxonomy for each sequence to count the number of sequences assigned correctly, incorrectly, or
ambiguously at the order, family, genus, and species levels.
In situ – Analysis of Soil Cores
DNA Metabarcoding of Soil Samples
Three soil cores were collected from each of the four sites in August of 2011, 2012, and 2013
through the Biomonitoring 2.0 project with the exception of site PAD 14 for which only two cores were
collected in August of 2012. Soil core sets for these 12 sampling instances were collected within a 1 m2
area at each site to a depth of 10 cm after clearing surface debris and plant materials and frozen for
transportation and storage. The 35 thawed soil samples were subsampled into lysis tubes from
commercial soil extraction kits (UltraClean® Soil or PowerSoil® DNA Isolation kits (MO BIO Laboratories;
Carlsbad, California, USA)) and DNA was extracted following kit protocols with minor modifications.
Amplicons for the four loci were prepared for each of the 35 soil samples in two rounds of PCR
amplification. First round amplification used plant primers from the Canadian Centre for DNA Barcoding
protocols (http://www.ccdb.ca/resources.php) for matK, rbcL, and ITS2 and the Taberlet et al., 2007 (32)
g and h primers were chosen for amplification of the P6 loop of the trnL intron. Custom amplification
protocols developed for this project were followed and then amplicons were purified with the
MinElute® PCR Purification kit (QIAGEN; Toronto, Ontario, Canada) except for trnL amplicons which
were too small to purify. A second round of amplification was performed with Illumina-tailed primers
following custom protocols. These amplicons were also purified using the commercial kit.
Amplicons for the 35 samples and four loci were split over four sequencing runs on an Illumina
MiSeq and samples to be pooled in the same run were indexed through PCR with index primers
according to kit specifications. Indexed amplicons were quantified and then pooled and purified to form
the sequencing libraries. Additional samples from other projects were included to ensure similar
sequencing depth was applied to all samples. Sequencing was performed with either MiSeq Reagent v2

14
sequencing kits (all trnL amplicons and PAD 14 and PAD 33 rbcL amplicons) capable of producing 2 x 250
bp sequences or v3 sequencing kits (all matK and ITS2 amplicons and PAD 03 and PAD 04 rbcL
amplicons) capable of producing 2 x 300 bp sequences.
Raw sequences for non-overlapping rbcL and matK were quality filtered using PRINSEQ version
0.20.2 lite (52) and then paired ends were concatenated after reverse complementation of the reverse
read. Forward and reverse paired-end reads for the overlapping ITS2 and trnL sequences were first
paired using PANDASEQ version 2.7 (53) and then quality filtered using PRINSEQ. Good quality and
length sequences for the four loci were denoised and then clustered into OTUs at 98% similarity (or 95%
similarity for ITS2) and searched against available GenBank sequences using megaBLAST with low
stringency parameters (i.e. a minimum percent identity of 70% and E-value of 0.1) to determine if
sequences belonged to vascular plants. Alternatively, quality and length filtered sequences were
denoised and then searched against their respective reference databases using megaBLAST with high
stringency match criteria (described above) to retrieve taxonomy information for the BLAST taxonomy
pipeline. A minimum of 10 sequences had to be assigned to any taxonomic group or OTU within a
sample to count it as present and OTUs had to a have a minimum of 100 sequences assigned across all
samples to be included in analyses.
Molecular protocols, reaction conditions and all parameters used for sequence processing are
detailed in Appendix A. Soil chemical and physical data for the four sites are available for the 2011
samples on request but are not currently available for 2012 or 2013 samples. This is not expected to be
a limitation because, regardless of any variability in soil properties among samples, all DNA markers
were sequenced from the same DNA extracts for all soil cores.
Recovery– Sequence Output and Filtering
The numbers of sequences per sample were compared at multiple stages of processing.
Significant differences in sequence recovery among DNA markers were identified using a randomized

15
block ANOVA test with post-hoc Tukey’s test or Friedman rank sum test with post hoc Wilcoxon signed
rank test in R version 3.1.2 (50), treating soil sample as the blocking unit. DNA marker specificity was
assessed by comparing median numbers of sequences per sample assigned to groups other than
vascular plants (i.e. non-vascular plants, algae, or fungi).
Taxonomic Resolution of Recovered Vascular Plant Sequences
Taxonomic resolution of recovered sequences is limited by annotation – both database quality
and database coverage – and sequence resolution among taxa in the database. DNA marker differences
in taxonomic resolution were measured based on the proportion of sequences in each sample assigned
to vascular plant orders but then not assigned at the family, genus, and species levels. Friedman rank
sum tests blocked by soil sample were used to test for significant differences in proportions among DNA
markers.
Recovery – Variability among Soil Cores
Variability among sampling replicates was assessed for both richness and composition estimates
from the three soil cores taken within a 1 m2 area to determine if the DNA markers had different spatial
recovery patterns. Variability in richness was measured as the coefficient of variation (CV) which is the
standard deviation of the richness values divided by the mean richness. CV was calculated for each set
of three soil cores for each DNA marker. Variability in composition among cores was measured using
two estimates of beta diversity. Simple beta diversity was calculated by dividing total richness across
cores by the average richness of a single core (54). Second, beta diversity was also calculated from
Jaccard dissimilarities using the “betadisper” function in the vegan package (version 2.2-1) in R (55)
based on Anderson et al., 2006 (56). The “betadisper” function performed a Principal Coordinates
Analysis (PCoA) using the Jaccard dissimilarity matrices and identified spatial medians for each DNA
marker for each set of three soil cores. Average distance to PCoA medians (“multivariate dispersion”) for
soil core sets was then compared among DNA markers. The greater the variability in soil core plant

16
composition for that particular DNA marker, the greater the average dispersion. Statistically significant
differences in these metrics among DNA markers were identified using the ANOVA or Friedman rank
sum tests blocked by sampling instance.
DNA Marker Complementarity
First, total OTU richness across all sites and OTU richness within sites from pooled replicate soil
cores were compared among DNA markers because OTU richness depends on recovery and resolution of
sequences but not annotation. An ANOVA test blocked by sampling instance followed by a post hoc
Tukey’s test were conducted on the log transformed OTU counts for the pooled soil core data to identify
differences among DNA markers in OTU richness.
Next, taxonomic comparisons were done at the order, family, and genus levels. Again, overall
differences among DNA markers were compared by looking at patterns in richness, composition, and
taxonomic breadth after pooling the data from all 35 soil cores, i.e. gamma diversity. Then DNA marker
differences in richness and composition were assessed across pooled replicate soil cores. Significant
differences in mean richness among DNA markers were identified with ANOVA tests blocked by
sampling instance and post hoc Tukey’s tests. For composition, Jaccard dissimilarities were calculated
from the pooled soil core data representing 12 sets of soil cores and four composition estimates each.
Vascular plant compositional differences among DNA markers were identified using the adonis function
in the vegan package, version 2.2-1, in R (55) which performed PERMANOVA tests blocked by sampling
instance on the dissimilarity matrices. Sums of squares were used to partition the variation in Jaccard
dissimilarities attributable to DNA marker differences or differences among sampling instances. Lastly,
the compositional variability among DNA markers within individual sampling instances was also
calculated from the Jaccard dissimilarities using the vegan package “betadisper” function (55). This
function performed a PCoA on the Jaccard dissimilarities, identified spatial medians among the four DNA
marker composition estimates for each sampling instance, and measured the distance of each DNA

17
marker point from the median. Mean distances were compared among DNA markers using ANOVA tests
blocked by sampling instance and post hoc Tukey’s tests to identify if any DNA markers were
consistently more dissimilar in their composition estimates from the other DNA markers. All ANOVA
tests were performed in R version 3.1.2 (50).
Results
In silico – Analysis of Database Sequences
Annotation – Database Coverage
Sequence database coverage, summarized in Table 1, showed that ITS had the greatest number
of species, both total and vascular plants, represented in GenBank as well as the highest ratio of
sequences to species. The two DNA barcode loci, matK and rbcL, had the fewest total vascular plant
species represented on GenBank while the trnL intron had the lowest ratio of sequences to species. The
targeted list of previously recorded vascular plant taxa in the Peace-Athabasca Delta region included 28
orders, 51 families, 131 genera, and 238 species (see Appendix B). All loci had 94-100% coverage of
these orders, families, and genera but the trnL intron had only 69% coverage of target species compared
to 81-83% with the DNA barcode loci and ITS.
Resolution – Nearest Neighbour Distances
A sample of 115 of the previously recorded PAD species had reference sequences for all four
loci. Nearest neighbour distances (NNDs) at the species level were significantly different among DNA
markers (Friedman test, Χ2 = 114.49, df = 3, p < 0.0001). Compared to the other DNA markers ITS2 had
the greatest NNDs (Wilcoxon signed rank test, p ≤0.0001) with a median genetic distance of 0.070 (IQR:
0.032 - 0.194) nucleotide differences per site while rbcL had the smallest NNDs (p ≤0.04) with a median
distance of 0.010 (IQR: 0.003 - 0.026) differences per site. DNA markers matK and trnL had intermediate
18
NND with median distances of 0.018 (IQR: 0.007 - 0.055) and 0.022 (IQR: 0 - 0.078) differences per site,
respectively.
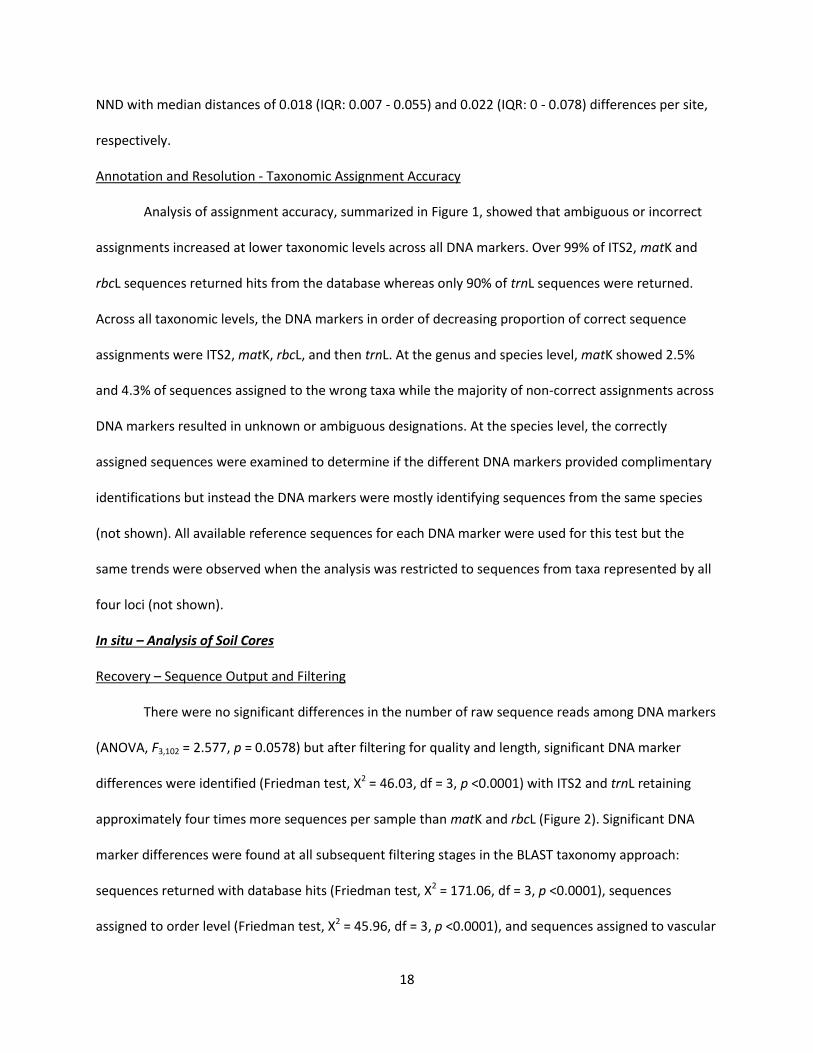
Annotation and Resolution - Taxonomic Assignment Accuracy
Analysis of assignment accuracy, summarized in Figure 1, showed that ambiguous or incorrect
assignments increased at lower taxonomic levels across all DNA markers. Over 99% of ITS2, matK and
rbcL sequences returned hits from the database whereas only 90% of trnL sequences were returned.
Across all taxonomic levels, the DNA markers in order of decreasing proportion of correct sequence
assignments were ITS2, matK, rbcL, and then trnL. At the genus and species level, matK showed 2.5%
and 4.3% of sequences assigned to the wrong taxa while the majority of non-correct assignments across
DNA markers resulted in unknown or ambiguous designations. At the species level, the correctly
assigned sequences were examined to determine if the different DNA markers provided complimentary
identifications but instead the DNA markers were mostly identifying sequences from the same species
(not shown). All available reference sequences for each DNA marker were used for this test but the
same trends were observed when the analysis was restricted to sequences from taxa represented by all
four loci (not shown).
In situ – Analysis of Soil Cores
Recovery – Sequence Output and Filtering
There were no significant differences in the number of raw sequence reads among DNA markers
(ANOVA, F3,102 = 2.577, p = 0.0578) but after filtering for quality and length, significant DNA marker
differences were identified (Friedman test, Χ2 = 46.03, df = 3, p <0.0001) with ITS2 and trnL retaining
approximately four times more sequences per sample than matK and rbcL (Figure 2). Significant DNA
marker differences were found at all subsequent filtering stages in the BLAST taxonomy approach:
sequences returned with database hits (Friedman test, Χ2 = 171.06, df = 3, p <0.0001), sequences
assigned to order level (Friedman test, Χ2 = 45.96, df = 3, p <0.0001), and sequences assigned to vascular

19
plant orders (Friedman test, Χ2 = 24.57, df = 3, p <0.0001) (Figure 2A). DNA marker matK had
significantly fewer sequences per sample returned with database hits compared to all other DNA
markers with a median of 3223 sequences (Wilcoxon signed rank test, p <0.0001). Likewise, matK had
the fewest sequences per sample assigned taxonomy at the minimum order level (p <0.0001) and the
least number of sequences assigned to vascular plant orders specifically (p ≤0.0003). There were
significantly more sequences per sample returning BLAST hits for trnL than rbcL and ITS2 (p ≤0.0005)
with median values of 166112, 58012, and 81650 respectively but these three DNA markers did not
show significant differences in sequence recovery once BLAST results were filtered to order level (p
≥0.069) and then to vascular plants (p ≥0.0940). After all filtering, there were medians of 11129, 3223,
41664, and 19944 sequences per sample assigned to vascular plant orders for ITS2, matK, rbcL, and trnL,
respectively.
Although no statistically significant differences were identified among ITS2, rbcL and trnL, ITS2
showed the greatest decrease in number of sequences per sample after filtering for sequences assigned
only to vascular plants. ITS2 primers amplified sequences from non-vascular plants (e.g. mosses), fungi
and algae. Fungal and algal ITS2 sequences were almost as prevalent as the target vascular plant ITS2
sequences with medians of 6138, 2027, and 11129 sequences per sample, respectively. Only the matK
primers were specific to strictly vascular plant DNA. The majority of sequences for trnL and rbcL
belonged to vascular plants but for every 10-15 vascular plant sequences there was approximately one
non-vascular plant sequence. A median of 75 algal sequences per sample were also present in the rbcL
data.
Following the OTU pipeline (Figure 2B), all DNA markers had significantly different numbers of
sequences per sample incorporated in OTUs (Friedman test, Χ2 = 74.01, df = 3, p <0.0001) with matK
having the least sequences (Wilcoxon signed rank test, p <0.0001), then rbcL (p ≤0.0002), ITS2 (p
≤0.0002), and trnL with the most (p <0.0001). This was reflected in the number of OTUs with 1220, 1442,
20
1781, and 2026 OTUs for matK, rbcL, ITS2, and trnL respectively. When these were queried against
GenBank, only 38% of matK OTUs had database matches compared with 77-91% of OTUs for other DNA
markers. There were still significant DNA marker differences after filtering for only vascular plant OTUs
(Friedman test, Χ2 = 61.53, df = 3, p <0.0001). DNA marker matK had significantly fewer sequences per
sample retained for analysis (Wilcoxon signed rank test, p ≤0.0022) with a median of 4082 sequences
while trnL had significantly more sequences retained than ITS2 and rbcL (p <0.0001) with medians of
181559, 20730, and 34617 sequences respectively. These sequences represented a total of 363, 1071,
176, and 834 OTUs belonging to vascular plants across all samples for matK, trnL, ITS2, and rbcL,
respectively. Numbers of sequences for individual samples after each stage of filtering are presented in
Appendix C.
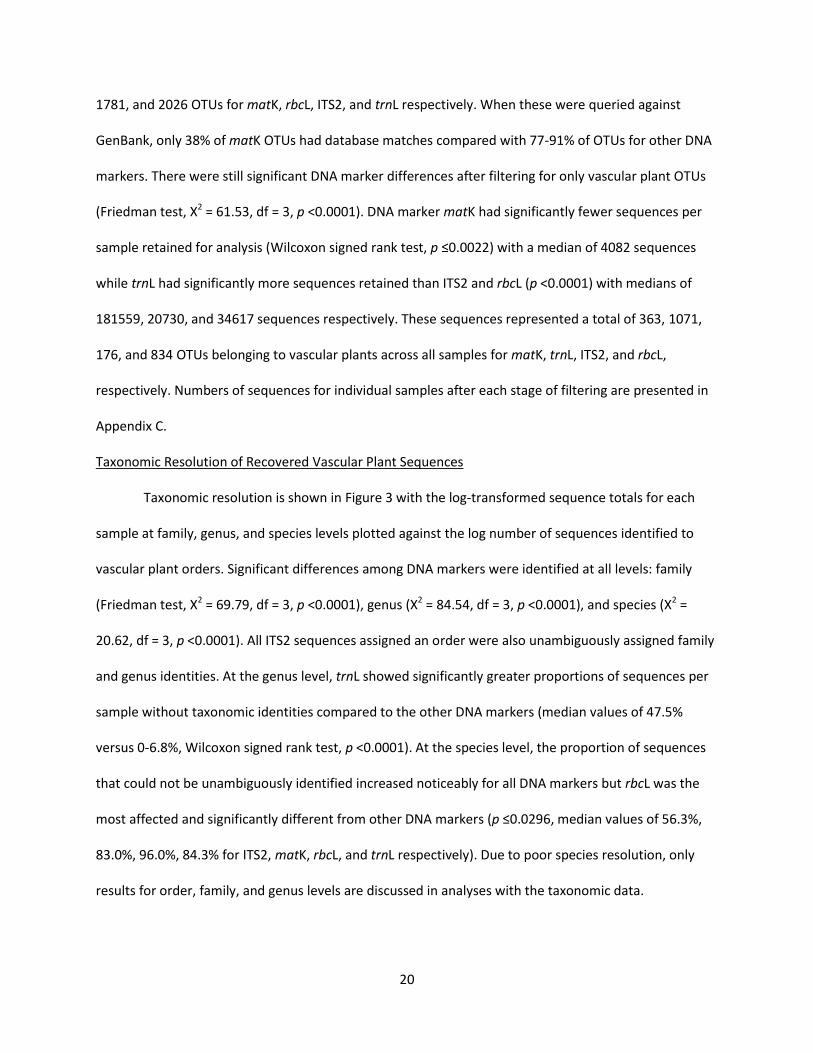
Taxonomic Resolution of Recovered Vascular Plant Sequences
Taxonomic resolution is shown in Figure 3 with the log-transformed sequence totals for each
sample at family, genus, and species levels plotted against the log number of sequences identified to
vascular plant orders. Significant differences among DNA markers were identified at all levels: family
(Friedman test, Χ2 = 69.79, df = 3, p <0.0001), genus (Χ2 = 84.54, df = 3, p <0.0001), and species (Χ2 =
20.62, df = 3, p <0.0001). All ITS2 sequences assigned an order were also unambiguously assigned family
and genus identities. At the genus level, trnL showed significantly greater proportions of sequences per
sample without taxonomic identities compared to the other DNA markers (median values of 47.5%
versus 0-6.8%, Wilcoxon signed rank test, p <0.0001). At the species level, the proportion of sequences
that could not be unambiguously identified increased noticeably for all DNA markers but rbcL was the
most affected and significantly different from other DNA markers (p ≤0.0296, median values of 56.3%,
83.0%, 96.0%, 84.3% for ITS2, matK, rbcL, and trnL respectively). Due to poor species resolution, only
results for order, family, and genus levels are discussed in analyses with the taxonomic data.

21
Recovery – Variability among Soil Cores
Mean richness coefficients of variation (CV) for sets of three soil cores were not significantly
different among DNA markers at order (ANOVA, F3,33 = 0.368, p = 0.78), family (F3,33 = 0.504, p = 0.68),
genus (F3,33 = 0.014, p = 0.998), or OTU levels (rank transformed, F3,33 = 3.092, p = 0.04 but no significant
results were found in the post hoc test). Overall mean CV across DNA markers was 0.36, 0.35, 0.37, and
0.39 at these levels, respectively. Likewise, there were no significant DNA marker differences in mean
simple beta diversity for sets of three soil cores at order (ANOVA, F3,33 = 0.603, p = 0.62), family (F3,33 =
0.694, p = 0.56), and genus (F3,33 = 1.678, p = 0.19) levels nor were there differences among DNA
markers in average multivariate dispersion of soil cores based on Jaccard dissimilarities at order
(ANOVA, F3,33 = 1.221, p = 0.32), family (F3,33 = 0.891, p = 0.46), or genus (F3,33 = 2.078, p = 0.12) levels.
Overall mean simple beta diversity across DNA markers was 1.57, 1.60, and 1.75 and mean multivariate
dispersion across DNA markers was 0.26, 0.27, and 0.30 at order, family, and genus levels, respectively.
The OTU approach, however, showed significant DNA marker differences in both simple beta diversity
(Friedman test, Χ2 = 18.6, df = 3, p = 0.0003) and multivariate dispersion (Friedman test, Χ2 = 15.1, df = 3,
p = 0.0017). Median simple beta diversity 2.36, 1.83, 1.86, and 1.77 and multivariate dispersion was
0.49, 0.36, 0.39, and 0.36 for matK, ITS2, rbcL, and trnL OTUs, respectively. In both cases, matK showed
significantly greater variability in vascular plant OTU composition among soil cores than the other three
DNA markers (Wilcoxon signed rank test, p ≤ 0.0244 and p ≤0.0342 respectively). Taxonomy recovered
for individual samples is presented in Appendix D but OTU data are only available on request due to size
of files.
DNA Marker Complementarity
As mentioned previously, in the absence of an attempt at full annotation (i.e. OTUs), a total of
363 matK OTUs, 834 rbcL OTUs, 176 ITS2 OTUs, and 1071 trnL OTUs belonging to vascular plants were
identified across all 35 soil samples. OTU richness estimates from pooled soil core replicates for each

22
sampling instance were significantly different among DNA markers (ANOVA, log transformed, F3,33 =
19.658, p <0.0001) with matK and ITS2 OTU richness significantly less than rbcL and trnL richness
(Tukey’s test, p ≤0.0026). Mean OTU richness for pooled soil cores was 39, 37, 133, and 217 for matK,
ITS2, rbcL, and trnL, respectively.
After the cumulative effects of recovery, resolution, and annotation following the BLAST
taxonomy analysis pipeline, a total of 36 orders, 63 families, and 142 genera were detected in the soil
samples across all four DNA markers. These are broken down by DNA marker and by whether the taxa
were on the list of previously recorded vascular plants in the area in Table 2. Taxa lists for ITS2 and matK
were highly overlapping with previous observations while rbcL and trnL had greater numbers of taxa not
observed in past vegetation surveys. The total compositional overlap, taxonomic breadth, and any
major taxonomic biases of the four DNA markers can be seen in Figure 4 in which a heat map shows the
total number of observations of any genera within a given vascular plant order across the 35 soil
samples. The orders were sorted according to previously established phylogenetic relationships to
highlight any DNA marker proficiencies or deficiencies with detecting specific groups. All orders
observed using matK were also observed with at least one other DNA marker and matK only detected
angiosperm groups. ITS2 was also highly overlapping with the other DNA markers because all orders
were also observed with other DNA markers except for one order (Cucurbitales), represented by a single
observation of a single genus. Only seed bearing vascular plants (Spermatophyta) were detected with
ITS2. The other two DNA markers, rbcL and trnL, both had observations of genera from multiple unique
orders and included both seed bearing and seedless vascular plant orders. In particular, only rbcL
reported observations of horsetails (Equisetales) and club mosses (Lycopodiales). Rosids showed similar
numbers of observations across all four DNA markers whereas Poales genera were more frequently
observed with rbcL and trnL. As well, trnL showed increased observations of Asterids and gymnosperms
while rbcL had the most observations of seedless vascular plant genera.

23
Mean pooled soil core richness estimated with rbcL or trnL was significantly greater than
estimates from matK or ITS2 across order (ANOVA, F3,33 = 18.035, p <0.0001), family (F3,33 = 15.606, p
<0.0001), and genus (F3,33 = 10.285, p <0.0001) levels (Tukey’s test, p ≤0.008). An average of 4.8, 5.7, 8.7,
or 10 orders, 5.2, 5.8, 10.1, or 11.7 families, and 6.7, 6.4, 15.3, or 13.3 genera were detected in each
sampling instance by matK, ITS2, rbcL, and trnL respectively. Pooled soil core composition was
significantly different between DNA markers at order (adonis PERMANOVA, F3,33 = 7.100, p = 0.005),
family (F3,33 = 5.543, p = 0.005), and genus (F3,33 = 3.732, p = 0.005) levels but differences among DNA
markers only accounted for 20.3%, 16.7%, and 20.0% of the variation in Jaccard dissimilarities whereas
sampling instance (site-year combinations) accounted for 48.4%, 50.1%, and 37.4% of the variation at
each of those levels, respectively. There were no significant differences among DNA markers in mean
distances to sampling instance spatial median in the PCoAs at order (ANOVA, F3,33 = 0.184, p = 0.91) or
family (F3,33 = 2.375, p = 0.088) level. At the genus level, however, significant DNA marker differences
were identified (F3,33 = 15.280, p <0.0001). Mean PCoA distance for trnL was significantly greater than
mean ITS2 (Tukey’s test, p = 0.0001) and matK (p <0.0001) distances. DNA marker rbcL also had a
significantly greater mean distance to PCoA spatial median for each sampling instance compared to
matK (p = 0.0036) at the genus level but the mean distance for rbcL was not significantly different from
ITS2 and trnL distances. Greater distances suggest greater dissimilarity in vascular plant composition
reported by these DNA markers.
All statistical test output for this chapter is summarized in Tables 12-18 in Appendix E.

24
Discussion
In silico – Analysis of Database Sequences
Annotation – Database Coverage
As highlighted by Nilsson and colleagues (44), taxonomic identifications through DNA barcoding
rely on database completeness for the group of interest and whether the entries are both correct and
informative. Investigation of database completeness on Genbank revealed that total number of species
in the database for each locus was not indicative of which DNA markers had greater database coverage
within the local assemblage. While ITS had the highest coverage overall, matK and rbcL had
approximately equal coverage to ITS for the local PAD taxa. And while trnL showed second highest total
species coverage in GenBank, this locus had the lowest local species coverage. This suggests that
reference database completion for individual monitoring regions may be an important consideration
prior to implementation of eDNA-based surveys.
Since the local assemblage is not equally represented across loci in GenBank, these gaps in
annotation limit the ability of each locus to return complete and accurate taxonomic identifications for
the missing taxa regardless of sequence resolution and recovery (45). For example, there was no
reference sequence available for Sagittaria cuneata for any of the four DNA marker regions. Even if this
plant species was present at the sites and its DNA sequences were recovered from soil samples, it was
not possible to identify the species. Nine of the 238 taxa previously recorded in the PAD region lacked
reference sequences for all four DNA markers and thus could not have been identified in the soil
samples. An additional 13 species were only represented in the database by one of the four loci which
means that those species could have only been correctly identified if recovered and resolved by that
particular DNA marker. While taxonomy-free OTU approaches can be used to measure the diversity
represented at a site by a single DNA marker and avoid the limitations of annotation (45),
metabarcoding information from multiple loci can only be pooled if sequences can be taxonomically
25
identified. As well, taxonomic information connects to existing monitoring data on plants. This allows
established monitoring indices such as the florist quality index (e.g. 15) to be applied, making it easier to
integrate this approach with current monitoring practices. Assembling complete reference libraries for
the local communities being monitored continues to be essential in order to link data to current
standard practices and avoid potential false negatives.
In this particular species assemblage, trnL had distinctly more total database gaps than the other
three loci. Database coverage, however, was essentially complete across the four loci for the previously
recorded taxa that were subsequently observed in situ by at least one of the DNA markers (Table 2)
suggesting that database gaps were not the main limitation for any particular DNA marker for the in situ
analysis of soil eDNA. Instead, this indicates that DNA marker differences observed in the analysis of soil
samples were likely due to differences in overall database quality, sequence recovery, or sequence
resolution.
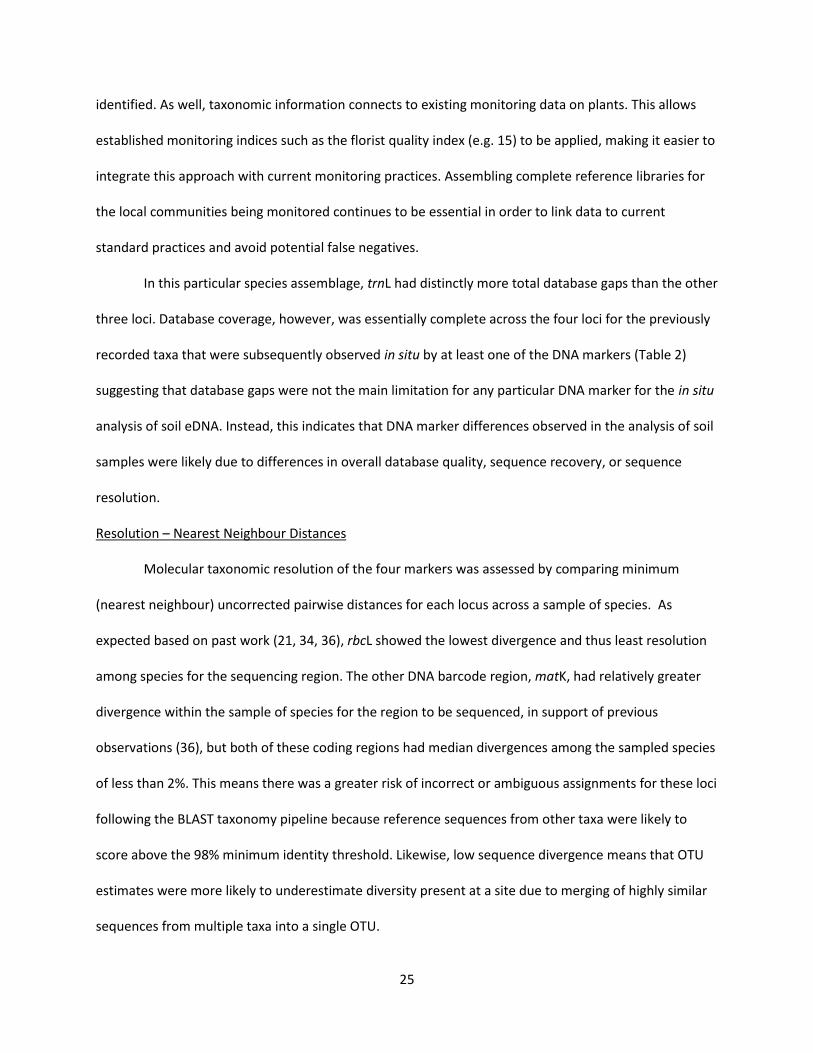
Resolution – Nearest Neighbour Distances
Molecular taxonomic resolution of the four markers was assessed by comparing minimum
(nearest neighbour) uncorrected pairwise distances for each locus across a sample of species. As
expected based on past work (21, 34, 36), rbcL showed the lowest divergence and thus least resolution
among species for the sequencing region. The other DNA barcode region, matK, had relatively greater
divergence within the sample of species for the region to be sequenced, in support of previous
observations (36), but both of these coding regions had median divergences among the sampled species
of less than 2%. This means there was a greater risk of incorrect or ambiguous assignments for these loci
following the BLAST taxonomy pipeline because reference sequences from other taxa were likely to
score above the 98% minimum identity threshold. Likewise, low sequence divergence means that OTU
estimates were more likely to underestimate diversity present at a site due to merging of highly similar
sequences from multiple taxa into a single OTU.

26
The trnL intron P6 loop showed greater NNDs than matK or rbcL among the sampled species but
NND was also more variable and some species showed no sequence divergence at this locus. This
variability suggests that some groups of taxa may be more prone to poor sequence resolution and
incorrect assignments than others with this locus. Past research using the full trnL intron highlighted a
prevalence of low sequence divergence among genera and species within three particular families –
Poaceae, Asteraceae, and Cyperaceae – which supports this observation (18). It is interesting that this
was observed with both the full length trnL intron and the much smaller P6 loop because it means
increasing the number of nucleotides sampled at this locus does not improve resolution for these three
families.
As anticipated from past research (36), ITS2 showed the greatest sequence resolution of the
four DNA markers among the sampled species, consistently above the 2% threshold in the sampled taxa.
Consequently, false positives or ambiguous matches were not expected to occur as frequently when
searching GenBank to assign taxonomy for this locus. Likewise, greater sequence resolution among
species meant that species were more likely to be identified as distinct OTUs even if taxonomic
annotation was unavailable. Both the trnL intron and ITS2 are non-coding and the prevalence of indels in
addition to base changes in these regions could explain the increased resolution relative to the longer
sequences from coding regions (57). All three chloroplast loci had NND values of zero or close to zero for
a quarter of the species sampled and often it was the same species that lacked resolution across the
three loci. This relates to the plateau at 70% species resolution described by Fazekas et al. in 2009 (31)
where inclusion of additional plastid loci did not resolve more species. Differences in plastid versus
nuclear dynamics may therefore underlie differences in species discrimination of the four loci (31) and
mean that a nuclear locus is needed to increase resolution for biodiversity assessments.

27
Annotation and Resolution – Taxonomic Assignment Accuracy
The assignment accuracy test used here looked at the “best case” scenario: when an exact
sequence match exists in the database for the correct species. The results, therefore, depended on the
state of the database at the time of the test including both coverage and quality of database entries,
presence of sequence divergence among taxa at the locus, and to a lesser extent, recovery ability of the
database search and taxonomic assignment method. Recovery with this methodology affected trnL the
most because approximately 10% of trnL intron P6 loop sequences did not return with matches from the
database. This was likely due to the small size (as low as 10 bp) of the intron region for some taxa.
Despite modifications to the word size and E-value parameters used with trnL sequences, very short
sequences like the 11 bp sequence found in horsetails (Equisetum spp.) were never returned from the
automated pipeline. Due to the variable length of the intron, some previous studies that used this DNA
marker did not have this difficulty because all sequences were over 20 bp in length (e.g. 39). As well,
some studies with this DNA marker used alternative software to search the reference database and
assign taxonomy (e.g. 8) and it is possible that other search algorithms perform better with very short
DNA fragments but this would need to be tested.
Ambiguity increased for all loci at lower taxonomic levels. This indicated equally scoring top
database matches with conflicting taxonomy due to a lack of sequence divergence or database quality.
As discussed above, plants are already known to have low levels of sequence divergence (31) and the
three plastid loci in this study frequently showed <2% sequence divergence between nearest neighbours
in the local assemblage so many cases of ties for top matches are expected. Database reliability has not
been explicitly tested for plants but the study by Nilsson and colleagues (44) found that 10-21% of
sequence entries for fungal ITS had unsatisfactory taxonomic annotation. Queries of ITS reference
sequences back against the database resulted in a fifth of sequences with the top hit belonging to a
different species and in 8% of their searches the correct match was found in the top hits but obscured

28
by insufficiently identified sequences (44). It is reasonable to expect that these same database quality
issues affected the plant reference sequences as well. During NND analysis, at least two misidentified
database sequences for plants were noted that grouped with other sequences from a different species
with a similar common name (these were removed from the analysis) and examination of ambiguous
database matches revealed that some were the direct result of insufficiently identified sequences that
masked otherwise clear identifications.
Incorrect assignments were most prevalent for matK at genus and species levels. One possible
explanation for the increased errors is that the combination of high A/T content (80% ± 4% in the sample
of sequences used in this study to assess NND) and central gap generated in sequence data (created to
reflect non-overlapping paired ends) meant that slight shifts in the alignment led to higher scores with
sequences belonging to other taxa. Overall, these results suggest that across taxonomic levels, ITS2
provides the most correct taxonomic identifications, followed by matK, rbcL, and then trnL when exact
matches are available in the database.
In addition to database coverage and sequence divergence among species, other factors come
into play if considering how unknown sequences will behave when queried against the database. The
amount of sequence variability at a locus within a particular species, the degree to which this variability
has been sampled, and the percent identity threshold required to consider a match affect whether an
accurate, unambiguous match will be found (44, 45). When there is low sequence divergence among
taxa, as seen with matK, rbcL, and trnL, an ambiguous designation might occur even when the correct
taxon is present leading to a false negative. Or, alternatively if the correct taxon is absent from the
database or there is poorly sampled intraspecific variability, the sequence might be assigned to an
incorrect taxon. With greater sequence divergence such as with ITS2, more sequences may not return a
match within the given identity threshold when there is inadequate population or geographic sampling
(or genomic sampling in the case of ITS paralogs) in the database (34, 37, 44, 45). Ambiguity or absence

29
of a match above the required threshold result in those sequences being excluded from the taxonomic
analysis. This highlights the importance of the taxonomy-free OTU approach for identifying discrete
biological entities that are present at sites and may have meaningful ecological roles but are absent
from reference databases or cannot be unambiguously identified (45). It also explains why sequence
recovery in the OTU pipeline is expected to always equal or exceed the number of usable sequences in
the BLAST taxonomy approach.
In situ – Analysis of Soil Cores
Recovery – Sequence Output and Filtering
Numbers of raw sequences recovered per sample were not statistically different across loci;
therefore, the subsequent DNA marker differences in recovery were likely the result of differences in
quality, taxonomic resolution and specificity of reads rather than sequencing depth. Non-overlapping
paired-end reads (i.e. matK and rbcL) showed a significantly greater drop in sequences than overlapping
paired end reads (i.e. trnL and ITS2) following quality and length filtering. Sequence quality always
declines towards the 3’ end of a read and the longer amplicons do not have the added support from
combining the information in overlapping regions to counteract this decline (53).
At both high stringency (taxonomy approach) and low stringency (OTU approach) search
parameters, matK had the fewest sequences returned with database matches. It is likely that the
majority of matK sequences, even though they were high quality, represented sequencing or PCR
artifacts such as non-specific amplification. Poor PCR success has been previously noted for matK with
standard DNA barcoding approaches (58) and continues to be an important concern for DNA
metabarcoding. The remaining matK sequences showed the greatest specificity towards vascular plants.
This suggests that matK recovery was limited by current molecular technology and methods. Contrary to
matK, the majority of rbcL sequences that passed quality filters were returned from the database search
and subsequently retained for taxonomic analysis or OTU analysis. Samples tended to be dominated by
30
the targeted vascular plant sequences even though non-vascular plant and algal sequences were also
present.
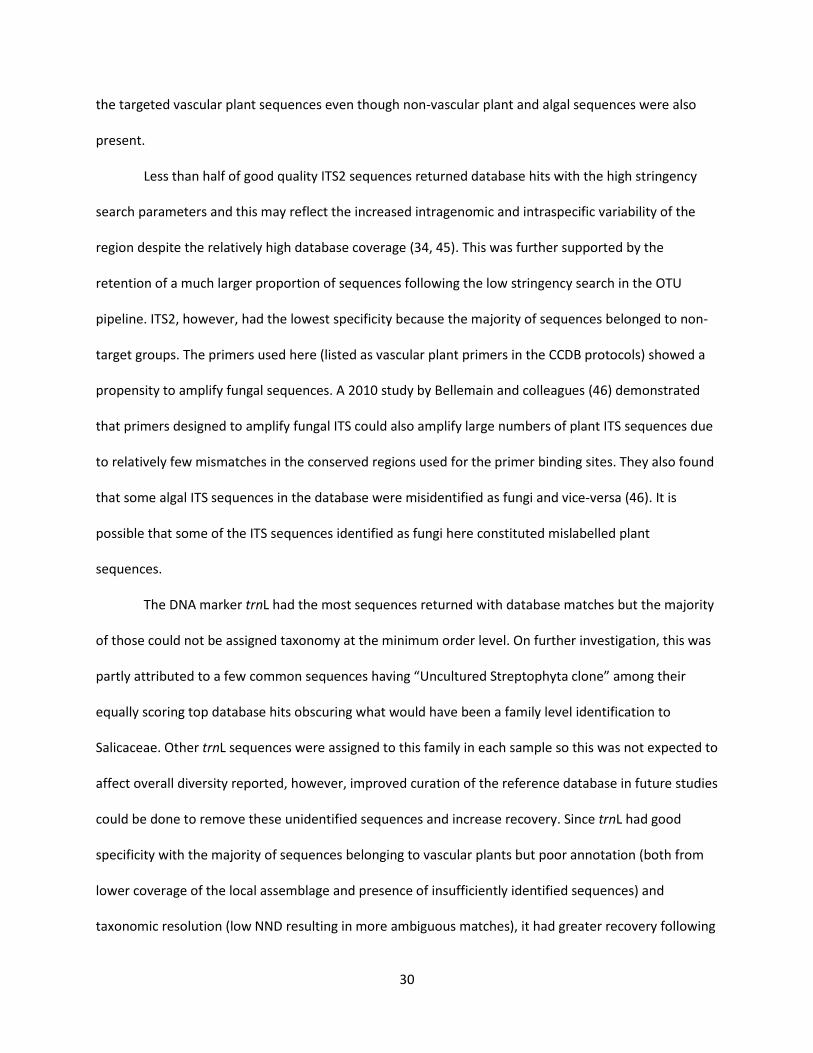
Less than half of good quality ITS2 sequences returned database hits with the high stringency
search parameters and this may reflect the increased intragenomic and intraspecific variability of the
region despite the relatively high database coverage (34, 45). This was further supported by the
retention of a much larger proportion of sequences following the low stringency search in the OTU
pipeline. ITS2, however, had the lowest specificity because the majority of sequences belonged to non-
target groups. The primers used here (listed as vascular plant primers in the CCDB protocols) showed a
propensity to amplify fungal sequences. A 2010 study by Bellemain and colleagues (46) demonstrated
that primers designed to amplify fungal ITS could also amplify large numbers of plant ITS sequences due
to relatively few mismatches in the conserved regions used for the primer binding sites. They also found
that some algal ITS sequences in the database were misidentified as fungi and vice-versa (46). It is
possible that some of the ITS sequences identified as fungi here constituted mislabelled plant
sequences.
The DNA marker trnL had the most sequences returned with database matches but the majority
of those could not be assigned taxonomy at the minimum order level. On further investigation, this was
partly attributed to a few common sequences having “Uncultured Streptophyta clone” among their
equally scoring top database hits obscuring what would have been a family level identification to
Salicaceae. Other trnL sequences were assigned to this family in each sample so this was not expected to
affect overall diversity reported, however, improved curation of the reference database in future studies
could be done to remove these unidentified sequences and increase recovery. Since trnL had good
specificity with the majority of sequences belonging to vascular plants but poor annotation (both from
lower coverage of the local assemblage and presence of insufficiently identified sequences) and
taxonomic resolution (low NND resulting in more ambiguous matches), it had greater recovery following

31
the OTU approach. Overall, ITS2, rbcL and trnL had the most sequences per sample passing all filters and
matK had significantly lower recovery than the rest.
Taxonomic Resolution of Recovered Vascular Plant Sequences
Taxonomic resolution of the sequences successfully recovered and annotated to vascular plant
orders in the BLAST taxonomy pipeline differed among DNA markers. ITS2 had the best taxonomic
resolution of all the DNA markers with environmental sequences assigned to an order also being
unambiguously assigned to a family and genus. This was unsurprising given the greater sequence
divergence among taxa for this locus, observed here with the sample of sequences from local taxa and
previously in larger more encompassing surveys (e.g. 36). The matK and rbcL sequences recovered for
vascular plant orders also showed relatively high taxonomic resolution through to genus level. This is in
agreement with the evaluation of these markers for standard DNA barcoding where low taxonomic
resolution was noted primarily at the species level (21, 58). A significantly lower proportion of trnL
sequences were only resolved to the family level and not genus compared to other DNA markers. This fit
with the observed trend for assignment accuracy discussed above and is in agreement with findings
from the original study by Taberlet and colleagues (32). Since trnL was shown to have somewhat greater
sequence divergence within the sample of local taxa, this relatively lower taxonomic resolution was due
to either annotation difficulties (e.g. database entries missing full taxonomic identifications), low
sequence divergence from taxa not included in the local assemblage but present in the database, or
biased sample composition towards taxa that are less resolved with this DNA marker.
Recovery – Variability among Soil Cores
There were no significant DNA marker differences in spatial recovery of plant taxonomic
diversity among the three soil cores taken within a square meter area. The DNA markers were equally
variable in terms of number of taxa (richness) recovered at all taxonomic levels as well as with OTUs.
Plant taxonomic compositional variability among cores was also not significantly different at order,

32
family, and genus levels but matK OTU composition was significantly more variable among soil cores
than all other DNA markers. Despite significantly lower numbers of sequences retained for OTU analysis,
rarefaction curves produced in Usearch version 8.0.1623 (48) for number of matK OTUs versus number
of sequences reached plateaus for each sampling instance (data not shown). This indicates that there
was sufficient sequencing depth for this locus so this DNA marker might be more sensitive to spatial
heterogeneity of belowground plant diversity than the other DNA markers.
DNA Marker Complementarity
Examining the biodiversity observed with the four DNA markers, rbcL and trnL consistently
reported greater richness values overall across sampling instances compared to matK and ITS2 at order,
family, and genus levels as well as with OTUs. The fact that rbcL and trnL represented greater numbers
of distinct molecular clusters (OTUs) as well as taxonomic groups relative to matK and ITS2 reinforces
that this finding was not dependent on the choice of analysis pipeline (i.e. with or without annotation).
This is in contrast to the original plant eDNA metabarcoding study by Yoccoz and colleagues (8) that
found significantly greater sequence recovery and OTU diversity for trnL than rbcL and may be due to
differences in sequencing platforms between studies. These DNA markers both showed greater
taxonomic breadth within vascular plants compared to matK and ITS2 and greater taxonomic breadth
means more potential unique taxa detected relative to other DNA markers. For example, because rbcL
was able to detect common seedless vascular plants such as club mosses and horsetails that the other
DNA markers missed, this may account for some of the increased richness observed. DNA marker matK
was previously noted to have poor amplification success with seedless vascular plants so this is
unsurprising (21). The reduced breadth of taxa detected by ITS2 on the other hand may reflect database
deficiencies for seedless vascular plant taxa more than amplification problems since sequences from
more distant algal and fungal groups were prevalent.

33
Furthermore, there was the concern that paralogous copies of ITS2 would inflate OTU diversity
estimates since a single individual might be included in more than one distinct OTU (34). However, there
were consistent patterns among DNA markers in richness reported from the BLAST taxonomy pipeline
and the OTU pipeline. Both total vascular plant richness across all sites and within sites from pooled soil
cores showed trnL and rbcL estimates consistently exceeding matK and ITS2 estimates, regardless of
whether OTUs or taxonomy methods were applied. If paralogs were greatly increasing diversity
estimates, it might be expected to see a different trend in richness among DNA markers between OTUs
and taxonomy, especially between matK and ITS2 which reported similar numbers of orders, families,
and genera. A less stringent clustering threshold (95% similarity) was used to form ITS2 OTUs to
compensate for the significantly greater observed NNDs among species which may have allowed
paralogs to cluster together. As NGS is increasingly used to generate reference barcodes, more ITS2
variants will be available in the reference databases (37). This could be used to refine OTU analysis for
ITS2 to distinguish paralogs from distinct taxa.
DNA marker differences only accounted for a small portion of the observed variability in
vascular plant composition whereas site differences accounted for a much larger portion of the overall
variability. This means that site differences (e.g. differences in soil type or other environmental or biotic
variables) were more important than DNA marker biases in determining what plant diversity was
observed. In other words, there was agreement among DNA markers in reported plant diversity at the
site level and this provides general support for the ability of metabarcoding to detect changes in plant
communities outside of technical considerations of which DNA marker to use.
Dispersion values based on Jaccard dissimilarities showed whether any DNA marker was
consistently more dissimilar from the other DNA markers in its reported vascular plant composition at
each site. Overall, dissimilarity increased at finer taxonomic resolution such that the genus level sample
diversity showed less DNA marker agreement than the order level sample diversity. All four DNA

34
markers showed equal compositional dissimilarity with each other for order and family level
observations at the sites. However, trnL, and to some degree rbcL, showed significantly greater PCoA
distances relative to observations from matK and ITS2 for each site at the genus level indicating less
agreement or similarity in the reported plant composition. Jaccard dissimilarity is based on the
proportion of taxa unique to one DNA marker or the other so two DNA markers may be seen as more
dissimilar if they detect largely different numbers of taxa or if they detect distinct groups of taxa. Since
rbcL and trnL showed significantly greater richness than matK and ITS2, the decreased congruence in the
reported plant diversity with these two DNA markers could be due to the added information from their
increased taxonomic breadth rather than just a lack of overlap with the other DNA markers.
Conclusions
Given the criteria of recovery, annotation, and resolution as well as complementarity of the
vascular plant composition identified with different DNA markers, ITS2 and rbcL are recommended for
performing biodiversity assessments of plants from soil eDNA. The DNA marker matK had the lowest
recovery, and while matK corroborated plant taxa identified with other DNA markers, it did not add new
information and had the lowest taxonomic breadth of the four DNA markers. Due to the small size of the
trnL P6 loop, it was not possible to accurately assign taxonomic information to some of its sequences
using the automated BLAST pipeline leading to reduced sequence recovery. This region of the intron also
offered the least taxonomic resolution of recovered vascular plant sequences, either due to low
sequence divergence or poor annotation. Additionally, the trnL intron P6 loop showed the least
similarity among the four markers in vascular plant composition within sites at the genus level. This DNA
marker may be more suitable for studies where analysis of only OTUs with minimal taxonomic
information is sufficient. It also may be more suitable for biodiversity assessment from eDNA when
curated databases for local assemblages are already established because this may improve sequence
recovery by reducing ambiguities in taxonomic assignments (8, 32). If available, these localized

35
reference databases would likely improve taxonomic annotation for any DNA marker. DNA markers rbcL,
matK, and trnL have relatively low sequence divergence among species potentially increasing the risk of
taxonomic misidentification compared to ITS2. ITS2, on the other hand, offered greater taxonomic
resolution and annotation as well as comparable numbers of recovered sequences despite lower
specificity towards vascular plants. Improved primer design and optimization of PCR conditions could
help address ITS2 specificity issues for future eDNA surveys from soil samples where both plant and
fungal DNA is abundant (46). While rbcL has the greatest taxonomic breadth, by using a second, more
resolved DNA marker like ITS2, overlap in the observed plant diversity can provide increased support for
findings.

36
Tables and Figures
Table 1 Database coverage by DNA marker. Total numbers of species and vascular plant species with entries in NCBI GenBank for each DNA marker as well as the ratio of vascular plant sequences to number of species are listed. The right side of the table shows the coverage for previously recorded vascular plant taxa in the study region.
DNA
marker
Total database Targeted PAD vascular plant list
All species
Vascular plant species
Ratio seq : spp
Order (n = 28)
Family (n = 51)
Genus (n = 131)
Species (n = 238)
matK 43,966 43,610 2.03 100% 100% 98% 83%
rbcL 44,157 34,331 2.09 100% 100% 98% 82%
ITS 182,793 78,260 2.46 100% 98% 97% 81%
trnL 55,752 51,789 1.83 100% 98% 94% 69%

37
Table 2 Total number of vascular plant taxa observed in the PAD region from previous aboveground surveys (“Previously recorded”), number of vascular plant taxa observed from DNA metabarcoding of soil at four PAD sites over three years (“Observed with eDNA”), and the overlap between the two lists at order, family, and genus levels. DNA results are broken down by individual marker. Database coverage is shown for the subset of taxa that were both previously recorded and subsequently observed from eDNA by at least one DNA marker in case marker differences resulted from a lack of coverage for these taxa.
Number of vascular plant taxa
Level Locus Previously recorded
Observed with eDNA
Observed and previously recorded
Database coverage
Orders Total 28 36 27 27
rbcL
27 21 27
matK
17 17 27
ITS2
16 15 27
trnL
28 24 27
Families Total 51 63 36 36
rbcL
42 23 36
matK
22 21 36
ITS2
20 19 35
trnL
43 32 36
Genera Total 131 142 56 56
rbcL
79 32 56
matK
37 33 56
ITS2
34 28 53
trnL
69 32 54

38
0
0.2
0.4
0.6
0.8
1
ITS2 matK rbcL trnLFrac
tio
n o
f Se
qu
en
ces
Ass
ign
ed
C. Genus
Correct Incorrect Unknown/Ambiguous
0
0.2
0.4
0.6
0.8
1
ITS2 matK rbcL trnL
Frac
tio
n o
f Se
qu
en
ces
Ass
ign
ed
A. Order
Correct Incorrect Unknown/Ambiguous
0
0.2
0.4
0.6
0.8
1
ITS2 matK rbcL trnL
Frac
tio
n o
f Se
qu
en
ces
Ass
ign
ed
B. Family
Correct Incorrect Unknown/Ambiguous
0
0.2
0.4
0.6
0.8
1
ITS2 matK rbcL trnLFrac
tio
n o
f Se
qu
en
ces
Ass
ign
ed
D. Species
Correct Incorrect Unknown/Ambiguous
Figure 1 Accuracy of taxonomic assignments of known sequences when exact matches are present in the database. Available sequences for each DNA marker (n = 919, 447, 432, 364 for ITS2, matK, rbcL, and trnL respectively at all order (A), family (B), and genus (C) levels but at species (D) level n = 893, 420, 410, 320) were cropped to amplicon size and searched against non-geographically or taxonomically restricted GenBank databases for each DNA marker using BLAST. Taxonomic information was consolidated from top hits and graphs show the proportion of reference sequences returned with correct, incorrect, or unknown/ambiguous identifications at the four levels.

39
Figure 2 Median number of sequences per sample (n = 35) for each DNA marker at sequential stages of filtering using the BLAST taxonomy approach (A) and OTU approach (B). Quality and length filtering was the same for both approaches. For the taxonomy approach, numbers of sequences returned with a database hit following high stringency BLAST search, assigned to at least order level, and then assigned specifically to a vascular plant order are shown. For the OTU approach, numbers of sequences assigned to OTUs and then assigned specifically to vascular plant OTUs in a low stringency BLAST search are shown. Error bars represent the median absolute deviations and letters denote statistically significant (α = 0.05) DNA markers at each filtering stage.
0
50
100
150
200
250
300
350
400
Quality and LengthFiltered Sequences
BLAST Hits Assigned OrderLevel
Assigned VascularPlants
Med
ian
Seq
uen
ces
per
Sam
ple
(T
ho
usa
nd
s)
A. BLAST Taxonomy ApproachmatKrbcLITS2trnL
0
50
100
150
200
250
300
350
400
Quality and LengthFiltered Sequences
OTU Sequences Vascular PlantOTUs
Med
ian
Seq
uen
ces
per
Sam
ple
(T
ho
usa
nd
s)
Sequence Filtering Stage
B. OTU ApproachmatKrbcLITS2trnL
a a
b b
b b
a
c
a
b b b
a
b b b
a a
b b
b
a
c
d
b b
a
c

40
Figure 3 Taxonomic resolution of the four DNA markers. The log number of sequences assigned unambiguously to family (A), genus (B), and species (C) levels are plotted against the log number of sequences assigned to vascular plant orders. Each dot is a single sample (n = 35) and the line y = x indicates the upper limit where all sequences assigned to order level are also assigned at the lower taxonomic level. Median proportion of sequences per sample with order level information but not assigned taxonomic information at each family, genus, or species level are indicated and letters denote markers found to have significantly different (α = 0.05) taxonomic resolution of sequences across samples.
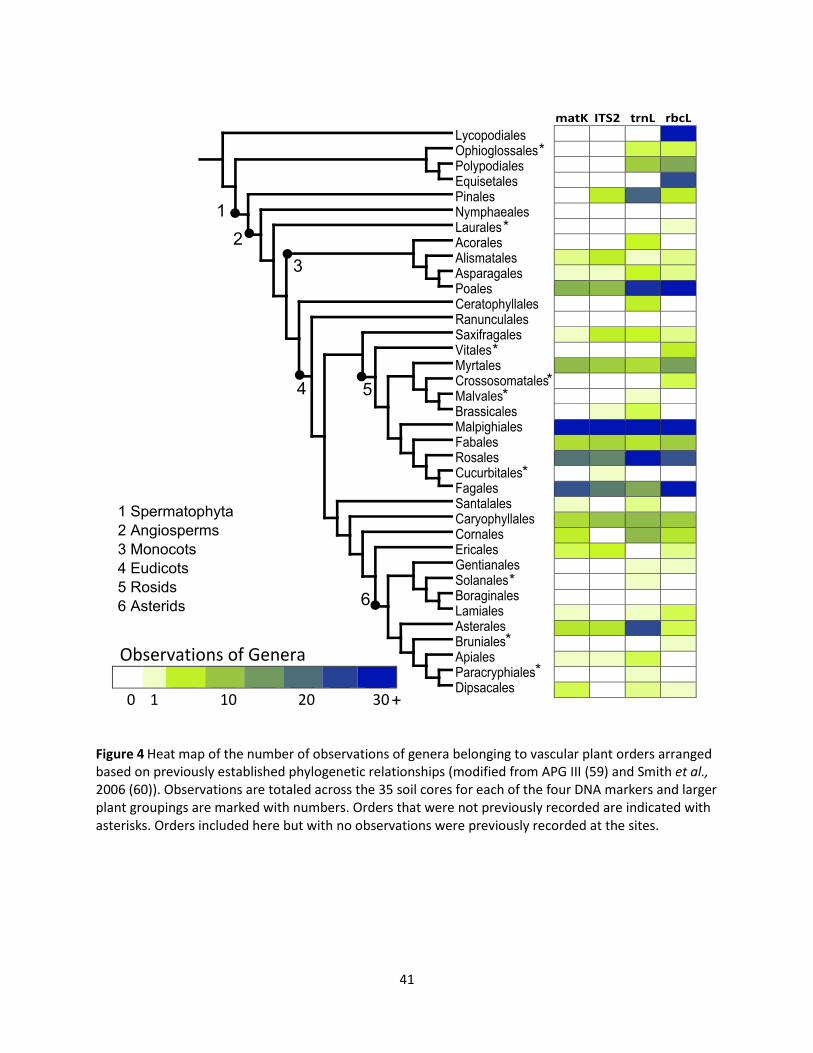
41
Figure 4 Heat map of the number of observations of genera belonging to vascular plant orders arranged based on previously established phylogenetic relationships (modified from APG III (59) and Smith et al., 2006 (60)). Observations are totaled across the 35 soil cores for each of the four DNA markers and larger plant groupings are marked with numbers. Orders that were not previously recorded are indicated with asterisks. Orders included here but with no observations were previously recorded at the sites.

42
Chapter Two – DNA metabarcoding assessment of temporal variability in belowground plant diversity in a deltaic wetland
Abstract
New methods of biodiversity assessment rely on environmental DNA (eDNA) in order to increase
the scale, depth and efficiency of biomonitoring. For plants, eDNA is obtained from soil and allows
species identification from any tissues – active, dormant, or dead – unlike traditional survey methods
that only identify actively growing taxa. Biomonitoring depends on identifying changes at a site over
time but it is uncertain whether total belowground vascular plant diversity is temporally static due to
accumulation of dormant tissues, seeds, pollen, and detritus or if annual variability is similar to that seen
in aboveground plant communities. As well, DNA markers commonly used for plant identification may
differ in their ability to detect temporal changes due to differences in the persistence of longer versus
shorter DNA molecules in the environment. Using soil cores collected from four sites in the Peace-
Athabasca Delta over three years, this research examines belowground plant community turnover. Four
plant DNA markers differing in sequence length (rbcL, matK, ITS2, and the P6 loop of the trnL intron)
were sequenced for each soil core in order to identify interactions between DNA marker length and
measurement of temporal variability in plant communities. Annual variability in belowground vascular
plant richness and composition was consistent in magnitude with previously observed variability in
aboveground vegetation at the sites. Temporal variability in order, family, and genus richness and OTU
composition were positively correlated with DNA marker length. These findings suggest that
belowground plant diversity in the delta is as dynamic as the aboveground vegetation and that choice of
DNA marker for biodiversity assessment may affect resolution of short term changes in diversity.

43
Introduction
Biodiversity assessments are used to describe community composition and identify changes in
the local biota at a site in response to stressors. Since changes in communities may be linked to changes
in ecosystem function, this process of “biomonitoring” allows us to evaluate ecosystem trends (6, 7, 61).
Wetlands are key targets of biomonitoring initiatives, and thus biodiversity assessments, because they
provide many ecosystem services through their roles in carbon sequestration, water resource allocation,
maintenance of food webs, and provisioning of habitat (14). Vascular plants in particular are directly
linked to these functions as they are involved in carbon cycling, are the main terrestrial primary
producers, and are dependent on the hydrological regime (1, 14, 62). For example, a previous study
showed changes in hydrology during flood-drawdown cycles in the Peace Athabasca Delta (PAD) were
associated with shifts in the plant communities (62). As a result, plant community assessments are often
part of wetland monitoring and metrics specific to plants like the floristic quality index have been
developed to evaluate wetland sites (e.g. 15).
Conventional plant biodiversity assessments usually look at a subset of plant diversity at a site,
either measuring aboveground diversity at a particular time or, alternatively, surveying the seed bank if
the attention is on restoration (e.g. 28, 62, 63). New environmental DNA (eDNA) methods – referred to
as DNA metabarcoding – take advantage of the abundant presence of plant DNA in soil to increase the
efficiency and scope of assessments, requiring a shift in focus from aboveground diversity to
belowground diversity. In contrast to seed bank surveys, eDNA may originate from many sources
including roots, rhizomes, plant detritus, pollen, as well as seeds (33). These diverse sources of DNA
allow eDNA surveys to potentially capture “total” belowground diversity derived from both broader
spatial (e.g. dispersed seeds and pollen) and temporal (e.g. dormant tissues) scales (18).
Since biomonitoring depends on identifying changes in biota over time, it is necessary to
consider how belowground plant community dynamics may differ from aboveground dynamics and the

44
implications for biodiversity assessment. Without an understanding of the underlying turnover, it is
difficult to determine if changes observed during monitoring are anthropogenic or natural (61). It is
expected that belowground plant diversity will always exceed aboveground diversity for a given area
due to the presence of dormant tissues, and it has been hypothesized that this dormancy creates a
buffer period during which changes in aboveground diversity are not observed belowground (18, 19). If
this is the case, temporal variability in belowground vegetation is expected to be less than temporal
variability in aboveground vegetation or show no temporal variability at all aside from sampling
variability. This reduced variability or delayed turnover belowground may then help distinguish
temporary absences from aboveground communities if the added diversity due to seeds and dormant
tissues can be determined (18, 19). On the other hand, it has been hypothesized that under certain
environmental conditions such as high levels of disturbance, belowground and aboveground vegetation
would be more similar (19). In this case belowground vegetation may be dynamic and demonstrate
temporal variability in plant diversity that is not significantly different from aboveground variability.
Dynamic belowground diversity would allow for direct interpolation of ecosystem trends based on
changes in plant community structure.
Furthermore, it is essential to consider how DNA persistence in the soil influences the ability to
observe temporal changes. Viable tissues such as actively growing roots, dormant rhizomes, and seeds
should all have intact genomes whereas DNA found in plant detritus has been exposed to degradation.
After cell death, large DNA molecules rapidly degrade and are broken down into small fragments, but
small DNA molecules can persist for long periods of time as demonstrated by the recent study of ancient
DNA (23, 24). Permafrost cores have DNA from organisms thousands of years old (24) and preliminary
research on eDNA plant assessment from soil based on very small DNA fragments identified crop species
not grown in the area for at least 50 years (8). An abundance of DNA from long dead organisms
(sometimes referred to as “zombie DNA”) would exaggerate any lag in belowground turnover and

45
obviously confound attempts to draw conclusions about changes in the current diversity at a site (5).
Due to degradation, smaller DNA marker regions are expected to be more susceptible to detecting DNA
from past growth than longer DNA markers. In order to determine if DNA marker length influences
assessment of belowground annual variability in total vascular plant diversity, four established DNA
markers of different lengths are used to assess biodiversity: matK, rbcL, ITS2, and the P6 loop of the trnL
intron. If small DNA molecules are retained in the soil for longer periods of time than larger DNA
molecules, then small DNA molecules should show less annual variability in total belowground vascular
plant diversity than larger DNA molecules. In theory the small DNA molecules would also be expected to
show greater richness because of their accumulation but richness is also limited by primer biases,
sequence diversity, taxon resolution, and database coverage for each marker.
Through DNA metabarcoding, this study evaluates belowground temporal variability in total
vascular plant diversity in order to test these hypotheses regarding community level belowground
dynamics and persistence of DNA in soil. The Peace-Athabasca Delta wetlands are an ideal study site for
addressing these research questions because the aboveground vegetation is known from past studies to
be dynamic due to hydrological variability created by flood-drawdown cycles. Flood-drawdown cycles
refer to periodic flooding that occurs in wetlands whereby a more aquatic state with standing water is
replaced by a more terrestrial state without standing water and vice versa (64, 65). The availability of
water affects which plant taxa are able to grow and thus these state transitions are associated with
aboveground successional changes in plant diversity (62, 65, 66). The physical disturbance of the upper
soil layer from flooding and changes in the actively growing aboveground plant community (62, 65, 67)
suggest that belowground plant species composition may experience turnover in conjunction with the
flood cycle. Vegetation surveys from 1996, 1998, and 2001 (unpublished monitoring data, Parks
Canada) provide reference values for aboveground variability to complement the soil core genomics
data collected from the same sites in 2011, 2012, and 2013 as part of the Biomonitoring 2.0 project.
46
Hypotheses and Predictions
Belowground versus Aboveground Temporal Variability
H1: Vascular plant diversity accumulates belowground through retention of dormant plant tissues.
P1: Annual belowground variability in vascular plant diversity is significantly less than
annual aboveground variability.
H2: Through environmental processes such as disturbance, belowground vascular plant diversity is
similar to aboveground vascular plant diversity.
P2: Annual belowground variability in vascular plant diversity is not significantly different
from variability seen aboveground.
Interaction between DNA Marker and Temporal Variability
H: Short fragments of DNA persist in the environment after cell death for greater periods of time than
longer fragments of DNA.
P: DNA marker length is positively associated with temporal variability in vascular plant
diversity.
Methods
The sites, sampling protocol, molecular methods, and bioinformatics are all as described
previously and outlined in detail in Appendix A. The same dataset used to evaluate the relative
performance of the four markers for DNA metabarcoding of vascular plant diversity from soil eDNA was
reanalyzed here in order to separately focus on the temporal dimension of the dataset. In brief, three 10
cm soil cores were collected from within a 1 m2 area at each of four sites (PAD 03, 04, 14, and 33) in
August 2011, 2012, and 2013. Sampling location was marked with a pin for consistency between years
and one soil core is missing from PAD 14 in 2012 for a total of 35 soil cores. Soil cores were subsampled
and DNA extraction was performed using commercial soil DNA extraction kits (UltraClean® Soil or

47
PowerSoil® DNA Isolation kits (MO BIO Laboratories; Carlsbad, California, USA)). For each sample, the
four loci – rbcL, matK, ITS2, and trnL P6 loop – were amplified with established vascular plant primers
and then Illumina tailed primers following brief optimization of a standardized protocol for each marker.
During library preparation, amplicons underwent a third round of amplification to add sample
identifying tags prior to pooling.
Amplicons were sequenced over four Illumina MiSeq sequencing runs with either v2 or v3 kits
and after signal processing with the built in Illumina software, sequences were processed using a custom
bioinformatics pipeline. Forward and reverse reads for short sequences (i.e. ITS2 and trnL intron) were
paired and filtered for quality and length with Pandaseq (53) and Prinseq (52) programs, respectively,
while longer sequences (i.e. matK and rbcL) were filtered with Prinseq and then concatenated. For
taxonomic assignments, sequences were denoised in Usearch (48) to remove duplicates and chimeras
and then searched against complete (i.e. non-geographically or taxonomically restricted) reference
databases from NCBI’s Genbank. Only high stringency matches were accepted with a minimum of 98%
identity and an E-value threshold of 10-20 (10-1 for trnL due to its small size). The taxonomy for the hits
tying for top score were collapsed and any inconsistencies were labelled as “ambiguous” at the different
taxonomic levels. Taxonomy output was further filtered using minimum alignment lengths and each
taxon had to have at least 10 sequences assigned to it in a sample to count it as present. Only sequences
assigned to vascular plant orders were considered in the analysis.
For the taxonomy-free OTU approach which focuses on units of molecular similarity, sequences
were clustered within samples by 98.5%, singletons were removed, and then cluster centroids were
reclustered across samples at 98% similarity (95% for ITS2). OTUs with at least 100 sequences across all
samples were then searched against the GenBank databased with low stringency match criteria (a
minimum 70% identity and E-value of 10-1) in order to exclude non-target sequences. At least 10

48
sequences had to be assigned to a given OTU within a sample to count it as present. All data was
examined using strictly presence-absence and no sequence abundances were used.
Reference data used in this study for temporal variability in aboveground vegetation at the four
sites were collected in 1996, 1998, and 2001 (Parks Canada, unpublished monitoring data). Data were
collected from 500-800 m transects at a single time point in late July or early August of each year and
based on morphological identifications. Taxonomy was cross referenced against NCBI’s taxonomy
database to ensure the same naming systems were used and only vascular plant taxa with a minimum
order level identification were included.
Statistical Methods
Presence-absence matrices were generated at the order, family, genus, and OTU levels.
Unambiguous species designations were returned for such a small subset of sequences for each DNA
marker that species level information was not considered reliable and thus excluded from analyses.
First, I performed a two-way ANOVA in R version 3.1.2 (50) to test for differences in mean
annual richness estimates among markers (matK, rbcL, ITS2, trnL, and aboveground morphology) across
sites (PAD 03, 04, 14, and 33) at the order, family, and genus levels. Each site and marker combination
was represented by observations from three separate years. Post hoc Tukey’s tests were performed and
only differences in annual richness between the belowground (DNA markers) and aboveground
morphology are reported. This test was then repeated with richness values from different pooled
combinations of ITS2, rbcL, and trnL.
The coefficient of variation (CV) was used to measure temporal variability in richness at each
site. To calculate CV, the standard deviation in richness at a site over the three time points was divided
by the mean richness at the site. I used a randomized block ANOVA to test for differences in CV among
markers (matK, rbcL, ITS2, trnL, and aboveground morphology) blocked by site (PAD 03, 04, 14, and 33)

49
at order, family, and genus levels. The ANOVA test of CV was also performed at the OTU level but in this
case only the four DNA markers were compared because there was no equivalent aboveground data.
Tukey’s test was used for all post hoc comparisons. To determine if trends in CV were associated with
DNA marker length, linear mixed effects models were used to test for significant linear correlations
between the size of DNA fragment targeted by PCR amplification for each marker and CV. Including
primer binding regions, average DNA fragment lengths were 892, 596, 400, and 89 bp for matK, rbcL,
ITS2, and trnL, respectively. Length and CV were z score transformed and a model was fitted using
length as a fixed effect and site as a random effect in the nlme package (version 3.1-118) in R (68).
To determine if temporal variability in richness was an artifact of sampling variability, the
variability among the three individual soil cores sampled within a year, averaged across the three
sampling years, was compared to the temporal variability in richness among the three years after
pooling soil cores. The ratio of temporal variability to average within year variability for each site and
marker was calculated so that a value greater than one indicates temporal variability exceeded the
sampling variability while a value less than one implies greater sampling variability. The ratios were
averaged in two ways: by marker and by site.
Analyses of temporal variability in diversity were then repeated using two beta diversity metrics
to examine temporal patterns in vascular plant composition turnover rather than just variability in the
number of taxa present each year. First, simple beta diversity was calculated by taking the total number
of distinct taxa present at a site across all years (gamma diversity) and dividing it by the average number
of taxa present in a single year at the site (alpha diversity) (54). Second, pairwise beta diversity was
calculated using Jaccard dissimilarity which is the proportion of total diversity between two sites (or
years) that is non-overlapping (55). Using the “betadisper” function in the R package “vegan” version
2.2-1 (55), these pairwise distances were used to perform a principal coordinates analysis (PCoA) and
temporal beta diversity was measured as the average distance (multivariate dispersion) of the three

50
time points to the spatial median for each site. The greater the dispersion, the greater the temporal
variability was at a site.
These metrics were calculated for each DNA marker at each site as well as for the historical
aboveground morphological data. As described above, I used a randomized block ANOVA to test for
differences in temporal beta diversity among markers (matK, rbcL, ITS2, trnL, and aboveground
morphology) with site as the blocking factor at order, family, genus and OTU levels (no aboveground
data for OTUs). Tukey’s test was used for all post hoc comparisons. The same linear mixed effects
models were used to test for significant linear relationships between DNA marker length and temporal
beta diversity. Likewise, the ratio of temporal beta diversity to average beta diversity among soil cores
within a year was calculated to compare temporal variability in composition against sampling variability.
Results
Mean annual belowground vascular plant richness, summarized in Figure 5, was generally
consistent with or greater than past estimates of aboveground richness at the sites. For individual DNA
markers, there was a significant effect of marker on richness at order (ANOVA, F4,40 = 10.997, p < 0.0001)
and family (F4,40 = 11.634, p < 0.0001) levels and in both cases the vascular plant richness observed with
matK was significantly less than past aboveground richness (Tukey’s test, p ≤ 0.016). All other individual
DNA markers showed belowground order and family level richness consistent with aboveground
richness. None of the individual DNA markers had significantly different estimates of belowground
genus richness from the morphology-based aboveground surveys and there were no significant
interactions between site and marker. In contrast, mean annual belowground richness from combined
DNA markers was almost always greater than past aboveground morphology-based richness. There
were significant marker differences at order (ANOVA, F4,40 = 13.070, p < 0.0001), family (F4,40 = 11.211, p
<0.0001) and genus (rank transformed, F4,40 = 14.406, p < 0.0001) levels. At order level ITS2+trnL,

51
rbcL+trnL, and ITS2+rbcL+trnL site richness was significantly greater than past aboveground richness
(Tukey’s test, p = 0.006, p <0.0001, and p <0.0001 respectively). This was repeated at family level where
ITS2+trnL, rbcL+trnL, and ITS2+rbcL+trnL mean site richness values were significantly greater than
aboveground richness (p = 0.039, p <0.0001, and p <0.0001, respectively). At genus level all pooled DNA
markers showed significantly greater mean belowground richness compared to previous aboveground
estimates (ITS2+rbcL p = 0.004, ITS2+trnL p = 0.027, rbcL+trnL p <0.0001, ITS2+rbcL+trnL p <0.0001).
Again, there were no significant interactions between marker and site in any of these models.
Temporal vascular plant richness CV is summarized in Figure 6. There were no significant
differences between aboveground and belowground mean temporal richness CV nor were there
significant differences in CV between DNA markers at order level (ANOVA, F4,12 = 2.930, p = 0.066). At
the family level, marker had a significant effect on CV (rank transformed, F4,12 = 6.301, p = 0.006), but
only belowground variability in richness measured with matK was significantly greater than
aboveground variability (Tukey’s test, p = 0.009). Among DNA markers, matK showed significantly more
variability in belowground richness than trnL (p = 0.005) but no other DNA markers were significantly
different. Similarly at genus level, there were significant differences in mean CV among markers
(ANOVA, F4,12 = 6.962, p = 0.004) and belowground variability in richness measured with matK was
significantly greater than aboveground variability (Tukey’s test, p = 0.004). Among DNA markers, matK
showed greater variability in richness than trnL (p = 0.019) and no other DNA markers were significantly
different. Using sum of squares partitions, the factor “marker” accounted for 44, 63, or 64% of the
variation in CV while site differences explained 12, 8, or 8% of the variation at order, family, or genus
levels respectively. There were no significant DNA marker differences in CV for OTUs (ANOVA, rank
transformed, F3,9 = 1.472, p = 0.287). With OTUs, DNA marker accounted for 30% of the variation in CV
while site difference explained 8%. Even though CV was not significantly different between most DNA
markers, the linear mixed effects models (Figure 7) identified significant positive correlations between
52
DNA marker length and temporal richness CV at order (r = 0.642, p = 0.0095), family (r = 0.775, p =
0.0006), and genus levels (r = 0.731, p = 0.0017). OTU CV was marginally associated with marker length
(r = 0.498, p = 0.055). At site PAD 14 in 2013, ITS2 primers preferentially amplified almost entirely fungal
sequences. The remaining sequences attributable to plants belonged to only a few distinct OTUs thus
reducing richness and inflating the CV estimate for PAD 14 based on this marker.
The ratios of temporal richness CV to mean among soil core richness CV are presented in Figure
8A, averaged across either DNA marker or site. Generally variability among years exceeded sampling
variability (average ratio was greater than 1) but there are two exceptions to note: across the four
markers, site PAD 03 ratios were on average less than 1 at all taxonomic levels and across the four sites,
trnL showed average ratios of variability that were less than 1 at three of the four taxonomic levels
examined. PAD 03 showed higher sampling (i.e. among soil cores) CV than other sites but similar
temporal CV. For example, at genus level the average CV among soil cores was 0.66 for PAD 03 versus
0.39, 0.23, and 0.22 for PAD 04, 14, and 33, respectively, while temporal CV was 0.52 for PAD 03 versus
0.48, 0.37, and 0.51 for PAD 04, 14, and 33, respectively. Marker trnL on the other hand showed similar
sampling CV to other markers (e.g. at genus level average CV = 0.38 versus 0.38, 0.38, and 0.36 for rbcL,
matK, and ITS2, respectively) but lower temporal CV (e.g. at genus level average CV = 0.32 versus 0.52,
0.66, and 0.37 for rbcL, matK, and ITS2, respectively).
Simple beta diversity measurements are summarized in Figure 6. There were no significant
differences in mean belowground and aboveground simple temporal beta diversity measurements or
between DNA markers at the order (ANOVA, F4,12 = 0.913, p = 0.937), family (F4,12 = 0.951, p = 0.4683), or
genus (F4,12 = 0.738, p = 0.584) levels. In the taxonomy data, marker differences only explained 5, 15, or
14% of the variation in beta diversity while site differences accounted for 23, 36, or 29% of the variation
in beta diversity at the order, family, and genus levels respectively. There were, however, significant
differences in simple beta diversity of vascular plant OTUs among DNA markers (ANOVA, rank
53
transformed, F3,9 = 12.233, p = 0.0016). Simple temporal beta diversity observed with matK was
significantly greater than beta diversity observed with ITS2 (Tukey’s test, p = 0.006) or trnL (p = 0.003),
and beta diversity measured with rbcL was also significantly greater than beta diversity measured with
trnL (p = 0.023). Variability in rank transformed OTU beta diversity was 54% attributed to DNA marker
and 33% to site. Linear mixed effects models (Figure 7) found no significant correlations between simple
beta diversity and DNA marker length at levels of order (r = 0.226, p = 0.347), family (r = 0.046, p =
0.832) or genus (r = 0.265, p = 0.247), but a significant positive correlation between OTU beta diversity
and DNA marker length was identified (r = 0.690, p = 0.0001).
The mean ratios of among year beta diversity to average among soil core beta diversity at order,
family, genus, and OTU levels are summarized in Figure 8B and were, on average, greater than 1 for all
DNA markers. Ratios for ITS2 and trnL were consistently lower than ratios for rbcL and matK. As with
richness CV, temporal beta diversity at site PAD 03 was less than average beta diversity among the soil
cores across the four DNA markers at all taxonomic levels. Again, this difference at site PAD 03 was
associated with increased beta diversity among soil cores (e.g. at genus level, average beta diversity =
2.00 versus 1.76, 1.63, and 1.61 for PAD 04, 14, and 33 respectively) rather than a difference in temporal
beta diversity (e.g. at genus level, average beta diversity = 2.00 for PAD 03 versus 1.98, 2.29, and 1.95
for PAD 04, 14, and 33 respectively).
Multivariate dispersions of annual measurements at sites based on Jaccard dissimilarities are
shown in Figure 6. Consistent with simple beta diversity measurements, there were no significant
differences in mean belowground and aboveground multivariate dispersions or among DNA markers at
the order (ANOVA, F4,12 = 0.669, p = 0.814), family (F4,12 = 0.830, p = 0.531), or genus (F4,12 = 1.162, p =
0.375) levels. Variability in multivariate dispersion was 10, 16, or 20% attributable to the factor “marker”
and 13, 27, or 30% attributable to site differences at the order, family, and genus levels, respectively, for
the taxonomy data. The ANOVA test on multivariate dispersion of OTUs, however, indicated significant

54
differences among DNA markers (rank transformed, F3,9 = 12.20, p = 0.002). As with simple beta
diversity, matK multivariate dispersion was significantly greater than trnL (Tukey’s test, p = 0.002) and
ITS2 (p = 0.012) multivariate dispersion and rbcL multivariate dispersion was also significantly greater
than trnL multivariate dispersion (p = 0.012). Variability in rank transformed OTU dispersion was 54%
attributable to DNA marker differences and 32% attributable to site differences. Linear mixed effects
models found no significant associations between multivariate dispersion and length of DNA fragment
(Figure 7) at the order (r = 0.308, p = 0.217), family (r = 0.093, p = 0.280), or genus levels (r = 0.275, p =
0.222). A significant positive correlation between OTU multivariate dispersion and DNA fragment length
was detected (r = 0.716, p = 0.0003).
The average ratios of temporal multivariate dispersion to average among soil core multivariate
dispersion, seen in Figure 8C, were greater than 1 across all markers and all sites at all levels examined
except for site PAD 03 in which OTUs showed less temporal dispersion than among samples. The ratios
for this site at order and family level were also close to 1. Again, the ratios for ITS2 and trnL were
consistently lower than the ratios for rbcL and matK (except at the OTU level).
All statistical test output for this chapter is summarized in Tables 19-25 in Appendix E.
Discussion
Total belowground estimates of vascular plant richness were either consistent with past
aboveground observations at the sites or exceeded them. Only matK showed significantly lower richness
estimates compared to the aboveground data and this may be explained by matK’s previously discussed
reduced taxonomic breadth or potential increased sensitivity to spatial heterogeneity (see Chapter 1).
Past research that found belowground diversity exceeds aboveground were based on comparisons at
the same spatial scales (e.g. 18) whereas here the soil is sampled from within 1 m2 area while
aboveground surveys were completed along 500-800 m site level transects. It is noteworthy that,

55
despite the differences in scale, total belowground vascular plant diversity from a 10 cm soil depth is
comparable in magnitude to richness from a site level survey. This is explained by a number of factors:
not everything that is growing aboveground will be morphologically identifiable at the time of a survey,
not everything occurring belowground has corresponding aboveground structures, and in addition to
the seeds and root structures used in previous belowground studies, this approach potentially also
included pollen, plant detritus, or exogenous plant DNA (8, 18, 27, 33, 69). The added richness from
combining markers also indicates that no single DNA marker is capturing all of the available
belowground vascular plant diversity present in the soil extracts. This is in agreement with past research
that suggests a multiple marker approach is necessary for both plant DNA barcoding (due to a lack of
sequence diversity among some taxa at a particular locus) (21, 31) and for community level eDNA
assessments to mitigate primer or database biases (9).
Temporal variability in belowground vascular plant composition was assessed using three
metrics in order to reduce and simplify the complex community data and identify overall patterns.
Aboveground vegetation data was not concurrent with belowground vegetation data so direct
comparisons of diversity were not possible due to potential confounding factors. By studying relative
magnitudes of temporal change or variability instead, however, the aboveground data could be used for
reference or benchmark values for natural aboveground variability in vegetation at the sites.
First, the hypotheses regarding belowground temporal vegetation dynamics were addressed.
Results based on all three metrics (CV, simple beta diversity and multivariate dispersion) indicated that
total belowground vascular plant diversity was variable year to year and the variability was consistent in
magnitude with past aboveground observations. While not significantly different, variability
belowground tended to be greater than aboveground variability, contrary to what would be expected
with retention of dormant taxa and seeds belowground (19). This could be due to the differences in
scale between belowground and aboveground measurements or it suggests that most of the added

56
belowground plant diversity is transient rather than cumulative. Temporal belowground variability
exceeded spatial sampling variability at all taxonomic levels across three out of four sites and three out
of four markers meaning that the temporal variability observed was likely not an artifact of spatial
sampling. Temporal variability also increased with increasing taxonomic resolution as expected due to
the finer scale detail available at the genus level compared to order level for example.
Site PAD 03 showed less among year variability in vascular plant richness and composition than
average among soil core variability unlike the other three study sites. A ratio of less than one could
result from either a lack of temporal variability at this particular site (i.e. this site did not significantly
change between years so only sampling variability is observed) or it could be a sign of insufficient spatial
sampling. Looking at the average variability between cores relative to the other sites, PAD 03 had
elevated sampling variability compared to the rest while temporal variability at the site was similar in
magnitude to temporal variability at the other sites. This suggests increased sampling would be needed
to capture the total plant diversity at PAD 03 in any given year.
It is worth noting that these findings for belowground temporal variability in vascular plant
diversity were based on a relatively small sample size. Only four replicates (sites) were assessed at three
time points and for each time point, measures of diversity were based on three soil cores. Sampling
error from each of these levels could have contributed to observed variability and potentially skewed or
obscured the underlying temporal patterns. Sites differed significantly in richness, composition, and
variability among replicate soil cores (data not shown) which is why they were treated as the blocking
factor in all statistical tests. As well, with only three time points, if data from any one year was abnormal
or an outlier, this would have inflated measures of temporal variability. Relative magnitudes of spatial
and temporal variability were discussed previously but if belowground diversity was strongly spatially
heterogeneous, slight spatial shifts in sampling between years could also inflate temporal variability
measurements. Although the aboveground data is not free from its own sampling error, the sources of

57
error discussed here might explain why temporal variability belowground often exceeded that observed
aboveground. Increased sampling, both spatially and temporally, in future assessments could help
reduce sampling error or better describe the relative contributions of variability at each level.
Another limitation is that the reference aboveground data was collected 10-15 years earlier
than the belowground data. Direct comparison of vascular plant composition could not be made
between aboveground and belowground data sets in case these dynamic sites had experienced
community shifts. Community level variability in plant diversity over time was assessed to avoid direct
comparisons in plant taxa but it is possible that community turnover at the sites changed between the
two surveys. Past research on the delta showed that variation in hydrology and landscape cover from
1968 - 2001 was within normal fluctuations for the delta over the past 300 years (70). There was no
reason to expect major differences in temporal variability in the past decade at the four study sites.
Overall, however, these results suggest that similar to aboveground dynamics, belowground
variability or turnover in total vascular plant taxa to a depth of 10 cm in the delta might be dominated
by disturbance processes that prevent collection of plant materials in the soil (19). Previous studies in
the Peace-Athabasca Delta wetlands have highlighted the importance of hydrology, specifically the
flood-drawdown cycles, in influencing aboveground vegetation dynamics (62). It is reasonable to expect
a physical disturbance process like seasonal flooding to have an effect on the topmost soil layers and
thus influence the total belowground plant diversity in this layer as well. Seeds, pollen, detritus, and
possibly even larger plant structures could be moved in or washed away depending on the intensity of
these events (67).
Secondly, the hypothesis regarding the potential interaction between DNA marker length and
belowground temporal variability was tested. Choice of DNA marker only led to significant differences in
magnitude of temporal variability in belowground plant community richness at family and genus level,
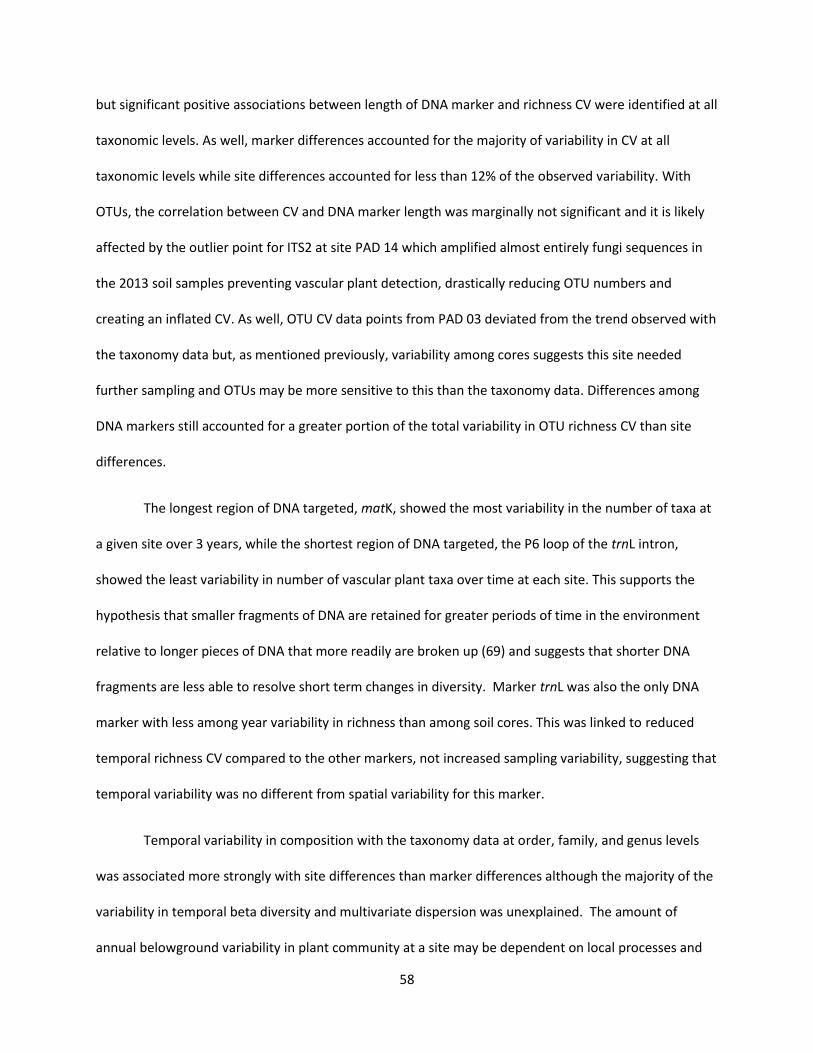
58
but significant positive associations between length of DNA marker and richness CV were identified at all
taxonomic levels. As well, marker differences accounted for the majority of variability in CV at all
taxonomic levels while site differences accounted for less than 12% of the observed variability. With
OTUs, the correlation between CV and DNA marker length was marginally not significant and it is likely
affected by the outlier point for ITS2 at site PAD 14 which amplified almost entirely fungi sequences in
the 2013 soil samples preventing vascular plant detection, drastically reducing OTU numbers and
creating an inflated CV. As well, OTU CV data points from PAD 03 deviated from the trend observed with
the taxonomy data but, as mentioned previously, variability among cores suggests this site needed
further sampling and OTUs may be more sensitive to this than the taxonomy data. Differences among
DNA markers still accounted for a greater portion of the total variability in OTU richness CV than site
differences.
The longest region of DNA targeted, matK, showed the most variability in the number of taxa at
a given site over 3 years, while the shortest region of DNA targeted, the P6 loop of the trnL intron,
showed the least variability in number of vascular plant taxa over time at each site. This supports the
hypothesis that smaller fragments of DNA are retained for greater periods of time in the environment
relative to longer pieces of DNA that more readily are broken up (69) and suggests that shorter DNA
fragments are less able to resolve short term changes in diversity. Marker trnL was also the only DNA
marker with less among year variability in richness than among soil cores. This was linked to reduced
temporal richness CV compared to the other markers, not increased sampling variability, suggesting that
temporal variability was no different from spatial variability for this marker.
Temporal variability in composition with the taxonomy data at order, family, and genus levels
was associated more strongly with site differences than marker differences although the majority of the
variability in temporal beta diversity and multivariate dispersion was unexplained. The amount of
annual belowground variability in plant community at a site may be dependent on local processes and
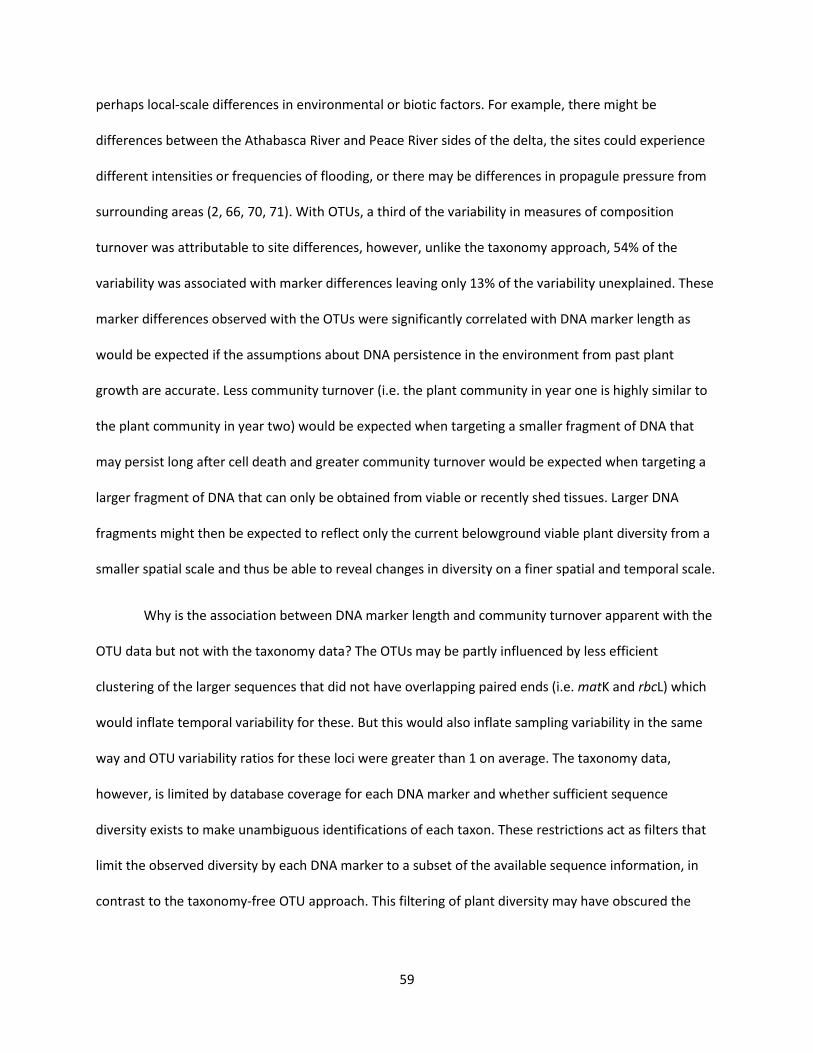
59
perhaps local-scale differences in environmental or biotic factors. For example, there might be
differences between the Athabasca River and Peace River sides of the delta, the sites could experience
different intensities or frequencies of flooding, or there may be differences in propagule pressure from
surrounding areas (2, 66, 70, 71). With OTUs, a third of the variability in measures of composition
turnover was attributable to site differences, however, unlike the taxonomy approach, 54% of the
variability was associated with marker differences leaving only 13% of the variability unexplained. These
marker differences observed with the OTUs were significantly correlated with DNA marker length as
would be expected if the assumptions about DNA persistence in the environment from past plant
growth are accurate. Less community turnover (i.e. the plant community in year one is highly similar to
the plant community in year two) would be expected when targeting a smaller fragment of DNA that
may persist long after cell death and greater community turnover would be expected when targeting a
larger fragment of DNA that can only be obtained from viable or recently shed tissues. Larger DNA
fragments might then be expected to reflect only the current belowground viable plant diversity from a
smaller spatial scale and thus be able to reveal changes in diversity on a finer spatial and temporal scale.
Why is the association between DNA marker length and community turnover apparent with the
OTU data but not with the taxonomy data? The OTUs may be partly influenced by less efficient
clustering of the larger sequences that did not have overlapping paired ends (i.e. matK and rbcL) which
would inflate temporal variability for these. But this would also inflate sampling variability in the same
way and OTU variability ratios for these loci were greater than 1 on average. The taxonomy data,
however, is limited by database coverage for each DNA marker and whether sufficient sequence
diversity exists to make unambiguous identifications of each taxon. These restrictions act as filters that
limit the observed diversity by each DNA marker to a subset of the available sequence information, in
contrast to the taxonomy-free OTU approach. This filtering of plant diversity may have obscured the

60
trend with DNA fragment length. As well, the OTU groupings can be considered a finer resolution and
this temporal pattern in plant composition may only be apparent below the genus level.
The correlation between DNA marker length and temporal variability in richness and OTU
composition could have important consequences for eDNA-based biodiversity assessments, however,
this finding is limited by the small sample of DNA markers used here. While there was no direct linear
correlation between sequence length and the sequence resolution among species for these markers
based on a comparison of known database sequences (reported as nearest neighbour pairwise distances
in Chapter 1), the observed correlation could have been confounded by some other DNA marker trait
that was not tested here. In other words, DNA markers showed differences in community turnover and
this was associated with length of the DNA marker but may not have been the direct result of variable
persistence in the environment. The research does, however, indicate the need for further study to
better understand any interaction between DNA marker length and resolution of short term temporal
changes in diversity.
Regardless, I demonstrated that choice of DNA marker can impact the magnitude of temporal
variability or turnover observed. Instead of just looking at which DNA markers recover more taxa at a
single time point, it is important for biodiversity assessments to give consideration to how DNA marker
traits such as length might affect observation of temporal change. Aside from DNA marker differences in
sequence resolution among taxa or primer specificity for different plant taxa, the added diversity from
combining DNA markers of different sizes may be due to increasing temporal depth rather than just
widening detection breadth. If the link between DNA marker length and temporal variability is
confirmed, future DNA based surveys may benefit from using primers designed to target similar sized
fragments of DNA from the desired regions to ensure added diversity is temporally equivalent.
Alternatively, researchers could intentionally exploit this relationship and choose primers to target
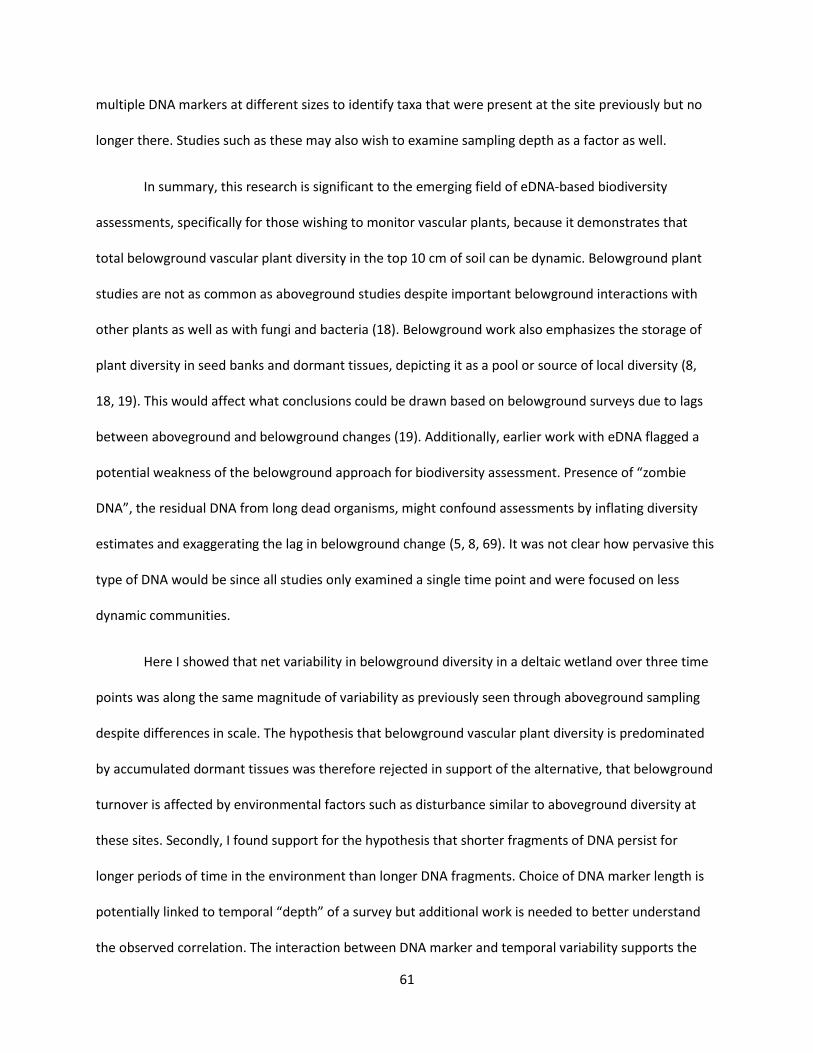
61
multiple DNA markers at different sizes to identify taxa that were present at the site previously but no
longer there. Studies such as these may also wish to examine sampling depth as a factor as well.
In summary, this research is significant to the emerging field of eDNA-based biodiversity
assessments, specifically for those wishing to monitor vascular plants, because it demonstrates that
total belowground vascular plant diversity in the top 10 cm of soil can be dynamic. Belowground plant
studies are not as common as aboveground studies despite important belowground interactions with
other plants as well as with fungi and bacteria (18). Belowground work also emphasizes the storage of
plant diversity in seed banks and dormant tissues, depicting it as a pool or source of local diversity (8,
18, 19). This would affect what conclusions could be drawn based on belowground surveys due to lags
between aboveground and belowground changes (19). Additionally, earlier work with eDNA flagged a
potential weakness of the belowground approach for biodiversity assessment. Presence of “zombie
DNA”, the residual DNA from long dead organisms, might confound assessments by inflating diversity
estimates and exaggerating the lag in belowground change (5, 8, 69). It was not clear how pervasive this
type of DNA would be since all studies only examined a single time point and were focused on less
dynamic communities.
Here I showed that net variability in belowground diversity in a deltaic wetland over three time
points was along the same magnitude of variability as previously seen through aboveground sampling
despite differences in scale. The hypothesis that belowground vascular plant diversity is predominated
by accumulated dormant tissues was therefore rejected in support of the alternative, that belowground
turnover is affected by environmental factors such as disturbance similar to aboveground diversity at
these sites. Secondly, I found support for the hypothesis that shorter fragments of DNA persist for
longer periods of time in the environment than longer DNA fragments. Choice of DNA marker length is
potentially linked to temporal “depth” of a survey but additional work is needed to better understand
the observed correlation. The interaction between DNA marker and temporal variability supports the
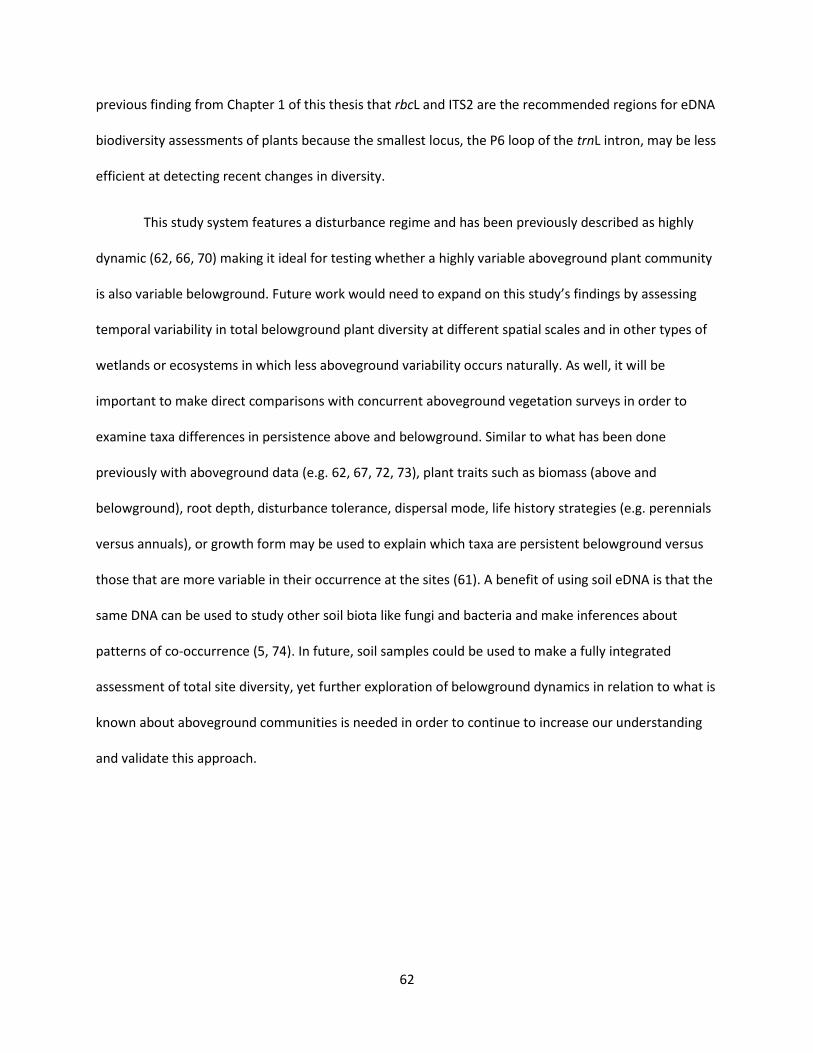
62
previous finding from Chapter 1 of this thesis that rbcL and ITS2 are the recommended regions for eDNA
biodiversity assessments of plants because the smallest locus, the P6 loop of the trnL intron, may be less
efficient at detecting recent changes in diversity.
This study system features a disturbance regime and has been previously described as highly
dynamic (62, 66, 70) making it ideal for testing whether a highly variable aboveground plant community
is also variable belowground. Future work would need to expand on this study’s findings by assessing
temporal variability in total belowground plant diversity at different spatial scales and in other types of
wetlands or ecosystems in which less aboveground variability occurs naturally. As well, it will be
important to make direct comparisons with concurrent aboveground vegetation surveys in order to
examine taxa differences in persistence above and belowground. Similar to what has been done
previously with aboveground data (e.g. 62, 67, 72, 73), plant traits such as biomass (above and
belowground), root depth, disturbance tolerance, dispersal mode, life history strategies (e.g. perennials
versus annuals), or growth form may be used to explain which taxa are persistent belowground versus
those that are more variable in their occurrence at the sites (61). A benefit of using soil eDNA is that the
same DNA can be used to study other soil biota like fungi and bacteria and make inferences about
patterns of co-occurrence (5, 74). In future, soil samples could be used to make a fully integrated
assessment of total site diversity, yet further exploration of belowground dynamics in relation to what is
known about aboveground communities is needed in order to continue to increase our understanding
and validate this approach.

63
Figures
Figure 5 Vascular plant richness from 12 sampling instances (four sites measured in three years) at order, family, and genus level. Belowground richness is shown for four DNA markers (matK, rbcL, ITS2, and trnL) as well as four combinations of markers: ITS2-rbcL (IR), ITS2-trnL (IT), rbcL-trnL (RT), and ITS2-rbcL-trnL (IRT). Soil cores were collected in 2011-2013 while aboveground (“above”) reference data from Parks Canada (unpublished monitoring data) was collected at the sites in 1996, 1998, and 2001. Boxplots represent standard 5-number summaries and the aboveground interquartile range is highlighted in light grey. Dark grey boxes indicate mean richness was significantly different from aboveground richness.

64
Figure 6 Annual variability in vascular plant diversity at four wetland sites in the Peace Athabasca Delta over three time points (2011, 2012, 2013). Variability in richness (coefficient of variation, “CV”) or in composition (simple beta diversity, “Beta”, or multivariate dispersion “MD” calculated from Jaccard dissimilarities) is based on belowground eDNA assessments with matK, rbcL, ITS2, or the trnL intron P6 loop from 2011, 2012, and 2013 or from aboveground surveys (“above”) in 1996, 1998, and 2001 (Parks Canada, unpublished monitoring data). Temporal variability was measured for order, family, genus, and OTU levels and significant differences among DNA markers and the aboveground assessments are indicated in each plot (α = 0.05) with mean separation letters . N.S. indicates no significant differences.

65
Figure 7 Temporal variability in belowground vascular plant richness (CV) or composition (simple beta diversity, Beta, or multivariate dispersion calculated from Jaccard dissimilarities, MD) for four sites in the Peace Athabasca Delta over three time points (2011, 2012, 2013) versus the length of DNA fragment used in the assessment. Lines connect measures of variability from the same site. Linear mixed effects models were used to test for significant associations between length and variability with z-score transformed data. Tests were repeated at the order, family, genus, and OTU levels and correlations, r, as well as p-values are indicated in each plot.

66
Figure 8 Mean ratio of among year variability in belowground vascular plant diversity (temporal variability) to average within year variability among soil cores (sampling variability) for richness (CV) or composition (simple beta diversity, Beta, or multivariate dispersion, MD), averaged across the four sites (A) or the four DNA markers (B). Ratios are calculated at order, family, genus, and OTU level and values less than 1 indicate where average sampling variability exceeds temporal variability. Error bars represent standard error.

67
General Conclusions
DNA metabarcoding has the potential to transform how biodiversity assessments are performed
and increase both the scale and scope of assessments for ecosystem biomonitoring programs (5). Before
this approach can be widely implemented, however, research must be conducted in order to validate
the methodology and improve our understanding of how DNA-based surveys relate to more
conventional biodiversity assessments. In this thesis, I addressed two major knowledge gaps associated
with plant biodiversity assessment using DNA metabarcoding.
First, there was a lack of consensus regarding which DNA markers were most suited to assess
plant diversity (see 8, 21, 36, 58). I compared four established plant DNA markers including the two
official plant DNA barcodes using both in silico and in situ approaches to evaluate sequence recovery,
sequence resolution among taxa, and annotation. Together, these factors and the resulting community
overlap between DNA markers indicated that future efforts to develop environmental DNA-based plant
assessments should focus on rbcL and ITS2.
Secondly, by using soil samples to assess plant diversity, we are fundamentally shifting from
measuring aboveground diversity to a belowground perspective. Belowground plant diversity has not
been studied as well as aboveground diversity, particularly not with eDNA. Soil is known to contain
active, dormant and decaying plant tissues (8, 18, 20) and since biomonitoring depends on identifying
changes at sites over time, it is necessary to understand how community turnover belowground relates
to aboveground turnover given this potential accumulation of plant tissues. To address this gap in our
understanding, I compared temporal variability in total belowground vascular plant diversity with
previously documented aboveground temporal variability and found that belowground variability was
consistent in magnitude with the aboveground observations. This preliminary study is important
because it showed that residual DNA from past years was not a major confounding factor in assessing
temporal change in the PAD wetland sites.

68
Additionally, I showed that DNA markers have potentially inherent differences in their ability to
resolve temporal changes in biodiversity. This introduced an additional consideration for selecting DNA
markers for biodiversity assessment where choice of DNA marker might influence detection of site
changes. The DNA marker differences in temporal variability seen here were correlated with length of
amplicon, adding support to the selection of rbcL and ITS2 for plant assessments because these mid-
length amplicons (e.g. 300-600 bp) might be expected to show more agreement in the community
trends they report. A more in-depth examination of this interaction is needed.
Overall this work contributes to a growing body of knowledge on DNA metabarcoding of
environmental DNA for biodiversity assessments as well as provides a new perspective on belowground
plant community dynamics. By systematically evaluating potential DNA metabarcoding loci, I advanced
the methodology for those wishing to study vascular plant diversity. Additionally, the framework I
described can be used to evaluate additional plant loci for any other taxonomic groups in future studies.
The biodiversity assessments themselves add to our knowledge of vascular plant diversity at the four
study sites. The Peace-Athabasca Delta is the largest inland delta and is a Ramsar designated wetland. It
is also a main feature of Wood Buffalo National Park, which is a UNESCO World Heritage Site.
Monitoring the Peace-Athabasca Delta continues to be of direct international importance but
biodiversity assessments using eDNA could potentially be extended to any ecosystem of interest.
This thesis also sets up new avenues for future research in this field. Results were based on a
relatively small sample size with only three time points at four sites. Increased spatial and temporal
sampling could be used to confirm the main findings and help further differentiate spatial and temporal
patterns in belowground diversity measured using eDNA at different scales. As well, results could be
compared across different wetlands or other ecosystems of monitoring interest to determine
robustness of findings. Direct comparisons with concurrent aboveground vegetation would help to
evaluate accuracy of DNA metabarcoding, refine methodology and explore differences in persistence

69
among taxa. Finally, the relationship between DNA marker traits and resolution of temporal changes
could be further explored by sequencing additional plant loci of different lengths or by repeating the
test with DNA markers for other taxonomic groups such as animals. DNA metabarcoding has the
potential to increase the efficiency and information content of biodiversity assessments and with
continued research, this approach may be used routinely in biomonitoring programs.

70
Literature Cited 1. Pereira HM & Cooper DH (2006) Towards the global monitoring of biodiversity change. Trends
Ecol. Evol. 21(3):123-129.
2. Hooper DU, et al. (2005) Effects of biodiversity on ecosystem functioning: A consensus of current knowledge. Ecol. Monogr. 75(1):3-35.
3. Chapin III FS, et al. (2000) Consequences of changing biodiversity. Nature 405(6783):234-242.
4. Wagg C, Bender SF, Widmer F, & van der Heijden MGA (2014) Soil biodiversity and soil community composition determine ecosystem multifunctionality. Proc. Natl. Acad. Sci. USA 111(14):5266-5270.
5. Baird DJ & Hajibabaei M (2012) Biomonitoring 2.0: A new paradigm in ecosystem assessment made possible by next-generation DNA sequencing. Mol. Ecol. 21(8):2039-2044.
6. Bonada N, Prat N, Resh VH, & Statzner B (2006) Developments in aquatic insect biomonitoring: A comparative analysis of recent approaches. Annu. Rev. Entomol. 51:495-523.
7. Hajibabaei M, Shokralla S, Zhou X, Singer GAC, & Baird DJ (2011) Environmental barcoding: A next-generation sequencing approach for biomonitoring applications using river benthos. PloS one 6(4):e17497.
8. Yoccoz NG, et al. (2012) DNA from soil mirrors plant taxonomic and growth form diversity. Mol. Ecol. 21(15):3647-3655.
9. Gibson J, et al. (2014) Simultaneous assessment of the macrobiome and microbiome in a bulk sample of tropical arthropods through DNA metasystematics. Proc. Natl. Acad. Sci. USA 111(22):8007-8012.
10. Hebert PDN, Cywinska A, Ball SL, & deWaard JR (2003) Biological identifications through DNA barcodes. Proc. R. Soc. Lond., Ser. B: Biol. Sci. 270(1512):313-321.
11. Hajibabaei M, Spall JL, Shokralla S, & van Konynenburg S (2012) Assessing biodiversity of a freshwater benthic macroinvertebrate community through non-destructive environmental barcoding of DNA from preservative ethanol. BMC Ecol. 12:28.
12. Ji Y, et al. (2013) Reliable, verifiable and efficient monitoring of biodiversity via metabarcoding. Ecol. Lett. 16(10):1245-1257.
13. Gibbons SM, et al. (2014) Human and environmental impacts on river sediment microbial communities. PloS one 9(5):e97435.
14. Maltby E & Acreman MC (2011) Ecosystem services of wetlands: Pathfinder for a new paradigm. Hydrol. Sci. J. 56(8):1341-1359.
15. Wilson MJ, Forrest AS, & Bayley SE (2013) Floristic quality assessment for marshes in Alberta's northern prairie and boreal regions. Aquat. Ecosyst. Health Manage. 16(3):288-299.
71
16. Miller SJ, Wardrop DH, Mahaney WM, & Brooks RP (2006) A plant-based index of biological integrity (IBI) for headwater wetlands in central Pennsylvania. Ecol. Indicators 6(2):290-312.
17. Elliott TL & Davies TJ (2014) Challenges to barcoding an entire flora. Mol. Ecol. Resour. 14(5):883-891.
18. Hiiesalu I, et al. (2012) Plant species richness belowground: Higher richness and new patterns revealed by next-generation sequencing. Mol. Ecol. 21(8):2004-2016.
19. Pärtel M, Hiiesalu I, Öpik M, & Wilson SD (2012) Below-ground plant species richness: New insights from DNA-based methods. Funct. Ecol. 26(4):775-782.
20. Levy-Booth DJ, et al. (2007) Cycling of extracellular DNA in the soil environment. Soil Biol. Biochem. 39(12):2977-2991.
21. CBOL Plant Working Group (2009) A DNA barcode for land plants. Proc. Natl. Acad. Sci. USA 106(31):12794-12797.
22. Epp LS, et al. (2012) New environmental metabarcodes for analysing soil DNA: Potential for studying past and present ecosystems. Mol. Ecol. 21(8):1821-1833.
23. Deagle BE, Eveson JP, & Jarman SN (2006) Quantification of damage in DNA recovered from
highly degraded samples a case study on DNA in faeces. Front Zool 3:11.
24. Willerslev E, et al. (2003) Diverse plant and animal genetic records from Holocene and Pleistocene sediments. Science 300(5620):791-795.
25. Hajibabaei M (2012) The golden age of DNA metasystematics. Trends Genet. 28(11):535-537.
26. Burgess KS, et al. (2011) Discriminating plant species in a local temperate flora using the rbcL+matK DNA barcode. Methods Ecol. Evol. 2(4):333-340.
27. Kesanakurti PR, et al. (2011) Spatial patterns of plant diversity below-ground as revealed by DNA barcoding. Mol. Ecol. 20(6):1289-1302.
28. Chaideftou E, Thanos CA, Bergmeier E, Kallimanis A, & Dimopoulos P (2009) Seed bank composition and above-ground vegetation in response to grazing in sub-Mediterranean oak forests (NW Greece). Plant Ecol. 201(1):255-265.
29. Mack JJ, Avdis NH, Braig EC, & Johnson DL (2008) Application of a Vegetation-Based Index of Biotic Integrity for Lake Erie coastal marshes in Ohio. Aquat. Ecosyst. Health Manage. 11(1):91-104.
30. Scherber C, et al. (2010) Bottom-up effects of plant diversity on multitrophic interactions in a biodiversity experiment. Nature 468(7323):553-556.
31. Fazekas AJ, et al. (2009) Are plant species inherently harder to discriminate than animal species using DNA barcoding markers? Mol. Ecol. Resour. 9:130-139.

72
32. Taberlet P, et al. (2007) Power and limitations of the chloroplast trnL (UAA) intron for plant DNA barcoding. Nucleic Acids Res. 35(3).
33. Valentini A, Pompanon F, & Taberlet P (2009) DNA barcoding for ecologists. Trends Ecol. Evol. 24(2):110-117.
34. Hollingsworth PM (2011) Refining the DNA barcode for land plants. Proc. Natl. Acad. Sci. USA 108(49):19451-19452.
35. Tripathi AM, et al. (2013) The Internal Transcribed Spacer (ITS) region and trnH-psbA are suitable candidate loci for DNA barcoding of tropical tree species of India. PloS one 8(2):e57934.
36. China Plant BOL Group (2011) Comparative analysis of a large dataset indicates that internal transcribed spacer (ITS) should be incorporated into the core barcode for seed plants. Proc. Natl. Acad. Sci. USA 108(49):19641-19646.
37. Song JY, et al. (2012) Extensive pyrosequencing reveals frequent intra-genomic variations of internal transcribed spacer regions of nuclear ribosomal DNA. PloS one 7(8).
38. Soininen EM, et al. (2009) Analysing diet of small herbivores: the efficiency of DNA barcoding coupled with high-throughput pyrosequencing for deciphering the composition of complex plant mixtures. Front Zool 6:16.
39. Valentini A, et al. (2009) New perspectives in diet analysis based on DNA barcoding and parallel pyrosequencing: the trnL approach. Mol. Ecol. Resour. 9(1):51-60.
40. Coissac E, Riaz T, & Puillandre N (2012) Bioinformatic challenges for DNA metabarcoding of plants and animals. Mol. Ecol. 21(8):1834-1847.
41. Delsuc F, Brinkmann H, & Philippe H (2005) Phylogenomics and the reconstruction of the tree of life. Nat. Rev. Genet. 6(5):361-375.
42. Deagle BE, Jarman SN, Coissac E, Pompanon F, & Taberlet P (2014) DNA metabarcoding and the cytochrome c oxidase subunit I marker: not a perfect match. Biol. Lett. 10(9).
43. Riaz T, et al. (2011) ecoPrimers: Inference of new DNA barcode markers from whole genome sequence analysis. Nucleic Acids Res. 39(21):e145-e145.
44. Nilsson RH, et al. (2006) Taxonomic reliability of DNA sequences in public sequence databases: a fungal perspective. PloS one 1(1):e59.
45. Blaxter M, et al. (2005) Defining operational taxonomic units using DNA barcode data. Philos Trans R Soc Lond B Biol Sci 360(1462):1935-1943.
46. Bellemain E, et al. (2010) ITS as an environmental DNA barcode for fungi: An in silico approach reveals potential PCR biases. BMC Microbiol. 10:189.

73
47. Timoney K (2013) The Delta's Physical Environment and Landforms. The Peace-Athabasca Delta: portrait of a dynamic ecosystem, (The University of Alberta Press, Edmonton, Alberta, Canada), First Ed, pp 15-57.
48. Edgar RC (2010) Search and clustering orders of magnitude faster than BLAST. Bioinformatics 26(19):2460-2461.
49. Tamura K, Stecher G, Peterson D, Filipski A, & Kumar S (2013) MEGA6: Molecular Evolutionary Genetics Analysis version 6.0. Mol. Biol. Evol.
50. R Core Team (2014) R: A language and environment for statistical computing (R Foundation for Statistical Computing, Vienna, Austria), 3.1.2.
51. Zhang Z, Schwartz S, Wagner L, & Miller W (2000) A greedy algorithm for aligning DNA sequences. J. Comput. Biol. 7(1-2):203-214.
52. Schmieder R & Edwards R (2011) Quality control and preprocessing of metagenomic datasets. Bioinformatics 27(6):863-864.
53. Masella AP, Bartram AK, Truszkowski JM, Brown DG, & Neufeld JD (2012) PANDAseq: Paired-end assembler for illumina sequences. BMC Bioinformatics 13:31.
54. Whittaker RH (1960) Vegetation of the Siskiyou Mountains, Oregon and California. Ecol. Monogr. 30(3):279-338.
55. Oksanen J, et al. (2015) Vegan: Community Ecology Package, 2.2-1.
56. Anderson MJ, Ellingsen KE, & McArdle BH (2006) Multivariate dispersion as a measure of beta diversity. Ecol. Lett. 9(6):683-693.
57. Kress WJ, Wurdack KJ, Zimmer EA, Weigt LA, & Janzen DH (2005) Use of DNA barcodes to identify flowering plants. Proc. Natl. Acad. Sci. USA 102(23):8369-8374.
58. Kress WJ & Erickson DL (2007) A two-locus global DNA barcode for land plants: The coding rbcL gene complements the non-coding trnH-psbA spacer region. PloS one 2(6):e508.
59. The Angiosperm Phylogeny Group (2009) An update of the Angiosperm Phylogeny Group classification for the orders and families of flowering plants: APG III. Bot. J. Linn. Soc. 161(2):105-121.
60. Smith AR, et al. (2006) A classification for extant ferns. Taxon:705-731.
61. Magurran AE, et al. (2010) Long-term datasets in biodiversity research and monitoring: Assessing change in ecological communities through time. Trends Ecol. Evol. 25(10):574-582.
62. Timoney K (2008) Factors influencing wetland plant communities during a flood-drawdown cycle in the Peace-Athabasca Delta, Northern Alberta, Canada. Wetlands 28(2):450-463.
74
63. Torres I, Céspedes B, Pérez B, & Moreno J (2013) Spatial relationships between the standing vegetation and the soil seed bank in a fire-prone encroached dehesa in Central Spain. Plant Ecol. 214(2):195-206.
64. Zweig CL & Kitchens WM (2009) Multi-state succession in wetlands: A novel use of state and transition models. Ecology 90(7):1900-1909.
65. van der Valk AG (1981) Succession in wetlands: A Gleasonian approach. Ecology 62(3):688-696.
66. Timoney K (2008) Rates of vegetation change in the Peace-Athabasca Delta. Wetlands 28(2):513-520.
67. Catford JA & Jansson R (2014) Drowned, buried and carried away: Effects of plant traits on the distribution of native and alien species in riparian ecosystems. New Phytol. 204(1):19-36.
68. Pinheiro J, Bates D, DebRoy S, Sarkar D, & Team RC (2014) nlme: Linear and Nonlinear Mixed Effects Models, 3.1-118.
69. Chariton A (2012) Short and informative DNA products to indirectly measure vascular plant biodiversity. Mol. Ecol. 21(15):3637-3639.
70. Timoney K (2006) Landscape cover change in the Peace-Athabasca Delta, 1927–2001. Wetlands 26(3):765-778.
71. Osterkamp WR & Hupp CR (2010) Fluvial processes and vegetation — Glimpses of the past, the present, and perhaps the future. Geomorphology 116(3–4):274-285.
72. McIntyre S, Lavorel S, Landsberg J, & Forbes TDA (1999) Disturbance response in vegetation – towards a global perspective on functional traits. J. Veg. Sci. 10(5):621-630.
73. Clarke PJ, Bell DM, & Lawes MJ (2015) Testing the shifting persistence niche concept: Plant resprouting along gradients of disturbance. Am. Nat. 185(6):747-755.
74. Gray C, et al. (2014) FORUM: Ecological networks: The missing links in biomonitoring science. J. Appl. Ecol. 51(5):1444-1449.
75. Zhang J, Kobert K, Flouri T, & Stamatakis A (2014) PEAR: a fast and accurate Illumina Paired-End reAd mergeR. Bioinformatics 30(5):614-620.
76. Edgar RC, Haas BJ, Clemente JC, Quince C, & Knight R (2011) UCHIME improves sensitivity and speed of chimera detection. Bioinformatics 27(16):2194-2200.

75
Appendix A – Metabarcoding Methodology
Sample Collection
As part of the Biomonitoring 2.0 project, three soil samples were collected for DNA analysis
from each of the four sites (PAD 03, 04, 14, and 33) by a sampling team from Environment Canada in
August of 2011, 2012, and 2013 except for site 14 in which only two samples were collected for August
2012. Surface debris and plant materials were cleared inside a square meter and then sterile syringes
were used to collect three 10 cm soil cores evenly spaced in an equilateral triangle within this square
(subsamples denoted as X, Y, and Z). This area was marked with a pin so that the location within the site
could be re-sampled in subsequent years. Each core was transferred to a labelled 50 mL tube and frozen
for transportation. Once received, the 35 samples were stored at -80°C until ready for processing.
Subsampling
Samples were thawed at 4°C prior to sub-sampling. Workbenches were wiped down with 70%
ethanol, ELIMINase® (Decon Laboratories; King of Prussia, Pennsylvania, USA) and then deionized water
before and after all lab procedures. The outside of each 50 mL tube containing a soil core was wiped
down with ELIMINase® and deionized water to remove any potential contaminants. A scoopula, also
cleaned with ELIMINase® and deionized water, was dipped in ethanol, flamed and let cool briefly before
being used to break apart the soil core within the tube. From a single core, soil was added to three lysis
bead tubes from the DNA extraction kit until they were approximately two thirds full. This was repeated
for all soil cores, flaming the scoopula in between each core. The bench was wiped down and gloves as
well as any labware were changed in between samples from different sites and years.
DNA Extraction
DNA was extracted from the 2011 and 2012 soil samples using UltraClean® Soil DNA Isolation
kits (MO BIO Laboratories; Carlsbad, California, USA) while the 2013 soil samples were extracted using

76
PowerSoil® DNA Isolation kits (MO BIO Laboratories; Carlsbad, California, USA) which replaced the
discontinued UltraClean® kit. Extractions followed kit specifications except, when using the UltraClean®
kit, twice the specified volume of the first two reagents were added to the lysis bead tubes. The
supernatent from each bead tube was divided over two 1.5 mL tubes for the next steps, resulting in six
extractions per sample. The DNA eluted from the six UltraClean® reactions (50 μL each) or three
PowerSoil® reactions (100 μL each) was pooled for each sample for a total volume of approximately 300
μL of DNA. Only samples from the same site and year were extracted at the same time to reduce risk of
cross-contamination and extraction negatives were made for each round of extraction with the 2013
samples. Samples were labelled and stored at -20°C.
PCR Amplification
During amplicon preparation, samples went through two rounds of PCR amplification for each of
the four DNA marker regions. First with unmodified primers to target and amplify the desired locus,
then with Illumina-tailed primers that added the adapter needed for sequencing. Established universal
plant primers from the Canadian Centre for DNA Barcoding (CCDB) protocols
(http://www.ccdb.ca/resources.php) were chosen for matK, rbcL, and ITS2 amplification and the
Taberlet et al., 2007 (32) primers were chosen for amplification of the P6 loop of the trnL intron. Primer
molecules were made by Integrated DNA Technologies (Coralville, Iowa, USA) and their details are
summarized in Table 3. All amplification reactions were performed in 25 μL total volumes. To minimize
risk of cross-contamination, all reactions were prepared in AirClean® 600 PCR Workstations (AirClean
Systems; Oakville, Ontario, Canada) using strip tubes with individually attached caps (Eppendorf;
Mississauga, Ontario, Canada) and two negative controls were made for every PCR master mix. Test
reactions with samples were performed for each DNA marker to optimize annealing temperatures and
reaction conditions for mixed template reactions.

77
First round amplifications were performed in triplicate for each sample to help reduce effects of
PCR bias and stock DNA was diluted to 1/10 with HyClone® HyPureTM Molecular Biology Grade Water
(GE Healthcare; Logan, Utah, USA) prior to amplification to counteract effects of PCR inhibitors common
in soil DNA extracts. The master mixes used for each locus are outlined in Table 4. Samples were run for
30 cycles using Mastercycler® pro S thermocyclers (Eppendorf; Mississauga, Ontario, Canada) and the
programs for each DNA marker are outlined in Table 5.
Gel electrophoresis was used to check the PCR products and negatives. A 1.5% agarose gel was
made with 1.5 g of UltraPureTM agarose (Life Technologies; Burlington, Ontario, Canada), 100 mL of 1x
Tris-Borate-EDTA (TBE) buffer (Fisher Scientific; Ottawa, Ontario, Canada) and 3 μL of 1% ethidium
bromide solution (Fisher Scientific; Ottawa, Ontario, Canada). Wells were loaded with 5 μL of sample
and 3 μL of loading dye and 3 μL of 100 bp DNA Ladder (New England BioLabs; Whitby, Ontario, Canada)
was used as the size standard. The gel was then run at 150 V for 30 min in TBE buffer and imaged using a
transilluminator and DSLR camera. If samples did not display a band of expected size on the gel under
these amplification conditions, they were re-run with increased template DNA, primer, magnesium
chloride, or some combination of these for up to 40 cycles.
Following successful first round amplification, replicates of matK, rbcL, and ITS2 were pooled
and purified using the MinElute® PCR Purification kit (QIAGEN; Toronto, Ontario, Canada). Purified DNA
was eluted with 30 μL of molecular biology grade water when done by hand or with 15 μL of water
when using the QIAcube automated system (QIAGEN; Toronto, Ontario, Canada). Since the trnL P6 loop
amplicons were expected to be under the minimum size required for purification, these replicate
reactions were pooled but not purified.
The Illumina adapters were added next in a second PCR and for this round only one reaction was
done per sample for each DNA marker. Master mixes for these reactions are summarized in Table 6. For
matK, two different mixes were used because half of the samples successfully amplified using the same

78
reaction conditions from the first PCR while others showed better amplification using the same master
mix as rbcL and ITS2 but with 3 mM MgCl2. Samples were run for 15 cycles on the thermocyclers using
the same programs as before, however, the annealing temperature for matK was raised to 50°C for any
samples run using the second master mix. The samples as well as reaction blanks and negative controls
carried from previous steps were checked using gel electrophoresis. Any samples that failed to produce
clear bands of expected size were re-run with increased template, primer or both for up to 20 cycles. All
samples were then purified with the MinElute® PCR Purification kit and eluted with either 15 or 30 μL of
molecular biology grade water.
Library Preparation and Sequencing
Samples to be pooled in the same sequencing run underwent dual indexing. The indices were
added through an additional 12 cycle PCR with index primers that bind to the Illumina adapter sequence
in each sample. Indexing was completed according to Illumina kit specifications and each reaction
contained 1x PCR buffer (Life Technologies; Burlington, Ontario, Canada), 2 mM MgCl2 (Life
Technologies; Burlington, Ontario, Canada), 0.2 mM dNTPs (Kapa Biosystems; Wilmington,
Massachusetts, USA), 0.02 μM of forward and reverse index primer (Illumina; San Diego, California,
USA), and 0.1 U/μL Platinum® Taq DNA polymerase (Life Technologies; Burlington, Ontario, Canada),
with 2 μL of purified, adapter ligated amplicon.
After indexing, samples were quantified using the Quant-iTTM PicoGreen® dsDNA Assay kit (Life
Technologies; Burlington, Ontario, Canada) with a BS-380 Mini-Fluorometer (Turner BioSystems;
Sunnyvale, California, USA) and then the individual libraries for a single sequencing run were pooled in
equimolar amounts. The Agencourt AMPureTM XP system (Beckman Coulter; Mississauga, Ontario,
Canada) was used to purify this combined library and remove short DNA fragments or dimers. The
pooled and purified library was quantified again with the Quant-iTTM PicoGreen® dsDNA Assay kit and
the length distribution of DNA fragments was obtained using the DNA 7500 kit for the 2100 Bioanalyzer
79
(Agilent Technologies; Santa Clara, California, USA) in order to estimate the number of DNA molecules in
solution. The library was diluted to 2 nM if being prepared for a MiSeq Reagent v2 sequencing kit or to 4
nM if being prepared for a MiSeq Reagent v3 kit (Illumina; San Diego, California, USA) and then 5% PhiX,
the internal standard, was added.
Sequencing was spread across a total of four MiSeq runs but always done in combination with
samples from other projects such that a total of approximately 65 samples were sequenced each run.
The trnL amplicons were all sequenced using MiSeq Reagent v2 kits and the ITS2 and matK amplicons
were all sequenced with MiSeq Reagent v3 kits. The rbcL amplicons for PAD 14 and 33 were sequenced
with a MiSeq Reagent v2 kit while the rbcL amplicons for PAD 03 and 04 were sequenced with MiSeq
Reagent v3 kits. Sequencing was completed according to the manufacturer’s protocol for the respective
reagent kit.
Sequence Processing
The general bioinformatics pipeline for processing raw sequences was to pair sequences, filter
for quality and length thresholds, and then dereplicate files to cluster identical sequences. After some
additional denoising, sequences were either clustered into operational taxonomic units (OTUs) or
searched against a reference database to obtain taxonomic information. Initial base calling and
separation of sequences by index was completed with the built-in MiSeq Control Software, version
2.3.0.3 (Illumina; San Diego, California, USA). For pairing and quality filtering, different protocols were
established depending on the degree of sequence overlap expected for each locus: no overlap (matK
and rbcL), partial overlap (ITS2), or complete overlap including primers (trnL intron P6 loop).
When no overlap was expected, sequences were quality and length filtered using PRINSEQ
version 0.20.2 lite (52) before pairing. In this case, primers were trimmed from 5’ ends of matK and rbcL
sequences, the 3’ ends were trimmed using a sliding window of 10 bp with steps of 5 bp to remove
sequence where bases have Phred scores less than 20, and any sequences shorter than 150 bp after
80
trimming were removed. Due to the possibility of a few bases of overlap in rbcL sequences obtained
with the MiSeq Reagent v3 kit, these sequences were also trimmed to a maximum length of 270 bp. The
reverse sequences were then reverse complemented using the seqtk package
(https://github.com/lh3/seqtk) and then concatenated to the end of the corresponding forward
sequence for a minimum length of 300 bp. Due to sequence quality score deterioration at 3’ ends
stemming from an overabundance of short non-target fragments present in the library containing all
matK amplicons, the 2013 rbcL amplicons for PAD 3 and 4, and the 2011 rbcL amplicons for PAD 3 X and
Z, these files were quality filtered with a less stringent Phred score of 10.
For the partially overlapping ITS2 sequences, PANDASEQ version 2.7 (53) was used to pair
forward and reverse reads using the PEAR algorithm (75) with a minimum overlap of 50 bp. Primers
were also trimmed and any sequences with N’s were removed. The paired sequences were then quality
trimmed using PRINSEQ with the same sliding window as before and removing any sequences less than
200 bp and any over 500 bp.
The trnL P6 loop amplicons were smaller than a single read length and each direction was
expected to contain both forward and reverse primers. PANDASEQ was again used to pair forward and
reverse reads. The default algorithm was used with a minimum overlap of 10 bp, primers were trimmed
after pairing, and any sequences with N’s were removed. Paired sequences were also quality trimmed
with PRINSEQ using the sliding window and then any sequences shorter than 10 bp or longer than 150
bp were discarded.
All paired and quality filtered sequences were then converted to FASTA format and remaining
uncalled bases were removed if necessary.
For the reference database searches, rbcL, matK, and ITS2 sequences were sorted by decreasing
length, clustered in USEARCH version 6.0.307 (48) at 99% identity for denoising, and then chimeras were
removed with the de novo UCHIME algorithm (76). Due to their small size, the trnL intron sequences

81
only underwent full length dereplication to remove exact duplicates with no further denoising required.
Cluster centroid sequences were queried against their respective databases (Table 7) using megaBLAST
version 2.2.25 (51). The megaBLAST search for matK, rbcL, and ITS2 was run using the default word size
of 28 and reported hits with a minimum 98 percent identity and E-value threshold of 10-20. Due to the
small size of the trnL P6 loop sequences, megaBLAST was run using a word size of 12 and E-value
threshold of 0.1 with the minimum of 98 percent identity. Taxonomy was retrieved and reported for the
hits tying for top score with any conflicts reported as “ambiguous”. The taxonomy output was filtered to
only retain sequences assigned to vascular plant orders based on a match covering either 90% of query
length for variable length ITS2 and trnL or a minimum 150bp for matK or rbcL which have a central gap
and only report the length of a contiguous match. A minimum of 10 sequences had to be assigned to any
taxonomic group within a sample to count it as present.
For the molecular diversity or OTU approach, FASTA files for each sample were dereplicated,
sorted by decreasing length, and then clustered at 98.5% identity using USEARCH version 7.0.1090 (48).
Since matK and rbcL were expected to have internal gaps as artifacts of the sequencing process,
parameters were set to not count internal gaps against the identity score for these loci. Chimeric
sequences were removed with the de novo UCHIME algorithm and any remaining singletons were also
removed. Cluster centroid sequences from all soil samples were pooled and then clustered again at 98%
identity to create the OTUs for each DNA marker. The ITS2 sequences were clustered at 95% due to
higher levels of expected within species sequence variation (37) and significantly greater interspecific
distances (see Chapter 1). A summary matrix was generated showing OTU membership across samples
with a minimum total cluster size of 100 and a minimum of 10 sequences required within a given sample
to count the OTU as present. The centroid sequences for these OTUs were then searched against their
respective GenBank databases using low stringency match criteria of 70% identity and an E-value of 0.1
in order to exclude non-target sequences.

82
Table 3 Primer sequences and expected amplicon sizes for each locus. Primers for matK, rbcL, and ITS2 are from the Canadian Centre for DNA Barcoding (CCDB) protocols (http://www.ccdb.ca/resources.php) and the trnL primers are from the 2007 study by Taberlet et al. (32).
Locus Expected Size Primer Name Sequence
matK 840 bp MatK-1RKIM-f 5' ACCCAGTCCATCTGGAAATCTTGGTTC 3'
MatK-3FKIM-r 5' CGTACAGTACTTTTGTGTTTACGAG 3'
rbcL a 550 bp rbcLa-F 5' ATGTCACCACAAACAGAGACTAAAGC 3'
rbcLa-R 5' GTAAAATCAAGTCCACCRCG 3'
ITS2 300-460 bp ITS2-S2F 5' ATGCGATACTTGGTGTGAAT 3'
ITS4 5' TCCTCCGCTTATTGATATGC 3'
trnL intron P6 loop
10-143 bp g 5' GGGCAATCCTGAGCCAA 3'
h 5' CCATTGAGTCTCTGCACCTATC 3'

83
Table 4 Optimized PCR conditions used for first round amplification of each locus
PCR #1 matK rbcL ITS2 trnL P6
PCR Buffer1 1x 1x 1x 1x
MgCl21 2mM 2mM 2mM 2mM
dNTP mix2 0.2mM 0.2mM 0.2mM 0.2mM
Forward Primer3 0.5μM 0.2μM 0.2μM 0.1μM
Reverse Primer3 0.5μM 0.2μM 0.2μM 0.1μM
Platinum® Taq DNA Polymerase1
0.1U/μL 0.1U/μL 0.1U/μL 0.1U/μL
DNA Template 3μL 2μL 2μL 2μL
Total Volume 25μL 25μL 25μL 25μL
1 Life Technologies; Burlington, Ontario, Canada 2 Kapa Biosystems; Wilmington, Massachusetts, USA 3 IDT; Coralville, Iowa, USA

84
Table 5 Thermocycler programs used with each locus for first and second rounds of amplification.
Cycler Conditions matK rbcL ITS2 trnL intron P6 loop
Initial 94°C 5 min 94°C 4 min 94°C 5 min 95°C 10 min
Cyc
le
Denature 94°C 30 s 94°C 30 s 94°C 30 s 95°C 30 s
Anneal 48°C 20 s 55°C 30 s 50°C 30 s 50°C 30 s
Extend 72°C 50 s 72°C 1 min 72°C 45 s -- --
Final extension 72°C 5 min 72°C 10 min 72°C 10 min -- --
Hold 10°C -- 10°C -- 10°C -- 10°C --

85
Table 6 Optimized PCR conditions for amplification of each locus with Illumina tailed primers
PCR #2 matK - 1 matK - 2 rbcL ITS2 trnL P6
PCR Buffer1 1x 1x 1x 1x 1x
MgCl21 2mM 3mM 2mM 2mM 2mM
dNTP mix2 0.2mM 0.2mM 0.2mM 0.2mM 0.2mM
Forward Primer3 0.5μM 0.2μM 0.2μM 0.2μM 0.2μM
Reverse Primer3 0.5μM 0.2μM 0.2μM 0.2μM 0.2μM
Platinum® Taq DNA Polymerase1
0.1U/μL 0.1U/μL 0.1U/μL 0.1U/μL 0.1U/μL
DNA Template 3μL 2μL 2μL 2μL 6μL
Total Volume 25μL 25μL 25μL 25μL 25μL
1 Life Technologies; Burlington, Ontario, Canada 2 Kapa Biosystems; Wilmington, Massachusetts, USA 3 IDT; Coralville, Iowa, USA
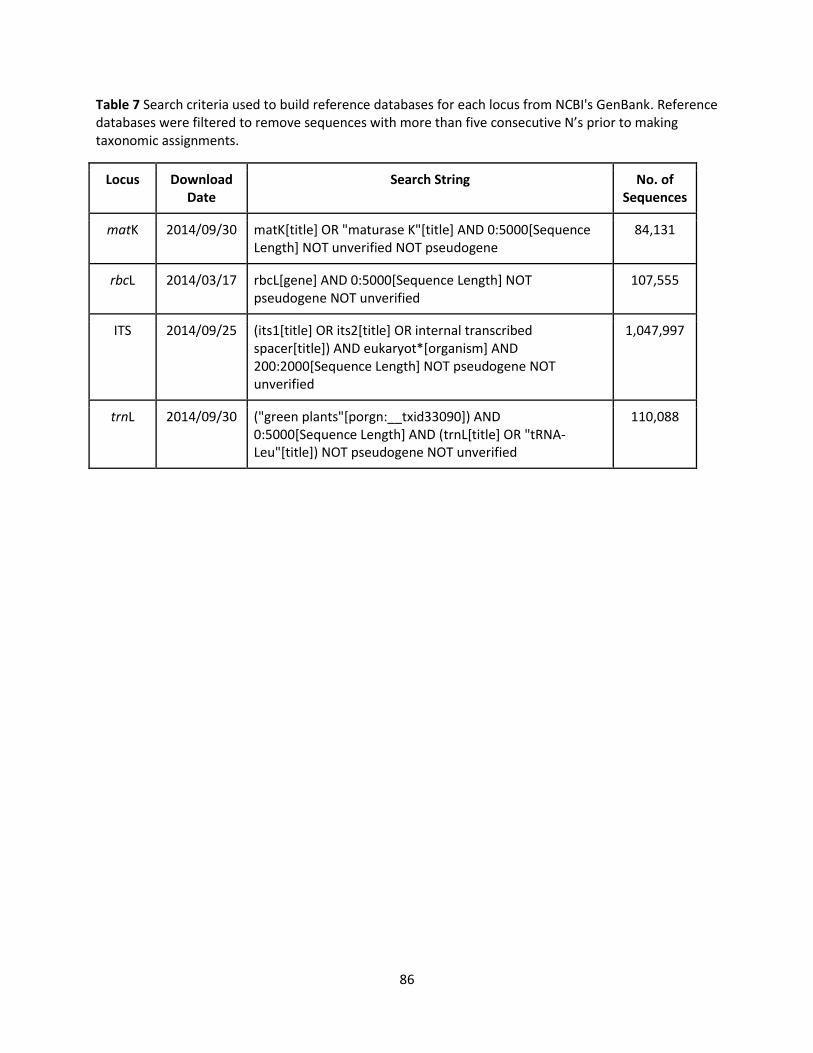
86
Table 7 Search criteria used to build reference databases for each locus from NCBI's GenBank. Reference databases were filtered to remove sequences with more than five consecutive N’s prior to making taxonomic assignments.
Locus Download Date
Search String No. of Sequences
matK 2014/09/30 matK[title] OR "maturase K"[title] AND 0:5000[Sequence Length] NOT unverified NOT pseudogene
84,131
rbcL 2014/03/17 rbcL[gene] AND 0:5000[Sequence Length] NOT pseudogene NOT unverified
107,555
ITS 2014/09/25 (its1[title] OR its2[title] OR internal transcribed spacer[title]) AND eukaryot*[organism] AND 200:2000[Sequence Length] NOT pseudogene NOT unverified
1,047,997
trnL 2014/09/30 ("green plants"[porgn:__txid33090]) AND 0:5000[Sequence Length] AND (trnL[title] OR "tRNA-Leu"[title]) NOT pseudogene NOT unverified
110,088

87
Appendix B – Database Coverage
Table 8 Summary table of vascular plant taxa previously recorded in the Peace-Athabasca Delta and associated reference sequence database coverage for rbcL, matK, trnL and ITS. The list of orders, families, genera, and species was compiled from unpublished Environment Canada monitoring data and Alberta Biodiversity Monitoring Institute data for the region. Availability of at least one reference sequence on NCBI’s GenBank is indicated by a dark shaded box while a white box indicates no available reference sequence at the time of the assessment.

88
Level Taxon rbcL matK trnL ITS Level Taxon rbcL matK trnL ITS Level Taxon rbcL matK trnL ITS
Order Acorales 1 1 1 1 Genus Aralia 1 1 1 1 Species Symphyotrichum subspicatum 0 0 0 0
Family Acoraceae 1 1 1 1 Species Aralia nudicaulis 1 1 1 1 Genus Taraxacum 1 1 1 1
Genus Acorus 1 1 1 1 Order Asparagales 1 1 1 1 Species Taraxacum officinale 1 1 1 1
Species Acorus americanus 1 1 1 1 Family Asparagaceae 1 1 1 1 Family Menyanthaceae 1 1 1 1
Order Alismatales 1 1 1 1 Genus Maianthemum 1 1 1 1 Genus Menyanthes 1 1 1 1
Family Potamogetonaceae 1 1 1 1 Species Maianthemum canadense 1 1 1 1 Species Menyanthes trifoliata 1 1 1 1
Genus Potamogeton 1 1 1 1 Species Maianthemum trifolium 1 1 1 0 Order Boraginales 1 1 1 1
Species Potamogeton friesii 1 1 1 1 Family Orchidaceae 1 1 1 1 Family Boraginaceae 1 1 1 1
Species Potamogeton gramineus 1 0 1 1 Genus Coeloglossum 1 1 1 1 Genus Mertensia 1 1 1 1
Species Potamogeton obtusifolius 1 1 1 1 Species Coeloglossum viride 1 1 1 1 Species Mertensia paniculata 1 1 1 1
Species Potamogeton pusillus 1 1 1 1 Genus Corallorhiza 1 1 0 1 Order Brassicales 1 1 1 1
Species Potamogeton richardsonii 1 1 1 1 Species Corallorhiza trifida 1 1 0 1 Family Brassicaceae 1 1 1 1
Species Potamogeton strictifolius 0 0 1 0 Genus Goodyera 1 1 1 1 Genus Barbarea 1 1 1 1
Species Potamogeton zosteriformis 1 0 0 1 Species Goodyera repens 1 1 1 1 Species Barbarea orthoceras 1 1 1 1
Genus Stuckenia 1 1 1 1 Genus Platanthera 1 1 1 1 Species Barbarea vulgaris 1 1 1 1
Species Stuckenia filiformis 1 1 1 1 Species Platanthera hyperborea 1 1 1 1 Genus Cardamine 1 1 1 1
Species Stuckenia pectinata 1 1 1 1 Order Asterales 1 1 1 1 Species Cardamine pensylvanica 1 0 1 1
Species Stuckenia vaginata 1 0 1 1 Family Asteraceae 1 1 1 1 Genus Erysimum 1 1 1 1
Family Alismataceae 1 1 1 1 Genus Achillea 1 1 1 1 Species Erysimum cheiranthoides 1 1 1 1
Genus Alisma 1 1 1 1 Species Achillea alpina 0 0 1 1 Genus Rorippa 1 1 1 1
Species Alisma plantago-aquatica 1 1 1 1 Genus Agoseris 1 1 1 1 Species Rorippa palustris 1 1 1 1
Species Alisma triviale 1 0 1 1 Species Agoseris glauca 1 0 0 0 Order Caryophyllales 1 1 1 1
Genus Sagittaria 1 1 0 1 Genus Artemisia 1 1 1 1 Family Amaranthaceae 1 1 1 1
Species Sagittaria cuneata 0 0 0 0 Species Artemisia biennis 1 1 0 1 Genus Atriplex 1 1 1 1
Family Hydrocharitaceae 1 1 0 1 Genus Bidens 1 1 1 1 Species Atriplex prostrata 1 1 0 1
Genus Elodea 1 1 0 1 Species Bidens cernua 1 1 0 1 Species Atriplex subspicata 0 0 0 0
Species Elodea canadensis 1 1 0 1 Genus Cirsium 1 1 1 1 Genus Chenopodium 1 1 1 1
Family Araceae 1 1 1 1 Species Cirsium arvense 1 1 1 1 Species Chenopodium rubrum 1 1 1 1
Genus Calla 1 1 1 0 Genus Erigeron 1 1 1 1 Family Caryophyllaceae 1 1 1 1
Species Calla palustris 1 1 1 0 Species Erigeron philadelphicus 1 1 0 1 Genus Moehringia 1 1 1 1
Genus Lemna 1 1 1 0 Genus Eurybia 1 1 1 1 Species Moehringia lateriflora 1 1 1 1
Species Lemna minor 1 1 0 0 Species Eurybia conspicua 0 0 1 1 Genus Sagina 1 1 1 1
Species Lemna trisulca 1 1 1 0 Genus Petasites 1 1 1 1 Species Sagina nivalis 0 0 1 0
Genus Spirodela 1 1 0 1 Species Petasites frigidus 1 1 1 1 Genus Stellaria 1 1 1 1
Species Spirodela polyrhiza 1 1 0 0 Genus Senecio 1 1 1 1 Species Stellaria calycantha 0 0 0 1
Order Apiales 1 1 1 1 Species Senecio congestus 1 1 1 1 Species Stellaria crassifolia 1 1 1 1
Family Apiaceae 1 1 1 1 Species Senecio eremophilus 1 1 0 1 Species Stellaria longifolia 1 1 1 1
Genus Cicuta 1 1 1 1 Genus Solidago 1 1 1 1 Species Stellaria longipes 1 1 1 1
Species Cicuta bulbifera 1 1 0 1 Species Solidago gigantea 1 1 0 1 Family Polygonaceae 1 1 1 1
Species Cicuta maculata 0 0 0 1 Species Solidago graminifolia 1 0 0 1 Genus Persicaria 1 1 1 1
Species Cicuta virosa 1 1 1 1 Genus Sonchus 1 1 1 1 Species Persicaria amphibia 1 1 1 1
Genus Heracleum 1 1 1 1 Species Sonchus arvensis 1 1 0 1 Species Persicaria lapathifolia 1 1 1 1
Species Heracleum maximum 0 1 1 1 Genus Symphyotrichum 1 1 1 1 Genus Polygonum 1 1 1 1
Genus Sium 1 1 0 1 Species Symphyotrichum ciliatum 0 0 0 1 Species Polygonum arenastrum 1 1 0 1
Species Sium suave 1 1 0 1 Species Symphyotrichum lanceolatum 1 1 0 0 Genus Rumex 1 1 1 1
Family Araliaceae 1 1 1 1 Species Symphyotrichum puniceum 1 1 0 1 Species Rumex maritimus 1 1 0 0
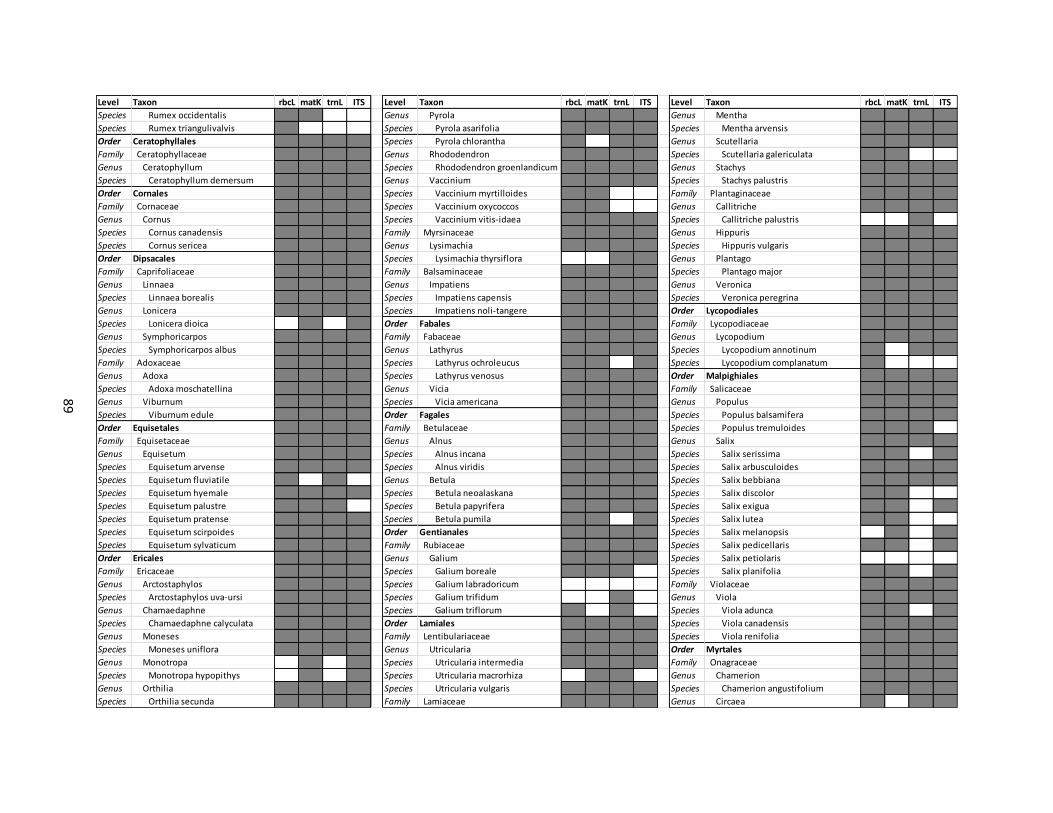
89
Level Taxon rbcL matK trnL ITS Level Taxon rbcL matK trnL ITS Level Taxon rbcL matK trnL ITS
Species Rumex occidentalis 1 1 0 0 Genus Pyrola 1 1 1 1 Genus Mentha 1 1 1 1
Species Rumex triangulivalvis 1 0 0 0 Species Pyrola asarifolia 1 1 1 1 Species Mentha arvensis 1 1 1 1
Order Ceratophyllales 1 1 1 1 Species Pyrola chlorantha 1 0 1 1 Genus Scutellaria 1 1 1 1
Family Ceratophyllaceae 1 1 1 1 Genus Rhododendron 1 1 1 1 Species Scutellaria galericulata 1 1 0 0
Genus Ceratophyllum 1 1 1 1 Species Rhododendron groenlandicum 1 1 1 1 Genus Stachys 1 1 1 1
Species Ceratophyllum demersum 1 1 1 1 Genus Vaccinium 1 1 1 1 Species Stachys palustris 1 1 1 1
Order Cornales 1 1 1 1 Species Vaccinium myrtilloides 1 1 0 0 Family Plantaginaceae 1 1 1 1
Family Cornaceae 1 1 1 1 Species Vaccinium oxycoccos 1 1 0 0 Genus Callitriche 1 1 1 1
Genus Cornus 1 1 1 1 Species Vaccinium vitis-idaea 1 1 1 1 Species Callitriche palustris 0 0 1 0
Species Cornus canadensis 1 1 1 1 Family Myrsinaceae 1 1 1 1 Genus Hippuris 1 1 1 1
Species Cornus sericea 1 1 1 1 Genus Lysimachia 1 1 1 1 Species Hippuris vulgaris 1 1 1 1
Order Dipsacales 1 1 1 1 Species Lysimachia thyrsiflora 0 0 1 1 Genus Plantago 1 1 1 1
Family Caprifoliaceae 1 1 1 1 Family Balsaminaceae 1 1 1 1 Species Plantago major 1 1 1 1
Genus Linnaea 1 1 1 1 Genus Impatiens 1 1 1 1 Genus Veronica 1 1 1 1
Species Linnaea borealis 1 1 1 1 Species Impatiens capensis 1 1 1 1 Species Veronica peregrina 1 1 1 1
Genus Lonicera 1 1 1 1 Species Impatiens noli-tangere 1 1 1 1 Order Lycopodiales 1 1 1 1
Species Lonicera dioica 0 1 0 1 Order Fabales 1 1 1 1 Family Lycopodiaceae 1 1 1 1
Genus Symphoricarpos 1 1 1 1 Family Fabaceae 1 1 1 1 Genus Lycopodium 1 1 1 1
Species Symphoricarpos albus 1 1 1 1 Genus Lathyrus 1 1 1 1 Species Lycopodium annotinum 1 0 1 1
Family Adoxaceae 1 1 1 1 Species Lathyrus ochroleucus 1 1 0 1 Species Lycopodium complanatum 1 0 0 0
Genus Adoxa 1 1 1 1 Species Lathyrus venosus 1 1 1 1 Order Malpighiales 1 1 1 1
Species Adoxa moschatellina 1 1 1 1 Genus Vicia 1 1 1 1 Family Salicaceae 1 1 1 1
Genus Viburnum 1 1 1 1 Species Vicia americana 1 1 1 1 Genus Populus 1 1 1 1
Species Viburnum edule 1 1 1 1 Order Fagales 1 1 1 1 Species Populus balsamifera 1 1 1 1
Order Equisetales 1 1 1 1 Family Betulaceae 1 1 1 1 Species Populus tremuloides 1 1 1 0
Family Equisetaceae 1 1 1 1 Genus Alnus 1 1 1 1 Genus Salix 1 1 1 1
Genus Equisetum 1 1 1 1 Species Alnus incana 1 1 1 1 Species Salix serissima 1 1 0 1
Species Equisetum arvense 1 1 1 1 Species Alnus viridis 1 1 1 1 Species Salix arbusculoides 1 1 1 1
Species Equisetum fluviatile 1 0 1 0 Genus Betula 1 1 1 1 Species Salix bebbiana 1 1 1 1
Species Equisetum hyemale 1 1 1 1 Species Betula neoalaskana 1 1 1 1 Species Salix discolor 1 1 0 0
Species Equisetum palustre 1 1 1 0 Species Betula papyrifera 1 1 1 1 Species Salix exigua 1 1 0 1
Species Equisetum pratense 1 1 1 1 Species Betula pumila 1 1 0 1 Species Salix lutea 1 1 0 0
Species Equisetum scirpoides 1 1 1 1 Order Gentianales 1 1 1 1 Species Salix melanopsis 0 1 0 1
Species Equisetum sylvaticum 1 1 1 1 Family Rubiaceae 1 1 1 1 Species Salix pedicellaris 1 1 0 1
Order Ericales 1 1 1 1 Genus Galium 1 1 1 1 Species Salix petiolaris 0 0 0 0
Family Ericaceae 1 1 1 1 Species Galium boreale 1 1 1 0 Species Salix planifolia 1 1 0 1
Genus Arctostaphylos 1 1 1 1 Species Galium labradoricum 0 0 0 0 Family Violaceae 1 1 1 1
Species Arctostaphylos uva-ursi 1 1 1 1 Species Galium trifidum 0 0 1 0 Genus Viola 1 1 1 1
Genus Chamaedaphne 1 1 1 1 Species Galium triflorum 1 0 1 0 Species Viola adunca 1 1 0 1
Species Chamaedaphne calyculata 1 1 1 1 Order Lamiales 1 1 1 1 Species Viola canadensis 1 1 1 1
Genus Moneses 1 1 1 1 Family Lentibulariaceae 1 1 1 1 Species Viola renifolia 1 1 1 1
Species Moneses uniflora 1 1 1 1 Genus Utricularia 1 1 1 1 Order Myrtales 1 1 1 1
Genus Monotropa 0 1 0 1 Species Utricularia intermedia 1 1 1 1 Family Onagraceae 1 1 1 1
Species Monotropa hypopithys 0 1 0 1 Species Utricularia macrorhiza 0 1 1 0 Genus Chamerion 1 1 1 1
Genus Orthilia 1 1 1 1 Species Utricularia vulgaris 1 1 1 1 Species Chamerion angustifolium 1 1 1 1
Species Orthilia secunda 1 1 1 1 Family Lamiaceae 1 1 1 1 Genus Circaea 1 0 1 1

90
Level Taxon rbcL matK trnL ITS Level Taxon rbcL matK trnL ITS Level Taxon rbcL matK trnL ITS
Species Circaea alpina 1 0 1 1 Genus Schoenoplectus 1 1 1 1 Genus Sparganium 1 1 1 1
Genus Epilobium 1 1 1 1 Species Schoenoplectus fluviatilis 0 0 0 0 Species Sparganium angustifolium 1 1 1 0
Species Epilobium ciliatum 0 0 1 1 Species Schoenoplectus tabernaemontani1 1 1 1 Species Sparganium eurycarpum 1 1 1 0
Species Epilobium palustre 1 1 1 1 Genus Scirpus 1 1 1 1 Genus Typha 1 1 1 1
Order Nymphaeales 1 1 1 1 Species Scirpus microcarpus 1 1 1 1 Species Typha latifolia 1 1 1 0
Family Nymphaeaceae 1 1 1 1 Genus Trichophorum 1 1 1 1 Order Polypodiales 1 1 1 1
Genus Nuphar 1 1 1 1 Species Trichophorum pumilum 1 0 1 1 Family Dryopteridaceae 1 1 1 1
Species Nuphar variegata 1 1 0 1 Family Poaceae 1 1 1 1 Genus Dryopteris 1 1 1 1
Order Pinales 1 1 1 1 Genus Agrostis 1 1 1 1 Species Dryopteris expansa 1 1 1 0
Family Pinaceae 1 1 1 1 Species Agrostis scabra 1 1 1 1 Family Onocleaceae 1 1 1 0
Genus Abies 1 1 1 1 Species Agrostis stolonifera 1 1 1 1 Genus Matteuccia 1 1 1 0
Species Abies balsamea 1 0 1 1 Genus Alopecurus 1 1 1 1 Species Matteuccia struthiopteris 1 1 1 0
Genus Larix 1 1 1 1 Species Alopecurus aequalis 1 1 1 1 Order Ranunculales 1 1 1 1
Species Larix laricina 1 1 1 1 Genus Beckmannia 1 1 1 1 Family Papaveraceae 1 1 1 1
Genus Picea 1 1 1 1 Species Beckmannia syzigachne 1 1 1 1 Genus Corydalis 1 1 1 1
Species Picea glauca 1 1 1 1 Genus Calamagrostis 1 1 1 1 Species Corydalis aurea 0 0 0 0
Species Picea mariana 1 1 1 1 Species Calamagrostis canadensis 1 1 1 1 Family Ranunculaceae 1 1 1 1
Order Poales 1 1 1 1 Species Calamagrostis stricta 1 1 1 1 Genus Actaea 1 1 1 1
Family Juncaceae 1 1 1 1 Genus Cinna 1 1 1 1 Species Actaea rubra 1 1 0 1
Genus Juncus 1 1 1 1 Species Cinna latifolia 1 1 1 1 Genus Anemone 1 1 1 1
Species Juncus arcticus 1 1 1 1 Genus Deschampsia 1 1 1 1 Species Anemone canadensis 1 0 1 1
Species Juncus bufonius 1 1 1 1 Species Deschampsia cespitosa 1 1 1 1 Genus Ranunculus 1 1 1 1
Family Cyperaceae 1 1 1 1 Genus Elyhordeum 0 0 0 0 Species Ranunculus aquatilis 1 1 0 1
Genus Carex 1 1 1 1 Species Elyhordeum macounii 0 0 0 0 Species Ranunculus cymbalaria 1 1 1 1
Species Carex aquatilis 1 1 1 1 Genus Elymus 1 1 1 1 Species Ranunculus eschscholtzii 0 1 0 1
Species Carex atherodes 0 1 0 0 Species Elymus repens 1 1 1 1 Species Ranunculus flabellaris 0 0 0 0
Species Carex brunnescens 0 1 1 1 Species Elymus trachycaulus 1 1 1 1 Species Ranunculus gmelinii 0 1 1 1
Species Carex canescens 1 1 1 1 Genus Glyceria 1 1 1 1 Species Ranunculus longirostris 0 0 0 0
Species Carex crawfordii 0 1 0 1 Species Glyceria grandis 1 1 0 1 Species Ranunculus macounii 0 1 0 1
Species Carex deweyana 1 1 1 1 Species Glyceria pulchella 1 1 0 0 Species Ranunculus pensylvanicus 0 1 0 1
Species Carex diandra 1 1 1 1 Genus Hordeum 1 1 1 1 Species Ranunculus sceleratus 1 1 1 1
Species Carex disperma 0 1 1 1 Species Hordeum jubatum 1 1 1 1 Order Rosales 1 1 1 1
Species Carex lacustris 0 1 0 0 Genus Phalaris 1 1 1 1 Family Urticaceae 1 1 1 1
Species Carex lasiocarpa 1 1 1 1 Species Phalaris arundinacea 1 1 1 1 Genus Urtica 1 1 1 1
Species Carex limosa 1 1 1 1 Genus Phragmites 1 1 1 1 Species Urtica dioica 1 1 1 1
Species Carex retrorsa 1 1 1 1 Species Phragmites australis 1 1 1 1 Family Elaeagnaceae 1 1 1 1
Species Carex rostrata 1 1 1 1 Genus Poa 1 1 1 1 Genus Shepherdia 1 1 1 1
Species Carex sartwellii 0 1 0 1 Species Poa compressa 1 1 1 1 Species Shepherdia canadensis 1 1 1 1
Species Carex sychnocephala 0 1 1 1 Species Poa interior 1 1 1 0 Family Rosaceae 1 1 1 1
Species Carex utriculata 0 1 0 1 Species Poa palustris 1 1 1 1 Genus Amelanchier 1 1 1 1
Species Carex viridula 1 1 1 1 Species Poa pratensis 1 1 1 1 Species Amelanchier alnifolia 1 1 0 1
Genus Eleocharis 1 1 1 1 Genus Puccinellia 1 1 1 1 Genus Comarum 1 1 1 1
Species Eleocharis acicularis 1 1 1 1 Species Puccinellia nuttalliana 1 1 0 1 Species Comarum palustre 1 1 1 1
Species Eleocharis palustris 1 1 1 1 Genus Scolochloa 0 1 0 1 Genus Fragaria 1 1 1 1
Genus Eriophorum 1 1 1 1 Species Scolochloa festucacea 0 1 0 1 Species Fragaria vesca 1 1 1 1
Species Eriophorum angustifolium 1 1 1 1 Family Typhaceae 1 1 1 1 Species Fragaria virginiana 1 1 1 1

91
Level Taxon rbcL matK trnL ITS
Genus Geum 1 1 1 1
Species Geum aleppicum 1 1 0 1
Species Geum macrophyllum 1 0 0 1
Genus Potentilla 1 1 1 1
Species Potentilla anserina 1 1 1 1
Species Potentilla norvegica 1 1 1 1
Species Potentilla pensylvanica 1 1 1 1
Genus Prunus 1 1 1 1
Species Prunus pensylvanica 1 1 1 1
Genus Rosa 1 1 1 1
Species Rosa acicularis 1 1 1 1
Genus Rubus 1 1 1 1
Species Rubus arcticus 0 0 1 1
Species Rubus idaeus 1 1 1 1
Species Rubus pubescens 0 0 0 1
Order Santalales 1 1 1 1
Family Santalaceae 1 1 1 1
Genus Geocaulon 1 1 1 1
Species Geocaulon lividum 1 1 1 1
Order Saxifragales 1 1 1 1
Family Saxifragaceae 1 1 1 1
Genus Mitella 1 1 1 1
Species Mitella nuda 1 1 1 1
Species Mitella pentandra 0 1 0 1
Family Grossulariaceae 1 1 1 1
Genus Ribes 1 1 1 1
Species Ribes hudsonianum 1 1 0 1
Species Ribes lacustre 1 1 0 1
Species Ribes oxyacanthoides 1 1 0 1
Species Ribes triste 1 1 1 1
Family Haloragaceae 1 1 1 1
Genus Myriophyllum 1 1 1 1
Species Myriophyllum sibiricum 1 1 1 1
Species Myriophyllum spicatum 1 1 1 1

92
Appendix C – Sequencing Processing Output Table 9 Individual soil core sequence processing summary for the OTU pipeline from numbers of raw unfiltered sequences through to numbers of vascular plant OTUs identified for matK (A), rbcL (B), trnL intron P6 loop (C), and ITS2 (D).
A.
SeqID SeqRun Locus Sample-Year Raw
Unfiltered
Pairs
Input Mean
Length
Good Pairs
Mean Length
Good
Sequence Pairs Unique Seq
Clusters at
98.5% Similarity
Non-
Chimeras
Non-singleton
Clusters
OTU
Seqences
Vascular Plant
OTU Sequences
Number of Vascular
Plant OTUs
NM01 4 matK PAD03X-2011 352325 N/A 65.3 544.8 25823 25783 24117 24109 125 1203 295 6
NM02 4 matK PAD03Y-2011 184308 N/A 123.9 536.0 53642 52255 38283 38084 1433 9166 4547 14
NM03 4 matK PAD03Z-2011 391449 N/A 136.0 425.6 150534 108201 68598 68477 4803 62773 16251 44
NM04 4 matK PAD04X-2011 370564 N/A 154.4 536.2 53872 51649 37005 36920 814 13731 1952 6
NM05 4 matK PAD04Y-2011 111035 N/A 162.1 544.3 19636 19583 18527 18519 206 238 0 0
NM06 4 matK PAD04Z-2011 327035 N/A 149.2 546.7 42258 41761 33217 33156 628 6609 885 7
NM07 4 matK PAD14X-2011 260682 N/A 117.6 458.4 92020 72900 44641 44567 2567 36508 26080 36
NM08 4 matK PAD14Y-2011 297056 N/A 107.6 494.3 64717 57435 38928 38903 1597 19019 10254 24
NM09 4 matK PAD14Z-2011 295305 N/A 97.7 507.0 62763 57017 38675 38628 1528 17728 8950 22
NM10 4 matK PAD33X-2011 199089 N/A 117.4 519.0 51982 48800 37281 37123 984 10793 2385 10
NM11 4 matK PAD33Y-2011 190230 N/A 103.1 514.2 42106 39160 30618 30494 754 8316 1013 7
NM12 4 matK PAD33Z-2011 99326 N/A 155.1 539.5 40596 39987 28877 28797 1232 6427 1634 6
NM13 4 matK PAD03X-2012 107838 N/A 120.1 530.7 15244 14898 13778 13775 158 890 209 2
NM14 4 matK PAD03Y-2012 395482 N/A 108.1 486.8 51757 44697 35716 35662 862 12458 7206 14
NM15 4 matK PAD03Z-2012 400180 N/A 86.9 519.8 35824 33928 28846 28837 455 5338 4082 18
NM16 4 matK PAD04X-2012 241827 N/A 116.5 468.7 53858 43160 31534 31498 1416 16463 12562 18
NM17 4 matK PAD04Y-2012 334404 N/A 115.5 401.6 118693 73227 49611 49560 2640 57725 50474 37
NM18 4 matK PAD04Z-2012 328391 N/A 85.9 543.0 36947 36539 31190 31144 639 3027 911 11
NM19 4 matK PAD14X-2012 147805 N/A 80.4 546.3 21651 21633 20707 20687 200 314 195 2
NM20 4 matK PAD14Y-2012 241463 N/A 111.8 479.2 37952 32355 28459 28428 519 6889 51 2
NM21 4 matK PAD33X-2012 245322 N/A 98.8 485.7 49446 41976 30476 30435 1054 13850 597 3
NM22 4 matK PAD33Y-2012 218580 N/A 105.3 520.1 51881 49308 34848 34817 1279 10413 1723 8
NM23 4 matK PAD33Z-2012 267333 N/A 125.9 457.3 67870 53218 40013 39944 1584 21210 859 10
NM24 4 matK PAD03X-2013 346265 N/A 90.7 547.2 58018 57043 43335 43294 1261 8524 0 0
NM25 4 matK PAD03Y-2013 291224 N/A 177.8 495.9 165972 138245 77640 77462 4140 71682 25717 49
NM26 4 matK PAD03Z-2013 391099 N/A 67.8 542.1 33411 33292 31127 31125 115 1719 53 1
NM27 4 matK PAD04X-2013 462337 N/A 98.6 416.3 111456 76954 55199 55154 2564 44703 39909 30
NM28 4 matK PAD04Y-2013 410308 N/A 120.1 447.1 130650 98675 70919 70613 3591 44799 37374 33
NM29 4 matK PAD04Z-2013 382087 N/A 99.2 435.4 81563 59201 38098 38053 2012 35127 22346 30
NM30 4 matK PAD14X-2013 328589 N/A 153.8 527.1 97176 88910 48254 48164 2388 38957 13232 36
NM31 4 matK PAD14Y-2013 158213 N/A 170.2 485.3 80567 65290 38635 38371 1983 33044 6665 28
NM32 4 matK PAD14Z-2013 273460 N/A 122.8 510.7 66325 59195 33786 33738 1761 25976 13928 35
NM33 4 matK PAD33X-2013 437057 N/A 69.5 534.0 39146 37900 30971 30951 678 5493 2066 8
NM34 4 matK PAD33Y-2013 459160 N/A 97.9 533.6 66486 63351 44111 44052 1347 16876 6448 22
NM35 4 matK PAD33Z-2013 360671 N/A 93.5 518.7 47742 44379 33356 33310 934 10834 4896 19

93
B.
SeqID SeqRun Locus Sample-Year Raw
Unfiltered
Pairs
Input Mean
Length
Good Pairs
Mean Length
Good
Sequence Pairs Unique Seq
Clusters at
98.5% Similarity
Non-
Chimeras
Non-singleton
Clusters
OTU
Seqences
Vascular Plant
OTU Sequences
Number of Vascular
Plant OTUs
NR18 4 rbcL PAD03X-2011 354981 N/A 60.9 402.4 40207 26368 19063 19041 794 17933 35 1
NR19 2 rbcL PAD03Y-2011 150923 N/A 261.9 539.8 119913 118295 16544 15480 1492 99108 98443 95
NR20 4 rbcL PAD03Z-2011 434895 N/A 50.9 475.6 27885 23266 16760 16633 483 9555 4989 12
NR21 2 rbcL PAD04X-2011 270895 N/A 216.5 536.6 165930 163120 19863 18394 1964 126436 101857 123
NR22 2 rbcL PAD04Y-2011 329743 N/A 256.6 536.8 237541 234559 36328 31120 3914 167064 152317 158
NR23 2 rbcL PAD04Z-2011 273976 N/A 238.3 532.2 174318 169795 27376 23111 2277 119160 54244 75
NR01 1 rbcL PAD14X-2011 157104 N/A 160.4 450.5 68306 54125 6710 5420 774 48399 15760 24
NR02 1 rbcL PAD14Y-2011 208191 N/A 110.1 441.6 32519 25385 3458 2857 606 23960 5118 18
NR03 1 rbcL PAD14Z-2011 146540 N/A 167.2 451.6 57590 47137 7288 5944 782 38990 11971 18
NR04 1 rbcL PAD33X-2011 67743 N/A 203.9 446.3 37321 32613 4874 3577 595 27914 4885 14
NR05 1 rbcL PAD33Y-2011 109970 N/A 198.0 443.8 66256 53051 6729 4643 777 46526 9280 26
NR06 1 rbcL PAD33Z-2011 82419 N/A 213.3 449.7 60483 50160 6508 4468 741 42539 9896 17
NR24 2 rbcL PAD03X-2012 449497 N/A 262.7 539.6 361035 356932 50893 41739 4712 243589 135113 184
NR25 2 rbcL PAD03Y-2012 401736 N/A 254.3 538.2 305586 301791 44544 35391 4203 215484 162537 166
NR26 2 rbcL PAD03Z-2012 466459 N/A 265.5 539.8 363351 359190 48683 44367 6081 286113 282510 293
NR27 2 rbcL PAD04X-2012 347451 N/A 266.2 539.7 294084 289001 29894 26687 2995 246835 230848 167
NR28 2 rbcL PAD04Y-2012 212022 N/A 265.6 539.8 176968 174385 18693 18037 1790 155793 154787 127
NR29 2 rbcL PAD04Z-2012 394388 N/A 266.3 539.8 335032 328516 29684 27926 2645 291854 284886 157
NR07 1 rbcL PAD14X-2012 93635 N/A 224.9 455.6 67454 46697 3569 3132 398 57693 56162 44
NR08 1 rbcL PAD14Y-2012 102386 N/A 219.9 454.3 62131 47415 5336 3991 598 48844 45356 56
NR09 1 rbcL PAD33X-2012 166705 N/A 159.5 451.3 77614 60910 5673 4791 755 61320 45189 43
NR10 1 rbcL PAD33Y-2012 166880 N/A 139.1 441.4 50843 39075 4207 3659 589 41397 26187 35
NR11 1 rbcL PAD33Z-2012 110579 N/A 190.0 453.8 66897 55061 6011 4654 690 48230 29948 37
NR30 4 rbcL PAD03X-2013 343211 N/A 126.4 537.5 116195 113273 56023 53849 2173 49822 43063 57
NR31 4 rbcL PAD03Y-2013 216976 N/A 143.8 538.3 91871 90550 52191 50764 1674 34643 34113 70
NR32 4 rbcL PAD03Z-2013 445260 N/A 51.5 538.6 21715 21641 18774 18765 104 2676 2534 10
NR33 4 rbcL PAD04X-2013 382010 N/A 115.0 520.7 106284 100276 53276 52581 2005 45640 37707 100
NR34 4 rbcL PAD04Y-2013 361940 N/A 129.1 514.0 124592 115109 57602 56814 2440 57528 48832 96
NR35 4 rbcL PAD04Z-2013 328891 N/A 137.2 539.2 133296 130387 64511 63560 1814 64393 63054 115
NR12 1 rbcL PAD14X-2013 243486 N/A 112.7 421.9 39450 28615 4120 3767 1159 28239 6318 28
NR13 1 rbcL PAD14Y-2013 171872 N/A 148.7 435.2 57724 45039 6070 4921 1090 41566 9937 26
NR14 1 rbcL PAD14Z-2013 225514 N/A 95.3 417.0 30273 21272 2790 2672 745 23500 5278 22
NR15 1 rbcL PAD33X-2013 179472 N/A 136.6 444.4 39447 31613 6043 4921 1033 27394 10355 38
NR16 1 rbcL PAD33Y-2013 186157 N/A 156.6 432.8 67005 49943 6327 4765 1133 48988 20594 50
NR17 1 rbcL PAD33Z-2013 175593 N/A 159.0 439.2 79236 60929 7226 5156 1059 56627 34617 46

94
C.
SeqID SeqRun Locus Sample-Year Raw
Unfiltered
Pairs
Input Mean
Length
Good Pairs
Mean Length
Good
Sequence Pairs Unique Seq
Clusters at
98.5% Similarity
Non-
Chimeras
Non-singleton
Clusters
OTU
Seqences
Vascular Plant
OTU Sequences
Number of Vascular
Plant OTUs
NT18 3 trnL PAD03X-2011 250988 240965 50.4 51.5 193098 3293 2108 2108 1010 187883 157631 76
NT19 3 trnL PAD03Y-2011 285309 274339 55.1 52.9 239381 3271 2119 2119 963 235923 208887 89
NT20 3 trnL PAD03Z-2011 185252 175221 49.2 48.9 127785 3513 2100 2100 964 121916 95753 60
NT21 3 trnL PAD04X-2011 286811 276378 54.8 52.8 243798 5268 3244 3244 1445 237411 199813 147
NT22 3 trnL PAD04Y-2011 281251 265117 56.8 54.1 229871 6115 3774 3774 1781 221808 195771 161
NT23 3 trnL PAD04Z-2011 217964 208078 54.7 52.1 172667 4190 2490 2490 1156 167643 36346 124
NT01 1 trnL PAD14X-2011 443772 415106 61.1 58.8 361048 9173 5327 5327 2439 349082 333968 190
NT02 1 trnL PAD14Y-2011 414192 385601 62.0 59.9 334169 8841 5204 5204 2404 320990 299162 169
NT03 1 trnL PAD14Z-2011 498075 462381 60.3 58.1 389951 9527 5577 5577 2528 377111 358051 189
NT04 1 trnL PAD33X-2011 89615 75612 47.8 44.0 54761 2451 1587 1587 703 52282 35189 62
NT05 1 trnL PAD33Y-2011 412486 380606 49.4 47.4 328915 8646 5662 5662 2651 315303 167336 246
NT06 1 trnL PAD33Z-2011 360044 332612 46.3 45.0 288496 5584 3799 3799 1751 278704 178876 156
NT24 3 trnL PAD03X-2012 223883 215499 48.1 47.1 187371 2754 1871 1871 826 184300 138331 90
NT25 3 trnL PAD03Y-2012 142893 133574 52.6 49.7 112034 3611 2302 2302 995 107273 7641 70
NT26 3 trnL PAD03Z-2012 236439 225599 24.9 25.8 175777 2147 1484 1484 688 173321 51979 55
NT27 3 trnL PAD04X-2012 284307 274397 55.2 52.9 240448 3343 2242 2242 1039 236169 209950 83
NT28 3 trnL PAD04Y-2012 247309 236368 55.9 52.6 194299 2480 1568 1568 670 192000 177067 74
NT29 3 trnL PAD04Z-2012 267906 260056 54.1 52.5 228759 2771 1786 1786 809 225952 199718 83
NT07 1 trnL PAD14X-2012 414438 385819 59.2 56.8 351753 4593 2791 2791 1305 346727 332721 160
NT08 1 trnL PAD14Y-2012 434049 400754 58.3 56.2 356676 6352 4043 4043 1808 347985 336593 168
NT09 1 trnL PAD33X-2012 525755 502011 54.6 51.9 446196 8005 4904 4904 2354 433002 378933 167
NT10 1 trnL PAD33Y-2012 389507 366499 54.9 51.8 315414 7513 4397 4397 2042 301760 260490 141
NT11 1 trnL PAD33Z-2012 435660 413529 54.1 52.0 370765 6473 4219 4219 1944 361895 324063 175
NT30 3 trnL PAD03X-2013 236921 226671 41.8 42.2 183131 2234 1422 1422 698 180103 126263 63
NT31 3 trnL PAD03Y-2013 210176 200412 50.3 48.6 158322 3368 2190 2190 993 154260 118004 84
NT32 3 trnL PAD03Z-2013 192225 179122 53.9 51.8 156856 2347 1460 1460 689 153771 132735 64
NT33 3 trnL PAD04X-2013 209345 200198 34.5 35.1 160247 2551 1617 1617 766 156401 81557 47
NT34 3 trnL PAD04Y-2013 380714 369760 48.0 47.5 325163 4086 2633 2633 1318 318756 252015 110
NT35 3 trnL PAD04Z-2013 301350 290148 30.5 31.5 232171 2508 1604 1604 765 228268 100145 66
NT12 1 trnL PAD14X-2013 393834 363967 55.0 51.5 277524 12938 6805 6805 3214 254375 141785 148
NT13 1 trnL PAD14Y-2013 295126 267406 55.6 51.1 222840 8436 4978 4978 2278 208315 181559 154
NT14 1 trnL PAD14Z-2013 307318 281132 32.5 45.1 128271 8142 4264 4264 2041 113481 50558 72
NT15 1 trnL PAD33X-2013 418295 373994 53.6 51.3 313632 9583 6202 6202 2820 299297 247896 235
NT16 1 trnL PAD33Y-2013 443014 410455 54.0 51.2 357146 10016 6443 6443 3081 340798 278881 261
NT17 1 trnL PAD33Z-2013 496982 467921 55.3 52.7 419477 8999 5579 5579 2621 407116 293362 240

95
D.
SeqID: sequence identifying code used during library preparation; SeqRun: indicates which sequencing library a sample was included in; Locus: DNA marker; Sample-Year: soil core identifier; Raw: number of sequences in the unfiltered sequencer output; Unfiltered Pairs: number of pairs if sequences were paired before filtering; Input Mean Length: mean length (bp) prior to quality and length filtering; Good Pairs Mean Length: mean sequence length (bp) after quality and length filtering; Good Sequence Pairs: number of paired sequences passing filters; Unique Seq: number of unique sequences; Clusters at 98.5% Similarity: number of distinct sequence clusters within the sample at 98.5% identity; Non-Chimeras: number of clusters left after removing chimeras; Non-singleton Clusters: number of clusters with two or more sequences; OTU Sequences: number of sequences incorporated into OTUs; Vascular Plant OTU Sequences: number of sequences incorporated into OTUs identified as belonging to vascular plants by low stringency database searching; Number of Vascular Plant OTUs: number of OTUs after all filters
SeqID SeqRun Locus Sample-Year Raw
Unfiltered
Pairs
Input Mean
Length
Good Pairs
Mean Length
Good
Sequence Pairs Unique Seq
Clusters at
98.5% Similarity
Non-
Chimeras
Non-singleton
Clusters
OTU
Seqences
Vascular Plant
OTU Sequences
Number of Vascular
Plant OTUs
NI01 2 ITS2 PAD03X-2011 282933 252210 390.8 394.5 235414 126628 46754 46551 6859 171936 3387 5
NI02 2 ITS2 PAD03Y-2011 301096 229591 368.5 363.0 212347 108045 37793 35702 4540 148022 83543 43
NI03 2 ITS2 PAD03Z-2011 408953 351952 376.5 375.5 334511 154659 55278 54872 9572 251136 5797 11
NI04 2 ITS2 PAD04X-2011 418864 362296 360.2 358.1 350160 150455 44913 42907 8715 261591 11323 13
NI05 2 ITS2 PAD04Y-2011 386350 318488 368.0 364.9 302538 142917 42357 40934 8738 215024 123401 27
NI06 2 ITS2 PAD04Z-2011 372673 324116 361.4 359.6 314374 135836 39945 38250 7545 237062 4762 7
NI07 2 ITS2 PAD14X-2011 300739 241091 325.7 358.6 130491 69466 21146 20471 4718 89766 47490 20
NI08 2 ITS2 PAD14Y-2011 362882 287558 309.2 346.4 125045 53961 14821 14216 3186 95759 36653 21
NI09 2 ITS2 PAD14Z-2011 287114 232887 325.4 358.6 126342 62069 18402 17732 4131 90416 37641 21
NI10 2 ITS2 PAD33X-2011 397008 324807 331.8 330.1 309557 99661 25679 24629 5883 263407 1407 9
NI11 2 ITS2 PAD33Y-2011 360585 305868 377.3 373.7 292560 157865 54840 53597 9197 201991 86474 35
NI12 2 ITS2 PAD33Z-2011 403949 336928 334.1 332.6 322521 102205 26954 25807 6048 268368 1079 8
NI13 2 ITS2 PAD03X-2012 350188 297125 377.5 376.0 277185 148792 53138 51868 9393 182647 5781 29
NI14 2 ITS2 PAD03Y-2012 225861 191147 362.7 368.7 170090 97943 27979 26623 4944 116167 2610 19
NI15 2 ITS2 PAD03Z-2012 283096 252216 370.6 377.3 228064 125317 38202 36745 7097 160818 2469 11
NI16 2 ITS2 PAD04X-2012 283551 241638 353.3 367.1 194903 105754 27073 25254 4891 140865 10463 33
NI17 2 ITS2 PAD04Y-2012 235139 199186 355.0 359.1 177950 84110 22539 21303 4032 132954 38170 43
NI18 2 ITS2 PAD04Z-2012 297022 244395 360.6 365.1 217380 111300 33180 31793 4631 161729 53644 35
NI19 2 ITS2 PAD14X-2012 464386 375024 357.7 354.3 355120 124802 32966 32234 7341 279467 259677 56
NI20 2 ITS2 PAD14Y-2012 418391 344225 351.6 350.3 321772 120879 30621 29962 7263 249711 231709 43
NI21 2 ITS2 PAD33X-2012 331901 292615 369.4 368.3 279883 133439 37502 35320 6809 209503 4244 18
NI22 2 ITS2 PAD33Y-2012 390683 358786 391.2 389.9 348794 173265 60202 59203 9756 246903 1119 8
NI23 2 ITS2 PAD33Z-2012 254337 217265 369.4 367.7 203225 115204 31949 28943 5625 144670 2296 12
NI24 4 ITS2 PAD03X-2013 86058 58741 345.5 355.8 52331 24664 5740 5738 1316 40523 28 1
NI25 4 ITS2 PAD03Y-2013 254974 208154 344.4 359.2 166471 92611 22337 19553 3821 119371 23695 23
NI26 4 ITS2 PAD03Z-2013 350977 264259 308.4 321.0 156802 45823 8659 8607 1959 138257 32878 14
NI27 4 ITS2 PAD04X-2013 249040 180453 352.0 348.1 167351 70743 17234 16323 1922 140042 71324 30
NI28 4 ITS2 PAD04Y-2013 219936 121725 374.3 364.3 113620 61391 23587 22631 2237 80083 56430 29
NI29 4 ITS2 PAD04Z-2013 308475 233804 344.9 354.9 200249 93260 23421 21427 3207 156414 79545 37
NI30 4 ITS2 PAD14X-2013 80667 41947 344.5 372.4 25334 19076 6524 6302 1270 16927 38 2
NI31 4 ITS2 PAD14Y-2013 317303 255125 324.9 364.0 135553 68173 15745 15328 3383 110054 4091 1
NI32 4 ITS2 PAD14Z-2013 182462 145535 338.0 360.7 100796 53165 12684 12291 2836 82784 585 5
NI33 4 ITS2 PAD33X-2013 305591 260718 346.1 351.4 229000 111984 21124 19726 5212 186629 95368 26
NI34 4 ITS2 PAD33Y-2013 313197 279127 361.9 363.0 266701 119211 26498 24738 6011 203373 20730 23
NI35 4 ITS2 PAD33Z-2013 258859 215483 351.3 355.4 189022 94194 19640 18526 4600 148045 44296 28

96
Table 10 Individual soil core sequence processing summary for the BLAST taxonomy pipeline from numbers of sequences passing quality and length filters (see Table 9 for raw sequence numbers) through to numbers of sequences assigned to vascular plant orders, families, genera, or species identified for matK (A), rbcL (B), trnL intron P6 loop (C), and ITS2 (D).
A.
SeqID Locus Sample-Year
Good
Sequence Pairs
Clusters at
99% Similarity
Not
Chimeras
Assigned
Clusters
Assigned
Seq
Assigned To
Order Level Fungi Algae
Non-vascular
Plants
Vascular
Plants
Vascular Plant
Family Seq
Vascular Plant
Genus Seq
Vascular Plant
Species Seq
NM01 matK PAD03X-2011 25823 25711 25711 1894 1900 1900 0 0 0 1900 1571 1570 183
NM02 matK PAD03Y-2011 53642 50431 50374 14821 14971 14971 0 0 0 14971 12747 12561 2653
NM03 matK PAD03Z-2011 150534 98068 97719 3039 3050 3050 0 0 0 3050 2820 944 191
NM04 matK PAD04X-2011 53872 48634 48335 3696 3703 3682 0 0 0 3682 3410 3407 589
NM05 matK PAD04Y-2011 19636 19464 19055 394 394 393 0 0 0 393 384 380 108
NM06 matK PAD04Z-2011 42258 40455 40232 2853 2857 2847 0 0 0 2847 2652 2652 472
NM07 matK PAD14X-2011 92020 65814 65749 3537 3582 3582 0 0 0 3582 3577 3576 608
NM08 matK PAD14Y-2011 64717 52965 52929 524 524 523 0 0 0 523 522 522 105
NM09 matK PAD14Z-2011 62763 53102 53082 4187 4237 4236 0 0 0 4236 4235 4234 655
NM10 matK PAD33X-2011 51982 46588 46514 8671 8701 8701 0 0 0 8701 7904 5130 1128
NM11 matK PAD33Y-2011 42106 37453 37438 6340 6343 6342 0 0 0 6342 6111 5451 2631
NM12 matK PAD33Z-2011 40596 38526 38499 4790 4796 4794 0 0 0 4794 4429 2773 561
NM13 matK PAD03X-2012 15244 14711 14630 196 196 196 0 0 0 196 169 165 24
NM14 matK PAD03Y-2012 51757 42327 42283 1419 1432 1432 0 0 0 1432 1259 1221 142
NM15 matK PAD03Z-2012 35824 32717 32703 1149 1153 1153 0 0 0 1153 1033 997 134
NM16 matK PAD04X-2012 53858 40118 40083 1951 1961 1961 0 0 0 1961 1593 1592 205
NM17 matK PAD04Y-2012 118693 66473 66404 3460 3503 3503 0 0 0 3503 3034 3031 365
NM18 matK PAD04Z-2012 36947 35840 35831 4538 4573 4573 0 0 0 4573 3931 3930 481
NM19 matK PAD14X-2012 21651 21578 21517 9277 9280 9280 0 0 0 9280 9236 9227 1349
NM20 matK PAD14Y-2012 37952 31042 30991 3222 3223 3223 0 0 0 3223 3218 3216 1350
NM21 matK PAD33X-2012 49446 39395 39285 795 795 793 0 0 0 793 760 760 431
NM22 matK PAD33Y-2012 51881 46736 46702 634 634 618 0 0 0 618 583 582 336
NM23 matK PAD33Z-2012 67870 49542 49485 4404 4405 4398 0 0 0 4398 4097 4090 2753
NM24 matK PAD03X-2013 58018 54731 54701 272 272 272 0 0 0 272 270 270 81
NM25 matK PAD03Y-2013 165972 123015 122866 4850 4958 4957 0 0 0 4957 4954 4505 2964
NM26 matK PAD03Z-2013 33411 32976 32976 482 484 484 0 0 0 484 478 477 31
NM27 matK PAD04X-2013 111456 71551 71475 33 33 33 0 0 0 33 31 31 4
NM28 matK PAD04Y-2013 130650 91974 91765 74 74 74 0 0 0 74 73 73 19
NM29 matK PAD04Z-2013 81563 52894 52752 26 26 26 0 0 0 26 24 23 17
NM30 matK PAD14X-2013 97176 80419 80210 5254 5254 5254 0 0 0 5254 5254 5249 677
NM31 matK PAD14Y-2013 80567 58788 58705 9491 9517 9515 0 0 0 9515 9508 9503 5390
NM32 matK PAD14Z-2013 66325 53016 52978 609 632 631 0 0 0 631 631 631 289
NM33 matK PAD33X-2013 39146 36490 36476 4000 4008 4008 0 0 0 4008 4004 3957 3743
NM34 matK PAD33Y-2013 66486 58774 58744 3285 3290 3290 0 0 0 3290 3236 3082 2589
NM35 matK PAD33Z-2013 47742 42113 42091 5884 5889 5889 0 0 0 5889 5782 5350 3218

97
B.
SeqID Locus Sample-Year
Good
Sequence Pairs
Clusters at
99% Similarity
Not
Chimeras
Assigned
Clusters
Assigned
Seq
Assigned To
Order Level Fungi Algae
Non-vascular
Plants
Vascular
Plants
Vascular Plant
Family Seq
Vascular Plant
Genus Seq
Vascular Plant
Species Seq
NR18 rbcL PAD03X-2011 40207 23670 23652 526 526 519 0 0 1 518 518 476 62
NR19 rbcL PAD03Y-2011 119913 100549 98834 95213 114353 113520 0 87 693 112740 112596 112051 938
NR20 rbcL PAD03Z-2011 27885 21307 21214 1729 1812 1780 0 0 0 1780 1780 1287 59
NR21 rbcL PAD04X-2011 165930 130102 124713 113571 144501 131503 0 2297 17054 112152 73202 51830 1510
NR22 rbcL PAD04Y-2011 237541 197854 188959 172542 208153 178345 0 248 15290 162807 70772 31757 4510
NR23 rbcL PAD04Z-2011 174318 138025 128978 109403 136923 130694 0 137 68891 61666 32829 13639 774
NR01 rbcL PAD14X-2011 68306 39290 36349 28574 51620 24120 0 2 3507 20611 20606 20592 691
NR02 rbcL PAD14Y-2011 32519 18627 17842 11149 18639 10012 0 2 4547 5463 5462 5448 153
NR03 rbcL PAD14Z-2011 57590 34840 32489 25286 43280 19921 0 0 3037 16884 16879 16864 344
NR04 rbcL PAD33X-2011 37321 27599 26191 22962 30380 29427 0 2022 21226 6179 6170 5716 131
NR05 rbcL PAD33Y-2011 66256 41582 38804 32667 50468 47186 0 371 33748 13067 13042 11934 3071
NR06 rbcL PAD33Z-2011 60483 39738 37140 32921 50157 48124 0 3143 32995 11986 11975 11281 337
NR24 rbcL PAD03X-2012 361035 285445 265739 246853 318718 309211 0 200 139653 169358 166712 163988 3859
NR25 rbcL PAD03Y-2012 305586 247992 232767 211200 262947 257515 0 730 63730 193055 191218 182906 10947
NR26 rbcL PAD03Z-2012 363351 278952 272460 260050 341989 340466 0 526 4316 335624 333623 330538 4425
NR27 rbcL PAD04X-2012 294084 225951 220072 210759 276674 254190 0 276 881 253033 252854 250146 1584
NR28 rbcL PAD04Y-2012 176968 148338 146474 142265 170230 169862 0 35 1105 168722 168707 168332 881
NR29 rbcL PAD04Z-2012 335032 252654 248565 239765 319179 318573 0 75 7285 311213 311171 310542 1558
NR07 rbcL PAD14X-2012 67454 29742 28798 27257 64354 44127 0 11 1295 42821 6247 5635 576
NR08 rbcL PAD14Y-2012 62131 33910 32058 28431 54416 41338 0 20 2097 39221 7093 5285 2712
NR09 rbcL PAD33X-2012 77614 43809 42071 33987 61486 57875 0 1195 6596 50084 50055 49672 7459
NR10 rbcL PAD33Y-2012 50843 28279 27201 20666 36386 35425 0 674 9782 24969 24962 24818 2736
NR11 rbcL PAD33Z-2012 66897 41332 38760 34443 58012 54475 0 1063 16642 36770 36747 36508 6478
NR30 rbcL PAD03X-2013 116195 103272 101104 67977 78928 78763 0 0 3813 74950 74946 72917 4571
NR31 rbcL PAD03Y-2013 91871 85611 84981 63433 69250 68982 0 37 313 68632 68620 67386 2865
NR32 rbcL PAD03Z-2013 21715 21260 21258 4041 4458 4458 0 0 2 4456 4456 4454 234
NR33 rbcL PAD04X-2013 106284 91282 90732 53677 61265 61045 0 0 181 60864 60860 60830 1300
NR34 rbcL PAD04Y-2013 124592 104405 103910 62991 71769 71764 0 2 1 71761 71758 71720 2887
NR35 rbcL PAD04Z-2013 133296 120117 119289 89032 101746 101486 0 0 1 101485 101482 101452 4080
NR12 rbcL PAD14X-2013 39450 22177 21782 6876 9613 8906 0 0 8001 905 905 879 397
NR13 rbcL PAD14Y-2013 57724 34420 32993 18835 30437 24470 0 0 19872 4598 4597 4564 3097
NR14 rbcL PAD14Z-2013 30273 16105 15991 4173 6172 6149 0 0 5244 905 879 746 613
NR15 rbcL PAD33X-2013 39447 24749 23806 10990 15255 14179 0 861 804 12514 12504 11701 4815
NR16 rbcL PAD33Y-2013 67005 37722 35760 18113 28728 26261 0 1767 531 23963 23742 21163 5927
NR17 rbcL PAD33Z-2013 79236 45163 42342 30911 52429 51032 0 1108 8260 41664 41636 34981 4223

98
C.
SeqID Locus Sample-Year
Good
Sequence Pairs
Clusters at
99% Similarity
Not
Chimeras
Assigned
Clusters
Assigned
Seq
Assigned To
Order Level Fungi Algae
Non-vascular
Plants
Vascular
Plants
Vascular Plant
Family Seq
Vascular Plant
Genus Seq
Vascular Plant
Species Seq
NT18 trnL PAD03X-2011 193098 N/A N/A 1570 166112 260 0 0 0 260 260 61 48
NT19 trnL PAD03Y-2011 239381 N/A N/A 2064 232125 2255 0 0 165 2090 1864 1469 1428
NT20 trnL PAD03Z-2011 127785 N/A N/A 1782 108108 19407 0 0 0 19407 19407 78 69
NT21 trnL PAD04X-2011 243798 N/A N/A 2596 229517 61122 0 0 10042 51080 51020 99 64
NT22 trnL PAD04Y-2011 229871 N/A N/A 2601 205964 88463 0 0 1556 86907 86800 320 222
NT23 trnL PAD04Z-2011 172667 N/A N/A 2209 160749 28769 0 0 5082 23687 23649 111 84
NT01 trnL PAD14X-2011 361048 N/A N/A 1955 144132 121622 0 0 5440 116182 116162 113780 1987
NT02 trnL PAD14Y-2011 334169 N/A N/A 1613 87177 74929 0 0 8415 66514 66514 63144 1020
NT03 trnL PAD14Z-2011 389951 N/A N/A 1983 161878 139509 0 0 8093 131416 131403 128020 2246
NT04 trnL PAD33X-2011 54761 N/A N/A 1375 51104 15996 0 0 10442 5554 5546 971 843
NT05 trnL PAD33Y-2011 328915 N/A N/A 2940 207981 82912 0 0 48095 34817 34798 18285 17875
NT06 trnL PAD33Z-2011 288496 N/A N/A 2931 271026 102358 0 0 68105 34253 34209 5252 4726
NT24 trnL PAD03X-2012 187371 N/A N/A 1682 163646 2944 0 0 749 2195 2192 66 60
NT25 trnL PAD03Y-2012 112034 N/A N/A 1755 99486 3174 0 0 1355 1819 1813 253 100
NT26 trnL PAD03Z-2012 175777 N/A N/A 1229 59517 4927 0 0 650 4277 4271 198 75
NT27 trnL PAD04X-2012 240448 N/A N/A 2065 233925 3089 0 0 2144 945 940 562 77
NT28 trnL PAD04Y-2012 194299 N/A N/A 1700 191360 706 0 0 305 401 401 157 75
NT29 trnL PAD04Z-2012 228759 N/A N/A 1881 218402 1674 0 0 902 772 771 494 483
NT07 trnL PAD14X-2012 351753 N/A N/A 2598 344214 217979 0 0 1032 216947 216753 530 129
NT08 trnL PAD14Y-2012 356676 N/A N/A 2653 323609 251447 0 0 1833 249614 249412 4217 2754
NT09 trnL PAD33X-2012 446196 N/A N/A 3002 398572 35676 0 0 573 35103 35086 33881 33410
NT10 trnL PAD33Y-2012 315414 N/A N/A 2325 276657 2806 0 0 161 2645 2640 1534 198
NT11 trnL PAD33Z-2012 370765 N/A N/A 2725 342086 57217 0 0 2242 54975 54916 53848 53657
NT30 trnL PAD03X-2013 183131 N/A N/A 1551 139750 19944 0 0 0 19944 19944 319 312
NT31 trnL PAD03Y-2013 158322 N/A N/A 1987 139530 2997 0 0 107 2890 2876 2618 909
NT32 trnL PAD03Z-2013 156856 N/A N/A 1560 145671 220 0 0 0 220 220 50 39
NT33 trnL PAD04X-2013 160247 N/A N/A 1199 84625 10770 0 0 0 10770 10710 10606 3384
NT34 trnL PAD04Y-2013 325163 N/A N/A 2360 267048 22217 0 0 0 22217 22070 21749 18481
NT35 trnL PAD04Z-2013 232171 N/A N/A 1411 108458 9650 0 0 1 9649 9625 9510 2912
NT12 trnL PAD14X-2013 277524 N/A N/A 1776 110380 62525 0 0 48937 13588 13308 9869 3166
NT13 trnL PAD14Y-2013 222840 N/A N/A 1199 108539 98461 0 0 13233 85228 85222 84316 22928
NT14 trnL PAD14Z-2013 128271 N/A N/A 543 31040 25362 0 0 22214 3148 3147 2799 2257
NT15 trnL PAD33X-2013 313632 N/A N/A 2775 197402 21916 0 0 1631 20285 20275 19202 17828
NT16 trnL PAD33Y-2013 357146 N/A N/A 3119 229499 29175 0 0 1331 27844 25963 13471 12303
NT17 trnL PAD33Z-2013 419477 N/A N/A 3108 298327 28696 0 0 832 27864 27758 13281 4365

99
D.
SeqID: sequence identifying code used during library preparation; Locus: DNA marker; Sample-Year: soil core identifier; Good Sequence Pairs: number of paired sequences passing filters; Clusters at 99% Similarity: number of distinct sequence clusters within the sample at 99% identity; Not Chimeras: number of clusters retained after removing chimeras; Assigned Clusters: number of clusters returned with a database hit passing identification thresholds; Assigned Seq: number of total sequences represented by clusters returned with database hits; Assigned to Order Level: number of sequences with unambiguous order level assignments; Fungi: sequences assigned to fungal orders; Algae: sequences assigned to algal orders; Non-vascular Plants: sequences assigned to non-vascular plant orders; Vascular Plants: sequences assigned to vascular plant orders; Vascular Plant Family/Genus/Species Seq: sequences assigned unambiguously to vascular plant families/genera/species
SeqID Locus Sample-Year
Good
Sequence Pairs
Clusters at
99% Similarity
Not
Chimeras
Assigned
Clusters
Assigned
Seq
Assigned To
Order Level Fungi Algae
Non-vascular
Plants
Vascular
Plants
Vascular Plant
Family Seq
Vascular Plant
Genus Seq
Vascular Plant
Species Seq
NI01 ITS2 PAD03X-2011 235414 77591 76842 6609 32482 21250 14886 2927 0 3437 3437 3437 11
NI02 ITS2 PAD03Y-2011 212347 65044 60601 11900 81171 77954 2486 4570 162 70736 70736 70736 708
NI03 ITS2 PAD03Z-2011 334511 104643 103094 23872 104663 80657 69829 6120 2 4706 4706 4706 63
NI04 ITS2 PAD04X-2011 350160 99206 92153 57133 257866 136485 123680 1910 61 10834 10834 10834 179
NI05 ITS2 PAD04Y-2011 302538 89230 84824 32313 161674 151225 28994 503 247 121481 121481 121481 82994
NI06 ITS2 PAD04Z-2011 314374 89707 83748 51329 229146 162171 155183 2225 28 4735 4735 4735 374
NI07 ITS2 PAD14X-2011 130491 44261 42156 26678 105628 72418 23128 223 60 49007 49007 49007 48600
NI08 ITS2 PAD14Y-2011 125045 32321 30578 19761 103284 76612 38541 220 266 37585 37585 37585 36776
NI09 ITS2 PAD14Z-2011 126342 37791 35939 21606 101020 62344 23754 232 55 38303 38303 38303 37641
NI10 ITS2 PAD33X-2011 309557 61630 57503 29450 210309 20556 18085 1157 215 1099 1099 1099 242
NI11 ITS2 PAD33Y-2011 292560 98843 95781 13165 81650 75807 5349 2784 2130 65544 65544 65543 57307
NI12 ITS2 PAD33Z-2011 322521 63475 59156 28577 212976 93041 90877 1215 266 683 683 683 284
NI13 ITS2 PAD03X-2012 277185 97377 94593 3752 18086 10573 1889 2125 2514 4045 4045 4045 72
NI14 ITS2 PAD03Y-2012 170090 52733 49745 8072 41933 12463 9185 1850 747 681 681 681 10
NI15 ITS2 PAD03Z-2012 228064 72873 69428 6501 39731 21521 15937 4676 276 632 632 632 13
NI16 ITS2 PAD04X-2012 194903 53657 49948 5833 29477 23800 2713 15487 1830 3770 3770 3770 74
NI17 ITS2 PAD04Y-2012 177950 43845 41230 5519 34842 32755 1613 5825 109 25208 25208 25208 246
NI18 ITS2 PAD04Z-2012 217380 66199 62909 8695 54900 52083 2000 7716 182 42185 42185 42185 31145
NI19 ITS2 PAD14X-2012 355120 78351 76717 48006 277693 267927 4966 473 706 261782 261782 261779 180362
NI20 ITS2 PAD14Y-2012 321772 73251 71395 44395 243430 237014 6648 2027 226 228113 228113 228113 140948
NI21 ITS2 PAD33X-2012 279883 74847 70338 18197 90081 9421 2982 4816 41 1582 1582 1582 140
NI22 ITS2 PAD33Y-2012 348794 108738 105867 6560 32197 3279 2219 651 50 359 359 359 300
NI23 ITS2 PAD33Z-2012 203225 62533 56707 2237 12730 6647 1504 4142 85 916 916 916 784
NI24 ITS2 PAD03X-2013 52331 14315 14302 28 60 55 10 6 1 38 38 38 0
NI25 ITS2 PAD03Y-2013 166471 44585 38751 6207 42634 39534 4687 13462 261 21124 21124 21124 215
NI26 ITS2 PAD03Z-2013 156802 26363 26004 4150 33253 33243 9 2 0 33232 33232 33232 47
NI27 ITS2 PAD04X-2013 167351 37487 35374 14299 91326 90699 1087 21060 382 68170 68170 68170 30252
NI28 ITS2 PAD04Y-2013 113620 39838 37536 14231 72096 71998 0 17188 95 54715 54715 54715 23920
NI29 ITS2 PAD04Z-2013 200249 52161 46616 20561 115058 113540 881 36079 48 76532 76532 76532 23012
NI30 ITS2 PAD14X-2013 25334 12157 11793 5605 13965 2498 2395 35 23 45 45 45 27
NI31 ITS2 PAD14Y-2013 135553 34542 33458 10576 55662 25727 20439 854 235 4199 4199 4199 4197
NI32 ITS2 PAD14Z-2013 100796 27884 26930 14627 61727 17191 16514 211 44 422 422 422 420
NI33 ITS2 PAD33X-2013 229000 53418 50165 16865 96288 72399 6138 5175 282 60804 60804 60803 60518
NI34 ITS2 PAD33Y-2013 266701 68993 61428 38452 191649 117101 105023 924 25 11129 11129 11129 10384
NI35 ITS2 PAD33Z-2013 189022 48684 45727 24391 118231 79857 45864 1168 214 32611 32611 32341 14978

100
Appendix D – Taxonomic Assignment Data
Table 11 Taxonomic assignments passing filters at order, family, and genus levels by individual soil cores (X, Y, Z) for four sites (PAD 03, 04, 14, and 33) in the Peace-Athabasca Delta over three years (2011, 2012, and 2013). Assignments are separated by DNA marker (matK, rbcL, ITS2, and P6 loop of trnL intron) and values indicate the log10 number of sequences assigned to each taxon.
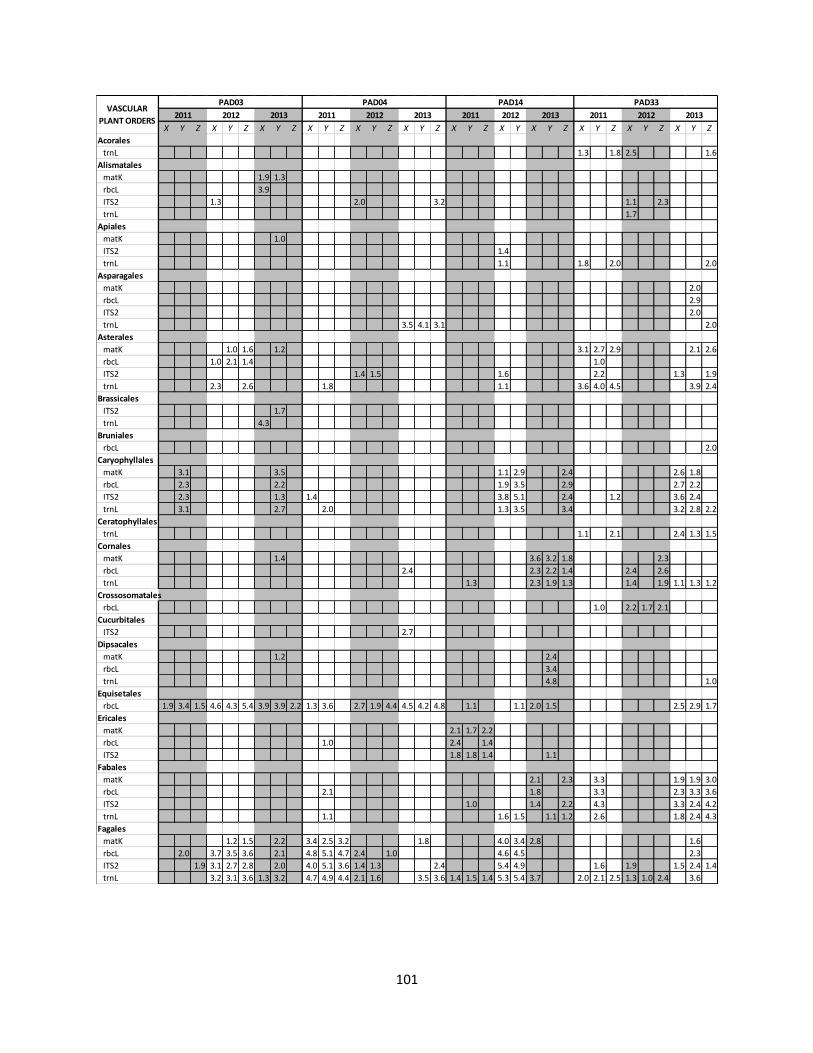
101
X Y Z X Y Z X Y Z X Y Z X Y Z X Y Z X Y Z X Y X Y Z X Y Z X Y Z X Y Z
Acorales
trnL 1.3 1.8 2.5 1.6
Alismatales
matK 1.9 1.3
rbcL 3.9
ITS2 1.3 2.0 3.2 1.1 2.3
trnL 1.7
Apiales
matK 1.0
ITS2 1.4
trnL 1.1 1.8 2.0 2.0
Asparagales
matK 2.0
rbcL 2.9
ITS2 2.0
trnL 3.5 4.1 3.1 2.0
Asterales
matK 1.0 1.6 1.2 3.1 2.7 2.9 2.1 2.6
rbcL 1.0 2.1 1.4 1.0
ITS2 1.4 1.5 1.6 2.2 1.3 1.9
trnL 2.3 2.6 1.8 1.1 3.6 4.0 4.5 3.9 2.4
Brassicales
ITS2 1.7
trnL 4.3
Bruniales
rbcL 2.0
Caryophyllales
matK 3.1 3.5 1.1 2.9 2.4 2.6 1.8
rbcL 2.3 2.2 1.9 3.5 2.9 2.7 2.2
ITS2 2.3 1.3 1.4 3.8 5.1 2.4 1.2 3.6 2.4
trnL 3.1 2.7 2.0 1.3 3.5 3.4 3.2 2.8 2.2
Ceratophyllales
trnL 1.1 2.1 2.4 1.3 1.5
Cornales
matK 1.4 3.6 3.2 1.8 2.3
rbcL 2.4 2.3 2.2 1.4 2.4 2.6
trnL 1.3 2.3 1.9 1.3 1.4 1.9 1.1 1.3 1.2
Crossosomatales
rbcL 1.0 2.2 1.7 2.1
Cucurbitales
ITS2 2.7
Dipsacales
matK 1.2 2.4
rbcL 3.4
trnL 4.8 1.0
Equisetales
rbcL 1.9 3.4 1.5 4.6 4.3 5.4 3.9 3.9 2.2 1.3 3.6 2.7 1.9 4.4 4.5 4.2 4.8 1.1 1.1 2.0 1.5 2.5 2.9 1.7
Ericales
matK 2.1 1.7 2.2
rbcL 1.0 2.4 1.4
ITS2 1.8 1.8 1.4 1.1
Fabales
matK 2.1 2.3 3.3 1.9 1.9 3.0
rbcL 2.1 1.8 3.3 2.3 3.3 3.6
ITS2 1.0 1.4 2.2 4.3 3.3 2.4 4.2
trnL 1.1 1.6 1.5 1.1 1.2 2.6 1.8 2.4 4.3
Fagales
matK 1.2 1.5 2.2 3.4 2.5 3.2 1.8 4.0 3.4 2.8 1.6
rbcL 2.0 3.7 3.5 3.6 2.1 4.8 5.1 4.7 2.4 1.0 4.6 4.5 2.3
ITS2 1.9 3.1 2.7 2.8 2.0 4.0 5.1 3.6 1.4 1.3 2.4 5.4 4.9 1.6 1.9 1.5 2.4 1.4
trnL 3.2 3.1 3.6 1.3 3.2 4.7 4.9 4.4 2.1 1.6 3.5 3.6 1.4 1.5 1.4 5.3 5.4 3.7 2.0 2.1 2.5 1.3 1.0 2.4 3.6
2013
PAD33
2011 2012 2013
PAD14VASCULAR
PLANT ORDERS2013
PAD04
2011 20122011 2012 2013
PAD03
2011 2012

102
X Y Z X Y Z X Y Z X Y Z X Y Z X Y Z X Y Z X Y X Y Z X Y Z X Y Z X Y Z
Gentianales
rbcL 1.0
trnL 2.5
Lamiales
matK 2.7
rbcL 3.5
trnL 1.4 1.3 1.3 3.3
Laurales
rbcL 1.1
Lycopodiales
rbcL 1.4 2.0 1.8 2.1 2.7 3.1 2.3 1.9 1.9 1.8 1.9 1.8 2.6 2.3 1.5 1.3 1.9 2.1 1.4 2.2
trnL 1.7 1.2 2.0 1.6 1.7 3.4 1.7 1.9 2.6 3.0 2.6 1.6 1.4 2.8 2.4 1.6 2.1 1.7 2.2
Malpighiales
matK 3.3 4.1 3.0 2.3 3.1 3.0 2.3 3.1 2.7 3.1 1.7 3.0 3.3 3.5 3.7 1.5 1.0 3.5 2.6 3.6 2.2 1.5 1.5 3.4 1.7 3.6 3.0 3.3 2.5 2.3 3.1 1.1 2.6 2.8
rbcL 2.5 5.0 3.1 5.1 5.2 4.8 4.8 4.8 3.6 4.7 4.4 4.1 5.4 5.2 5.5 4.5 4.7 4.6 2.6 2.2 2.7 3.8 3.3 2.4 3.7 3.8 4.0 4.6 4.3 4.5 3.7 4.1 4.5
ITS2 3.5 4.8 3.7 3.5 2.4 1.8 1.6 4.3 4.5 2.5 1.7 3.5 4.4 4.6 4.8 4.7 4.9 2.4 2.1 3.3 1.7 1.2 2.9 3.9 2.6 3.0 1.7 2.1 2.6 3.4
trnL 2.4 2.6 2.2 2.4 2.1 2.0 2.2 2.4 2.3 2.5 2.4 2.4 2.6 2.5 2.5 2.1 2.6 2.2 3.8 3.9 3.8 2.5 2.4 3.3 3.3 2.8 1.9 2.4 2.5 2.8 2.6 2.7 2.6 2.6 2.8
Malvales
rbcL 1.0 1.3 1.0
trnL 1.1
Myrtales
matK 1.5 1.0 3.2 1.1 3.5 3.4 3.5
rbcL 2.6 1.1 3.4 1.3 3.7 3.9 3.7
ITS2 1.9 2.7 2.8 1.3 4.5 1.6 4.7 4.0 4.1
trnL 2.6 1.8 3.6 1.6 3.9 4.0 3.6
Nymphaeales
trnL 2.8 1.7
Ophioglossales
rbcL 1.5 1.2 1.6
trnL 2.1 1.5 2.3
Paracryphiales
trnL 1.4
Pinales
rbcL 4.3 3.7 4.2 1.8
ITS2 4.7 4.6 4.6 3.9 2.3
trnL 1.8 2.5 3.9 3.3 5.0 4.8 5.1 2.6 1.6 1.1 1.3 1.4 1.3 1.3 1.2 1.3
Poales
matK 2.2 3.3 1.6 2.6 3.4 2.6 3.2 1.8 1.7
rbcL 2.7 2.4 2.1 3.9 3.1 2.9 3.1 3.4 2.1 3.1 3.0 2.9 3.3 3.3 2.9 3.0
ITS2 1.0 1.7 2.1 1.6 2.9 2.2 3.0 2.2 1.1 1.9
trnL 2.4 4.3 1.9 2.6 2.1 2.6 2.0 1.2 1.6 1.9 3.8 2.9 3.1 3.2 3.4 3.1
Polypodiales
rbcL 1.6 1.8 1.6 3.9 1.9 2.0 3.4 3.4 1.0 1.0 2.2 2.0 1.3
trnL 1.8 1.0 1.6 1.3 3.2 2.3 2.0 2.2 3.6 2.6
Ranunculales
rbcL 1.3
Rosales
matK 1.0 2.2 1.6 2.2 1.6 1.6 3.7 1.5 2.7 3.1 2.3 2.6 2.6 3.5 1.1
rbcL 1.2 1.2 3.4 1.5 2.4 1.6 1.7 3.2 1.6 3.0 2.0 3.9 3.4 3.8 1.9
ITS2 1.9 3.8 2.6 1.0 2.4 2.2 2.6 3.6 1.9 4.0 1.9 2.5 2.4 2.1 3.8 1.5 2.2
trnL 1.7 2.3 2.6 3.8 1.7 2.3 2.6 1.1 1.0 3.2 4.4 2.8 4.1 3.6 4.5 3.0 4.7 3.9 3.1
Santalales
matK 1.3
trnL 1.6 1.9
Saxifragales
matK 1.3
rbcL 2.3
ITS2 1.1 3.5 2.1 1.8 2.8
trnL 2.0 1.3 2.4 1.7 2.2
Solanales
trnL 1.1 1.6 1.0
Vitales
rbcL 1.9 2.5 3.0
2013VASCULAR
PLANT ORDERS
PAD03 PAD04 PAD14 PAD33
2011 2012 2013 2011 2012 2013 2011 2012 2013 2011 2012

103
X Y Z X Y Z X Y Z X Y Z X Y Z X Y Z X Y Z X Y X Y Z X Y Z X Y Z X Y Z
Acoraceae
trnL 1.3 1.8 2.5 1.6
Adoxaceae
matK 1.2
Amaryllidaceae
trnL 3.5 4.1 3.1
Apiaceae
matK 1.0
ITS2 1.4
trnL 1.8 2.0 2.0
Araceae
matK 1.9 1.3
rbcL 3.9
Araliaceae
trnL 1.0
Asteraceae
matK 1.0 1.6 1.2 3.1 2.7 2.9 2.1 2.6
rbcL 1.0 2.1 1.4
ITS2 1.4 1.5 1.6 2.2 1.3 1.9
trnL 2.3 2.6 1.8 1.1 3.6 4.0 4.5 3.7 2.3
Athyriaceae
rbcL 1.4 1.6 1.9 2.0 1.6
Betulaceae
matK 1.2 1.5 2.2 3.4 2.5 3.2 1.8 4.0 3.4 2.8 1.6
rbcL 1.1 3.3 3.1 3.2 2.1 4.3 4.6 4.3 1.9 2.5 2.5
ITS2 1.9 3.1 2.7 2.8 2.0 4.0 5.1 3.6 1.4 1.3 2.4 5.4 4.9 1.6 1.9 1.5 2.4 1.4
trnL 3.2 3.1 3.6 1.2 3.2 4.7 4.9 4.4 2.1 1.6 3.5 3.6 1.4 1.4 1.3 5.3 5.4 3.7 2.0 2.1 2.5 1.3 1.0 2.4 3.6
Brassicaceae
ITS2 1.7
trnL 4.3
Bruniaceae
rbcL 2.0
Cannabaceae
rbcL 1.2 1.7 1.5
trnL 1.5
Caprifoliaceae
matK 2.4
rbcL 3.4
trnL 4.8 1.0
Caryophyllaceae
matK 1.1 2.9 2.4 2.6 1.8
rbcL 1.9 3.5 2.9 2.7 2.2
ITS2 1.4 3.8 5.1 2.4 1.2 3.6 2.4
trnL 1.3 3.5 3.4 3.2 2.5
Casuarinaceae
rbcL 1.7 1.8 1.3 1.4 1.1
Ceratophyllaceae
trnL 1.1 2.1 2.4 1.3 1.5
Comandraceae
matK 1.3
trnL 1.6 1.9
Convolvulaceae
trnL 1.1 1.6
Cornaceae
matK 1.4 3.6 3.2 1.8 2.3
rbcL 2.4 2.3 2.2 1.4 2.4 2.6
trnL 1.1 2.3 1.8 1.3 1.4 1.8
Cucurbitaceae
ITS2 2.7
Cyperaceae
matK 2.4 2.4 1.0
rbcL 1.3 3.1 2.8 2.6 3.1 3.2 2.8 2.9
ITS2 2.9
trnL 1.6 1.2 1.6 1.1
Cystopteridaceae
rbcL 3.8 1.9
trnL 2.1 1.9 3.2 2.3
Dipterocarpaceae
trnL 1.1
VASCULAR PLANT
FAMILIES2013
PAD04
2011 2012 2012 2013
PAD33
2011 2012 2013
PAD14
2013
PAD03
2011 2012 2011

104
X Y Z X Y Z X Y Z X Y Z X Y Z X Y Z X Y Z X Y X Y Z X Y Z X Y Z X Y Z
Dryopteridaceae
trnL 1.2 1.7 2.0 1.7 3.4 2.2
Elaeagnaceae
matK 3.7 2.6 2.5 2.2 1.1
rbcL 3.2 1.6 2.3 1.9 1.7
ITS2 3.6 1.8 3.9 1.8 3.8
trnL 3.8 1.5 2.2 2.5 3.2 4.4 2.7 3.8 3.4 3.9
Equisetaceae
rbcL 1.9 3.4 1.5 4.6 4.3 5.4 3.9 3.9 2.2 1.3 3.6 2.7 1.9 4.4 4.5 4.2 4.8 1.1 1.1 2.0 1.5 2.5 2.9 1.7
Ericaceae
matK 2.1 1.7 2.2
rbcL 2.4 1.4
ITS2 1.8 1.8 1.4 1.1
Euphorbiaceae
rbcL 1.1 1.1 1.0 1.3 1.4 1.0 1.1
trnL 1.2 1.0
Fabaceae
matK 2.1 2.3 3.3 1.9 1.9 3.0
rbcL 2.1 1.8 3.3 2.3 3.3 3.6
ITS2 1.0 1.4 2.2 4.3 3.3 2.4 4.2
trnL 1.1 1.6 1.5 1.1 1.2 2.6 1.8 2.4 4.3
Grossulariaceae
ITS2 2.1 1.8 2.8
trnL 2.0 1.3 1.7 2.2
Guamatelaceae
rbcL 2.2 1.7 2.1
Lamiaceae
matK 2.7
rbcL 3.5
trnL 1.4 1.3 1.2 3.2
Lauraceae
rbcL 1.1
Loasaceae
trnL 1.1 1.1 1.1 1.3 1.2
Loganiaceae
rbcL 1.0
Lycopodiaceae
rbcL 1.4 2.0 1.8 2.1 2.7 3.1 2.3 1.9 1.9 1.8 1.9 1.8 2.6 2.3 1.5 1.3 1.9 2.1 1.4 2.2
trnL 1.7 1.2 2.0 1.6 1.7 3.4 1.7 1.9 2.6 3.0 2.6 1.6 1.4 2.8 2.4 1.6 2.1 1.7 2.2
Menyanthaceae
trnL 1.0
Myricaceae
rbcL 1.5 1.8 1.0
Nothofagaceae
trnL 1.0 1.3 1.0 1.6 1.3
Nymphaeaceae
trnL 2.8 1.7
Ochnaceae
rbcL 1.6 1.4 1.1 2.1 2.2 1.7 1.1 1.1
Onagraceae
matK 1.5 1.0 3.2 1.1 3.5 3.4 3.5
rbcL 2.6 1.1 3.4 1.3 3.7 3.9 3.7
ITS2 1.9 2.7 2.8 1.3 4.5 1.6 4.7 4.0 4.1
trnL 2.6 1.8 3.6 1.6 3.9 4.0 3.6
Onocleaceae
rbcL 1.6 1.6 3.4 3.4
trnL 1.7 1.0 1.6 3.2
Ophioglossaceae
rbcL 1.5 1.2 1.6
trnL 2.1 1.5 2.3
Orchidaceae
matK 2.0
rbcL 2.9
ITS2 2.0
trnL 2.0
Paracryphiaceae
trnL 1.4
Phyllanthaceae
rbcL 1.0
2013VASCULAR PLANT
FAMILIES
PAD03 PAD04 PAD14 PAD33
2011 2012 2013 2011 2012 2013 2011 2012 2013 2011 2012

105
X Y Z X Y Z X Y Z X Y Z X Y Z X Y Z X Y Z X Y X Y Z X Y Z X Y Z X Y Z
Pinaceae
rbcL 4.3 3.7 4.2 1.8
ITS2 4.7 4.6 4.6 3.9 2.3
trnL 1.8 2.5 3.9 3.3 5.0 4.8 5.1 2.6 1.6 1.1 1.3 1.4 1.3 1.3 1.2 1.3
Poaceae
matK 2.2 3.3 1.6 2.6 3.3 2.6 3.1 1.7 1.3
rbcL 2.6 2.4 2.1 3.9 3.1 2.9 3.1 3.4 2.1 2.5 2.7 2.8 2.5 1.8 2.1
ITS2 1.0 1.7 2.1 1.6 2.2 3.0 2.2 1.1 1.9
trnL 1.3 4.3 1.9 2.6 1.6 2.6 2.0 1.0 1.9 3.8 2.8 2.7 3.3 1.1
Polygonaceae
matK 3.1 3.5
rbcL 2.3 2.2
ITS2 2.3 1.2
trnL 3.1 2.7 2.0 2.4 2.2
Polypodiaceae
rbcL 1.3
Potamogetonaceae
ITS2 1.3 2.0 3.2 1.1 2.3
trnL 1.7
Rosaceae
matK 2.2 1.6 2.2 1.6 1.6 1.4 1.9 2.9 1.6 2.6 2.6 3.5
rbcL 3.4 2.4 1.6 1.7 1.3 2.9 1.3 3.9 3.4 3.8 1.5
ITS2 1.9 3.8 2.6 1.0 2.4 2.2 2.5 2.9 2.5 2.4 2.1 1.5 2.2
trnL 1.7 2.3 2.6 1.4 1.6 1.6 1.1 2.1 3.9 3.0 4.5 3.0 4.7 3.1
Rubiaceae
trnL 2.5
Salicaceae
matK 3.2 4.0 2.9 2.2 3.1 3.0 2.3 3.1 2.7 3.0 1.6 2.9 3.2 3.5 3.6 1.4 3.5 2.6 3.6 2.0 1.4 1.5 3.4 1.7 3.6 2.9 3.3 2.5 2.3 3.0 2.5 2.7
rbcL 2.5 5.0 3.1 5.1 5.2 4.8 4.8 4.8 3.6 4.7 4.4 4.1 5.4 5.2 5.5 4.5 4.7 4.6 2.6 2.2 2.7 3.8 3.3 2.4 3.7 3.8 4.0 4.6 4.3 4.5 3.7 4.1 4.5
ITS2 3.5 4.8 3.7 3.5 2.4 1.8 1.6 4.3 4.5 2.5 1.7 3.5 4.4 4.6 4.8 4.7 4.9 2.4 2.1 3.3 1.7 1.2 2.9 3.9 2.6 3.0 1.7 2.1 2.6 3.4
trnL 2.4 2.6 2.2 2.4 2.1 2.0 2.2 2.4 2.3 2.4 2.3 2.4 2.6 2.5 2.5 2.1 2.6 2.2 3.8 3.9 3.8 2.3 2.3 3.3 3.3 2.8 1.8 2.4 2.5 2.8 2.6 2.7 2.6 2.6 2.8
Saxifragaceae
matK 1.3
rbcL 2.3
ITS2 1.1 3.5
trnL 2.4
Thymelaeaceae
rbcL 1.2
Ticodendraceae
rbcL 1.9 1.7 1.7 2.4 2.7 2.3
Typhaceae
matK 1.5
rbcL 1.6
trnL 1.2 1.9 2.0 2.1 3.1 3.0 2.9 3.1
Ulmaceae
rbcL 1.1 1.9
Urticaceae
trnL 1.0 1.6 2.0
Vitaceae
rbcL 1.9 2.5 3.0
Woodsiaceae
rbcL 2.1
2012 2013VASCULAR PLANT
FAMILIES
PAD03 PAD04 PAD14 PAD33
2011 2012 2013 2011 2012 2013 2011 2012 2013 2011

106
X Y Z X Y Z X Y Z X Y Z X Y Z X Y Z X Y Z X Y X Y Z X Y Z X Y Z X Y Z
Abies
trnL 3.6
Acorus
trnL 1.3 1.8 2.5 1.6
Agrostis
matK 1.5
rbcL 2.2 1.0 1.6 1.7 1.2
Aira
rbcL 1.1 1.4 1.2
Allium
trnL 3.5 4.1 3.1
Allocasuarina
rbcL 1.7 1.8 1.2 1.4 1.1
Alnus
matK 2.2 1.5 1.4 2.0 1.6 2.8
rbcL 1.4
ITS2 2.0
trnL 2.1 1.5 3.2 2.1 1.6 3.5 3.6 3.7
Alopecurus
matK 1.1
Amphibromus
rbcL 1.6 2.2 1.1
Arctostaphylos
ITS2 1.1
Arctotis
trnL 1.0
Arenaria
rbcL 1.7
trnL 3.0 1.8
Arrhenatherum
rbcL 1.4
Ateleia
rbcL 1.1
Athyrium
rbcL 1.4 1.5 1.9 2.0 1.6
Banara
trnL 1.5 1.8 1.6 1.4 1.4 1.1 1.4 1.7 1.5 1.6 1.4 1.8 1.8 1.8 1.6 1.5 1.7 1.4 1.4 1.1 1.1 1.0 1.4 1.6 1.8 1.8 1.7 1.6 1.7 1.7
Betonica
rbcL 1.7
Betula
matK 1.1 1.4 3.3 2.3 3.2 1.6 3.9 3.3 1.6
rbcL 1.8 1.7 1.9 2.7 3.1 2.5 2.2 2.3
ITS2 1.9 3.1 2.7 2.8 4.0 5.1 3.6 1.2 1.2 2.4 5.4 4.9 1.6 1.9 1.5 2.4 1.4
Bidens
matK 1.4
Boechera
ITS2 1.7
Botrychium
rbcL 1.5 1.2 1.6
trnL 2.1 1.5 2.3
Brassica
trnL 2.4
Briza
rbcL 2.1 2.0
Calamagrostis
matK 1.3
rbcL 1.5 1.5 1.3 1.4 1.4
ITS2 1.7 1.4
trnL 1.0
Calla
matK 1.2
Cannabis
trnL 1.5
Carex
matK 2.4 2.4 1.0
rbcL 2.7 2.8 2.5 3.1 3.2 2.8 2.9
ITS2 2.9
trnL 1.6 1.1 1.5 1.1
VASCULAR PLANT
GENERA
PAD03 PAD04 PAD14 PAD33
2011 2012 2013 2011 2012 20132013 2011 2012 2013 2011 2012

107
X Y Z X Y Z X Y Z X Y Z X Y Z X Y Z X Y Z X Y X Y Z X Y Z X Y Z X Y Z
Carpinus
matK 1.0 2.6 1.9 2.5 1.2 3.1 2.6 1.5
Carthamus
trnL 1.4 1.6 1.0
Celtis
rbcL 1.2 1.7 1.5
Ceratophyllum
trnL 1.1 2.1 2.4 1.3 1.5
Chamerion
matK 1.5 1.0 3.2 1.0 3.5 3.4 3.5
rbcL 2.4 1.1 3.3 1.0 3.6 3.7 3.5
ITS2 1.9 2.7 2.8 1.3 4.5 1.6 4.7 4.0 4.1
trnL 2.6 1.7 3.5 1.6 3.9 4.0 3.6
Chascolytrum
matK 1.3 1.0
trnL 1.6 1.3 1.5
Cicuta
ITS2 1.4
trnL 1.8 2.0 2.0
Cissus
rbcL 1.5
Clematicissus
rbcL 1.1
Cornus
matK 1.4 3.6 3.2 1.8 2.3
rbcL 2.4 2.3 2.2 1.4 2.4 2.6
trnL 1.1 2.3 1.8 1.3 1.4 1.8
Corylus
rbcL 1.9 1.6 1.7 2.3 2.6 2.1 1.8 1.7
Crepidiastrum
trnL 1.1 1.3 1.7 1.0
Cucumis
ITS2 2.7
Dactylis
rbcL 1.4 1.0 1.1 2.6 1.6 2.2 2.3 1.0
Dasyphyllum
trnL 1.3 1.7 1.0
Diphasiastrum
rbcL 1.4 1.1 1.7 3.0 1.9 1.0 1.1 1.4 1.3 1.9 1.2 1.0 1.0 1.8
Diuris
trnL 2.0
Dryopteris
trnL 1.2
Echinops
trnL 1.2
Elaeagnus
trnL 1.1
Epilobium
matK 1.3 1.5 1.4 1.2
Equisetum
rbcL 1.9 3.4 1.5 4.6 4.3 5.4 3.9 3.9 2.2 1.3 3.6 2.7 1.9 4.4 4.5 4.2 4.8 1.1 1.1 2.0 1.5 2.5 2.9 1.7
Evolvulus
trnL 1.0
Fallugia
trnL 1.3
Fragaria
rbcL 1.0
Fuchsia
rbcL 1.7 2.1 2.2 2.4
Galium
trnL 2.5
Geocaulon
matK 1.3
trnL 1.6 1.9
Glyceria
ITS2 1.6
Guamatela
rbcL 2.2 1.7 2.1
2013VASCULAR PLANT
GENERA
PAD03 PAD04 PAD14 PAD33
2011 2012 2013 2011 2012 2013 2011 2012 2013 2011 2012

108
X Y Z X Y Z X Y Z X Y Z X Y Z X Y Z X Y Z X Y X Y Z X Y Z X Y Z X Y Z
Gymnocarpium
rbcL 3.8 1.9
trnL 2.1 1.9 3.2 2.3
Hauya
rbcL 1.6 1.4 1.2
Hierochloe
rbcL 1.2
Hippophae
matK 2.1 1.6
rbcL 1.4
Hoffmannseggia
rbcL 1.7
Homalium
trnL 1.1
Hymenolobus
trnL 1.0
Idesia
trnL 2.0 2.0 2.1 1.5 1.4
Kobresia
rbcL 1.5
Koeleria
rbcL 1.2 1.4
Lachnagrostis
rbcL 1.6 1.0
Lactuca
rbcL 1.7
trnL 1.8
Lathyrus
matK 3.0
rbcL 1.0 1.3
ITS2 4.2
trnL 3.9
Lemna
matK 1.9
rbcL 3.8
Logfia
trnL 1.2 2.0 1.1
Lonchostoma
rbcL 2.0
Lonicera
matK 2.4
rbcL 3.4
trnL 4.8 1.0
Lophozonia
trnL 1.0 1.3 1.0 1.6 1.3
Lycopodium
rbcL 1.4 1.8 1.7 1.9 2.7 1.9 1.8 1.9 1.6 1.7 1.5 2.4 2.3 1.8 2.1 1.4 1.7
Matteuccia
rbcL 1.6 1.6 3.4 3.4
trnL 1.7 1.0 1.6 3.2
Medicago
trnL 1.3
Micranthes
rbcL 1.5
Minuartia
ITS2 1.1
Mitella
matK 1.3
rbcL 1.6
ITS2 1.1 3.5
Moehringia
matK 1.1 2.9 2.4 2.6 1.8
rbcL 1.6 3.3 2.7 2.6 2.1
ITS2 1.4 3.8 5.1 2.4 1.2 3.6 2.4
trnL 1.3 3.4 3.3 3.1 2.5
Morella
rbcL 1.0
2013 2011 2012 2013VASCULAR PLANT
GENERA
PAD03 PAD04 PAD14 PAD33
2011 2012 2013 2011 2012 2013 2011 2012
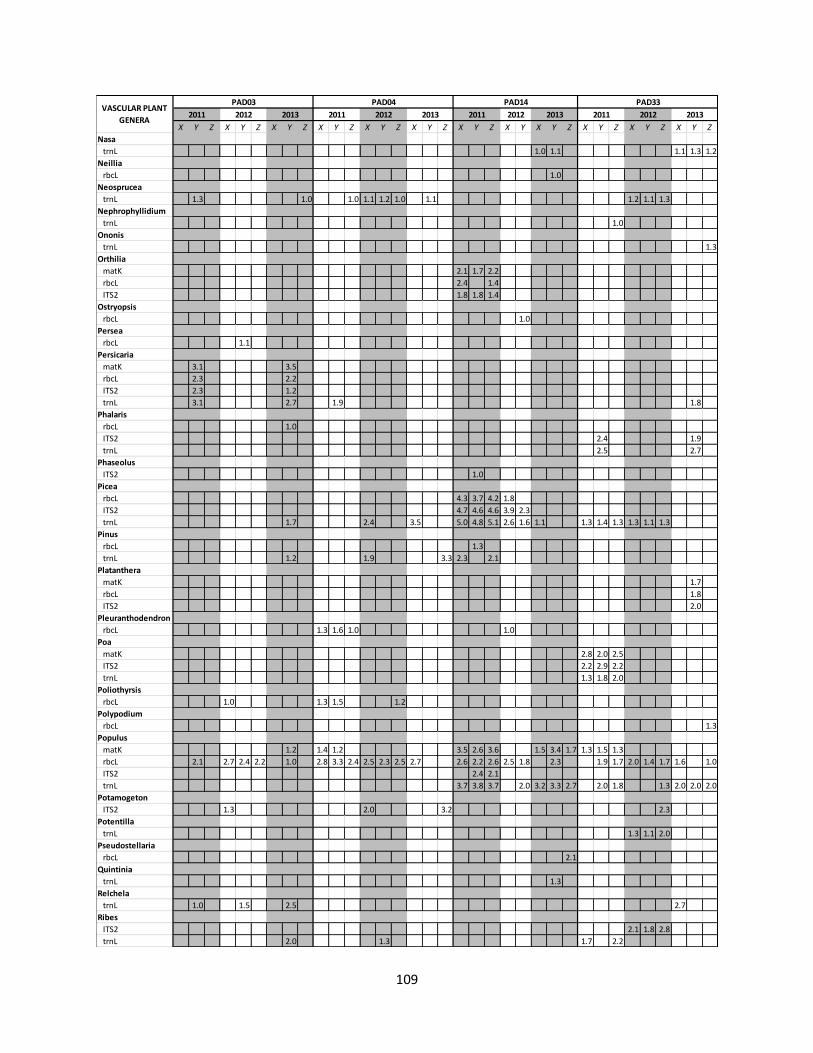
109
X Y Z X Y Z X Y Z X Y Z X Y Z X Y Z X Y Z X Y X Y Z X Y Z X Y Z X Y Z
Nasa
trnL 1.0 1.1 1.1 1.3 1.2
Neillia
rbcL 1.0
Neosprucea
trnL 1.3 1.0 1.0 1.1 1.2 1.0 1.1 1.2 1.1 1.3
Nephrophyllidium
trnL 1.0
Ononis
trnL 1.3
Orthilia
matK 2.1 1.7 2.2
rbcL 2.4 1.4
ITS2 1.8 1.8 1.4
Ostryopsis
rbcL 1.0
Persea
rbcL 1.1
Persicaria
matK 3.1 3.5
rbcL 2.3 2.2
ITS2 2.3 1.2
trnL 3.1 2.7 1.9 1.8
Phalaris
rbcL 1.0
ITS2 2.4 1.9
trnL 2.5 2.7
Phaseolus
ITS2 1.0
Picea
rbcL 4.3 3.7 4.2 1.8
ITS2 4.7 4.6 4.6 3.9 2.3
trnL 1.7 2.4 3.5 5.0 4.8 5.1 2.6 1.6 1.1 1.3 1.4 1.3 1.3 1.1 1.3
Pinus
rbcL 1.3
trnL 1.2 1.9 3.3 2.3 2.1
Platanthera
matK 1.7
rbcL 1.8
ITS2 2.0
Pleuranthodendron
rbcL 1.3 1.6 1.0 1.0
Poa
matK 2.8 2.0 2.5
ITS2 2.2 2.9 2.2
trnL 1.3 1.8 2.0
Poliothyrsis
rbcL 1.0 1.3 1.5 1.2
Polypodium
rbcL 1.3
Populus
matK 1.2 1.4 1.2 3.5 2.6 3.6 1.5 3.4 1.7 1.3 1.5 1.3
rbcL 2.1 2.7 2.4 2.2 1.0 2.8 3.3 2.4 2.5 2.3 2.5 2.7 2.6 2.2 2.6 2.5 1.8 2.3 1.9 1.7 2.0 1.4 1.7 1.6 1.0
ITS2 2.4 2.1
trnL 3.7 3.8 3.7 2.0 3.2 3.3 2.7 2.0 1.8 1.3 2.0 2.0 2.0
Potamogeton
ITS2 1.3 2.0 3.2 2.3
Potentilla
trnL 1.3 1.1 2.0
Pseudostellaria
rbcL 2.1
Quintinia
trnL 1.3
Relchela
trnL 1.0 1.5 2.5 2.7
Ribes
ITS2 2.1 1.8 2.8
trnL 2.0 1.3 1.7 2.2
2013VASCULAR PLANT
GENERA
PAD03 PAD04 PAD14 PAD33
2011 2012 2013 2011 2012 2013 2011 2012 2013 2011 2012

110
X Y Z X Y Z X Y Z X Y Z X Y Z X Y Z X Y Z X Y X Y Z X Y Z X Y Z X Y Z
Rosa
matK 2.1 1.6 2.2 1.6 1.6 1.4
rbcL 3.4 2.4 1.6 1.7
ITS2 1.9 3.8 2.6 2.4 2.2 2.5
Rubus
matK 1.9 2.9 1.6 2.6 2.6 3.5
rbcL 2.9 1.2 3.9 3.4 3.8 1.5
ITS2 2.9 2.5 2.4 2.1 1.5 2.2
trnL 1.7 1.8 2.6 1.3 1.3 1.4 1.1 2.1 3.9 3.0 4.5 1.9 4.7 3.1
Salix
matK 3.2 4.0 2.9 2.2 3.1 3.0 2.3 3.1 2.7 3.0 1.4 2.9 3.2 3.5 3.6 1.4 2.0 1.4 3.6 2.9 3.3 2.5 2.3 3.0 2.5 2.7
rbcL 2.5 5.0 3.1 5.1 5.2 4.7 4.8 4.8 3.6 4.6 4.3 4.1 5.4 5.2 5.5 4.5 4.7 4.6 1.3 1.0 1.9 3.7 3.3 3.7 3.8 4.0 4.6 4.3 4.5 3.7 4.1 4.5
ITS2 3.5 4.8 3.7 3.5 2.4 1.8 1.6 4.3 4.5 2.5 1.7 3.5 4.4 4.6 4.8 4.7 4.9 3.3 1.7 1.1 2.9 3.9 2.6 3.0 1.7 2.1 2.6 3.4
trnL 1.0 1.1 1.3 1.9 1.2
Satyrium
rbcL 1.1
Scirpus
rbcL 1.3
Shepherdia
matK 3.7 2.6 2.5 2.2 1.1
rbcL 3.1 1.6 2.3 1.9 1.7
ITS2 3.6 1.8 3.9 1.8 3.8
trnL 3.8 1.5 2.2 2.5 3.2 4.4 2.7 3.7 3.4 3.9
Shorea
trnL 1.1
Sideritis
rbcL 1.6
trnL 1.9
Sieversia
trnL 1.0
Sium
matK 1.0
Sonchus
matK 2.0 1.5 1.9 1.3
rbcL 1.3
ITS2 2.2 1.9
Sparganium
matK 1.5
rbcL 1.6
trnL 1.9 2.1 3.1 3.0 2.8 3.1
Sphaeranthus
rbcL 1.1
Spirodela
rbcL 2.4
Stachys
matK 2.7
rbcL 2.9
Stenopadus
trnL 2.2
Streptanthus
trnL 1.3
Strychnos
rbcL 1.0
Stuckenia
ITS2 1.1
trnL 1.6
Symphyotrichum
matK 1.2
ITS2 1.4 1.5 1.3
Tanacetum
ITS2 1.5
Taraxacum
trnL 1.0 1.5 1.8 1.0
Ticodendron
rbcL 1.9 1.7 1.7 2.4 2.7 2.3
Trigonospermum
trnL 1.1 1.7
Triosteum
matK 1.1
2012 2013VASCULAR PLANT
GENERA
PAD03 PAD04 PAD14 PAD33
2011 2012 2013 2011 2012 2013 2011 2012 2013 2011

111
X Y Z X Y Z X Y Z X Y Z X Y Z X Y Z X Y Z X Y X Y Z X Y Z X Y Z X Y Z
Trisetum
ITS2 2.0 1.0
Typha
trnL 1.1 1.9 1.3 2.3
Ulmus
rbcL 1.1 1.9
Urtica
trnL 1.6 2.0
Viburnum
matK 1.2
Vicia
matK 2.1 2.3 3.3 1.9 1.9 2.0
rbcL 1.8 3.3 2.3 3.3 2.5
ITS2 1.4 2.2 4.3 3.3 2.4 3.2
trnL 2.0 1.1 1.8
Vitis
rbcL 1.6 1.0 1.2
Woodsia
rbcL 2.1
Xylosma
rbcL 1.0 1.2 1.0
2011 2012 2013VASCULAR PLANT
GENERA
PAD03 PAD04 PAD14 PAD33
2011 2012 2013 2011 2012 2013 2011 2012 2013

112
Appendix E – Statistical Output Summary Tables Table 12 Statistical test output for nearest neighbour distance (NND) comparison at the species level.
Taxonomic Level Statistical Test Model
Species Friedman Rank Sum NND ~ Marker + Taxa
Factor Test Statistic Degrees of Freedom p-value
Marker Χ2 = 114.4925 3 <0.0001
Factor Post hoc Pairwise comparison p-values
Marker Wilcoxon signed rank test
ITS2 matK rbcL
matK <0.0001
rbcL <0.0001 0.0001
trnL 0.0001 0.7827 0.0403

113
Table 13 Statistical test output for comparison of DNA marker sequence recovery with the BLAST taxonomy pipeline (A) and OTU pipeline (B).
A. BLAST Taxonomy Pipeline
Processing Level Statistical Test Model
Raw Sequences ANOVA Raw Sequences ~ DNA Marker + Soil Sample
Factor Df SS MS F value p-value
DNA Marker 3 9.708 x 10¹⁰ 3.236 x 10¹⁰ 2.577 0.0578
Soil Sample 34 2.265 x 10¹¹ 6.663 x 10⁹ 0.531 0.9813
Residuals 102 1.251 x 10¹² 1.256 x 10¹⁰
Processing Level Statistical Test Model
Filtered Sequences Friedman Rank Sum Filtered Sequences ~ DNA Marker + Soil Sample
Factor Test Statistic Degrees of Freedom p-value
DNA Marker Χ2 = 46.0286 3 <0.0001
Factor Post hoc Pairwise comparison p-values
DNA Marker Wilcoxon signed rank test
ITS2 matK rbcL
matK <0.0001
rbcL 0.0006 0.0550
trnL 0.1488 <0.0001 0.0001
Processing Level Statistical Test Model
BLAST Hits Friedman Rank Sum Sequences with BLAST hit ~ DNA Marker + Soil Sample
Factor Test Statistic Degrees of Freedom p-value
DNA Marker Χ2 = 171.0571 3 <0.0001
Factor Post hoc Pairwise comparison p-values
DNA Marker Wilcoxon signed rank test
ITS2 matK rbcL
matK <0.0001
rbcL 0.3423 <0.0001
trnL <0.0001 <0.0001 0.0005
Processing Level Statistical Test Model
Assigned Orders Friedman Rank Sum Sequences Assigned to Order ~ DNA Marker + Soil Sample
Factor Test Statistic Degrees of Freedom p-value
DNA Marker Χ2 = 45.96 3 <0.0001
Factor Post hoc Pairwise comparison p-values
DNA Marker Wilcoxon signed rank test
ITS2 matK rbcL
matK <0.0001
rbcL 0.891 <0.0001
trnL 0.069 <0.0001 0.222
Processing Level Statistical Test Model
Assigned Vascular Friedman Rank Sum Sequences Assigned Vascular ~ DNA Marker + Soil Sample
Factor Test Statistic Degrees of Freedom p-value
DNA Marker Χ2 = 24.5657 3 <0.0001
Factor Post hoc Pairwise comparison p-values
DNA Marker Wilcoxon signed rank test
ITS2 matK rbcL
matK 0.0003
rbcL 0.0940 <0.0001
trnL 0.9549 <0.0001 0.2619

114
B. OTU Pipeline
Processing Level Statistical Test Model
OTU Sequences Friedman Rank Sum Sequences Assigned OTUs ~ DNA Marker + Soil Sample
Factor Test Statistic Degrees of Freedom p-value
DNA Marker Χ2 = 74.0057 3 <0.0001
Factor Post hoc Pairwise comparison p-values
DNA Marker Wilcoxon signed rank test
ITS2 matK rbcL
matK <0.0001
rbcL 0.0002 <0.0001
trnL <0.0001 <0.0001 <0.0001
Processing Level Statistical Test Model
Vascular Plant OTUs
Friedman Rank Sum Sequences Assigned to Vascular Plant OTUs ~ DNA Marker + Soil Sample
Factor Test Statistic Degrees of Freedom p-value
DNA Marker Χ2 = 61.5257 3 <0.0001
Factor Post hoc Pairwise comparison p-values
DNA Marker Wilcoxon signed rank test
ITS2 matK rbcL
matK 0.0022
rbcL 0.2516 <0.0001
trnL <0.0001 <0.0001 <0.0001
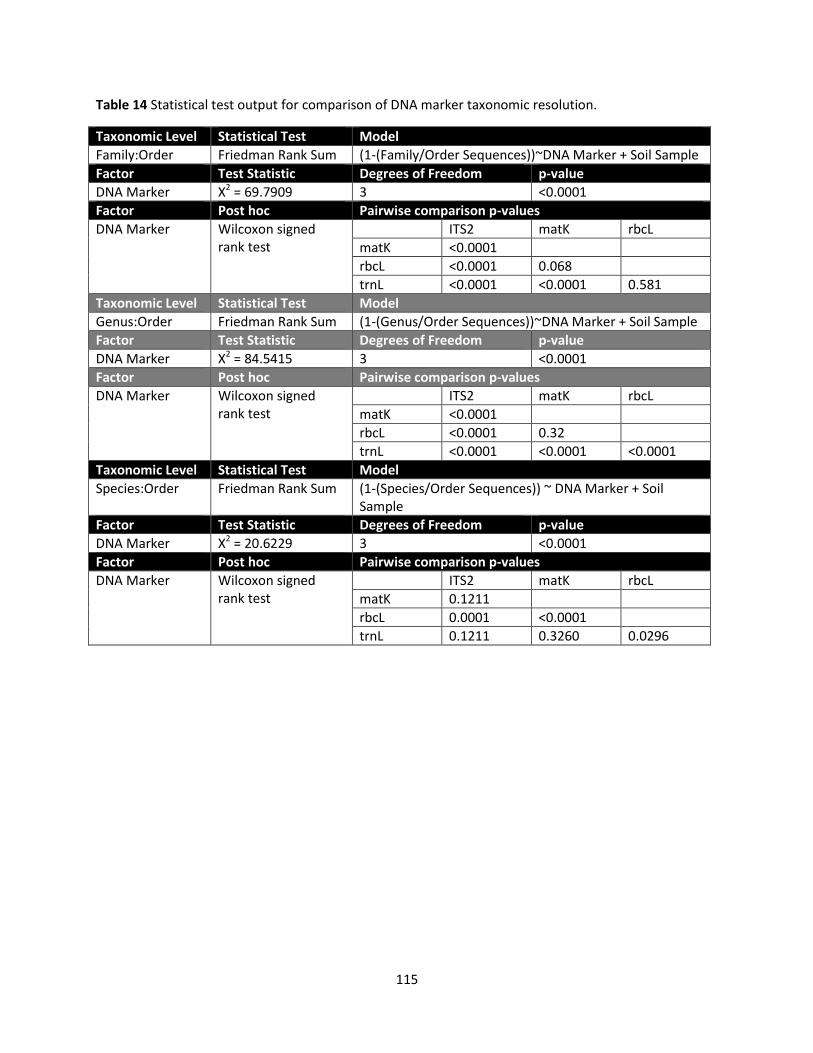
115
Table 14 Statistical test output for comparison of DNA marker taxonomic resolution.
Taxonomic Level Statistical Test Model
Family:Order Friedman Rank Sum (1-(Family/Order Sequences))~DNA Marker + Soil Sample
Factor Test Statistic Degrees of Freedom p-value
DNA Marker Χ2 = 69.7909 3 <0.0001
Factor Post hoc Pairwise comparison p-values
DNA Marker Wilcoxon signed rank test
ITS2 matK rbcL
matK <0.0001
rbcL <0.0001 0.068
trnL <0.0001 <0.0001 0.581
Taxonomic Level Statistical Test Model
Genus:Order Friedman Rank Sum (1-(Genus/Order Sequences))~DNA Marker + Soil Sample
Factor Test Statistic Degrees of Freedom p-value
DNA Marker Χ2 = 84.5415 3 <0.0001
Factor Post hoc Pairwise comparison p-values
DNA Marker Wilcoxon signed rank test
ITS2 matK rbcL
matK <0.0001
rbcL <0.0001 0.32
trnL <0.0001 <0.0001 <0.0001
Taxonomic Level Statistical Test Model
Species:Order Friedman Rank Sum (1-(Species/Order Sequences)) ~ DNA Marker + Soil Sample
Factor Test Statistic Degrees of Freedom p-value
DNA Marker Χ2 = 20.6229 3 <0.0001
Factor Post hoc Pairwise comparison p-values
DNA Marker Wilcoxon signed rank test
ITS2 matK rbcL
matK 0.1211
rbcL 0.0001 <0.0001
trnL 0.1211 0.3260 0.0296

116
Table 15 Statistical test output for comparisons of variability in recovery of plant diversity across replicate soil cores among DNA markers including both richness (A) and composition (B and C).
A. Variability in richness among replicate soil cores (coefficient of variation)
Taxonomic Level Statistical Test Model
Order ANOVA Coefficient of Variation ~ DNA Marker + Sampling Instance
Factor Df SS MS F value p-value
DNA Marker 3 0.0502 0.01672 0.368 0.7768
Sampling Instance 11 1.9086 0.17351 3.815 0.0014
Residuals 33 1.5010 0.04548
Taxonomic Level Statistical Test Model
Family ANOVA Coefficient of Variation ~ DNA Marker + Sampling Instance
Factor Df SS MS F value p-value
DNA Marker 3 0.0607 0.02023 0.504 0.6821
Sampling Instance 11 2.0873 0.18976 4.729 0.0002
Residuals 33 1.3241 0.04013
Taxonomic Level Statistical Test Model
Genus ANOVA Coefficient of Variation ~ DNA Marker + Sampling Instance
Factor Df SS MS F value p-value
DNA Marker 3 0.0021 0.00072 0.014 0.9977
Sampling Instance 11 2.4273 0.22066 4.302 0.0005
Residuals 33 1.6926 0.05129
Taxonomic Level Statistical Test Model
OTU ANOVA Rank(Coefficient of Variation) ~ DNA Marker + Sampling Instance
Factor Df SS MS F value p-value
DNA Marker 3 1098 366.1 3.092 0.0403
Sampling Instance 11 4208 382.5 3.231 0.0044
Residuals 33 3906 118.4
Factor Post hoc Pairwise comparison p-values
DNA Marker Tukey’s HSD ITS2 matK rbcL
matK 0.9983
rbcL 0.5844 0.4815
trnL 0.0793 0.0548 0.6192

117
B. Variability in composition among replicate soil cores (simple beta diversity)
Taxonomic Level Statistical Test Model
Order ANOVA Beta Diversity ~ DNA Marker + Sampling Instance
Factor Df SS MS F value p-value
DNA Marker 3 257 85.6 0.603 0.6177
Sampling Instance 11 4250 386.4 2.721 0.0129
Residuals 33 4686 142.0
Taxonomic Level Statistical Test Model
Family ANOVA Beta Diversity ~ DNA Marker + Sampling Instance
Factor Df SS MS F value p-value
DNA Marker 3 220 73.4 0.694 0.5622
Sampling Instance 11 5485 498.6 4.715 0.0003
Residuals 33 3490 105.8
Taxonomic Level Statistical Test Model
Genus ANOVA Beta Diversity ~ DNA Marker + Sampling Instance
Factor Df SS MS F value p-value
DNA Marker 3 338 112.5 1.678 0.191
Sampling Instance 11 6657 605.2 9.027 <0.0001
Residuals 33 2212 67.0
Taxonomic Level Statistical Test Model
OTU Friedman Rank Sum Beta Diversity ~ DNA Marker + Sampling Instance
Factor Test Statistic Degrees of Freedom p-value
DNA Marker Χ2 = 18.6 3 0.0003
Factor Post hoc Pairwise comparison p-values
DNA Marker Wilcoxon signed rank test
ITS2 matK rbcL
matK 0.0244
rbcL 0.4668 0.0244
trnL 0.4697 0.0029 0.1025

118
C. Variability in composition among replicate soil cores (multivariate dispersion)
Taxonomic Level Statistical Test Model
Order ANOVA Average Distance to Median ~ DNA Marker + Sampling Instance
Factor Df SS MS F value p-value
DNA Marker 3 0.0396 0.01320 1.221 0.3174
Sampling Instance 11 0.2308 0.02098 1.942 0.0695
Residuals 33 0.3565 0.01080
Taxonomic Level Statistical Test Model
Family ANOVA Average Distance to Median ~ DNA Marker + Sampling Instance
Factor Df SS MS F value p-value
DNA Marker 3 0.0256 0.008537 0.891 0.4562
Sampling Instance 11 0.2802 0.025477 2.658 0.0147
Residuals 33 0.3163 0.009586
Taxonomic Level Statistical Test Model
Genus ANOVA Average Distance to Median ~ DNA Marker + Sampling Instance
Factor Df SS MS F value p-value
DNA Marker 3 0.04763 0.015876 2.078 0.1221
Sampling Instance 11 0.29789 0.027081 3.544 0.0023
Residuals 33 0.25214 0.007641
Taxonomic Level Statistical Test Model
OTU Friedman Rank Sum Average Distance to Median ~ Marker + Sampling Instance
Factor Test Statistic Degrees of Freedom p-value
DNA Marker Χ2 = 15.1 3 0.0017
Factor Post hoc Pairwise comparison p-values
Marker Pairwise Wilcoxon signed rank test
ITS2 matK rbcL
matK 0.0342
rbcL 0.2197 0.0342
trnL 0.6221 0.0029 0.1025

119
Table 16 Statistical test output for comparison of pooled soil core richness among DNA markers.
Taxonomic Level Statistical Test Model
Order ANOVA Richness ~ DNA Marker + Sampling Instance
Factor Df SS MS F value p-value
DNA Marker 3 214.9 71.64 18.035 <0.0001
Sampling Instance 11 221.9 20.17 5.079 0.0001
Residuals 33 131.1 3.97
Factor Post hoc Pairwise comparison p-values
DNA Marker Tukey’s HSD ITS2 matK rbcL
matK 0.7366
rbcL 0.0043 0.0002
trnL <0.0001 <0.0001 0.3717
Taxonomic Level Statistical Test Model
Family ANOVA Richness ~ DNA Marker + Sampling Instance
Factor Df SS MS F value p-value
DNA Marker 3 364.4 121.47 15.606 <0.0001
Sampling Instance 11 342.1 31.10 3.995 0.0010
Residuals 33 256.9 7.78
Factor Post hoc Pairwise comparison p-values
DNA Marker Tukey’s HSD ITS2 matK rbcL
matK 0.9358
rbcL 0.0038 <0.0001
trnL <0.0001 <0.0001 0.5142
Taxonomic Level Statistical Test Model
Genus ANOVA Richness ~ DNA Marker + Sampling Instance
Factor Df SS MS F value p-value
DNA Marker 3 743.2 247.72 10.285 <0.0001
Sampling Instance 11 837.7 76.15 3.162 0.0051
Residuals 33 794.8 24.09
Factor Post hoc Pairwise comparison p-values
DNA Marker Tukey’s HSD ITS2 matK rbcL
matK 0.9993
rbcL 0.0006 0.0008
trnL 0.0080 0.0111 0.7746
Taxonomic Level Statistical Test Model
OTU ANOVA Log10(Richness) ~ DNA Marker + Sampling Instance
Factor Df SS MS F value p-value
DNA Marker 3 5.735 1.9118 19.658 <0.0001
Sampling Instance 11 0.607 0.0552 0.568 0.841
Residuals 33 3.209 0.0973
Factor Post hoc Pairwise comparison p-values
DNA Marker Tukey’s HSD ITS2 matK rbcL
matK 0.9939
rbcL 0.0026 0.0013
trnL <0.0001 <0.0001 0.1109

120
Table 17 Variation component analysis of vascular plant diversity for pooled replicate soil cores.
Taxonomic Level Statistical Test Model
Order Adonis (PERMANOVA)
Jaccard Dissimilarities ~ DNA Marker + Sampling Instance
Factor Df SS MS F value p-value
DNA Marker 3 2.4144 0.80479 7.0999 0.005
Sampling Instance 11 5.7644 0.52404 4.6231 0.005
Residuals 33 3.7406 0.11335
Factor Variation Component
DNA Marker 20.3%
Sampling Instance 48.4%
Taxonomic Level Statistical Test Model
Family Adonis (PERMANOVA)
Jaccard Dissimilarities ~ DNA Marker + Sampling Instance
Factor Df SS MS F value p-value
DNA Marker 3 2.3691 0.78970 5.5431 0.005
Sampling Instance 11 7.0881 0.64437 4.5230 0.005
Residuals 33 4.7013 0.14246
Factor Variation Component
DNA Marker 16.7%
Sampling Instance 50.1%
Taxonomic Level Statistical Test Model
Genus Adonis (PERMANOVA)
Jaccard Dissimilarities ~ DNA Marker + Sampling Instance
Factor Df SS MS F value p-value
DNA Marker 3 3.7319 1.24398 5.1685 0.005
Sampling Instance 11 6.9895 0.63541 2.6400 0.005
Residuals 33 7.9426 0.24068
Factor Variation Component
DNA Marker 20.0%
Sampling Instance 37.4%

121
Table 18 Statistical test output for comparison of PCoA distances of DNA marker composition estimates to spatial medians at the site level (n = 12 sampling instances).
Taxonomic Level Statistical Test Model
Order ANOVA Distance ~ DNA Marker + Sampling Instance
Factor Df SS MS F value p-value
DNA Marker 3 0.0118 0.00394 0.184 0.906
Sampling Instance 11 0.2068 0.01880 0.878 0.569
Residuals 33 0.7063 0.02140
Taxonomic Level Statistical Test Model
Family ANOVA Distance ~ DNA Marker + Sampling Instance
Factor Df SS MS F value p-value
DNA Marker 3 0.1059 0.03531 2.375 0.0879
Sampling Instance 11 0.1857 0.01688 1.135 0.3669
Residuals 33 0.4907 0.01487
Taxonomic Level Statistical Test Model
Genus ANOVA Distance ~ DNA Marker + Sampling Instance
Factor Df SS MS F value p-value
DNA Marker 3 0.3984 0.13280 15.280 <0.0001
Sampling Instance 11 0.0960 0.00873 1.005 0.463
Residuals 33 0.2868 0.00869
Factor Post hoc Pairwise comparison p-values
DNA Marker Tukey’s HSD ITS2 matK rbcL
matK 0.7498
rbcL 0.4516 0.0036
trnL 0.0001 <0.0001 0.1049

122
Table 19 Statistical test output for comparison of richness between belowground surveys and aboveground surveys with individual DNA markers (A) and with pooled DNA markers (B).
A. Individual DNA Markers
Taxonomic Level Statistical Test Model
Order ANOVA Richness ~ Marker * Site
Factor Df SS MS F value p-value
Marker 4 217.73 54.43 10.997 <0.0001
Site 3 132.93 44.31 8.952 0.0001
Marker:Site 12 83.73 6.98 1.410 0.2018
Residuals 40 198.00 4.95
Factor Post hoc Pairwise comparison p-values
Marker Tukey’s HSD above ITS2 matK rbcL
ITS2 0.140
matK 0.016 0.888
rbcL 0.888 0.016 0.0012
trnL 0.140 0.0002 <0.0001 0.589
Taxonomic Level Statistical Test Model
Family ANOVA Richness ~ Marker * Site
Factor Df SS MS F value p-value
Marker 4 370.7 92.68 11.634 <0.0001
Site 3 185.1 61.71 7.745 0.0003
Marker:Site 12 165.1 13.76 1.727 0.0970
Residuals 40 318.7 7.97
Factor Post hoc Pairwise comparison p-values
Marker Tukey’s HSD above ITS2 matK rbcL
ITS2 0.064
matK 0.015 0.977
rbcL 0.879 0.006 0.001
trnL 0.162 <0.0001 <0.0001 0.647
Taxonomic Level Statistical Test Model
Genus ANOVA Richness ~ Marker * Site
Factor Df SS MS F value p-value
Marker 4 743.2 185.81 7.282 0.0002
Site 3 321.6 107.20 4.201 0.0113
Marker:Site 12 378.9 31.57 1.237 0.2928
Residuals 40 1020.7 25.52
Factor Post hoc Pairwise comparison p-values
Marker Tukey’s HSD above ITS2 matK rbcL
ITS2 0.334
matK 0.400 1.0
rbcL 0.141 0.001 0.001
trnL 0.597 0.014 0.020 0.884

123
B. Pooled DNA Markers
Taxonomic Level Statistical Test Model
Order ANOVA Richness ~ Marker * Site
Factor Df SS MS F value p-value
Marker 4 232.27 58.82 13.070 <0.0001
Site 3 309.52 103.17 22.927 <0.0001
Marker:Site 12 56.07 4.67 1.038 0.435
Residuals 40 180.00 4.50
Factor Post hoc Pairwise comparison p-values
Marker Tukey’s HSD above IR IT RT
IR 0.058
IT 0.006 0.908
RT <0.0001 0.058 0.321
IRT <0.0001 0.005 0.046 0.870
Taxonomic Level Statistical Test Model
Family ANOVA Richness ~ Marker * Site
Factor Df SS MS F value p-value
Marker 4 452.9 113.23 11.211 <0.0001
Site 3 356.4 118.80 11.762 <0.0001
Marker:Site 12 122.3 10.19 1.009 0.459
Residuals 40 404.0 10.10
Factor Post hoc Pairwise comparison p-values
Marker Tukey’s HSD above IR IT RT
IR 0.207
IT 0.039 0.938
RT <0.0001 0.039 0.207
IRT <0.0001 0.005 0.039 0.938
Taxonomic Level Statistical Test Model
Genus ANOVA Rank(Richness) ~ Marker * Site
Factor Df SS MS F value p-value
Marker 4 8917 2229.3 14.406 <0.0001
Site 3 1419 472.9 3.056 0.0392
Marker:Site 12 1404 117.0 0.756 0.6897
Residuals 40 6190 154.7
Factor Post hoc Pairwise comparison p-values
Marker Tukey’s HSD above IR IT RT
IR 0.004
IT 0.027 0.961
RT <0.0001 0.201 0.048
IRT <0.0001 0.030 0.005 0.906

124
Table 20 Statistical test output for comparison of temporal variability in richness (CV) among markers.
Taxonomic Level Statistical Test Model
Order ANOVA CV ~ Marker + Site
Factor Df SS MS F value p-value
Marker 4 0.18046 0.04511 2.930 0.0664
Site 3 0.04816 0.01605 1.043 0.4090
Residuals 12 0.18475 0.01540
Taxonomic Level Statistical Test Model
Family ANOVA Rank(CV) ~ Marker + Site
Factor Df SS MS F value p-value
Marker 4 416.5 104.13 6.301 0.0057
Site 3 50.2 16.73 1.013 0.4211
Residuals 12 198.3 16.53
Factor Post hoc Pairwise comparison p-values
Marker Tukey’s HSD above ITS2 matK rbcL
ITS2 0.593
matK 0.009 0.116
rbcL 0.250 0.953 0.329
trnL 0.997 0.415 0.005 0.154
Taxonomic Level Statistical Test Model
Genus ANOVA CV ~ Marker + Site
Factor Df SS MS F value p-value
Marker 4 0.4502 0.11255 6.962 0.0039
Site 3 0.0589 0.01963 1.215 0.3467
Residuals 12 0.1940 0.01617
Factor Post hoc Pairwise comparison p-values
Marker Tukey’s HSD above ITS2 matK rbcL
ITS2 0.571
matK 0.004 0.050
rbcL 0.056 0.520 0.536
trnL 0.876 0.976 0.019 0.248
Taxonomic Level Statistical Test Model
OTU ANOVA Rank(CV) ~ DNA Marker + Site
Factor Df SS MS F value p-value
DNA Marker 3 103.5 34.50 1.472 0.287
Site 3 25.5 8.50 0.363 0.782
Residuals 9 211.0 23.44

125
Table 21 Statistical output for linear mixed effects models testing for linear relationships between temporal variability in richness (CV) and DNA marker length.
Taxonomic Level
Statistical Test Model
Order Linear mixed-effects model Fixed effects = Standardized(CV) ~ Standardized(DNA marker length) Random effects = ~1|Site
Fixed Effects Factor
Value Standard Error
Degrees of Freedom
t-value p-value
Intercept 0 0.198 11 0 1
Length 0.642 0.205 11 3.13 0.0095
Taxonomic Level
Statistical Test Model
Family Linear mixed-effects model Same as order level
Fixed Effects Factor
Value Standard Error
Degrees of Freedom
t-value p-value
Intercept 0 0.186 11 0 1
Length 0.775 0.162 11 4.785 0.0006
Taxonomic Level
Statistical Test Model
Genus Linear mixed-effects model Same as order level
Fixed Effects Factor
Value Standard Error
Degrees of Freedom
t-value p-value
Intercept 0 0.192 11 0 1
Length 0.731 0.178 11 4.117 0.0017
Taxonomic Level
Statistical Test Model
OTU Linear mixed-effects model Same as order level
Fixed Effects Factor
Value Standard Error
Degrees of Freedom
t-value p-value
Intercept 0 0.224 11 0 1
Length 0.498 0.232 11 2.146 0.055
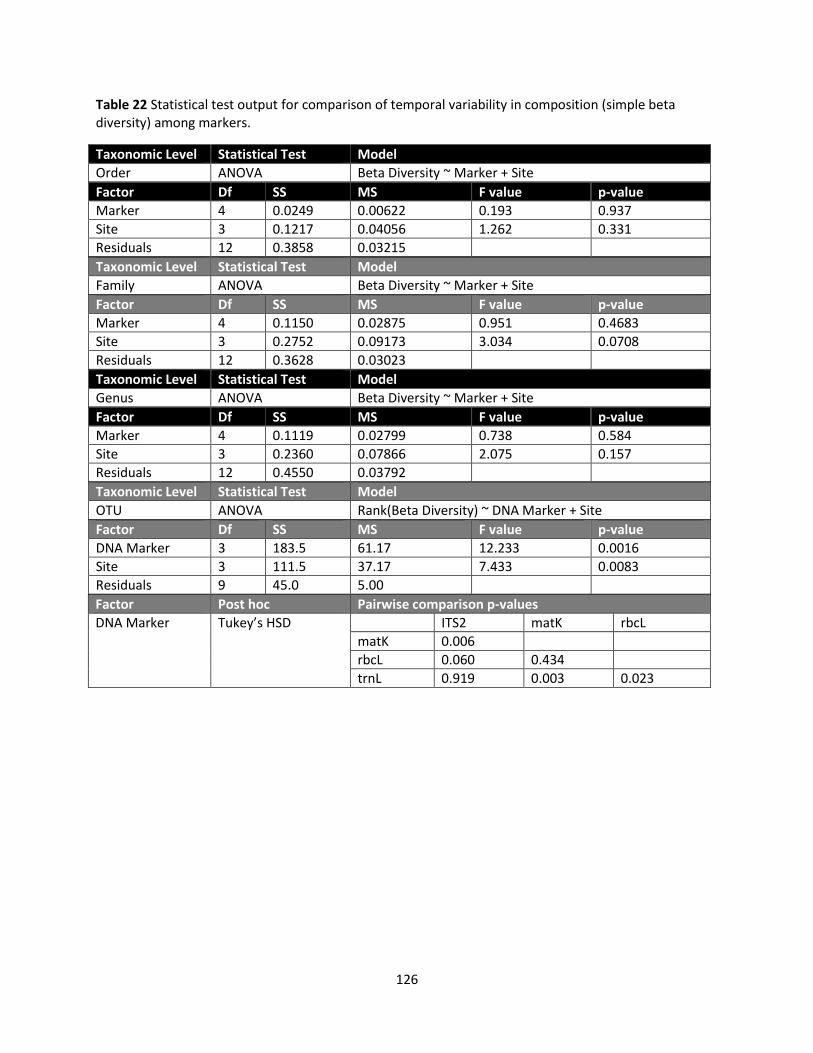
126
Table 22 Statistical test output for comparison of temporal variability in composition (simple beta diversity) among markers.
Taxonomic Level Statistical Test Model
Order ANOVA Beta Diversity ~ Marker + Site
Factor Df SS MS F value p-value
Marker 4 0.0249 0.00622 0.193 0.937
Site 3 0.1217 0.04056 1.262 0.331
Residuals 12 0.3858 0.03215
Taxonomic Level Statistical Test Model
Family ANOVA Beta Diversity ~ Marker + Site
Factor Df SS MS F value p-value
Marker 4 0.1150 0.02875 0.951 0.4683
Site 3 0.2752 0.09173 3.034 0.0708
Residuals 12 0.3628 0.03023
Taxonomic Level Statistical Test Model
Genus ANOVA Beta Diversity ~ Marker + Site
Factor Df SS MS F value p-value
Marker 4 0.1119 0.02799 0.738 0.584
Site 3 0.2360 0.07866 2.075 0.157
Residuals 12 0.4550 0.03792
Taxonomic Level Statistical Test Model
OTU ANOVA Rank(Beta Diversity) ~ DNA Marker + Site
Factor Df SS MS F value p-value
DNA Marker 3 183.5 61.17 12.233 0.0016
Site 3 111.5 37.17 7.433 0.0083
Residuals 9 45.0 5.00
Factor Post hoc Pairwise comparison p-values
DNA Marker Tukey’s HSD ITS2 matK rbcL
matK 0.006
rbcL 0.060 0.434
trnL 0.919 0.003 0.023

127
Table 23 Statistical output for linear mixed effects models testing for linear relationships between temporal variability in composition (simple beta diversity) and DNA marker length.
Taxonomic Level
Statistical Test Model
Order Linear mixed-effects model Fixed effects = Standardized(Simple beta diversity) ~ Standardized(DNA marker length) Random effects = ~1|Site
Fixed Effects Factor
Value Standard Error
Degrees of Freedom
t-value p-value
Intercept 0 0.339 11 0 1
Length 0.226 0.230 11 0.983 0.347
Taxonomic Level
Statistical Test Model
Family Linear mixed-effects model Same as order level
Fixed Effects Factor
Value Standard Error
Degrees of Freedom
t-value p-value
Intercept 0 0.400 11 0 1
Length 0.046 0.210 11 0.217 0.832
Taxonomic Level
Statistical Test Model
Genus Linear mixed-effects model Same as order level
Fixed Effects Factor
Value Standard Error
Degrees of Freedom
t-value p-value
Intercept 0 0.359 11 0 1
Length 0.265 0.217 11 1.223 0.247
Taxonomic Level
Statistical Test Model
OTU Linear mixed-effects model Same as order level
Fixed Effects Factor
Value Standard Error
Degrees of Freedom
t-value p-value
Intercept 0 0.340 11 0 1
Length 0.690 0.118 11 5.83 0.0001

128
Table 24 Statistical test output for comparison of temporal variability in composition (multivariate dispersion) among markers.
Taxonomic Level Statistical Test Model
Order ANOVA Multivariate Dispersion ~ Marker + Site
Factor Df SS MS F value p-value
Marker 4 0.00505 0.001262 0.387 0.814
Site 3 0.00654 0.002181 0.669 0.587
Residuals 12 0.03910 0.003258
Taxonomic Level Statistical Test Model
Family ANOVA Multivariate Dispersion ~ Marker + Site
Factor Df SS MS F value p-value
Marker 4 0.00990 0.002475 0.830 0.531
Site 3 0.01659 0.005531 1.885 0.191
Residuals 12 0.03578 0.002982
Taxonomic Level Statistical Test Model
Genus ANOVA Multivariate Dispersion ~ Marker + Site
Factor Df SS MS F value p-value
Marker 4 0.008157 0.002039 1.162 0.375
Site 3 0.012558 0.004186 2.385 0.120
Residuals 12 0.021063 0.001755
Taxonomic Level Statistical Test Model
OTU ANOVA Rank(Multivariate Dispersion) ~ DNA Marker + Site
Factor Df SS MS F value p-value
DNA Marker 3 185.0 61.67 12.20 0.0016
Site 3 109.5 36.50 7.22 0.0091
Residuals 9 45.5 5.06
Factor Post hoc Pairwise comparison p-values
DNA Marker Tukey’s HSD ITS2 matK rbcL
matK 0.012
rbcL 0.077 0.609
trnL 0.609 0.002 0.012

129
Table 25 Statistical output for linear mixed effects models testing for linear relationships between temporal variability in composition (multivariate dispersion) and DNA marker length.
Taxonomic Level
Statistical Test Model
Order Linear mixed-effects model Fixed effects = Standardized(Multivariate Dispersion) ~ Standardized(DNA marker length) Random effects = ~1|Site
Fixed Effects Factor
Value Standard Error
Degrees of Freedom
t-value p-value
Intercept 0 0.303 11 0 1
Length 0.308 0.236 11 1.309 0.217
Taxonomic Level
Statistical Test Model
Family Linear mixed-effects model Same as order level
Fixed Effects Factor
Value Standard Error
Degrees of Freedom
t-value p-value
Intercept 0 0.391 11 0 1
Length 0.093 0.214 11 0.434 0.673
Taxonomic Level
Statistical Test Model
Genus Linear mixed-effects model Same as order level
Fixed Effects Factor
Value Standard Error
Degrees of Freedom
t-value p-value
Intercept 0 0.366 11 0 1
Length 0.275 0.212 11 1.294 0.222
Taxonomic Level
Statistical Test Model
OTU Linear mixed-effects model Same as order level
Fixed Effects Factor
Value Standard Error
Degrees of Freedom
t-value p-value
Intercept 0 0.295 11 0 1
Length 0.716 0.138 11 5.177 0.0003