massive carbon addition to an organic-rich andosol did not …€¦ · · 2017-11-02nisms are...
TRANSCRIPT

Massive carbon addition to an organic-rich Andosol did not increasethe topsoil but the subsoil carbon stock.Antonia Zieger1, Klaus Kaiser2, Pedro Ríos Guayasamín3, and Martin Kaupenjohann1
1Department of Soil Science, Institute of Ecology, Technische Universität Berlin, Ernst-Reuter-Platz 1, 10587 Berlin,Germany2Soil Science and Soil Protection, Institute of Agricultural and Nutritional Science, Martin Luther University,Von-Seckendorff-Platz 3, 06120 Halle (Saale), Germany3Laboratorio de Ecología Tropical Natural y Aplicada, Universidad Estatal Amazónica, Campus Principal Km 2.1/2 via aNapo (Paso Lateral) Puyo, Pastaza, Ecuador
Correspondence to: Antonia Zieger ([email protected])
Abstract. Andosols are among the most carbon rich soils, with an average of 254 Mg ha−1 organic carbon (OC) in the upper
100 cm. A current theory proposes an upper limit for OC stocks independent of increasing carbon input. This is assigned to
finite binding capacities for organic matter (OM) of the soil mineral phase. We tested the possible limits in OC stocks for
Andosols with already large OC concentrations and stocks (210 g kg−1 in the first horizon; 320 Mg ha−1 in the upper 100 cm).
The soils received large inputs of 1800 Mg OC ha−1 as sawdust within a time period of 20 years. Adjacent soils without5
sawdust application served as controls. We determined total OC stocks as well as the storage forms of OM of five horizons
down to 100 cm depth. Storage forms considered were pyrogenic carbon, OM of < 1.6 g cm−3 density and with no to little
interaction with the mineral phase, strongly mineral-bonded OM forming particles of densities between 1.6 and 2.0 g cm−3
or > 2.0 g cm−3. The two fractions > 1.6 g cm−3 were also analyzed for Al-organic matter complexes (Al-OM complexes) and
imogolite-type phases using ammonium oxalate-oxalic acid extraction and X-ray diffraction (XRD).10
Pyrogenic organic carbon represented only up to 5 wt% of OC, and thus, contributed little to soil OM. In the two topsoil
horizons, the fraction between >1.6 and 2.0 g cm−3 had 65-86 wt% of bulk soil OC and were dominated by Al-OM complexes.
In deeper horizons, the fraction > 2.0 g cm−3 contained 80-97 wt% of bulk soil’s total OC and was characterized by a mixture
of Al-OM complexes and imogolite-type phases, with proportions of imogolite-type phases increasing with depth. In response
to the sawdust application, only the OC stock in 25-50 cm depth increased significantly (P = 0.05). The increase was entirely15
due to increased OC in the two fractions > 1.6 g cm−3. However, there was no significant increase in the total OC stocks within
the upper 100 cm.
We assume, the topsoil is saturated in terms of OC concentrations, and thus, added OC partly migrates downwards, where it
becomes retained by OC-undersaturated minerals. This indicates the possibility to sustainably increase already large OC stocks
further, given that the subsoil still has binding capacity and OC transport into deeper horizons is facilitated. The little additional20
OC accumulation despite the extremely large OC input over 20 years, however, shows that long time periods of high input are
needed to promote the downward movement and deep soil storage of OC.
1
Biogeosciences Discuss., https://doi.org/10.5194/bg-2017-386Manuscript under review for journal BiogeosciencesDiscussion started: 2 November 2017c© Author(s) 2017. CC BY 4.0 License.
Copyright statement. CC BY-NC-SA
1 Introduction
Soil holds more organic carbon (OC) than there is carbon in the global vegetation and atmosphere combined. Moreover soil
organic matter (OM) improves plant growth and protects water quality by retaining nutrients as well as pollutants in the soil
(Lal, 2004). Thus, understanding the soil OC dynamics is crucial for developing strategies to mitigate the increase of atmo-5
spheric CO2 concentrations and increase soil fertility (Stewart et al., 2007). The large soil carbon reservoir, however is not
steady. It results from a dynamic equilibrium between organic and inorganic material entering and leaving the soil (Schrumpf
et al., 2011).
There are contradictory views on soil carbon storage capacities. According to Lal (2004), the OC stock to 1 m depth ranges10
from 30 in arid climates to 800 Mg ha−1 in organic soils in cold regions; the predominant range is 50 to 150 Mg ha−1. Paustian
et al. (1997) consider the carbon input rate as the main factor and state that the OC stocks increase linearly with increasing
organic input without having an upper limit. Most current OC models, which use this linear relationship, perform reasonably
well across a diversity of soils and land use changes (Campbell and Paustian, 2015). On the contrary, Campbell et al. (1991)
published data, where soils rich in OC show little or no increase in soil OC despite a two to three fold increase in carbon15
input. This motivated Six et al. (2002) and Stewart et al. (2007) to propose that OC accumulation potentials of soils are limited
independent of increasing carbon input. The authors attribute this to the limited binding capacities of minerals. This concept is
reflected by the model of Schmidt et al. (2011), in which the OC input is stepwise mineralized, surpassing the form of large
biopolymeres, small biopolymers with less than 600 Da and monomers. At each step the possibility of interaction with mineral
phases increases, leading to different OC storage forms with differing turnover times and degree of interaction with the mineral20
phase. Overall the predominant proportion of OM in soils is associated with the mineral phase (e.g. Schrumpf et al., 2013).
Minerals have finite reactive surface areas and consequently finite OM binding capacities. The size of the surface area depends
on the type of mineral, and so, the differences in OC stocks among soils are due to different types and amounts of the contained
minerals. Thus, the OC input rate is only crucial as long as the mineral OC storage capacities are not exhausted. However, the
concept of limited storage capacity has hardly been experimentally tested so far.25
Allophane and imogolite-type phases are, besides Al and Fe oxides, the most effective minerals to bind OM (Kögel-Knabner
et al., 2008; Huang et al., 2011a). They dominate the mineral assemblage of Andosols, making them the most carbon-rich min-
eral soil (Huang et al., 2011a; WRB, 2006; Basile-Doelsch et al., 2007). Andosols are subdivided in silandic and aluandic
subgroups. Silandic Andosols have 80-120 g OC kg−1 soil, whereas aluandic Andosols can contain up to 300 g OC kg−1 soil30
(Huang et al., 2011a). Differences in OC concentrations among both subgroups are explained by differing carbon storage
mechanisms. Organic matter in silandic Andosols is mainly bound to allophanes, imogolites and protoimogolites (grouped as
imogolite-type phases Levard et al. (2012)). The OM in aluandic Andosols is mainly stored with aluminium-organic complexes
2
Biogeosciences Discuss., https://doi.org/10.5194/bg-2017-386Manuscript under review for journal BiogeosciencesDiscussion started: 2 November 2017c© Author(s) 2017. CC BY 4.0 License.

(Al-OM complexes). The Al in these complexes can be either monomeric Al3+ ions, but also hydroxilated Al species (Huang
et al., 2011a; Colombo et al., 2004; Masion et al., 1994). Independent of the type of Andosol, the main OM stabilizing mecha-
nisms are organic-mineral interactions. Andosols with extremely high OC concentrations likely present OM-saturated mineral
phases, at least in the topsoil, and should respond with no change in OC concentrations to increasing carbon input.
5
In order to test the concept of limited OC storage capacity in soils we took the opportunity of a unique setting in the Ecuado-
rian rainforest, where a carbon-rich Andosol (350 Mg OC ha−1 within the first 100 cm) received an extra 1800 Mg OC ha−1
input as sawdust during a period of 20 years. Adjacent soils without sawdust application served as controls.
We tested the following hypotheses: i) The additional OC input did not result in increased OC in the topsoil, but in the10
subsoil, because the mineral binding capacities for OM in the topsoil are exhausted and mobile OM is transported into the
subsoil and retained there; ii) the increase of OC in the subsoil is due to OM binding to the mineral phase; and iii) the total OC
stock of the soil increased significantly.
We determined total OC stocks as well as the storage forms of OM and the mineral composition down to 100 cm depth. For15
determining different OM storage forms we used the sequential density fractionation method to obtain fractions yielding OM
with different degrees of mineral interaction. We also determined pyrogenic organic carbon (PyC), because of its significant
contribution to the OC stocks in some regions of the Amazon basin (e.g. Glaser et al., 2000)). We used ammonium oxalate–
oxalic acid extraction and X-ray diffraction for characterizing the prevalent mineral species in the density fractions containing
organic-mineral associations.20
2 Materials and methods
2.1 Soil sample source and handling
The study site is located in Ecuador, within the Centro de Rescarte de la Flora Amazónica (CERFA) 3 km south of Puyo
(1◦30’50” S, 77◦58’50” E, 950 AMSL). Puyo, located in the transition zone between the Andes and the western Amazon basin,
lies in the center of an alluvial fan affected by deposition of Pleistocene volcanic debris called the Mera formation (Sauer,25
1971). The deposited material belongs to the andesite-plagidacite series or the andesite andesitedacite-rhyolite series. Later on
additional thick layers of volcanic ash from eruptions were deposited (Hörmann and Pichler, 1982). Today fresh ash is deposed
only infrequently from the volcanoes Tungaraghua and Sangay (Le Pennec et al., 2012). Tungaraghua ash composition ranges
from basic andesites to dacites (Hall et al., 1999). The climate is diurnal tropical with mean annual temperatures of 20.8 ◦C
and annual precipitation of 4403 mm (Schwarz, 2015). The vegetation cover is tropical rainforest and pasture (Tello, 2014).30
Before 1980 the sampling area has undergone traditional shifting cultivation and later on pasture dairy farming. Since 1980
7 ha of the pasture were reforested by the individual Nelson Omar Tello Benalcázar. On 3 ha, within this area, he applied
3
Biogeosciences Discuss., https://doi.org/10.5194/bg-2017-386Manuscript under review for journal BiogeosciencesDiscussion started: 2 November 2017c© Author(s) 2017. CC BY 4.0 License.
1800 t OC ha−1 additional litter in form of sawdust until the year 2000 (sawdust site). About 10 m3 of sawdust where applied
manually on 5 days a week for 20 years. The sawdust was collected on a daily basis from a local sawmill. Nowadays the 7 ha
are covered by about 37 year old secondary rainforest. (Tello, 2014)
We got in contact with this interesting project in 2013. As the site was originally not designed for experimental purposes it5
does not reflect a randomized plot design. Nevertheless, we think that it can be scientifically evaluated because the plot area on
which we sampled is large (2-3 ha at each site) and essential conditions like exposition, inclination, climate, weather conditions
and geology are comparable between the treated and untreated areas. No information about changes in treespecies over time
and possible differences between species due to the sawdust input were available. Instead we estimated additional litter input at
the sawdust site due to higher vegetation biomass productivity based on the literature. Clark et al. (2001) reported fine litterfall10
biomasses of 0.9-6 Mg ha−1 year−1 for tropical forest all over the world. If the sawdust site would have been covered with
a tropical forest for the whole 37 years and the adjacent site (contorl site) not, 222 Mg ha−1 litter biomass would have been
additionally added since 1980. This litter carbon represents less than 6 % of the total sawdust carbon input and is therefore
insignificant. In order to eliminate the belowground biomass as the dominating soil organic carbon source we measured the
gravimetric root intensity. The results show no significant difference between the sites (for data see the apendix).15
The soil samples for this study were taken in 2014 from the upper 100 cm at five profiles at each the secondary rainforest
with sawdust application (sawdust site) and the adjacent forest where no sawdust was applied (control site). The position of
the ten profiles were randomly selected and had each a profile width of 1 m. We define horizon one and two as the topsoil and
horizon three to five as the subsoil. Samples were oven dried at 40 ◦C in Ecuador at the Universidad Estatal Amazónica, before
transporting them to the German laboratory and sieving them to <2 mm.20
We classified the soil as an alusilandic Andosol, based on the WRB (2006) (for selected properties see Table 1). Few
prominent X-ray diffraction reflexes indicate simple mineral composition. The crystalline primary minerals are amphibole,
chlorite, quartz and plagioclase. Kaolinite and other secondary clay minerals are completely missing. Contents of crystalline
Fe minerals and gibbsite are little. Oxalate extractions indicate large amounts of short range-ordered and nano- or micro-25
crystalline mineral phases.
4
Biogeosciences Discuss., https://doi.org/10.5194/bg-2017-386Manuscript under review for journal BiogeosciencesDiscussion started: 2 November 2017c© Author(s) 2017. CC BY 4.0 License.
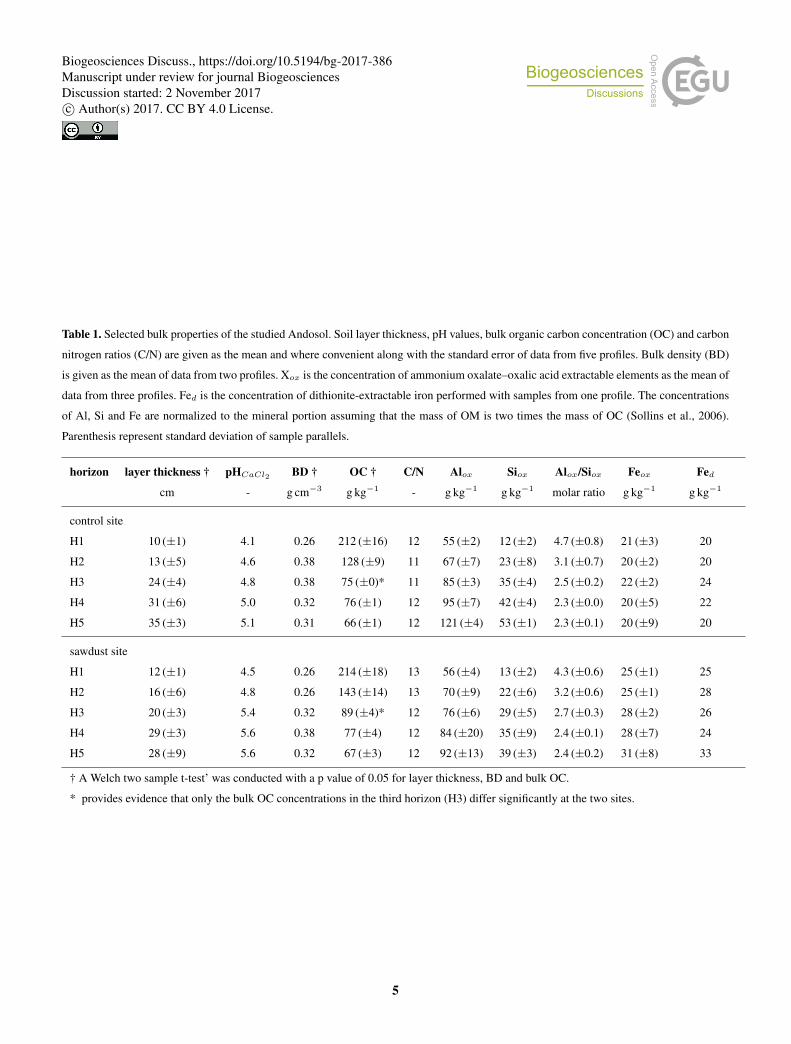
Table 1. Selected bulk properties of the studied Andosol. Soil layer thickness, pH values, bulk organic carbon concentration (OC) and carbon
nitrogen ratios (C/N) are given as the mean and where convenient along with the standard error of data from five profiles. Bulk density (BD)
is given as the mean of data from two profiles. Xox is the concentration of ammonium oxalate–oxalic acid extractable elements as the mean of
data from three profiles. Fed is the concentration of dithionite-extractable iron performed with samples from one profile. The concentrations
of Al, Si and Fe are normalized to the mineral portion assuming that the mass of OM is two times the mass of OC (Sollins et al., 2006).
Parenthesis represent standard deviation of sample parallels.
horizon layer thickness † pHCaCl2 BD † OC † C/N Alox Siox Alox/Siox Feox Fed
cm - g cm−3 g kg−1 - g kg−1 g kg−1 molar ratio g kg−1 g kg−1
control site
H1 10 (±1) 4.1 0.26 212 (±16) 12 55 (±2) 12 (±2) 4.7 (±0.8) 21 (±3) 20
H2 13 (±5) 4.6 0.38 128 (±9) 11 67 (±7) 23 (±8) 3.1 (±0.7) 20 (±2) 20
H3 24 (±4) 4.8 0.38 75 (±0)* 11 85 (±3) 35 (±4) 2.5 (±0.2) 22 (±2) 24
H4 31 (±6) 5.0 0.32 76 (±1) 12 95 (±7) 42 (±4) 2.3 (±0.0) 20 (±5) 22
H5 35 (±3) 5.1 0.31 66 (±1) 12 121 (±4) 53 (±1) 2.3 (±0.1) 20 (±9) 20
sawdust site
H1 12 (±1) 4.5 0.26 214 (±18) 13 56 (±4) 13 (±2) 4.3 (±0.6) 25 (±1) 25
H2 16 (±6) 4.8 0.26 143 (±14) 13 70 (±9) 22 (±6) 3.2 (±0.6) 25 (±1) 28
H3 20 (±3) 5.4 0.32 89 (±4)* 12 76 (±6) 29 (±5) 2.7 (±0.3) 28 (±2) 26
H4 29 (±3) 5.6 0.38 77 (±4) 12 84 (±20) 35 (±9) 2.4 (±0.1) 28 (±7) 24
H5 28 (±9) 5.6 0.32 67 (±3) 12 92 (±13) 39 (±3) 2.4 (±0.2) 31 (±8) 33
† A Welch two sample t-test’ was conducted with a p value of 0.05 for layer thickness, BD and bulk OC.
* provides evidence that only the bulk OC concentrations in the third horizon (H3) differ significantly at the two sites.
5
Biogeosciences Discuss., https://doi.org/10.5194/bg-2017-386Manuscript under review for journal BiogeosciencesDiscussion started: 2 November 2017c© Author(s) 2017. CC BY 4.0 License.
2.2 Bulk organic carbon concentration and stock
Aliquots of all bulk samples were grounded, oven dried at 105 ◦C for 24 h prior to OC and nitrogen (N) determination with an
Elementar Vario EL III CNS analyzer.
Organic carbon stocks were calculated based on soil volume to the fixed soil depth of 1 m. We found up to five soil layers per5
profile and determined bulk density, layer thickness and OC concentrations (Eq. (1)). Horizon thickness and OC concentrations
were measured at all five profiles per site. The bulk density was only determined at two profiles per site (all horizons) and
the mean (meanBD) was used for calculations. Thus OC stocks are presented as their mean and range, instead of standard
derivation. As the soils contained only minimal amounts of material >2 mm, the soil particles < 2 mm represents the total soil
mass. For comparing OC stocks at different depths we also cumulated the OC stocks of each horizon proportionally. We choose10
the depth 0-25, 25-50 and 50-100 cm in order to represent the topsoil, horizon three and the subsoil below horizon three. We
performed the ’Welch two sample t-test’ of means (p = 0.05, non paired) for comparing bulk OC stocks.
OC stock [Mgha−1] =OC [gkg−1] ·meanBD [kgdm−3] · layer thickness [dm] (1)
The equivalent soil mass approach propagated by Schrumpf et al. (2011); Wendt and Hauser (2013) was not applied, as i)
bulk density was not detected temporarily and did not vary much between sites for the same horizons, ii) the studied site was15
no cropland and iii) the approach increases uncertainties of OC stocks of undisturbed soils (Schrumpf et al., 2011).
2.3 Pyrogenic carbon analyses
Analysis of pyrogenic carbon (PyC) was peformed by the staff of the department of soil science at Rheinische Friedrich-
Wilhelms-Universität Bonn. It was carried out following the revised protocol of Brodowski et al. (2005). For quantifying the
benzene polycarboxylic acids (BPCA), 10 mg of dried and ground soil material was treated with 10 ml 4 M CF3CO2H (99%,20
Sigma Aldrich, Taufkirchen, Germany) to remove polyvalent cations. The PyC was then oxidized with HNO3 (8 h, 170 ◦C) and
converted to BPCAs. After cleanup via a cation exchange column (Dowex 50 W X 8, 200-400 mesh, Fluka, Steinheim, Ger-
many), the BPCAs were silylated and determined using gas chromatography with flame ionization detection (GC-FID; Agilent
6890 gas chromatograph; Optima-5 column; 30 m× 0.25 mm i.d., 0.25µm film thickness; Supelco, Steinheim, Germany). Two
internal standards citric acid and biphenyl dicarboxylic acid were used. Carefully monitoring the pH avoided decomposition25
of citric acid during sample processing as criticized by Schneider et al. (2010). The recovery of internal standard 1 (citric
acid) ranged between 78 and 98 %. Carbon content of BPCA (BPCA-C) was converted to PyC with the conversion factor
2.3 (Brodowski et al., 2005). The analyses showed good repeatability, with differences between two measurement parallels
being<4.2 g PyC kg−1OC except for the second horizon were the parallels differed by 12.5 g PyC kg−1OC.
6
Biogeosciences Discuss., https://doi.org/10.5194/bg-2017-386Manuscript under review for journal BiogeosciencesDiscussion started: 2 November 2017c© Author(s) 2017. CC BY 4.0 License.

2.4 Sequential density fractionation of OM
We modified the sequential density fractionation procedure (Fig. 1) described by Cerli et al. (2012) in order to separate four
different fractions. The first light fraction F1 contains mainly OM basically not interacting with the mineral phase often called
free particulate OM. The second light fraction (F2) contains mainly particulate OM being incorporated into aggregates thus
having little interaction with the mineral phase. The third and forth fraction (F3, F4) are heavy fractions mainly containing OM5
strongly interacting with the mineral phase, which are often called organic-mineral associations.
Fifteen gram of dried (40 ◦C) and sieved (<2 mm) soil were mixed with 75 ml of sodium polytungstate solution (SPT, TC-
Tungsten Compounds) with a density of 1.6 g cm−3 in 200 ml PE bottles. To obtain F1, the bottles were gently shaken a
few times, and then the suspensions were allowed to settle for 1 h and subsequently centrifuged at 4500 g for 30 min (Sor-10
vall RC-5B). The supernatant was siphoned with a water jet pump and the F1 fraction was collected on a pre-rinsed 1.2µm
cellulose-nitrate membrane filter. After rinsing with deionized water until the conductivity of the filtrate was <50µS cm−1, F1
was carefully transferred into a 50 ml PE bottle and subsequently freeze dried (Christ alpha 2-4 and 1-4 LCS).
The residue was re-suspended with re-collected SPT solution and refilled with fresh SPT solution (1.6 g cm−3) until the15
original bottle-sample mass was maintained. In order to release F2, the aggregates were dispersed by sonication (energy in-
put 300 J ml−1, with 10-mm pole head sonotrode, submersed to 15 mm depth, oscillation period 50/60 Hz, amplitude 2 AMP;
Branson Sonifier 250) according to the calibration of Schmidt et al. (1999). The appropriate energy input was determined in
a preliminary experiment as the energy which released the largest amount of largely pure OM, following Cerli et al. (2012).
Temperature was kept < 40 ◦C using an ice bath to avoid thermal sample alteration. Thereafter, the sample was centrifuge at20
4500 g for 30 min and floating material was separated, washed and dried as described above for F1.
In order to further separate the residual fraction into Al-OM complexes and imogolite-type phases we introduced an addi-
tional density cut off. This is sensible because the overall density of an organic-mineral association depends on OM density,
mineral density and OM load (Kaiser and Guggenberger, 2007; Chenu and Plante, 2006). The densities of pure imogolite-type25
mineral phases and Al-OM complexes are very similar (Huang et al., 2011c), but Boudot (1992) and Kaiser and Guggenberger
(2007) showed that Al-OM complexes have a higher OM load than imogolite-type phases. The second density cut off was set
at 2.0 g cm−3, which was determined in a preliminary experiment on the basis of OC concentrations, XRD spectra and oxalate-
extractable Al, Si and Fe concentrations. The fraction with a density between 1.6. and 2.0 g cm−3 was found to be enriched in
Al-OM complexes (F3).30
For obtaining F3, the residue of the previous separation step was re-suspended in 75 ml fresh SPT solution (density of
2.0 g cm−3), dispersed at 30 J ml−1 to ensure complete soil wetting with new SPT solution, centrifuged, separated, washed and
dried as described above for F1. The final residue of > 2.0 g cm−3 density (F4), mainly containing imogolite-type phases and
7
Biogeosciences Discuss., https://doi.org/10.5194/bg-2017-386Manuscript under review for journal BiogeosciencesDiscussion started: 2 November 2017c© Author(s) 2017. CC BY 4.0 License.
crystalline minerals, was rinsed with deionized water until the conductivity of the supernatant was <50µS cm−1 and subse-
quently freeze-dried.
Aliquots of all fraction samples were oven dried at 105 ◦C for 24 h prior to OC and N determination with an Elementar Vario
EL III CNS analyzer.5
8
Biogeosciences Discuss., https://doi.org/10.5194/bg-2017-386Manuscript under review for journal BiogeosciencesDiscussion started: 2 November 2017c© Author(s) 2017. CC BY 4.0 License.

Table 2. Selected bulk properties of samples used in the sequential density fractionation. Presented are bulk organic carbon (OC), carbon
nitrogen ratios (C/N) and pyrogenic carbon (PyC) as proportion of OC. Xox is the concentration of ammonium oxalate–oxalic acid extractable
elements. The concentrations of Al and Si are normalized to the mineral portion assuming that the mass of OM is two times the mass of OC
(Sollins et al., 2006).
horizon depth pHCaCl2 OC C/N PyC Alox Siox Alox/Siox
cm - g kg−1soil - g kg−1OC g kg−1 g kg−1 molar ratio
control site
H1 0-8 4.0 252 12 46 57 11 5.1
H2 8-15 4.4 137 11 65 59 18 3.2
H3 15-35 5.1 75 11 67 87 36 2.4
H4 35-70 5.1 72 12 95 104 47 2.2
H5 70-100 5.1 64 12 60 119 54 2.2
sawdust site
H1 0-15 4.1 256 13 47 52 11 4.9
H2 15-28 4.4 170 12 65 60 15 3.9
H3 28-50 4.8 102 12 42 69 23 3.0
H4 50-76 5.1 63 11 147 63 26 2.4
H5 76-100 5.1 76 12 50 83 37 2.2
9
Biogeosciences Discuss., https://doi.org/10.5194/bg-2017-386Manuscript under review for journal BiogeosciencesDiscussion started: 2 November 2017c© Author(s) 2017. CC BY 4.0 License.
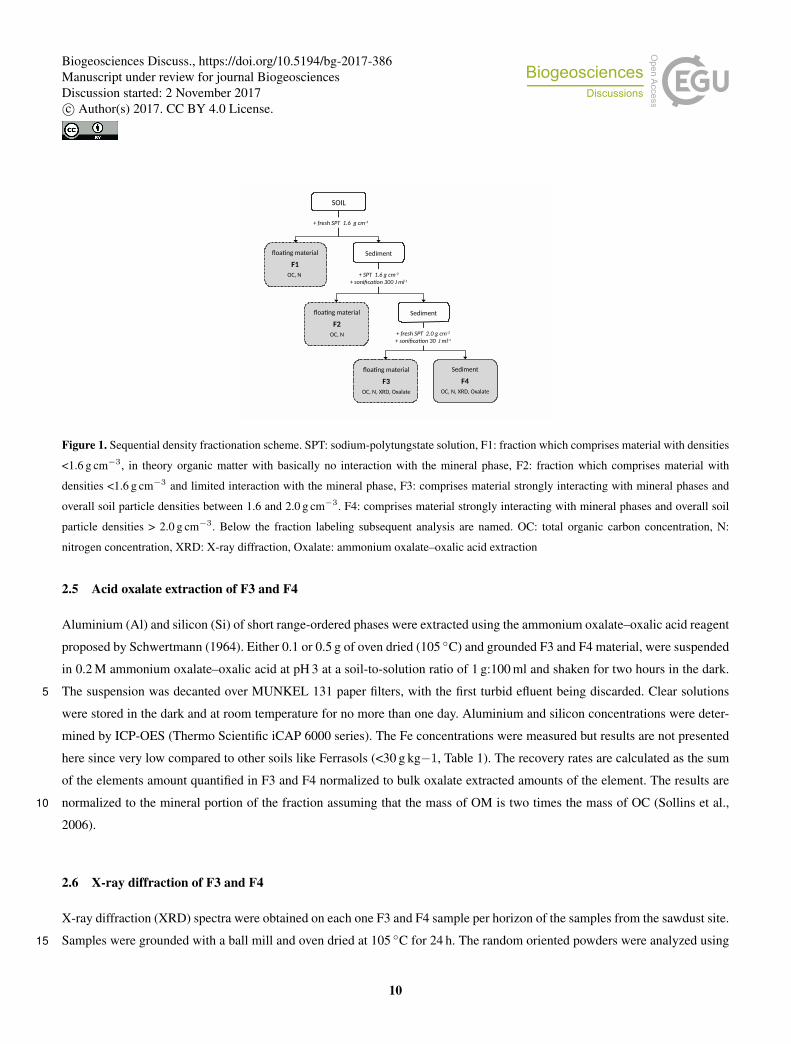
Figure 1. Sequential density fractionation scheme. SPT: sodium-polytungstate solution, F1: fraction which comprises material with densities
<1.6 g cm−3, in theory organic matter with basically no interaction with the mineral phase, F2: fraction which comprises material with
densities <1.6 g cm−3 and limited interaction with the mineral phase, F3: comprises material strongly interacting with mineral phases and
overall soil particle densities between 1.6 and 2.0 g cm−3. F4: comprises material strongly interacting with mineral phases and overall soil
particle densities > 2.0 g cm−3. Below the fraction labeling subsequent analysis are named. OC: total organic carbon concentration, N:
nitrogen concentration, XRD: X-ray diffraction, Oxalate: ammonium oxalate–oxalic acid extraction
2.5 Acid oxalate extraction of F3 and F4
Aluminium (Al) and silicon (Si) of short range-ordered phases were extracted using the ammonium oxalate–oxalic acid reagent
proposed by Schwertmann (1964). Either 0.1 or 0.5 g of oven dried (105 ◦C) and grounded F3 and F4 material, were suspended
in 0.2 M ammonium oxalate–oxalic acid at pH 3 at a soil-to-solution ratio of 1 g:100 ml and shaken for two hours in the dark.
The suspension was decanted over MUNKEL 131 paper filters, with the first turbid efluent being discarded. Clear solutions5
were stored in the dark and at room temperature for no more than one day. Aluminium and silicon concentrations were deter-
mined by ICP-OES (Thermo Scientific iCAP 6000 series). The Fe concentrations were measured but results are not presented
here since very low compared to other soils like Ferrasols (<30 g kg−1, Table 1). The recovery rates are calculated as the sum
of the elements amount quantified in F3 and F4 normalized to bulk oxalate extracted amounts of the element. The results are
normalized to the mineral portion of the fraction assuming that the mass of OM is two times the mass of OC (Sollins et al.,10
2006).
2.6 X-ray diffraction of F3 and F4
X-ray diffraction (XRD) spectra were obtained on each one F3 and F4 sample per horizon of the samples from the sawdust site.
Samples were grounded with a ball mill and oven dried at 105 ◦C for 24 h. The random oriented powders were analyzed using15
10
Biogeosciences Discuss., https://doi.org/10.5194/bg-2017-386Manuscript under review for journal BiogeosciencesDiscussion started: 2 November 2017c© Author(s) 2017. CC BY 4.0 License.

a PANalytical EMPYREAN X-ray diffractometer with theta/theta-geometry, 1 D-PIXcell detector, Cu-Kα radiation at 40 kV
and 40 mA, at an angle range of 5-65 ◦2θ with 378 s counting time per 0.013 ◦ 2θ step and automatically acting diaphragm.
Evaluation was performed with X’Pert HighScore Plus V 3.0 (PANalytical) software.
2.7 Data analysis5
All analyses, except for X-ray diffraction, which was carried out with no replicate, were carried out in duplicates. Bulk analyses
are carried out with samples from five profiles per site. Sequential density fractionation and subsequent mineralogical analyses
and PyC analyses were carried out for one representative profile per site (for selected soil data see Table 2). The soil profiles for
these analyses were chosen on the basis of having five horizons within the upper 1 m, largest OC concentration in horizon one,
similar amount of acid oxalate-extractable elements and having different bulk OC concentrations in the third horizon. Results10
are presented as means of replicates. All calculations and graphs were processed with R version 3.1.0 (2014 The R Foundation
for Statistical Computing).
3 Results
3.1 Bulk organic carbon15
The total OC stocks are between 277 and 352 with a mean of 315 Mg ha−1 at the sawdust site. At the control site total OC
stocks range between 256 and 313 with a mean of 289 Mg ha−1 at the control site (Table 3). The total OC stocks did not signif-
icant differe between the two sites. But out of the choosen depth sections the section of 25-50 cm, which comprises mostly the
third horizon showed significant differences between the two sites (Table 3). In the third horizon the bulk OC concentrations
showed significantly differences, whereas the layer thickness and the bulk density did not (Table 1).20
The PyC proportion on bulk OC range between 42 and 147 g PyC kg−1OC (Table 2) and vary with depth in a non-regular
pattern.
11
Biogeosciences Discuss., https://doi.org/10.5194/bg-2017-386Manuscript under review for journal BiogeosciencesDiscussion started: 2 November 2017c© Author(s) 2017. CC BY 4.0 License.
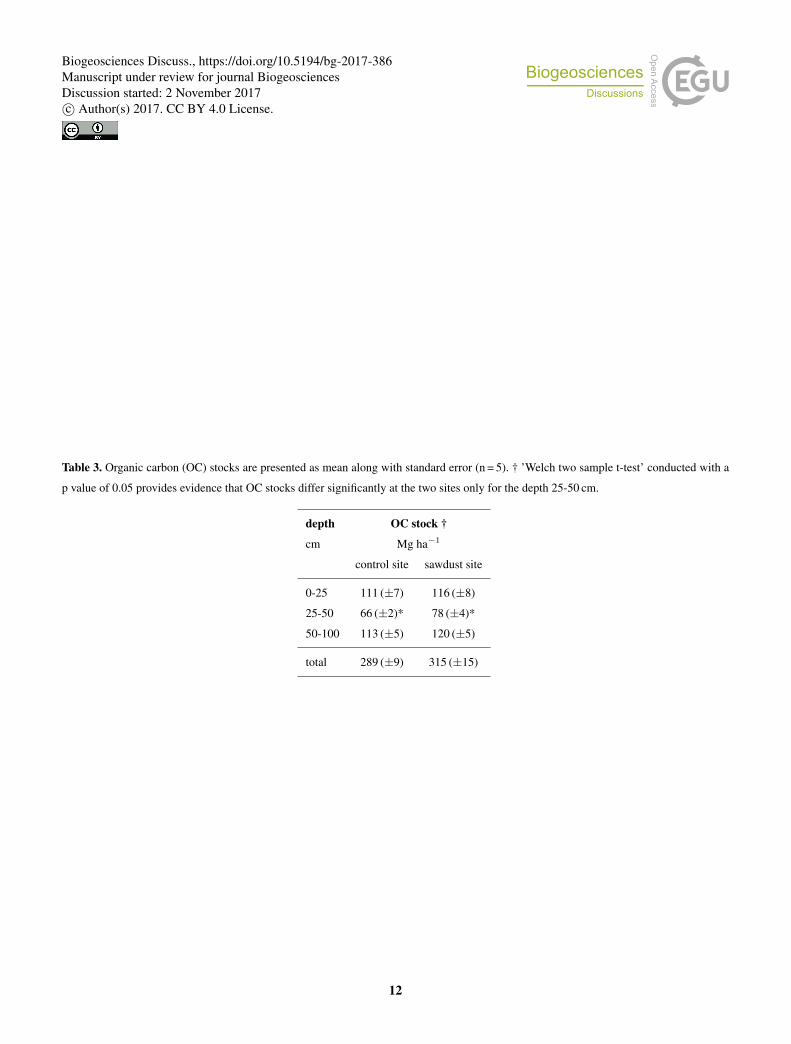
Table 3. Organic carbon (OC) stocks are presented as mean along with standard error (n = 5). † ’Welch two sample t-test’ conducted with a
p value of 0.05 provides evidence that OC stocks differ significantly at the two sites only for the depth 25-50 cm.
depth OC stock †
cm Mg ha−1
control site sawdust site
0-25 111 (±7) 116 (±8)
25-50 66 (±2)* 78 (±4)*
50-100 113 (±5) 120 (±5)
total 289 (±9) 315 (±15)
12
Biogeosciences Discuss., https://doi.org/10.5194/bg-2017-386Manuscript under review for journal BiogeosciencesDiscussion started: 2 November 2017c© Author(s) 2017. CC BY 4.0 License.
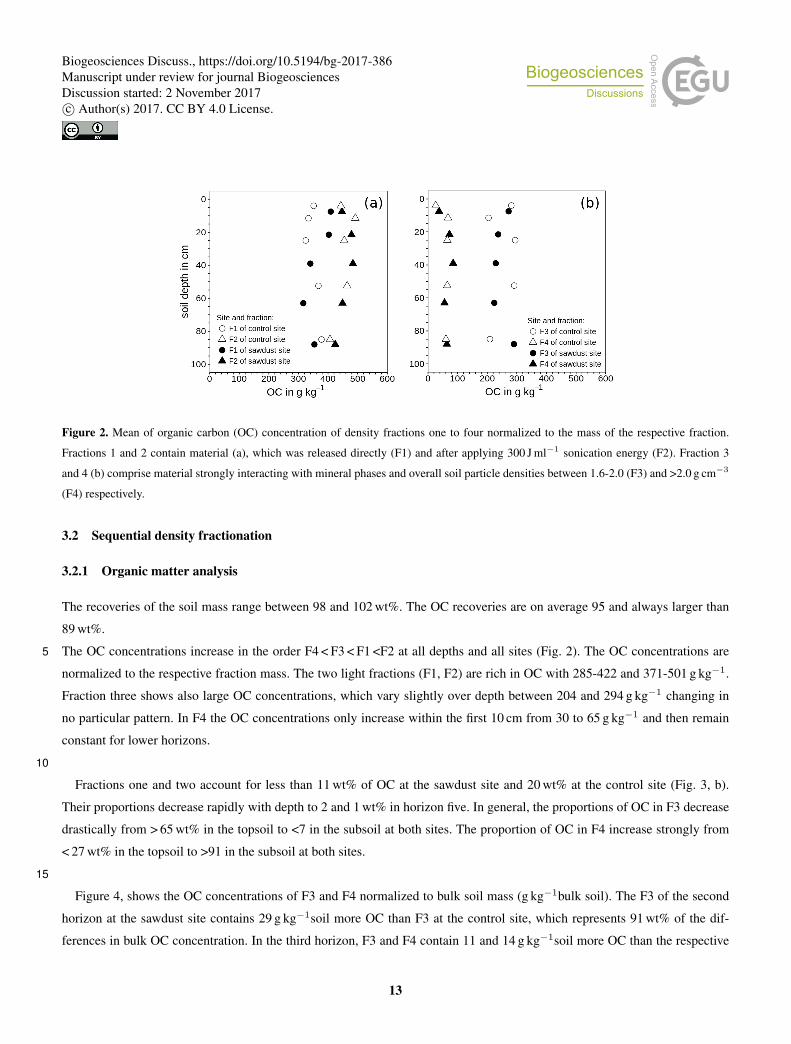
Figure 2. Mean of organic carbon (OC) concentration of density fractions one to four normalized to the mass of the respective fraction.
Fractions 1 and 2 contain material (a), which was released directly (F1) and after applying 300 J ml−1 sonication energy (F2). Fraction 3
and 4 (b) comprise material strongly interacting with mineral phases and overall soil particle densities between 1.6-2.0 (F3) and >2.0 g cm−3
(F4) respectively.
3.2 Sequential density fractionation
3.2.1 Organic matter analysis
The recoveries of the soil mass range between 98 and 102 wt%. The OC recoveries are on average 95 and always larger than
89 wt%.
The OC concentrations increase in the order F4 < F3 < F1 <F2 at all depths and all sites (Fig. 2). The OC concentrations are5
normalized to the respective fraction mass. The two light fractions (F1, F2) are rich in OC with 285-422 and 371-501 g kg−1.
Fraction three shows also large OC concentrations, which vary slightly over depth between 204 and 294 g kg−1 changing in
no particular pattern. In F4 the OC concentrations only increase within the first 10 cm from 30 to 65 g kg−1 and then remain
constant for lower horizons.
10
Fractions one and two account for less than 11 wt% of OC at the sawdust site and 20 wt% at the control site (Fig. 3, b).
Their proportions decrease rapidly with depth to 2 and 1 wt% in horizon five. In general, the proportions of OC in F3 decrease
drastically from > 65 wt% in the topsoil to <7 in the subsoil at both sites. The proportion of OC in F4 increase strongly from
< 27 wt% in the topsoil to >91 in the subsoil at both sites.
15
Figure 4, shows the OC concentrations of F3 and F4 normalized to bulk soil mass (g kg−1bulk soil). The F3 of the second
horizon at the sawdust site contains 29 g kg−1soil more OC than F3 at the control site, which represents 91 wt% of the dif-
ferences in bulk OC concentration. In the third horizon, F3 and F4 contain 11 and 14 g kg−1soil more OC than the respective
13
Biogeosciences Discuss., https://doi.org/10.5194/bg-2017-386Manuscript under review for journal BiogeosciencesDiscussion started: 2 November 2017c© Author(s) 2017. CC BY 4.0 License.
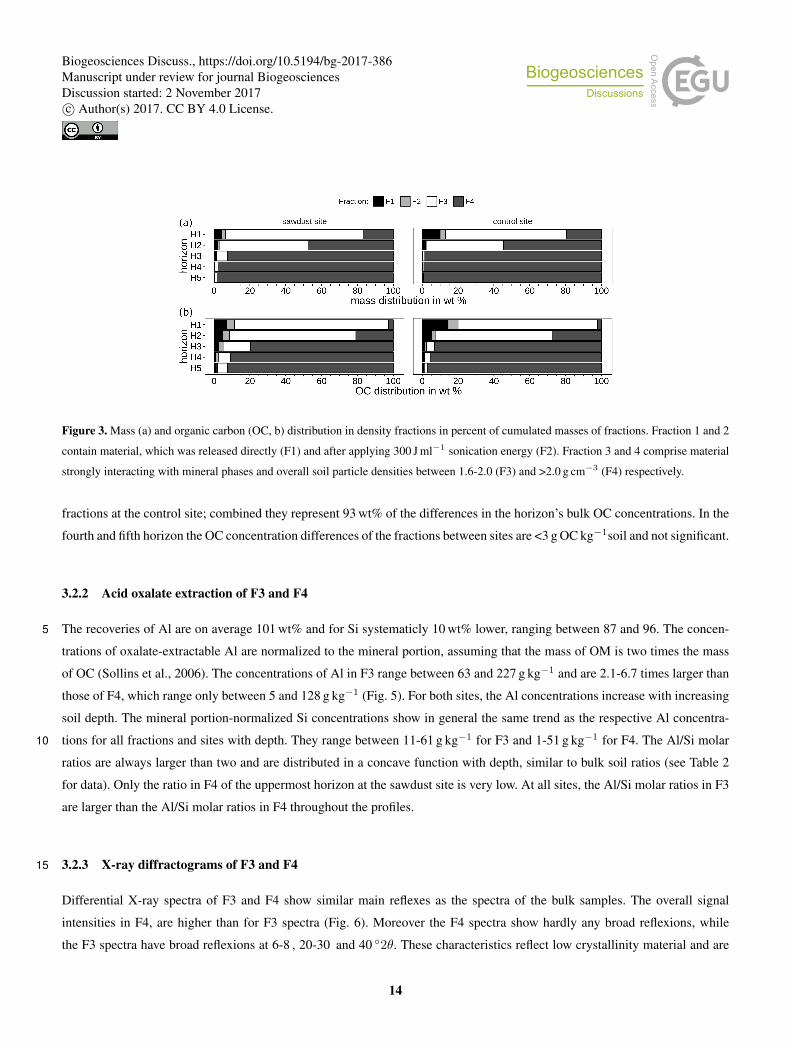
Figure 3. Mass (a) and organic carbon (OC, b) distribution in density fractions in percent of cumulated masses of fractions. Fraction 1 and 2
contain material, which was released directly (F1) and after applying 300 J ml−1 sonication energy (F2). Fraction 3 and 4 comprise material
strongly interacting with mineral phases and overall soil particle densities between 1.6-2.0 (F3) and >2.0 g cm−3 (F4) respectively.
fractions at the control site; combined they represent 93 wt% of the differences in the horizon’s bulk OC concentrations. In the
fourth and fifth horizon the OC concentration differences of the fractions between sites are <3 g OC kg−1soil and not significant.
3.2.2 Acid oxalate extraction of F3 and F4
The recoveries of Al are on average 101 wt% and for Si systematicly 10 wt% lower, ranging between 87 and 96. The concen-5
trations of oxalate-extractable Al are normalized to the mineral portion, assuming that the mass of OM is two times the mass
of OC (Sollins et al., 2006). The concentrations of Al in F3 range between 63 and 227 g kg−1 and are 2.1-6.7 times larger than
those of F4, which range only between 5 and 128 g kg−1 (Fig. 5). For both sites, the Al concentrations increase with increasing
soil depth. The mineral portion-normalized Si concentrations show in general the same trend as the respective Al concentra-
tions for all fractions and sites with depth. They range between 11-61 g kg−1 for F3 and 1-51 g kg−1 for F4. The Al/Si molar10
ratios are always larger than two and are distributed in a concave function with depth, similar to bulk soil ratios (see Table 2
for data). Only the ratio in F4 of the uppermost horizon at the sawdust site is very low. At all sites, the Al/Si molar ratios in F3
are larger than the Al/Si molar ratios in F4 throughout the profiles.
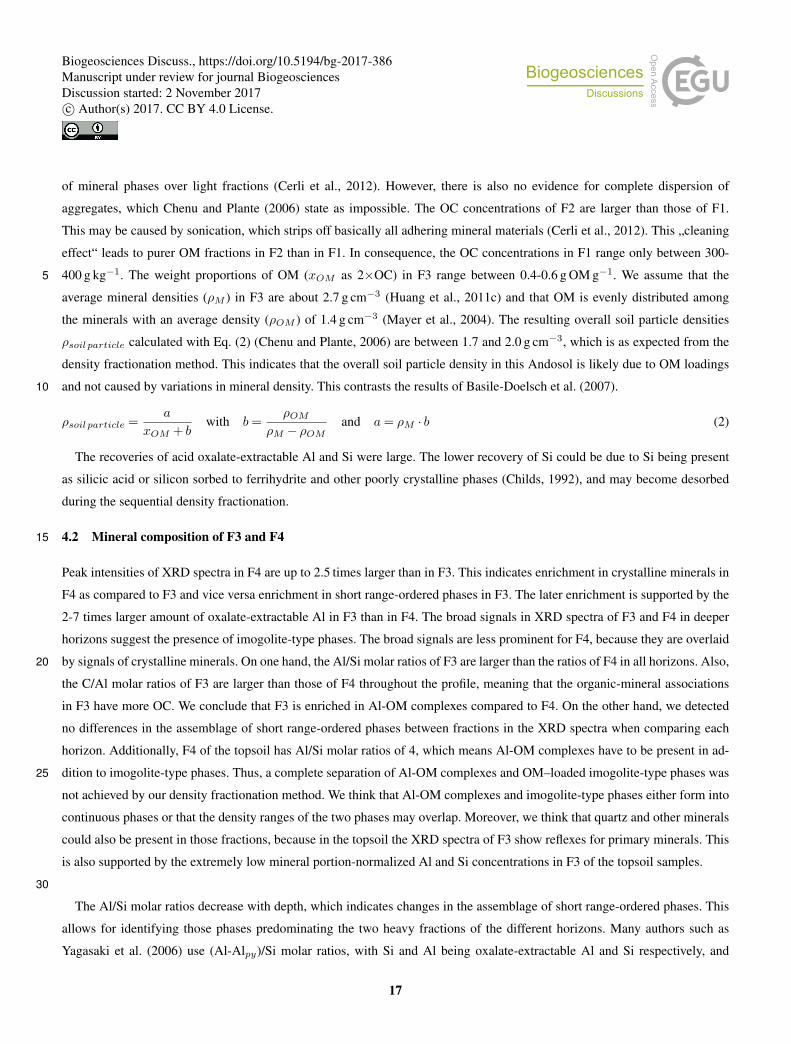
3.2.3 X-ray diffractograms of F3 and F415
Differential X-ray spectra of F3 and F4 show similar main reflexes as the spectra of the bulk samples. The overall signal
intensities in F4, are higher than for F3 spectra (Fig. 6). Moreover the F4 spectra show hardly any broad reflexions, while
the F3 spectra have broad reflexions at 6-8 , 20-30 and 40 ◦2θ. These characteristics reflect low crystallinity material and are
14
Biogeosciences Discuss., https://doi.org/10.5194/bg-2017-386Manuscript under review for journal BiogeosciencesDiscussion started: 2 November 2017c© Author(s) 2017. CC BY 4.0 License.
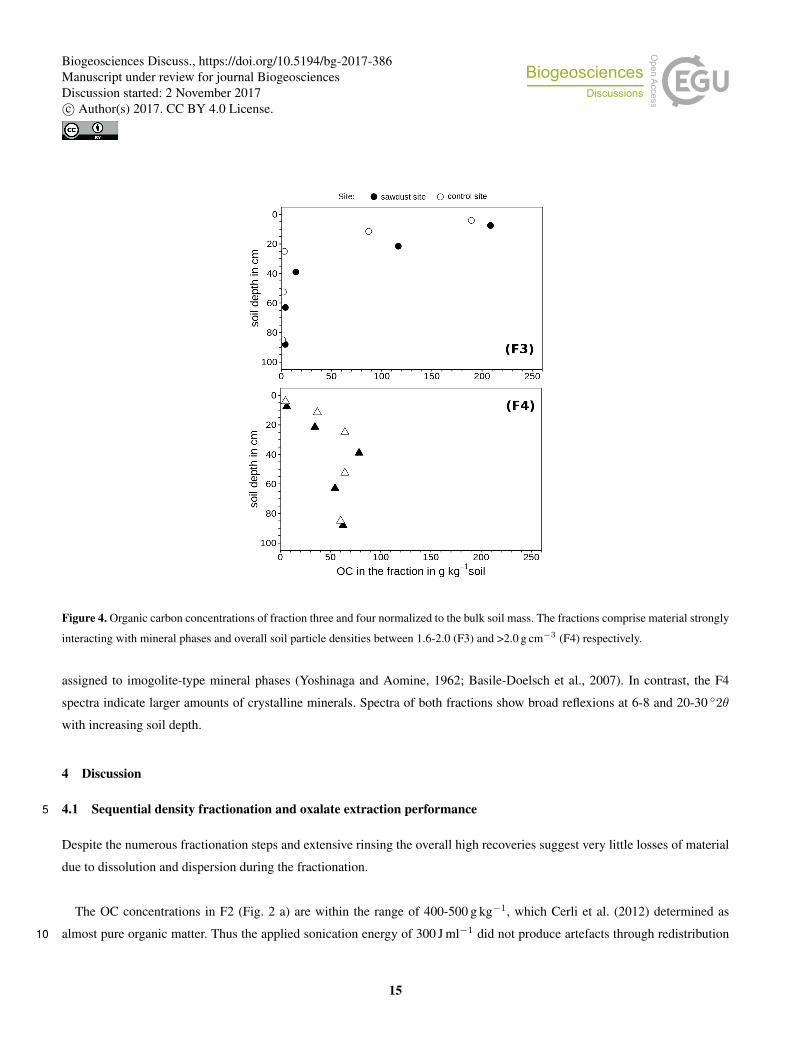
Figure 4. Organic carbon concentrations of fraction three and four normalized to the bulk soil mass. The fractions comprise material strongly
interacting with mineral phases and overall soil particle densities between 1.6-2.0 (F3) and >2.0 g cm−3 (F4) respectively.
assigned to imogolite-type mineral phases (Yoshinaga and Aomine, 1962; Basile-Doelsch et al., 2007). In contrast, the F4
spectra indicate larger amounts of crystalline minerals. Spectra of both fractions show broad reflexions at 6-8 and 20-30 ◦2θ
with increasing soil depth.
4 Discussion
4.1 Sequential density fractionation and oxalate extraction performance5
Despite the numerous fractionation steps and extensive rinsing the overall high recoveries suggest very little losses of material
due to dissolution and dispersion during the fractionation.
The OC concentrations in F2 (Fig. 2 a) are within the range of 400-500 g kg−1, which Cerli et al. (2012) determined as
almost pure organic matter. Thus the applied sonication energy of 300 J ml−1 did not produce artefacts through redistribution10
15
Biogeosciences Discuss., https://doi.org/10.5194/bg-2017-386Manuscript under review for journal BiogeosciencesDiscussion started: 2 November 2017c© Author(s) 2017. CC BY 4.0 License.
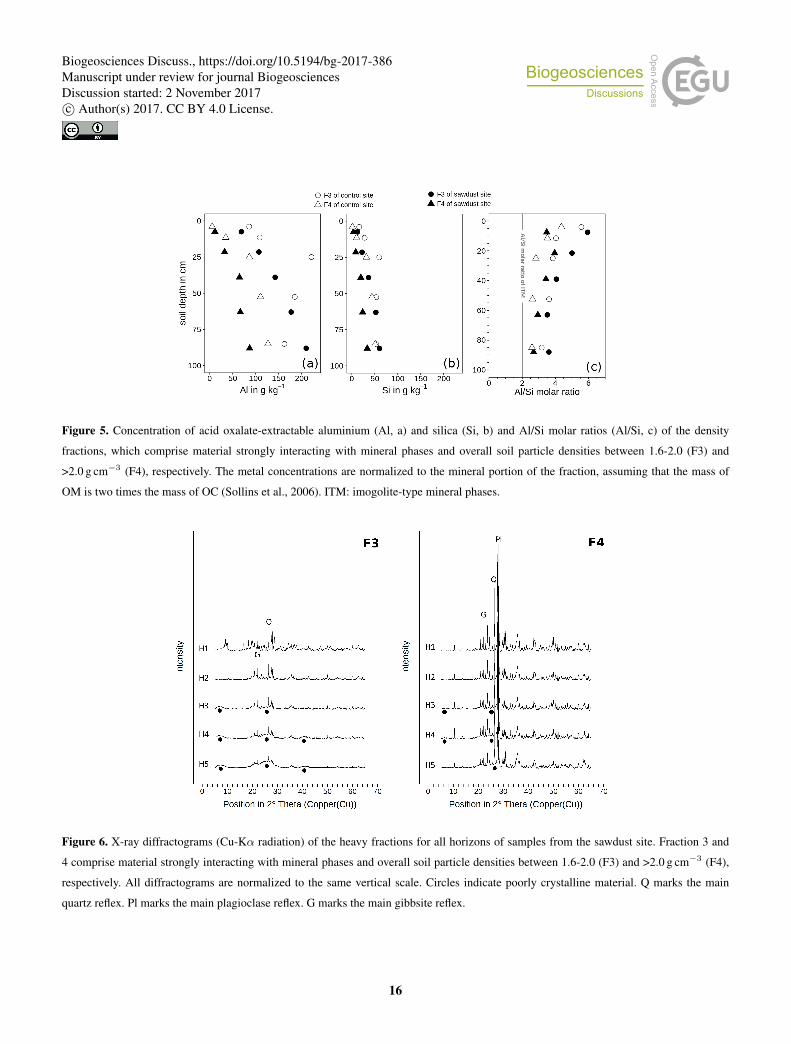
Figure 5. Concentration of acid oxalate-extractable aluminium (Al, a) and silica (Si, b) and Al/Si molar ratios (Al/Si, c) of the density
fractions, which comprise material strongly interacting with mineral phases and overall soil particle densities between 1.6-2.0 (F3) and
>2.0 g cm−3 (F4), respectively. The metal concentrations are normalized to the mineral portion of the fraction, assuming that the mass of
OM is two times the mass of OC (Sollins et al., 2006). ITM: imogolite-type mineral phases.
Figure 6. X-ray diffractograms (Cu-Kα radiation) of the heavy fractions for all horizons of samples from the sawdust site. Fraction 3 and
4 comprise material strongly interacting with mineral phases and overall soil particle densities between 1.6-2.0 (F3) and >2.0 g cm−3 (F4),
respectively. All diffractograms are normalized to the same vertical scale. Circles indicate poorly crystalline material. Q marks the main
quartz reflex. Pl marks the main plagioclase reflex. G marks the main gibbsite reflex.
16
Biogeosciences Discuss., https://doi.org/10.5194/bg-2017-386Manuscript under review for journal BiogeosciencesDiscussion started: 2 November 2017c© Author(s) 2017. CC BY 4.0 License.
of mineral phases over light fractions (Cerli et al., 2012). However, there is also no evidence for complete dispersion of
aggregates, which Chenu and Plante (2006) state as impossible. The OC concentrations of F2 are larger than those of F1.
This may be caused by sonication, which strips off basically all adhering mineral materials (Cerli et al., 2012). This „cleaning
effect“ leads to purer OM fractions in F2 than in F1. In consequence, the OC concentrations in F1 range only between 300-
400 g kg−1. The weight proportions of OM (xOM as 2×OC) in F3 range between 0.4-0.6 g OM g−1. We assume that the5
average mineral densities (ρM ) in F3 are about 2.7 g cm−3 (Huang et al., 2011c) and that OM is evenly distributed among
the minerals with an average density (ρOM ) of 1.4 g cm−3 (Mayer et al., 2004). The resulting overall soil particle densities
ρsoilparticle calculated with Eq. (2) (Chenu and Plante, 2006) are between 1.7 and 2.0 g cm−3, which is as expected from the
density fractionation method. This indicates that the overall soil particle density in this Andosol is likely due to OM loadings
and not caused by variations in mineral density. This contrasts the results of Basile-Doelsch et al. (2007).10
ρsoilparticle =a
xOM + bwith b=
ρOM
ρM − ρOMand a= ρM · b (2)
The recoveries of acid oxalate-extractable Al and Si were large. The lower recovery of Si could be due to Si being present
as silicic acid or silicon sorbed to ferrihydrite and other poorly crystalline phases (Childs, 1992), and may become desorbed
during the sequential density fractionation.
4.2 Mineral composition of F3 and F415
Peak intensities of XRD spectra in F4 are up to 2.5 times larger than in F3. This indicates enrichment in crystalline minerals in
F4 as compared to F3 and vice versa enrichment in short range-ordered phases in F3. The later enrichment is supported by the
2-7 times larger amount of oxalate-extractable Al in F3 than in F4. The broad signals in XRD spectra of F3 and F4 in deeper
horizons suggest the presence of imogolite-type phases. The broad signals are less prominent for F4, because they are overlaid
by signals of crystalline minerals. On one hand, the Al/Si molar ratios of F3 are larger than the ratios of F4 in all horizons. Also,20
the C/Al molar ratios of F3 are larger than those of F4 throughout the profile, meaning that the organic-mineral associations
in F3 have more OC. We conclude that F3 is enriched in Al-OM complexes compared to F4. On the other hand, we detected
no differences in the assemblage of short range-ordered phases between fractions in the XRD spectra when comparing each
horizon. Additionally, F4 of the topsoil has Al/Si molar ratios of 4, which means Al-OM complexes have to be present in ad-
dition to imogolite-type phases. Thus, a complete separation of Al-OM complexes and OM–loaded imogolite-type phases was25
not achieved by our density fractionation method. We think that Al-OM complexes and imogolite-type phases either form into
continuous phases or that the density ranges of the two phases may overlap. Moreover, we think that quartz and other minerals
could also be present in those fractions, because in the topsoil the XRD spectra of F3 show reflexes for primary minerals. This
is also supported by the extremely low mineral portion-normalized Al and Si concentrations in F3 of the topsoil samples.
30
The Al/Si molar ratios decrease with depth, which indicates changes in the assemblage of short range-ordered phases. This
allows for identifying those phases predominating the two heavy fractions of the different horizons. Many authors such as
Yagasaki et al. (2006) use (Al-Alpy)/Si molar ratios, with Si and Al being oxalate-extractable Al and Si respectively, and
17
Biogeosciences Discuss., https://doi.org/10.5194/bg-2017-386Manuscript under review for journal BiogeosciencesDiscussion started: 2 November 2017c© Author(s) 2017. CC BY 4.0 License.
Alpy being pyrophosphate-extractable Al. Pyrophosphate is supposed to extract Al from Al-OM complexes (Parfitt and Childs,
1988). We did not follow this approach, because the reliability of pyrophosphate–extraction has been questioned (Kaiser and
Zech, 1996; Thompson et al., 2011). Kaiser and Zech (1996) attribute this to high pH of extractant, which can result in disso-
lution of Al-containing mineral phases.
5
According to Amonette et al. (1994), oxalate-extractable Si originates almost exclusively from imogolite-type phases. The
results of our oxalate–extraction show, that this Andosol is poor in Si concentration, and therefore, only imogolite-type phases
with the minimum silicon content should be present. Instead of the pyrophosphate–extraction we proceeded as follows: We
used the assumptions listed below and adapted the formula proposed by Parfitt et al. (1985) and Mizota and Reeuwijk (1989)
with a fixed Al/Si molar ratio of 2 for Si-poor imogolite-type phases. With this it is possible to estimate imogolite-type phases,10
Al in Al-OM complexes and their molar portion in short range-ordered phases using the Eq. (3) to Eq. (5) (Table 4).
– oxalate-extractable Al (Al) is only incorporated in Al-OM complexes (AlAOC) and imogolite-type phases (AlITP )
– Al-OM complexes comprise compounds which contain mainly Al-O-C bonds and scarcely any Al-O-Al bonds, because
OM concentrations are high. Therefore we assume that Al-OM complexes contain on average 1.1 mol Al per 1 mol
Al-OM complexes.15
– oxalate-extractable Si is only incorporated in imogolite-type phases (= SiITP )
– AlITP /SiITP molar ratio is 2
– ITPcal calculated concentration of imogolite-type phases
ITPcal = 7.5 ·SiITP (3)
AlAOC =Al− 2 ·SiITP (4)20
ITP proportion=1/2 ·AlITP
1/2 ·AlITP + 1/1.1 ·AlAOC· 100 with Si and Al in mol · kg−1 (5)
18
Biogeosciences Discuss., https://doi.org/10.5194/bg-2017-386Manuscript under review for journal BiogeosciencesDiscussion started: 2 November 2017c© Author(s) 2017. CC BY 4.0 License.

Table 4. Concentration of imogolite-type phase (ITPcal), Al in Al-OM complexes (AlAOC ) and imogolite-type phase molar portions on the
assemblage of short range-ordered phases (SRO) for F3 and F4, as calculated with Eq. (3) to Eq. (5). Data is presented as the mean and
ranges in parenthesis.
horizon depth ITPcal AlAOC molar portion ITP on SRO
cm g kg−1 g kg−1 mol %
F3 F4 F3 F4 F3 F4
control site
H1 4 122 (±2) 10 (±1) 55 (±0) 3 (±0) 24 32
H2 12 212 (±23) 78 (±0) 55 (±6) 15 (±1) 35 42
H3 25 452 (±11) 239 (±3) 106 (±3) 25 (±0) 37 57
H4 52 402 (±0) 332 (±4) 83 (±0) 26 (±0) 40 63
H5 85 402 (±0) 384 (±3) 60 (±0) 29 (±0) 48 65
sawdust site
H1 8 91 (±5) 26 (±4) 46 (±5) 5 (±1) 22 42
H2 22 168 (±3) 64 (±3) 64 (±1) 16 (±1) 27 36
H3 39 276 (±2) 149 (±0) 72 (±1) 27 (±1) 35 43
H4 63 396 (±5) 178 (±0) 77 (±4) 21 (±1) 42 54
H5 88 457 (±4) 254 (±2) 94 (±2) 22 (±1) 40 61
19
Biogeosciences Discuss., https://doi.org/10.5194/bg-2017-386Manuscript under review for journal BiogeosciencesDiscussion started: 2 November 2017c© Author(s) 2017. CC BY 4.0 License.

We estimated the weight proportion of short range-ordered phases from F3 and F4 on the bulk mineral mass and divided
them into the groups "very abundant", "abundant", "low" and "traces" by using Al and Si mass distributions in the different
fractions (Table 5). Results show that in the topsoil short range-ordered phases are mostly present in F3 and in the subsoil
they are mostly present in F4. On the basis of the calculated imogolite-type phase molar portions we decided on the prevalent
species of the short range-ordered phase assemblages (Table 5). In the topsoil, Al-OM complexes prevail, because imogolite-5
type phases contribute only with < 30 wt% to short range-ordered phases of F3. In the subsoil, the presence of imogolite-type
phases and Al-OM complexes is more balanced in F4, with increasing portions of imogolite-type phases with depth.
The characteristic broad signals indicating imogolite-type phases in the X-ray diffractograms appear in the subsoil, but not
in the topsoil (Fig. 6). Imogolite-type phases dissolve at pH values below 4.8 (Huang et al., 2011b). The pH values in the10
subsoil are equal or above 4.8, whereas pH values in the topsoil are below 4.8 (Table 1). Thus, the X-ray diffractograms
and pH values support our suggestion and explain the presence of imogolite-type phases in the subsoil and their absence in
the topsoil. We conclude that the studied Andosol shows aluandic properties in the topsoil and silandic properties in the subsoil.
4.3 Organic carbon storage forms15
In comparison to Amazonian Oxisols (1-3 g PyC kg−1 soil, 140 g PyC kg−1 OC, Glaser et al. (2000)) and Terra Preta soils (4-
20 g PyC kg−1 soil, 350 g PyC kg−1 OC, Glaser et al. (2000)), the studied Andosol has medium to high PyC concentrations.
However, PyC plays only a marginal role for the accumulation of total OM because it contributes only up to 5 wt% to the
OC concentration. We consider the later conclusion true, although the conversion factor of 2.3 is criticized by Schneider et al.
(2010) as inaccurate.20
Only up to 20 wt% of OM in the topsoil and 2 wt% in the subsoil is not bound to mineral phases. The low proportions of
OC in the light fractions is in line with data published by Paul et al. (2008) for topsoils of Andosols under tropical rainforest
(20 wt% for material with densities <1.6 g cm−3). This is caused by rapid mineralization of particulate OM and the strong
interaction of minerals with OM in Andosols (Basile-Doelsch et al., 2007; Huang et al., 2011a). Thus, the mineral phase plays25
the dominant role in stabilizing OM in this Andosol.
We used OC mass distributions in the different fractions for dividing OC from F3 and F4 into the groups "very abundant",
"abundant", "low" and "traces" (Table 5). The OC abundance clearly correlates with the distribution of mineral phases in both
fractions. In the topsoil, OC is mainly associated with Al-OM complexes, whereas the OC in the subsoil is mainly bonded to30
imogolite-type phases. Based on the results in section 4.2 we suggest that Al-OM complexes are in close contact to imogolite-
type phases e.g. precipitate on the surfaces.
20
Biogeosciences Discuss., https://doi.org/10.5194/bg-2017-386Manuscript under review for journal BiogeosciencesDiscussion started: 2 November 2017c© Author(s) 2017. CC BY 4.0 License.

Table 5. Mineralogical control of organic carbon (OC) stabilization in fraction three and four. The mass proportions in the different fractions
for OC and short range-ordered and nano- or micro-crystalline phases (SRO) range from "+++" (very abundant, > 75 wt%), "++" (abundant,
75-30 wt%), "+" (low, 30-3 wt%) to "tr" (traces, < 3 wt%). The prevalent short range-ordered species are defined by the imogolite-type phase
molar proportion on the short range-ordered phase (Table 4). For the mean molar proportions of both sites < 33 wt% Al-OM complexes
prevail. For molar proportions between 33 and 67 wt% Al-OM complexes and imogolite-type phases are balanced, with the first mentioned
short range-ordered species being present in slightly larger portion than the other. For molar proportions > 67 wt% imogolite-type phases
prevail. ITP: imogolite-type phases. AOC: Al-OM complexes
horizon F3 F4
OC proportion SRO proportion prevalent SRO species OM proportion SRO proportion prevalent SRO species
H1 +++ +++ AOC tr tr AOC, ITP
H2 ++ ++ AOC + + AOC, ITP
H3 + + AOC, ITP +++ +++ AOC, ITP
H4 tr tr AOC, ITP +++ +++ ITP, AOC
H5 tr tr AOC, ITP +++ +++ ITP, AOC
21
Biogeosciences Discuss., https://doi.org/10.5194/bg-2017-386Manuscript under review for journal BiogeosciencesDiscussion started: 2 November 2017c© Author(s) 2017. CC BY 4.0 License.

4.4 Organic carbon response to sawdust input
No sawdust was optically visible neither in the soil profile nor in the light density fractions prior to grounding. Chambers
et al. (2000) report that wood density and bole diameter were significantly and inversely correlated with the decomposition rate
constants for dead trees in tropical forests of the central Amazon. For the smalest bole diameter (10 cm) the authors calculated
0.26 year−1 as the lowest rate constant. A dead tree with such a diameter would then be decomposed to 99 % after 17 years.5
Additionally Powers et al. (2009) showed that in tropical soils the decomposition rate increases lineary with the precipitation.
With sawdust beeing much finer in texture than a dead tree and the precipitation at the CERFA site being twice as high as at
the site of Chambers et al. (2000), we expect a much faster decomposition than 17 years. Moreover, the phosphorus concen-
trations, determined in an aqua regia solution for samples taken from the first 20 cm (data not shown) are significantly larger
at the sawdust site than at the control site. The additional phosphorus at the sawdust site matches the phosphorus input via10
sawdust. Additionally, the C/N ratios of all fractions in the upper two horizons are below 20, showing no difference between
the two sites. From all this we conclude that the added sawdust, which has a C/N mass ratio of around 110, was completely
decomposed on-site.
The sawdust did not significantly increase the bulk OC concentrations in the upper two horizons. We also found no indi-15
cations of additional inclusion of OM into macro-aggregates. This holds true despite the fact that the sample of the second
horizon used for the sequential density fractionation at the sawdust site has a larger OC concentration than the sample at the
control site. Those results have to be interpreted with some caution in terms of site comparison, because we conducted the
fractionation experiment only with one profile per site. The sequential density fractionation also revealed that over 80-89 wt%
of OC are strongly associated with minerals. We therefore conclude that the topsoil is saturated with OC and not even small20
parts of the massive carbon input can be additionally stored. We assign this to limited and saturated storage capacities of the
mineral phase.
Kaiser and Kalbitz (2012) state that in soils, where percolating water controls transport processes a steady input of surface-
reactive plant derived compounds force less strongly binding compounds to move further down. Thus, OM migrates downwards25
in form of dissolved OM if the OM storage capacities in the top layer are exhausted. When reaching soil horizons with free
storage capacity the dissolved OM compounds are retained and OC concentration increases. This would explain the signifi-
cantly larger OC concentration in the third horizon at the sawdust site. As long as the third horizon has free storage capacities,
the OC concentration in horizon four and five will not increase, which is in line with our results. Over 90 wt% of the additional
OM in the third horizon are recovered in F3 and F4 together. Thus, the increase in bulk OC concentration in the third horizon30
is due to OM strongly interacting with the mineral phase and thus of long term stability.
The increase in OC concentration in the third horizon in response to the added sawdust could, with respect to the mech-
anisms, be either due to undersaturated sorption complexes or a change in carbon storage mechanisms towards mechanisms
22
Biogeosciences Discuss., https://doi.org/10.5194/bg-2017-386Manuscript under review for journal BiogeosciencesDiscussion started: 2 November 2017c© Author(s) 2017. CC BY 4.0 License.
with higher carbon storage capacities. It is noticeable, that the larger OC bulk concentration in the sample of the third horizon
used in the fractionation experiment of the sawdust site correlates with a larger proportion of F3 and slightly lower pH values
compared to the third horizon at the control site. The lower pH values are not the result of the mineralization of 18 Mg ha−1
nitrogen, which were added along with the sawdust, because the decomposition of sawdust was complete and therefore basic
cations were also released. Those basic cations buffer the released protons from the nitrification reaction (Breemen et al., 1983).5
This result suggest that the percolating DOM solution also influences the short range-ordered phase composition via reactions
with protons. This implies that previously formed imogolite-type phases may be in situ transformed into Al-OM complexes in
response to changes in pH and OM input.
The OC stock increased significantly at the sawdust site for the depth section of 25-50 cm, which belongs to the subsoil and10
comprises mostly the third horizon. We found that this difference was due to the increase in OC concentration and not caused
by neither layer thickness, nor bulk density variations. Despite this increased in OC stock in parts of the subsoil, we found no
evidence that the added sawdust increased the total OC stock significantly. We think that this is not due to smaller numbers
of bulk density measurements compared to all other parameters, because Schrumpf et al. (2011) found that the contribution of
bulk density to the OC stock variability was lower and decreased with soil depth than the contribution of OC concentration and15
layer thickness. We rather think, that the large variability of OC concentrations in the topsoil overlay the effect of the larger OC
concentration in the subsoil at the sawdust site. To evaluate the OC accumulation, we calculated the increase in OC stock within
the depth section 25-50 cm (Tab 3). The resulting additional OC stock at the sawdust sites is 12 Mg ha−1, which represents
only 0.7 wt% of the originally added 1800 Mg OC ha−1. Thus, the studied Andosol has an extremely low OC accumulation
rate. Six et al. (2002) postulate in their saturation concept that soils, which are close to their maximum OC storage capacity20
have low accumulation rates.
5 Conclusions
The massive OC input did not increase the OC concentration in topsoils but in the subsoil, which resulted in significantly larger
OC stocks for the subsoil. Thus, the OC-rich Andosol topsoils are not capable of storing additional carbon, likely because of
limited binding capacities of their mineral phases. Seemingly, some of the additional OC migrates downwards with the perco-25
lating water until reaching layers where free binding sites are available. The studied soils, hence, are saturated with OC when
only considering the topsoils but still have large capacity to host more OC in their deeper layers.
The OC increase in the subsoil was exclusively due to binding to mineral phases. Since binding to mineral phases promotes
retarded mineralization, i.e., longer turnover times, stabilization, and thus, long-term storage of the additional OC can be ex-30
pected.
23
Biogeosciences Discuss., https://doi.org/10.5194/bg-2017-386Manuscript under review for journal BiogeosciencesDiscussion started: 2 November 2017c© Author(s) 2017. CC BY 4.0 License.
The additional OC was likely stored within Al-OM complexes and by binding to imogolite-type phases. There are indica-
tions that the input of additional OC into the subsoils induced dissolution of the imogolite-type mineral phases and subsequent
formation of Al-OM complexes. This transition from a predominately silandic to a more aluandic mineral assemblage would
increase the subsoils storage capacity for OC. It also suggest that silandic Andosols can gradually become aluandic.
Despite the increase in subsoil OC, there was no significant change in total OC stocks in response to the massive OC inputs5
over a period of 20 years. This was basically because of spatial variations that demand for larger changes than the observed
ones to become significantly different.
The results clearly show that accumulation efficiency of the added OC was very low. Increasing the OC stock in soils already
rich in OC requires comparably large inputs over long time periods to induce OC transport into the deeper soil layers. This10
contrasts the situation in young soils where OC stocks build up rapidly in surface-near layers.
24
15
Biogeosciences Discuss., https://doi.org/10.5194/bg-2017-386Manuscript under review for journal BiogeosciencesDiscussion started: 2 November 2017c© Author(s) 2017. CC BY 4.0 License.
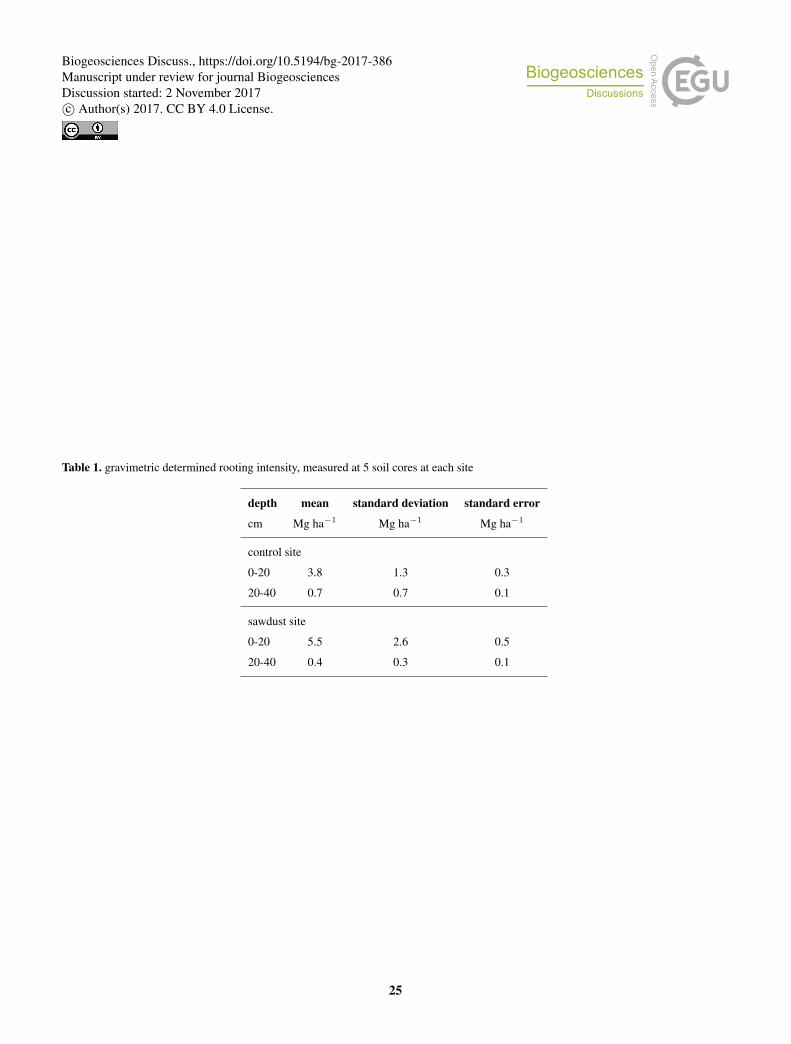
Table 1. gravimetric determined rooting intensity, measured at 5 soil cores at each site
depth mean standard deviation standard error
cm Mg ha−1 Mg ha−1 Mg ha−1
control site
0-20 3.8 1.3 0.3
20-40 0.7 0.7 0.1
sawdust site
0-20 5.5 2.6 0.5
20-40 0.4 0.3 0.1
25
Biogeosciences Discuss., https://doi.org/10.5194/bg-2017-386Manuscript under review for journal BiogeosciencesDiscussion started: 2 November 2017c© Author(s) 2017. CC BY 4.0 License.
Competing interests. The authors declare that they have no conflict of interest.
Acknowledgements. The authors acknowledge the financial support of the Technische Universität Berlin. The pyrogenic carbon analysis5
were conducted by Arne Kappenberg at the department of soil science at the Rheinische Friedrich-Wilhelms-Universität Bonn, for which we
are grateful. We also acknowledge Nelson Omar Tello Benalcázar and Josue Tenorio for providing the study sites and assisting during the
field work.
26
Biogeosciences Discuss., https://doi.org/10.5194/bg-2017-386Manuscript under review for journal BiogeosciencesDiscussion started: 2 November 2017c© Author(s) 2017. CC BY 4.0 License.
References
Amonette, J. E., Zelazny, L. W., and Dahlgren, R. A.: Quantification of Allophane and Imogolite, in: Quantitative Methods in Soil Mineral-
ogy, ACSESS publications, Soil Science Society of America, 1994.
Basile-Doelsch, I., Amundson, R., Stone, W., Borschneck, D., Bottero, J. Y., Moustier, S., Masin, F., and Colin, F.: Mineral control of carbon5
pools in a volcanic soil horizon, Geoderma, 137, 477–489, https://doi.org/10.1016/j.geoderma.2006.10.006, gelesen, 2007.
Boudot, J.-P.: Relative efficiency of complexed aluminum noncrystalline Al hydroxide, allophane and imogolite in retarding the biodegrada-
tion of citric acid, Geoderma, 52, 29–39, https://doi.org/10.1016/0016-7061(92)90073-G, http://www.sciencedirect.com/science/article/
pii/001670619290073G, 1992.
Breemen, N. v., Mulder, J., and Driscoll, C. T.: Acidification and alkalinization of soils, Plant and Soil, 75, 283–308,10
https://doi.org/10.1007/BF02369968, https://link.springer.com/article/10.1007/BF02369968, 1983.
Brodowski, S., Rodionov, A., Haumaier, L., Glaser, B., and Amelung, W.: Revised black carbon assessment using benzene polycarboxylic
acids, Organic Geochemistry, 36, 1299–1310, https://doi.org/10.1016/j.orggeochem.2005.03.011, 2005.
Campbell, C. A., Zentner, R. P., Bowren, K. E., Townley-Smith, L., and Schnitzer, M.: Effect of crop rotations and fertilization on
soil organic matter and some biochemical properties of a thick Black Chernozem, Canadian Journal of Soil Science, 71, 377–387,15
https://doi.org/10.4141/cjss91-036, http://www.nrcresearchpress.com/doi/abs/10.4141/cjss91-036, 1991.
Campbell, E. E. and Paustian, K.: Current developments in soil organic matter modeling and the expansion of model applications: a review,
Environmental Research Letters, 10, 123 004, https://doi.org/10.1088/1748-9326/10/12/123004, http://stacks.iop.org/1748-9326/10/i=12/
a=123004, 2015.
Cerli, C., Celi, L., Kalbitz, K., Guggenberger, G., and Kaiser, K.: Separation of light and heavy organic matter fractions in soil — Testing for20
proper density cut-off and dispersion level, Geoderma, 170, 403–416, https://doi.org/10.1016/j.geoderma.2011.10.009, 2012.
Chambers, J. Q., Higuchi, N., Schimel, J. P., Ferreira, L. V., and Melack, J. M.: Decomposition and carbon cycling of dead trees in tropi-
cal forests of the central Amazon, Oecologia, 122, 380–388, https://doi.org/10.1007/s004420050044, https://link.springer.com/article/10.
1007/s004420050044, 2000.
Chenu, C. and Plante, A. F.: Clay-sized organo-mineral complexes in a cultivation chronosequence: revisiting the concept of the ’primary25
organo-mineral complex’, European Journal of Soil Science, 57, 596–607, https://doi.org/10.1111/j.1365-2389.2006.00834.x, 2006.
Childs, C. W.: Ferrihydrite: A review of structure, properties and occurrence in relation to soils, Zeitschrift für Pflanzenernährung und
Bodenkunde, 155, 441–448, https://doi.org/10.1002/jpln.19921550515, http://dx.doi.org/10.1002/jpln.19921550515, 1992.
Clark, D. A., Brown, S., Kicklighter, D. W., Chambers, J. Q., Thomlinson, J. R., Ni, J., and Holland, E. A.: Net Pri-
mary Production in Tropical Forests: An Evaluation and Synthesis of Existing Field Data, Ecological Applications, 11, 371–30
384, https://doi.org/10.1890/1051-0761(2001)011[0371:NPPITF]2.0.CO;2, http://onlinelibrary.wiley.com/doi/10.1890/1051-0761(2001)
011[0371:NPPITF]2.0.CO;2/abstract, 2001.
Colombo, C., Ricciardella, M., Cerce, A. D., Maiuro, L., and Violante, A.: Effect of Tannate, pH, sample preparation, ageing and temperature
on the formation and nature of Al oxyhydroxides, Clays and Clay Minerals, 52, 721–733, https://doi.org/10.1346/CCMN.2004.0520607,
http://ccm.geoscienceworld.org/content/52/6/721, 2004.35
Glaser, B., Balashov, E., Haumaier, L., Guggenberger, G., and Zech, W.: Black carbon in density fractions of anthropogenic soils of the Brazil-
ian Amazon region, Organic Geochemistry, 31, 669–678, https://doi.org/10.1016/S0146-6380(00)00044-9, http://www.sciencedirect.com/
science/article/pii/S0146638000000449, 2000.
27
Biogeosciences Discuss., https://doi.org/10.5194/bg-2017-386Manuscript under review for journal BiogeosciencesDiscussion started: 2 November 2017c© Author(s) 2017. CC BY 4.0 License.
Hall, M. L., Claude, R., Bernardo, B., Mothes, P., and Monzier, M.: Tungurahua Volcano, Ecuador: structure, eruptive history and hazards.
J Volcanol Geotherm Res, Journal of Volcanology and Geothermal Research, 91, 1–21, https://doi.org/10.1016/S0377-0273(99)00047-5,
1999.
Huang, P. M., Li, M., and Sumner, M., eds.: Handbook of Soil Sciences: Resource Management and Environmental Impacts Volume II:5
chapter 7 Mineralogical,Physicochemical, and Microbiological Controls on Soil Organic Matter Stabilization and Turnover, CRC Press
Inc, [s.l.], 2 aufl. edn., 2011a.
Huang, P. M., Li, Y., and Sumner, M. E., eds.: Handbook of Soil Sciences: Properties and Processes, Second Edition: Chapter 20 Alteration,
Formation, Occurence of Minerals in Soils, Taylor & Francis, https://books.google.de/books?id=9BJlVxJLNO8C, 2011b.
Huang, P. M., Li, Y., and Sumner, M. E., eds.: Handbook of Soil Sciences: Properties and Processes, Second Edition: Chapter 33.3 Andisols,10
Taylor & Francis, https://books.google.de/books?id=9BJlVxJLNO8C, 2011c.
Hörmann, P. K. and Pichler, H.: Geochemistry, petrology and origin of the Cenozoic volcanic rocks of the Northern Andes in Ecuador,
Journal of Volcanology and Geothermal Research, 12, 259–282, https://doi.org/10.1016/0377-0273(82)90029-4, 1982.
Kaiser, K. and Guggenberger, G.: Distribution of hydrous aluminium and iron over density fractions depends on organic matter load and
ultrasonic dispersion, Geoderma, 140, 140–146, https://doi.org/10.1016/j.geoderma.2007.03.018, 2007.15
Kaiser, K. and Kalbitz, K.: Cycling downwards – dissolved organic matter in soils, Soil Biology and Biochemistry, 52, 29–32,
https://doi.org/10.1016/j.soilbio.2012.04.002, http://www.sciencedirect.com/science/article/pii/S0038071712001381, 2012.
Kaiser, K. and Zech, W.: Deffects in estimation of alluminium in humus complexes of podzolic soils by pyrophosphate extraction, Soil
Science, 161, 452–458, https://doi.org/10.1097/00010694-199607000-00005, 1996.
Kögel-Knabner, I., Guggenberger, G., Kleber, M., Kandeler, E., Kalbitz, K., Scheu, S., Eusterhues, K., and Leinweber, P.: Organo-mineral20
associations in temperate soils: Integrating biology, mineralogy, and organic matter chemistry, Journal of Plant Nutrition and Soil Science,
171, 61–82, https://doi.org/10.1002/jpln.200700048, http://onlinelibrary.wiley.com/doi/10.1002/jpln.200700048/abstract, 2008.
Lal, R.: Soil Carbon Sequestration Impacts on Global Climate Change and Food Security, Science, 304, 1623–1627,
https://doi.org/10.1126/science.1097396, http://science.sciencemag.org/content/304/5677/1623, 2004.
Le Pennec, J.-L., Ruiz, G. A., Ramón, P., Palacios, E., Mothes, P., and Yepes, H.: Impact of tephra falls on Andean communities: The25
influences of eruption size and weather conditions during the 1999–2001 activity of Tungurahua volcano, Ecuador, Journal of Volcanology
and Geothermal Research, 217-218, 91–103, https://doi.org/10.1016/j.jvolgeores.2011.06.011, 2012.
Levard, C., Doelsch, E., Basile-Doelsch, I., Abidin, Z., Miche, H., Masion, A., Rose, J., Borschneck, D., and Bottero,
J. Y.: Structure and distribution of allophanes, imogolite and proto-imogolite in volcanic soils, Geoderma, 183–184, 100–108,
https://doi.org/10.1016/j.geoderma.2012.03.015, http://www.sciencedirect.com/science/article/pii/S0016706112001280, 2012.30
Masion, A., Thomas, F., Bottero, J.-Y., Tchoubar, D., and Tekely, P.: Formation of amorphous precipitates from aluminum-organic ligands so-
lutions: macroscopic and molecular study, Journal of Non-Crystalline Solids, 171, 191–200, https://doi.org/10.1016/0022-3093(94)90355-
7, http://www.sciencedirect.com/science/article/pii/0022309394903557, 1994.
Mayer, L. M., Schick, L. L., Hardy, K. R., Wagai, R., and McCarthy, J.: Organic matter in small mesopores in sediments and soils, Geochim-
ica et Cosmochimica Acta, 68, 3863–3872, https://doi.org/10.1016/j.gca.2004.03.019, http://www.sciencedirect.com/science/article/pii/35
S0016703704002443, 2004.
Mizota, C. and Reeuwijk, L. P. v.: Clay mineralogy and chemistry of soils formed in volcanic material in diverse climatic regions, vol. 2 of
Soil monograph, International Soil Reference and Information Centre, Wageningen, the Netherlands, 1989.
28
Biogeosciences Discuss., https://doi.org/10.5194/bg-2017-386Manuscript under review for journal BiogeosciencesDiscussion started: 2 November 2017c© Author(s) 2017. CC BY 4.0 License.
Parfitt, R. L. and Childs, C. W.: Estimation of forms of Fe and Al - a review, and analysis of contrasting soils by dissolution and Mossbauer
methods, Soil Research, 26, 121–144, https://doi.org/10.1071/sr9880121, http://www.publish.csiro.au/sr/SR9880121, 1988.
Parfitt, R. L., Wilson, A. D., and Hutt, L.: Estimation of allophane and halloysie in three sequences of volcanic soils new zealand, Volcanic
Soils Catena Suplement, 1985.5
Paul, S., Veldkamp, E., and Flessa, H.: Soil organic carbon in density fractions of tropical soils under forest – pasture – secondary forest
land use changes, European Journal of Soil Science, 59, 359–371, https://doi.org/10.1111/j.1365-2389.2007.01010.x, http://dx.doi.org/10.
1111/j.1365-2389.2007.01010.x, 2008.
Paustian, K., Andrén, O., Janzen, H. H., Lal, R., Smith, P., Tian, G., Tiessen, H., Van Noordwijk, M., and Woomer, P. L.: Agricultural
soils as a sink to mitigate CO2 emissions, Soil Use and Management, 13, 230–244, https://doi.org/10.1111/j.1475-2743.1997.tb00594.x,10
http://onlinelibrary.wiley.com/doi/10.1111/j.1475-2743.1997.tb00594.x/abstract, 1997.
Powers, J. S., Montgomery, R. A., Adair, E. C., Brearley, F. Q., DeWalt, S. J., Castanho, C. T., Chave, J., Deinert, E., Ganzhorn, J. U., Gilbert,
M. E., González-Iturbe, J. A., Bunyavejchewin, S., Grau, H. R., Harms, K. E., Hiremath, A., Iriarte-Vivar, S., Manzane, E., De Oliveira,
A. A., Poorter, L., Ramanamanjato, J.-B., Salk, C., Varela, A., Weiblen, G. D., and Lerdau, M. T.: Decomposition in tropical forests:
a pan-tropical study of the effects of litter type, litter placement and mesofaunal exclusion across a precipitation gradient, Journal of15
Ecology, 97, 801–811, https://doi.org/10.1111/j.1365-2745.2009.01515.x, http://onlinelibrary.wiley.com/doi/10.1111/j.1365-2745.2009.
01515.x/abstract, 2009.
Sauer, W.: Geologie von Ecuador, vol. 11, Gebruder Borntraeger, Berlin, Stuttgart, 1971.
Schmidt, M. W. I., Rumpel, C., and Kögel-Knabner, I.: Evaluation of an ultrasonic dispersion procedure to isolate primary organomineral
complexes from soils, European Journal of Soil Science, 50, 87–94, https://doi.org/10.1046/j.1365-2389.1999.00211.x, 1999.20
Schmidt, M. W. I., Torn, M. S., Abiven, S., Dittmar, T., Guggenberger, G., Janssens, I. A., Kleber, M., Kögel-Knabner, I., Lehmann, J.,
Manning, D. A. C., Nannipieri, P., Rasse, D. P., Weiner, S., and Trumbore, S. E.: Persistence of soil organic matter as an ecosystem
property, Nature, 478, 49–56, https://doi.org/10.1038/nature10386, http://www.nature.com/nature/journal/v478/n7367/full/nature10386.
html, 2011.
Schneider, M. P., Hilf, M., Vogt, U. F., and Schmidt, M. W.: The benzene polycarboxylic acid (BPCA) pattern of wood pyrolyzed between25
200°C and 1000°C, Organic Geochemistry, 41, 1082–1088, https://doi.org/10.1016/j.orggeochem.2010.07.001, 2010.
Schrumpf, M., Schulze, E. D., Kaiser, K., and Schumacher, J.: How accurately can soil organic carbon stocks and stock changes be quanti-
fied by soil inventories?, Biogeosciences, 8, 1193–1212, https://doi.org/10.5194/bg-8-1193-2011, http://www.biogeosciences.net/8/1193/
2011/, 2011.
Schrumpf, M., Kaiser, K., Guggenberger, G., Persson, T., Kögel-Knabner, I., and Schulze, E.-D.: Storage and stability of organic30
carbon in soils as related to depth, occlusion within aggregates, and attachment to minerals, Biogeosciences, 10, 1675–1691,
https://doi.org/10.5194/bg-10-1675-2013, druck vorhanden, 2013.
Schwarz, T.: Klima: Puyo, http://de.climate-data.org/location/2971/, 2015.
Schwertmann, U.: Differenzierung der Eisenoxide des Bodens durch Extraktion mit Ammoniumoxalat-Lösung, Zeitschrift für Pflanzen-
ernährung, Düngung, Bodenkunde, 105, 194–202, https://doi.org/10.1002/jpln.3591050303, 1964.35
Six, J., Conant, R. T., Paul, E. A., and Paustian, K.: Stabilization mechanisms of soil organic matter: Implications for C-saturation
of soils, Plant and Soil, 241, 155–176, https://doi.org/10.1023/A:1016125726789, http://link.springer.com/article/10.1023%2FA%
3A1016125726789, 2002.
29
Biogeosciences Discuss., https://doi.org/10.5194/bg-2017-386Manuscript under review for journal BiogeosciencesDiscussion started: 2 November 2017c© Author(s) 2017. CC BY 4.0 License.
Sollins, P., Swanston, C., Kleber, M., Filley, T., Kramer, M., Crow, S., Caldwell, B. A., Lajtha, K., and Bowden, R.: Organic C
and N stabilization in a forest soil: Evidence from sequential density fractionation, Soil Biology and Biochemistry, 38, 3313–3324,
https://doi.org/10.1016/j.soilbio.2006.04.014, 2006.
Stewart, C. E., Paustian, K., Conant, R. T., Plante, A. F., and Six, J.: Soil carbon saturation: concept, evidence and evaluation, Biogeochem-5
istry, 86, 19–31, https://doi.org/10.1007/s10533-007-9140-0, http://link.springer.com/article/10.1007/s10533-007-9140-0, 2007.
Tello, O.: History of the region around CEFRA: verbal, 2014.
Thompson, A., Rancourt, D. G., Chadwick, O. A., and Chorover, J.: Iron solid-phase differentiation along a redox gradient in basaltic soils,
Geochimica et Cosmochimica Acta, 75, 119–133, https://doi.org/10.1016/j.gca.2010.10.005, https://www.sciencedirect.com/science/
article/pii/S0016703710005740, 2011.10
Wendt, J. W. and Hauser, S.: An equivalent soil mass procedure for monitoring soil organic carbon in multiple soil layers, European Journal
of Soil Science, 64, 58–65, https://doi.org/10.1111/ejss.12002, http://onlinelibrary.wiley.com/doi/10.1111/ejss.12002/abstract, 2013.
WRB: World reference base for soil resources, 2006: A framework for international classification, correlation and communication, vol. 103
of World soil resources reports, Food and Agriculture Organization of the United Nations, Rome, 2006 ed. edn., 2006.
Yagasaki, Y., Mulder, J., and Okazaki, M.: The role of soil organic matter and short-range ordered aluminosilicates in controlling the activity15
of aluminum in soil solutions of volcanic ash soils, Geoderma, 137, 40–57, https://doi.org/10.1016/j.geoderma.2006.07.001, 2006.
Yoshinaga, N. and Aomine, S.: Allophane in Some Ando Soils, Soil Science and Plant Nutrition, 8, 6–13,
https://doi.org/10.1080/00380768.1962.10430983, http://dx.doi.org/10.1080/00380768.1962.10430983, 1962.575
30
Biogeosciences Discuss., https://doi.org/10.5194/bg-2017-386Manuscript under review for journal BiogeosciencesDiscussion started: 2 November 2017c© Author(s) 2017. CC BY 4.0 License.