instant gelation synthesis of 3d porous mos2@c · pdf fileinstant gelation synthesis of 3d...
TRANSCRIPT

Supporting information
Instant Gelation Synthesis of 3D Porous MoS2@C
Nanocomposites for Lithium Ion Batteries
Ling Feia, Yun Xua, Xiaofei Wua, Gen Chena, Yuling Lia, Binsong Lib, Shuguang Denga,
Sergei Smirnovc, Hongyou Fanb, and Hongmei Luoa*
aDepartment of Chemical Engineering, New Mexico State University, Las Cruces, New Mexico
88003, United States
bAdvanced Materials Laboratory, Sandia National Laboratories, Albuquerque, New Mexico
87106, United States.
cDepartment of Chemistry and Biochemistry, New Mexico State University, Las Cruces, New
Mexico 88003, United States
Electronic Supplementary Material (ESI) for NanoscaleThis journal is © The Royal Society of Chemistry 2014
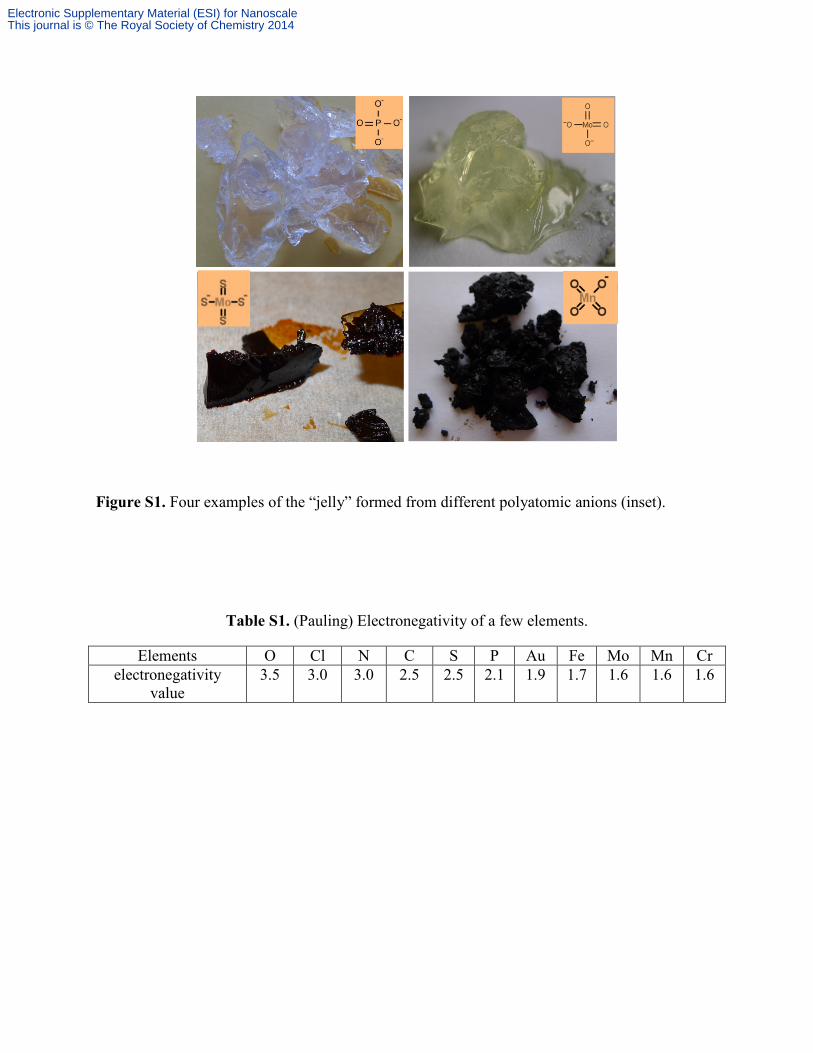
Figure S1. Four examples of the “jelly” formed from different polyatomic anions (inset).
Table S1. (Pauling) Electronegativity of a few elements.
Elements O Cl N C S P Au Fe Mo Mn Cr electronegativity
value 3.5 3.0 3.0 2.5 2.5 2.1 1.9 1.7 1.6 1.6 1.6
Electronic Supplementary Material (ESI) for NanoscaleThis journal is © The Royal Society of Chemistry 2014

0.0 0.2 0.4 0.6 0.8 1.00
50
100
150
200
250
300
0 5 10 15 200.0
0.2
0.4
0.6
0.8
1.0
dD/d
V
D (nm)
Relative pressure (P/P0)
Volu
me
(cm
3 /g)
adsorption desorption
sample B
0.0 0.2 0.4 0.6 0.8 1.00
20
40
60
80
100
120
140
0 5 10 15 200.0
0.1
0.2
0.3
0.4
dV/d
D
D (nm)
Relative pressure (P/P0)
Volu
me
(cm
3 /g)
adsorption desorption
sample C
0.0 0.2 0.4 0.6 0.8 1.00
2
4
6
8
10
12
14
Relative pressure (P/P0)
Volu
me
(cm
3 /g)
adsorption desorption
Sample D
Figure S2. N2 adsorption/desorption isotherm of samples B, C, D at 77 K.
Electronic Supplementary Material (ESI) for NanoscaleThis journal is © The Royal Society of Chemistry 2014

0.0 0.5 1.0 1.5 2.0 2.5 3.0-1.5
-1.0
-0.5
0.0
0.5
Voltage (V vs. Li+/Li)
Curre
nt (m
A)
(a)
1st 2nd 3rd 4th 5th 6th 7th 8th 9th 10th
sample A
0.0 0.5 1.0 1.5 2.0 2.5 3.0-2.0
-1.5
-1.0
-0.5
0.0
0.5
1.0
1.5(b)
Voltage (V vs. Li+/Li)
Curre
nt (m
A)
1st 2nd 3rd 4th 5th 6th 7th 8th 9th 10th
sample C
0.0 0.5 1.0 1.5 2.0 2.5 3.0
-1.0
-0.5
0.0
0.5
1.0
Voltage (V vs. Li+/Li)
Curre
nt (m
A)
(c)
1st 2nd 3rd 4th 5th 6th 7th
sample D
Figure S3. cyclic voltammetry profiles of (a) sample A; (b) sample C; (c) sample D, recorded at
the scan rate of 0.5 mV/s in the voltage window of 0.005-3 V vs. Li+/Li.
Table S2. Data summarized from the cyclic performance of the four samples
A B C D
1st cycle charge capacity (mAh g-1) 555.7 679.6 731.3 719.8
discharge capacity 1405.7 1281.6 1155.3 814.4 efficiency (%) 39.5 53 63.3 88.4
2nd cycle charge capacity 590 742.9 738.1 734.1
discharge capacity 678.6 814.3 778.9 759.4 efficiency 86.9 91.2 94.8 96.7
3rd cycle charge capacity 592.9 759.2 739.2 729.7
discharge capacity 657.1 810.2 763.4 747.3 efficiency 90.2 93.7 96.9 97.6
50th cycle charge capacity 484.3 642.9 596.4 381.3
discharge capacity 491.4 657.1 608.8 394.5 efficiency 98.5 97.8 98.0 96.7
Electronic Supplementary Material (ESI) for NanoscaleThis journal is © The Royal Society of Chemistry 2014