gelation of colloidal silica solspublications.lib.chalmers.se/records/fulltext/146783.pdf ·...
TRANSCRIPT

Gelation of colloidal silica solsMaster of Science Thesis
KATARINA RISO
Department of Chemical and Biological EngineeringDivision of Applied Surface ChemistryCHALMERS UNIVERSITY OF TECHNOLOGYGoteborg, Sweden, 2011


Gelation of colloidal silica sols
KATARINA RISO
Department of Chemical and Biological EngineeringCHALMERS UNIVERSITY OF TECHNOLOGY
Goteborg, Sweden, 2011
i

Gelation of colloidal silica solsKATARINA RISO
c© KATARINA RISO, 2011
Department of Chemical and Biological EngineeringChalmers University of TechnologySE-412 96 GoteborgSwedenTelephone +46 (0)31-772 1000
Cover: SEM image of spherical silica gel particles from pilot scale experiment
Chalmers ReproserviceGoteborg, Sweden 2011
ii
Gelation of colloidal silica solsKATARINA RISODepartment of Chemical and Biological EngineeringChalmers University of Technology
Abstract
Silica is one of the most used column packing material for normal- and reversedphase liquid chromatography (LC). Porous perfectly spherical silica gel particlesfor high performance liquid chromatography (HPLC) can be produced by a sol-gelprocess in which a colloidal silica sol is dispersed in an oil phase and subsequentlygelled.
The aim of this master thesis project was to study new methods to emulsifyand gel colloidal silica sols and to use new grades of silica sols in the sol-gel step.The new methods of emulsification were membrane emulsification and static mixingemulsification. Particle sizes of 50 µm and 2 µm respectively for the two methodswere desired. Four different sols were gelled in attempts to produce particles with ahigh specific surface area.
Particles with an average diameter of 41.4 µm were produced in a pilot scalereactor using the membrane emulsification method. The static mixing emulsificationmethod was promising but the pressure limit of the used set-up interrupted theexperimental series and the lowest average diameter achieved was 8.3 µm. A pilotscale experiment with stirring as emulsification method was performed and particleswith an average diameter of 3.8 µm was produced. No significant increase in specificsurface area was reached in the gelling experiments with different sols and moreexperiments needs to be performed before any conclusions can be drawn about this.
Keywords: Silica, Sols, Emulsification, Gelation, Chromatography
iii

iv

Contents
1 Introduction 1
2 Silica gel for HPLC 32.1 Silica sol-gel science . . . . . . . . . . . . . . . . . . . . . . . . . . . . 32.2 Production of spherical silica gel particles . . . . . . . . . . . . . . . . 5
2.2.1 Emulsification . . . . . . . . . . . . . . . . . . . . . . . . . . . 62.3 Physico-chemical properties . . . . . . . . . . . . . . . . . . . . . . . 10
2.3.1 Particle size . . . . . . . . . . . . . . . . . . . . . . . . . . . . 102.3.2 Specific surface area . . . . . . . . . . . . . . . . . . . . . . . 112.3.3 Porosity . . . . . . . . . . . . . . . . . . . . . . . . . . . . . . 12
3 Experimental method 153.1 Membrane emulsification . . . . . . . . . . . . . . . . . . . . . . . . . 16
3.1.1 Set-up . . . . . . . . . . . . . . . . . . . . . . . . . . . . . . . 163.1.2 Experimental procedure . . . . . . . . . . . . . . . . . . . . . 16
3.2 Emulsification with static mixer . . . . . . . . . . . . . . . . . . . . . 193.2.1 Set up . . . . . . . . . . . . . . . . . . . . . . . . . . . . . . . 193.2.2 Experimental procedure . . . . . . . . . . . . . . . . . . . . . 19
3.3 Stirring emulsification . . . . . . . . . . . . . . . . . . . . . . . . . . 203.3.1 Experimental procedure . . . . . . . . . . . . . . . . . . . . . 20
3.4 High surface sols . . . . . . . . . . . . . . . . . . . . . . . . . . . . . 203.4.1 Set-up . . . . . . . . . . . . . . . . . . . . . . . . . . . . . . . 203.4.2 Experimental procedure . . . . . . . . . . . . . . . . . . . . . 20
4 Results 234.1 Large silica gel particles . . . . . . . . . . . . . . . . . . . . . . . . . 234.2 Small silica gel particles . . . . . . . . . . . . . . . . . . . . . . . . . 25
4.2.1 Static mixer . . . . . . . . . . . . . . . . . . . . . . . . . . . . 254.2.2 Stirring . . . . . . . . . . . . . . . . . . . . . . . . . . . . . . 26
4.3 High surface area particles . . . . . . . . . . . . . . . . . . . . . . . . 274.3.1 Sodium stabilised sol . . . . . . . . . . . . . . . . . . . . . . . 274.3.2 Acidic sol . . . . . . . . . . . . . . . . . . . . . . . . . . . . . 27
5 Discussion 295.1 Large silica gel particles . . . . . . . . . . . . . . . . . . . . . . . . . 295.2 Small silica gel particles . . . . . . . . . . . . . . . . . . . . . . . . . 315.3 High surface area particles . . . . . . . . . . . . . . . . . . . . . . . . 31
6 Concluding remarks 33
7 Acknowledgement 35
8 References 37
Appendix A - Pumps 39
v

Appendix B - iFIX 41
Appendix C - FPIA analysis 57
vi

1 Introduction
Silica is one of the most used column packing material for normal- and reversedphase liquid chromatography (LC).
Separation Products, a sub-business unit of Eka Chemicals AB, is a leadingmanufacturer of materials for high performance liquid chromatography (HPLC).The materials are used in preparative chromatography for the purification of phar-maceuticals as well as for analytical separations in HPLC columns. The backbone ofthe materials is porous silica which is modified with different chemical functionalitiesto provide a resulting material with the desired separation properties.
The manufacturing process is highly complex and comprises many separate pro-cess steps. A sol-gel process is used to make perfectly spherical porous silica particlesby emulsification of a colloidal silica sol in an organic phase. The emulsion dropletsare gelled into solid porous particles which are then further processed in a numberof subsequent process steps. Some of the most important physical properties of theresulting products are determined by the conditions used in the sol-gel step.
For Separation Products to be able to reach new markets in the future, moreknowledge about how to control emulsification and gelation in the sol-gel step isrequired. The aim of this master thesis project was to study new methods to emulsifyand gel colloidal silica sols and to use new grades of silica sols in the sol-gel step.Properties that were going to be investigated was specific surface area, specific porevolume (particle porosity) and particle size
The objective was to investigate different methods for preparing new chromato-graphic materials which exhibit different physical properties than the existing prod-ucts. Three main tasks were decided upon. First, production of spherical silica gelparticles using a version of membrane emulsification was to be tested. The producedparticles should preferably have a fairly narrow size distribution to give as high yieldof material with a size around 50 µm as possible. The second task was to producesmall particles and investigate if a static-mixer setup could be used for this purpose.Here a high yield of particles with a diameter of 2 µm was desired. The third taskwas to gel different silica sols to investigate if a higher specific surface area of theresulting material could be obtained.
The scope of the work was to prepare porous silica materials by using a sol-gelprocess. Procedures for packing materials in columns and subsequent chromato-graphic evaluation were to be made by staff at Separation Products, and were nota part of this work.
The theory part of this report covers the basics in silica gel production and sol-gelsciences together with some theory about membrane emulsification and static mixingproperties. The measuring methods used to characterize the produces samples willalso be described properly.
The experimental work is rather empirical in its nature since no earlier researchon these methods has been performed on this particular system. The method partof the report includes the experimental setups and procedures. The experimentsfor the different tasks have not been performed in a specific order as the regents,reactors and operators needed to execute the experiments have been prioritised forthe normal production at Separation Products.
1

2
2 Silica gel for HPLC
Silica, short for silicon dioxide, is the most widely used material in normal- andreversed-phase liquid chromatography (LC). It has the general formula SiO2· xH2O,where the water is chemically bound in a non-stoichiometric amount forming silanolgroups (Si−OH), which are essential for making stationary phases for HPLC [1].The surface silanols themselves give the packing a polar character which is used innormal-phase LC. To obtain a bonded phase the silanols are used to graft organicmoieties [1]. The chromatographic properties of silica and the chemistry of silica areextensively described by Unger [2] and Iler [3].
There are several different types of silica packings in use [2]. The focus of thistheoretical part will be on completely porous, non-crystalline, spherical gel particlessimilar to the ones produced at the division Separation Products at Eka chemicalsAB under the brand name Kromasil.
2.1 Silica sol-gel science
According to Iler [3] the formation of silica gel can be regarded as taking place intwo stages. First, colloidal silica sol particles are formed through polymerisationof silicic acid, Si(OH)4, in aqueous solution. Next step is the actual gelling step;here the primary particles condense together and form a very open but continuousstructure which extends throughout the medium. Both stages of polymerisationcomprise a condensation reaction forming Si−O−Si linkages, siloxane bonds. Themain difference between the two stages is that in the first step, condensation leadsto particles of massive silica while in the second step the number of siloxane bondsbetween the sol particles is smaller due to the limited fit of the common face, resultingin a rigid and highly porous structure.
The growth of primary particles occurs by an Oswald ripening mechanism, whichmeans that particles grow in size and decrease in number as the more soluble smallparticles dissolve and reprecipitate on larger, less soluble particles [4]. It followsthat the particle growth depends on the solubility of amorphous silica, which inturn primarily depends on pH and temperature [3], see figure 1a and 1b. From pH2 to pH 8 the solubility decreases slightly, starting around 150 ppm, but increasesrapidly after pH 8. The solubility of amorphous silica increases with temperature.Since primary particle growth occurs by Oswald ripening, the growth rate is alsodependent on the particle size distribution [4].
In [3] by Iler, some indications of particle size under above mentioned differentconditions are given. The higher solubility of the smaller particles discussed aboveapplies for particles smaller than about 5 nm and is very pronounced when the sizeis less than 3 nm. Above pH 7, where the rate of dissolution and deposition of silicais high, particle growth continues at ordinary temperature until the particles are5-10 nm in diameter. At low pH, where the rate of polymerisation and depolymeri-sation is slower, particle growth becomes negligible after a size of 2-4 nm. Highertemperatures lead to larger particle sizes, especially above pH 7.
In gel formation, the basic mechanisms are the collision of two silica particlesand the formation of siloxane bonds to hold the particles together irreversibly. The
3

Figure 1: (a) Solubility of amorphous silica versus pH [3], (b) Solubility ofamorphous silica versus pH at different temperatures [3]
siloxane bond formation is both acid and base catalysed depending on the charge ofthe particle [3]. For the collisions to occur, the particles need to have a sufficientlylow surface charge due to electrostatic repulsion. Both reaction and collision ratesare hence strongly affected by pH. The gelling is also affected by salt concentration,silica concentration and temperature. The temperature dependence is simple and isdue to the kinetic phenomenon involved in aggregation, therefore the rate of gellingincreases with temperature. Figure 2 shows an overview of the more complex effectsof pH and salt concentration.
Since the condensation reaction for siloxane bond formation involves an ionicmechanism the reaction mechanism will be different depending on how the pH ofthe sol relates to the point of zero charge (PZC) and the isoelectric point (IEP) ofsilica. The PZC and IEP are both found around pH 2 and this region will hence bemeta stable [3].
Above pH 2 the reaction is catalysed by hydroxyl ions and the reaction rate isproportional to the concentration of hydroxyl ions [3], as in eq 1 and eq 2.
≡ Si−OH + OH− −→ ≡ Si−O− + H2O (1)
≡ Si−O− + HO−Si− −→ ≡ Si−O−Si + OH− (2)
Below pH 2, the reaction rate is instead proportional to the H+ concentration.Several different mechanisms for this reaction have been proposed [3, 4].
Above pH 6, the scarcity of hydroxyl ions is no longer the limiting factor for therate of gelling. Instead, the rate of aggregation decreases because of fewer collisions
4
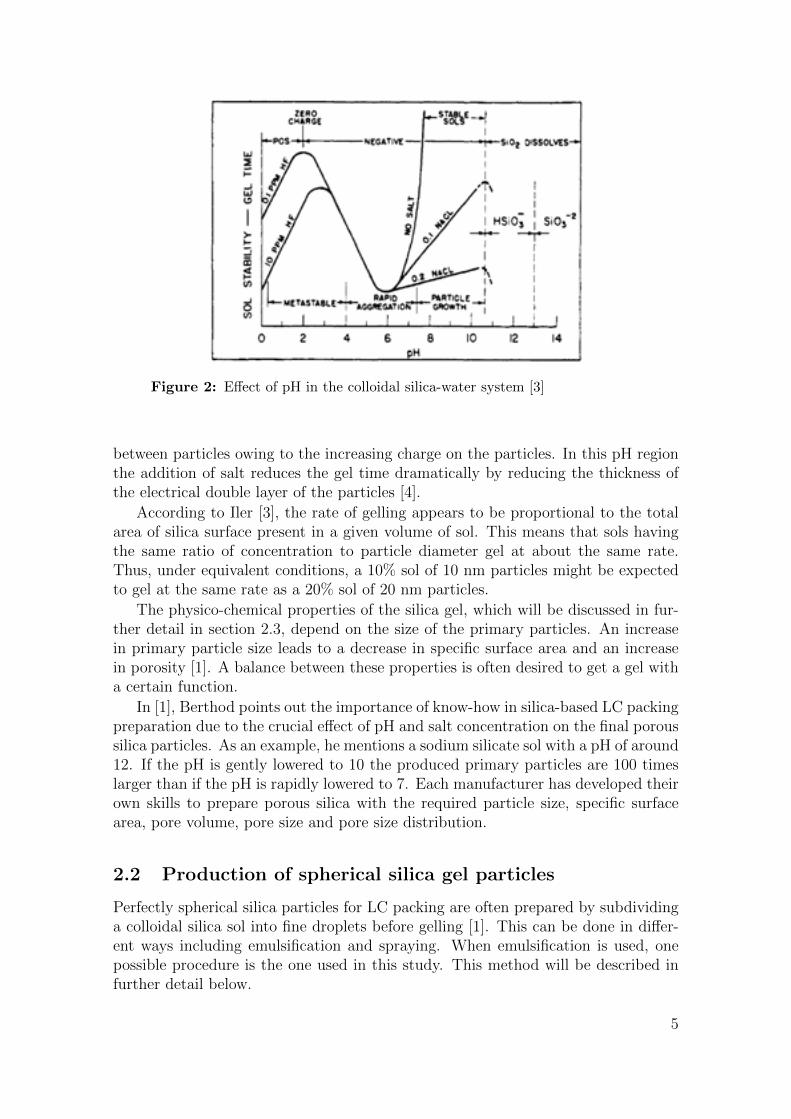
Figure 2: Effect of pH in the colloidal silica-water system [3]
between particles owing to the increasing charge on the particles. In this pH regionthe addition of salt reduces the gel time dramatically by reducing the thickness ofthe electrical double layer of the particles [4].
According to Iler [3], the rate of gelling appears to be proportional to the totalarea of silica surface present in a given volume of sol. This means that sols havingthe same ratio of concentration to particle diameter gel at about the same rate.Thus, under equivalent conditions, a 10% sol of 10 nm particles might be expectedto gel at the same rate as a 20% sol of 20 nm particles.
The physico-chemical properties of the silica gel, which will be discussed in fur-ther detail in section 2.3, depend on the size of the primary particles. An increasein primary particle size leads to a decrease in specific surface area and an increasein porosity [1]. A balance between these properties is often desired to get a gel witha certain function.
In [1], Berthod points out the importance of know-how in silica-based LC packingpreparation due to the crucial effect of pH and salt concentration on the final poroussilica particles. As an example, he mentions a sodium silicate sol with a pH of around12. If the pH is gently lowered to 10 the produced primary particles are 100 timeslarger than if the pH is rapidly lowered to 7. Each manufacturer has developed theirown skills to prepare porous silica with the required particle size, specific surfacearea, pore volume, pore size and pore size distribution.
2.2 Production of spherical silica gel particles
Perfectly spherical silica particles for LC packing are often prepared by subdividinga colloidal silica sol into fine droplets before gelling [1]. This can be done in differ-ent ways including emulsification and spraying. When emulsification is used, onepossible procedure is the one used in this study. This method will be described infurther detail below.
5
The starting material is a colloidal silica sol with a known specific surface area,controlled by heat treatment. The sol is dispersed in an organic medium, immisciblewith water, in the presence of a surface active agent to form an emulsion. The size ofthe formed droplets determines the size of the gel particles formed. A gelling processof the formed sol droplets takes place when water is evaporated under controlledtemperature or when a salt is added to the emulsion. The particles are separatedfrom the continuous phase and washed with an alcohol. To remove all organicmaterial and make the gel particles stronger a heat treatment step called calcinationis necessary. Due to the high temperature during the calcination many of the surfacesilanols form siloxane bridges which makes the surface of the gel particles morehydrophobic. A rehydroxylation step brings the silanol groups back.
2.2.1 Emulsification
Emulsions are dispersed systems of two immiscible liquids. The two phases are re-ferred to as the dispersed phase (droplets) and the continuous phase. Almost allemulsions consist of a water phase and an organic phase. The emulsion is named de-pending on which phase that is the dispersed and the continuous, oil-in-water (o/w)or water-in-oil (w/o) emulsions. The system with colloidal silica sol as dispersedphase is consequently a water-in-oil emulsion.
Emulsification is the process of droplet formation. In [5], Peters describes dropletformation and the processes causing it. Droplets are formed by stress being impartedto a large primary drop. The stress causes elongation of the drop followed by de-velopment of surface waves. When the waves have grown to the point of instabilitythe primary drop breaks into droplets and usually also smaller satellite droplets.In order to produce drops of the dispersed phase, the surface separating the twobulk phases must be disrupted. This can be achieved via turbulent eddies, surfaceripples, Rayleigh-Taylor instabilities and Kelvin-Helmholtz instabilities. The twolatter are caused by differences in density and velocity between the bulk phase andthe dispersed phase. The process that is most easily modified in an existing systemis the turbulent eddies by changing the mixing conditions. According to Groeneweg[6] there are two distinguished mechanisms for droplet break-up in turbulent flow:viscosity dominated break-up and inertia dominated break-up. Which one of thesethat is most relevant in a certain situation depends on the relation between the sizeof the largest drop and the length and the so called Kolmogorv eddies. Turbulentflow form large eddies which in turn creates smaller eddies with increased rotation,due to the conservation of angular momentum. The smallest eddies produced arecalled Kolmogorv eddies. If the maximum droplet diameter is small in comparisonwith the length scale of the Kolmogorv eddy the droplet break-up will occur byviscous forces. The viscous forces try to deform the droplets but are opposed byinterfacial forces that try to maintain a spherical shape of the droplet. The ratio ofthese viscous forces and interfacial forces gives a dimensionless number; this numberis by Peters [5] called the drop Weber number and by Groeneweg [6] the capillarynumber, Ω. The interfacial forces are of the order σ/R, where σ is the interfacialtension and R is the droplet radius. The viscous forces of the order γηc where γ isthe shear rate (s−1) and ηc is the dynamic viscosity of the continuous phase. The
6

equation for the capillary number is shown in eq 3.
Ω = γηcR/σ (3)
If the capillary number Ω is larger than a critical value, drop break-up will occur.The critical value depends on the viscosity ratio of the dispersed and continuousphase and on the type of flow.
In inertia dominated break-up, which occurs when the drops are larger comparedto the length scale of the Kolmogorov eddies, the droplets are broken up by pressurefluctuations. This force is of the order of ρU2, where U equals the velocity fluctuationcaused by the eddy. Also in this case the internal forces will try to maintain aspherical shape of the droplet. The ratio between this two forces is the ordinaryWeber number, eq 4.
We = ρU2R/σ (4)
In analogy with the capillary number also for this Weber number the droplets willbreak-up when exceeding a critical value. It can be seen in eq 3 and eq 4 that boththe dimensionless numbers are proportional to the droplet radius; this means thatsmaller droplets will not break-up as easy as larger droplets.
The stability of an emulsion refers to its ability to resist change in its propertiesover time. Break-down of emulsion can occur by various mechanisms [7]. As aresult of the difference in density between the phases the droplets will either end upin the top or the bottom of the container, this is called creaming or sedimentationrespectively. The droplets can also enter an energetically stable situation wherethe droplets are close to each other but still retain their integrity, this is calledflocculation. These three mechanisms are reversible phenomena and the originalstate can often be regained. There are also more severe phenomena which areirreversible. These are coalescence where droplets merge into each other and Ostwaldripening where small drops lose material and finally disappear while larger dropsgrow in size. The later process is caused by diffusion of molecules of the dispersedphase through the continuous medium. To extend the lifetime of the emulsion, anemulsifying agent that stabilizes the emulsion can be added. An emulsifier stabilizesthe emulsion by lowering the interfacial tension between the dispersed phase andthe continuous phase.
There are several different methods for creating an emulsion. The three methodsthat are relevant for this project will be discussed in further detail below.
Stirring
Vessels with an agitator are the most commonly used type of equipment for blendingliquids. Stirring of immiscible liquids is used to produce emulsions where the sizeof the dispersed drops will be determined by the balance between breakup andcoalescence [6]. To change the balance to the favour of the breakup an emulsifiercan be used.
The most typical arrangement of a baffled vessel with agitator, and the flowpattern generated, is shown in figure 3 from [8]. The mixing in the vessels can beeither axial or radial depending on the type of impeller used. An impeller with tiltedblades produces an axial flow while an impeller with flat blades produces mainly
7

radial flow. To prevent formation of a vortex, four vertical baffles are normallyinstalled. These generate top-to-bottom mixing and improve effective mixing [9].
Figure 3: Typical arrangement of a baffled vessel with agitator. in (a) animpeller with tilted blades producing an axial flow and in (b) an impeller withflat blades producing a mainly radial flow [8].
In a stirred vessel there will be different types of flow; turbulent flow, witha chaotic nature, near the impeller and laminar flow at some distance from theimpeller. A transition region with a flow somewhere between turbulent and laminarwill also occur. Generally the type of flow occurring in a certain situation canbe derived from the Reynolds number. For a stirred vessel the impeller Reynoldsnumber can be used, eq 5, [9]. The length and velocity scales are based on theimpeller diameter and tip speed.
Reimp = ND2impρ/η (5)
N is the rotational speed of the impeller (rev/s), Dimp is the diameter of the impellerand ρ and η are the density and viscosity for the liquid respectively. Different typesand sizes of reactors require different impeller Reynolds numbers for turbulent flow.For example, the flow is turbulent in the whole vessel when the impeller Reynoldsnumber exceeds 10 000 for a baffled vessel, the diameter of which equals the heightof the emulsion volume and with an impeller diameter equal to one-half or one-thirdof the diameter of the vessel. The flow will be transitional for Reynolds numbersbetween 10 and 10 000, while the flow will be laminar for Reynolds numbers belowabout 10 [6]. Strong turbulent eddies leads to a larger Weber number and hencesmaller droplets.
Static mixer
A static mixer, also known as motionless mixer, is standard equipment in the processindustries for mixing fluids. It can be used for mixing two immiscible liquids andproduce an emulsion. The prototypical design of a static mixer is a series of identical
8

Figure 4: A schematic figure of a static mixer set-up [10].
motionless mixing elements installed in a pipe, see figure 3. The elements redistributethe fluid in the direction transverse to the main flow [10].
Similar to the emulsification process in a stirred vessel it is the shear stress in theturbulent flow that causes droplet break-up. As can be seen in eq 6, which showsthe Reynolds number in pipes, a higher fluid velocity (V) through the mixer willgive a higher Reynolds number. This in turn will give a higher Weber number, dueto increased turbulence, which will result in smaller droplets [11].
Re =ρV DH
µ(6)
The advantages with a static mixer is its application for continuous emulsificationprocess and the possibility to get a more even drop size distribution [11].
Membrane emulsification
Membrane emulsification is an emulsification technique where the dispersed phase ispressed through the pores of a membrane into the continuous phase. The continuousphase flows along the membrane surface at which the droplets grow in the pore open-ings until they have reached a certain size and detach. Surfactant molecules in thecontinuous phase stabilize the newly formed liquid-liquid interface to prevent dropletcoalescence immediately after formation [12]. Contrary to the stirring and staticmixer techniques, this technique is not dependent on turbulent mixing. Instead, thechoice of membrane controls the droplet size. A narrower droplet-size distributioncan be expected using this technique [13]. According to Joclyn and Tragardh [13]who have published a couple of investigations about membrane emulsification, thetypical membrane pore sizes range from about 0.05-14 µm. Commonly used mem-branes are tubular micro-porous glass (MPG) membranes and Shirasu porous glass(SPG) membranes. These membranes have cylindrical, interconnected, uniform mi-cropores. They also state that it has been observed that the droplet size (dd) of anemulsion have a linear correlation to the pore size (dp) of the membrane, eq 7 witha constant x that typically ranges from 2-10.
dd = xdp (7)
9

A typical experimental setup for membrane emulsification is described in severalarticles [12, 13, 14, 15]. The set-up incorporates a tubular membrane, a pump, afeed vessel and a pressurized container for the dispersed phase. Figure 5 from [13]shows a schematic picture of the setup. In this system the dispersed phase is pumpedunder gas pressure through the pores of the membrane into the continuous phasewhich circulates through the membrane module.
Figure 5: A schematic figure of a typical experimental setup for membraneemulsification [13]
.
2.3 Physico-chemical properties
2.3.1 Particle size
Silica gel particles have a size ranging from 1 to 100 µm and are always producedwith a particle size distribution. The average particle diameter is usually specifiedwith either a mean or a median value. The mean particle diameter can be definedas the mean diameter in number, dn and the mean diameter in surface, ds, or themean diameter in volume (or mass), dv, as in equation 8, 9 and 10.
dn =∑
nidi/∑
ni (8)
ds =∑
nid3i /
∑nid
2i (9)
dv =∑
nid4i /
∑nid
3i (10)
Where ni is the number of particles with diameter di [1].The median divides the distribution into two equal parts, it is the 50% size on
the cumulative distribution curve, and are usually denoted dv50. On the cumulative
10

distribution curve, the diameter at 10% and 90% are also of interest, they are usedto calculate a dv90/10 value that gives an indication of the distribution of the particlesize.
Particle size determination
There are several techniques available to determine the particle size of a sample.Microscopy is the simplest method but it is only useful for rough estimations. In thisproject, two other methods for particle size analysis have been used; flow particleimage analysis (FPIA) and electrical sensing zone (ESZ) also named the Cultermethod.
Image analysis with microscope is a time consuming method, FPIA is an auto-mated image analysis technique that can count up to several hundred thousands ofparticles in a short space of time. A sample from a dilute suspension of particles ispassed through a measurement cell where images of the particles are captured. Theinstrument used in this project is a FPIA 3000 from Sysmex/Malvern. The FPIA3000 uses a CCD-camera that captures the particles as they pass through the cell.The instrument captures images in real time and analyzes them in terms of theirmorphological parameters to produce corresponding size and shape distributions.
The ESZ technique is described by Xu in [16]. In ESZ, the particles are dispersedin an electrolyte and forced through a small aperture. The aperture is placed be-tween two electrodes with a constant electric current over. When a particle passesthrough the aperture, it displaces its own volume of conducting liquid, momentarilyincreasing the impedance of the aperture giving rise to a voltage pulse. The ampli-tude of the pulse is proportional to the particle volume and the number of pulses isthe number of particles measured. For each instrument a calibration constant, Kd,is used to translate the voltage readings to particle diameter. The particle diametersof porous particles will be under-estimated due to inclusion of an electrolyte whichlowers the impedance. The change in the impedance of the aperture will hencebe smaller compared to a solid particle with an equivalent particle diameter. Tocompensate for the porosity of the silica particles, mass calibration should be used.
2.3.2 Specific surface area
The specific surface area of a porous solid is equal to the sum of its internal andexternal surface areas and are given in m2/g [2]. The specific surface area of silicagels used in high-performance liquid chromatography ranges from 10 to about 500m2/g [1]. Surface area is routinely measured using the BET method described below.
In the BET-method, data from a gas adsorption isotherm are put into the BET-equation, which is used to calculate the specific surface area. The BET-equation isnamed after the inventors Brunauer, Emmett and Teller. Gas adsorption isothermsare determined at different relative pressures at a temperature at which the gas isin the liquid state (77 K for nitrogen). Within the isotherm equations there existparameters which are associated with surface area. To extract these parameters aleast-squares routine is used to determine the surface area. The fit for the BETisotherm is valid only over a certain linear range of the curve.
11
The original form for the BET equation, eq 11
V
Vmon
=Cx
(1− x)(1 + (C − 1)x)where x =
P
Ps
(11)
where V indicates the volume of gas adsorbed at STP (standard temperature andpressure), Vmon is the volume of gas required for a monolayer, Ps is the vapourpressure of the bulk liquid at the same temperature, P is the adsorptive pressureand C is a constant.
For analysis, the equation rearranges into the transformed form, eq 12 to givea linear relationship. For the analysis made in this project the linear range used isbetween 0-0.25 P/Ps
x
V (1− x)=
1
CVmon
+C − 1
CVmon
x (12)
Using the the slope SBET and the intersect IBET, the monolayer volume Vmon can bedetermined.
Vmon =1
SBET + IBET
(13)
From Vmon one can obtain
C =1
VmonIBET
(14)
For BET, Vmon can be related to the number of gas atoms in a monolayer, eq 15.
nm =Vmon
22400(15)
In the case of N2 adsorption IUPAC has set a conversion factor to convert Vmon intoa surface area number, the IUPAC convention settled on 16.2 A2 (0.162 nm2) pernitrogen molecule as a standard [17], denoted a in forthcoming eq 16.
As =nma
mNA (16)
Where m is the samlpe mass in grams.
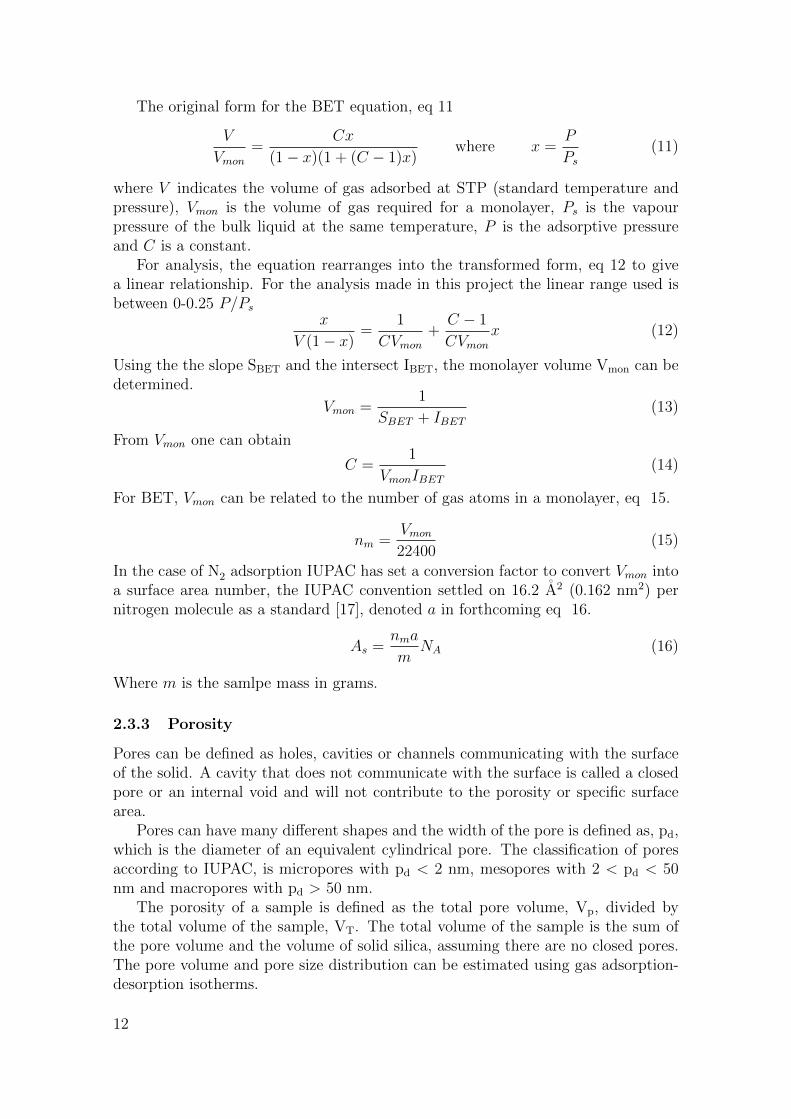
2.3.3 Porosity
Pores can be defined as holes, cavities or channels communicating with the surfaceof the solid. A cavity that does not communicate with the surface is called a closedpore or an internal void and will not contribute to the porosity or specific surfacearea.
Pores can have many different shapes and the width of the pore is defined as, pd,which is the diameter of an equivalent cylindrical pore. The classification of poresaccording to IUPAC, is micropores with pd < 2 nm, mesopores with 2 < pd < 50nm and macropores with pd > 50 nm.
The porosity of a sample is defined as the total pore volume, Vp, divided bythe total volume of the sample, VT. The total volume of the sample is the sum ofthe pore volume and the volume of solid silica, assuming there are no closed pores.The pore volume and pore size distribution can be estimated using gas adsorption-desorption isotherms.
12

According to Sing [17] the adsorption isotherms of gas onto solids can be arrangedin six different types, figure 6. Type I, IV and V isotherms show hysteresis, i.e., thedesorption branch of the curve does not coincide with the adsorption branch. Thehysteresis is used for determination of pore size distribution and pore geometry.The three isotherm types correspond to microporous, mesoporous and polydisperseporosity respectively. The BET isotherm is a type IV isotherm and can hence beused for determination of pore volume of mesoporous silica particles. Nitrogen,at the nitrogen boiling point (77 K), is the most commonly used gas for sorptionstudies. The gas sorption method produces accurate results in the pore size rangebetween 0.5 and 50 nm [1].
Figure 6: Six different types of gas adsorption isotherms [17]
.
Further information about pore volume determination is considered to be outsideof the scope of this report.
13

14
3 Experimental method
This chapter summarizes the materials and the methods used. Experimental set-ups,theory behind the experiments and the procedures in short are described.
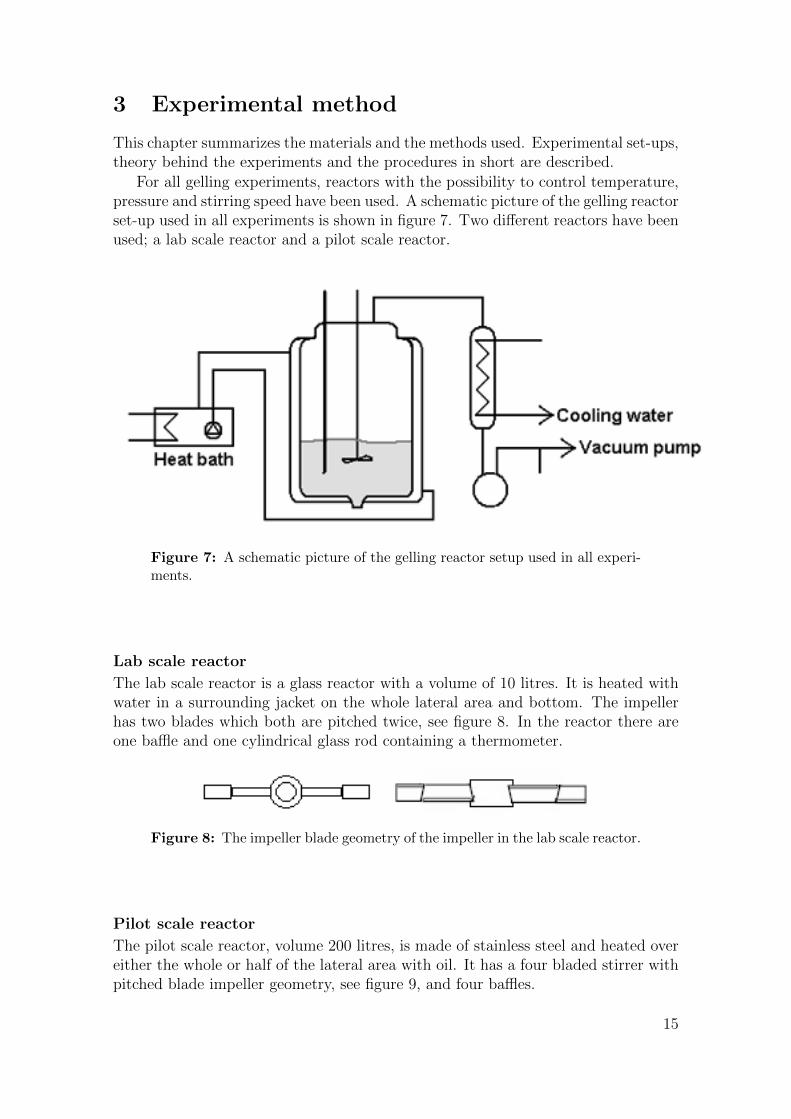
For all gelling experiments, reactors with the possibility to control temperature,pressure and stirring speed have been used. A schematic picture of the gelling reactorset-up used in all experiments is shown in figure 7. Two different reactors have beenused; a lab scale reactor and a pilot scale reactor.
Figure 7: A schematic picture of the gelling reactor setup used in all experi-ments.
Lab scale reactor
The lab scale reactor is a glass reactor with a volume of 10 litres. It is heated withwater in a surrounding jacket on the whole lateral area and bottom. The impellerhas two blades which both are pitched twice, see figure 8. In the reactor there areone baffle and one cylindrical glass rod containing a thermometer.
Figure 8: The impeller blade geometry of the impeller in the lab scale reactor.
Pilot scale reactor
The pilot scale reactor, volume 200 litres, is made of stainless steel and heated overeither the whole or half of the lateral area with oil. It has a four bladed stirrer withpitched blade impeller geometry, see figure 9, and four baffles.
15

Figure 9: The impeller blade geometry of the impeller in the pilot scalereactor.
For all gelling processes, the temperatures and pressures were monitored in iFIX,charts are available in appendix B.
All experiments were performed in a similar way. The procedure can be dividedin five main parts; emulsification, gelling, washing, calcination and rehydroxylation.For the gelling step, two different approaches have been used. In the experimentswhere the size is of interest, a salt has been added to start the gelling process athigh temperature, while in the experiments where the surface area is of interest, thegelling has been done by evaporation of water at a lower temperature and reducedpressure. The filtration and washing steps were performed in filter funnels with anintegrated sintered glass filter disc of porosity four if nothing else is specified.
3.1 Membrane emulsification
These experiments aim to investigate if a plastic wire mesh can be used as a simplemembrane to control the particle size and get a narrow particle size distribution.
Experiments with three different mesh sizes and a reference experiment withoutwire were performed in the lab scale reactor. One scale up experiment was performedin the pilot scale reactor.
3.1.1 Set-up
The set-up consisted of a plastic pipe with a wire covering the bottom opening, seefigure 10 a, through which the silica sol was added to the continuous phase. Thewire was a plastic mesh normally used in paper making. The meshes had a quadraticgeometry as can be seen in the photography of the 125 µm in figure 10 b.
A sketch of the principal theory of the emulsification in these experiments isshown in figure 11.
3.1.2 Experimental procedure
To make an emulsion, silica sol was added to the continuous phase, containing anemulsifying agent, through the plastic pipe with different wires. The meshed pipeopening was held approximately at the same height as the impeller blade and in
16

Figure 10: In (a) a plastic pipe with wire used for the membrane emulsifica-tion experiments and in (b) a photography of the 125 µm wire mesh.
the middle between the tip of the impeller blade and the reactor wall during theaddition of the sol. The continuous phase was under stirring during the adding ofthe sol, for which the flow rate was about 625 g per minute. To initiate the gellingprocess of the silica, the emulsion was heated to 80 and a salt was added. Theemulsion was kept at 80 during one hour, after which water was evaporated bystepwise reduction of the pressure in the reactor while keeping the temperature ofthe heat bath constant at 80 . The formed gel particles were filtered and washedwith ethanol before they were dried in an oven at 90 . The dry gel was calcinatedin an oven at 630 for five hours. Finally, a rehydroxylation step was performedwhere the gel was heated in ammonia for two hours, acidified by addition of nitricacid, filtered and washed with water and acetone.
In the first experiment, ME 1, a wire with mesh size 71 µm was used. The stirringspeed was 400 rpm during the emulsification and 300 rpm during the first part of thegelling. After a few hours a white gel layer was visible at the bottom of the reactor.In an attempt to resuspend the gel layer, the stirring speed was increased to 500rpm. This had little effect on the gel layer in the bottom and in a second attempt toresuspend the layer the vacuum in the rector was released and the layer was scrapedoff with a plastic rod. The experiment then proceeded as described above.
During the second experiment, ME 2, wire mesh size 125 µm, the stirrer waslowered a few centimeters to investigate if the gel layer in the bottom of the reactorcould be avoided. The stirring speed was 400 rpm during the emulsification andgelling. This had very little effect on the layer in the bottom and the layer wasagain resuspended by scraping with a plastic rod.
The stirring speed seemed to have little or no effect on the formation of a layer inthe bottom of the reactor and all experiments after were performed with a stirringspeed of 300 rpm during the emulsification and gelling.
In the third experiment, ME 3, wire mesh size 71 µm, the gel layer in the bottomof the reactor was left in the reactor and discarded.
After these attempts to avoid the formation of a gel layer in the bottom of thereactor a series of experiments, ME 4-ME 7, with three different mesh sizes and areference experiment without wire was then performed. 300 rpm stirring was usedthrough the whole series and mesh sizes used were 20 µm, 71 µm and 125 µm. The
17

Figure 11: The dispersed phase is pressed through the membrane into thecontinuous phase.
gel layer in the bottom was resuspended after the emptying of the reactor and pooledwith the rest of the gel during the washing rehydroxylation step.
One scale-up experiment, ME 8, was performed in the pilot scale reactor. Thestirring speed was 60 rpm which corresponds to 300 rpm in the lab scale reactor. Nogel layer was formed in the bottom of the reactor. The gel was filtered and washedin a centrifuge. The calcination was performed in the same way as the lab scaleexperiments but the rehydroxylation was performed in a 25 litres glass reactor. Thewashing part of the rehydroxylation was performed in nine consecutive filtrationruns during two days in a filter funnel. The unwashed gel was stored in the acidicsolution from the rehydroxylation.
An overview of the experiments is shown in table 1.
Table 1: The membrane emulsification experiments.
Experiment Mesh size (µm) Stirring speed (rpm)
ME 1 71 400/300/500ME 2 125 400ME 3 71 300ME 4 20 300ME 5 71 300ME 6 125 300ME 7 none 300ME 8 - pilot scale 125 60
18

3.2 Emulsification with static mixer
The aim of these experiments was to produce small particles around 2 µm with anarrow particle size distribution.
3.2.1 Set up
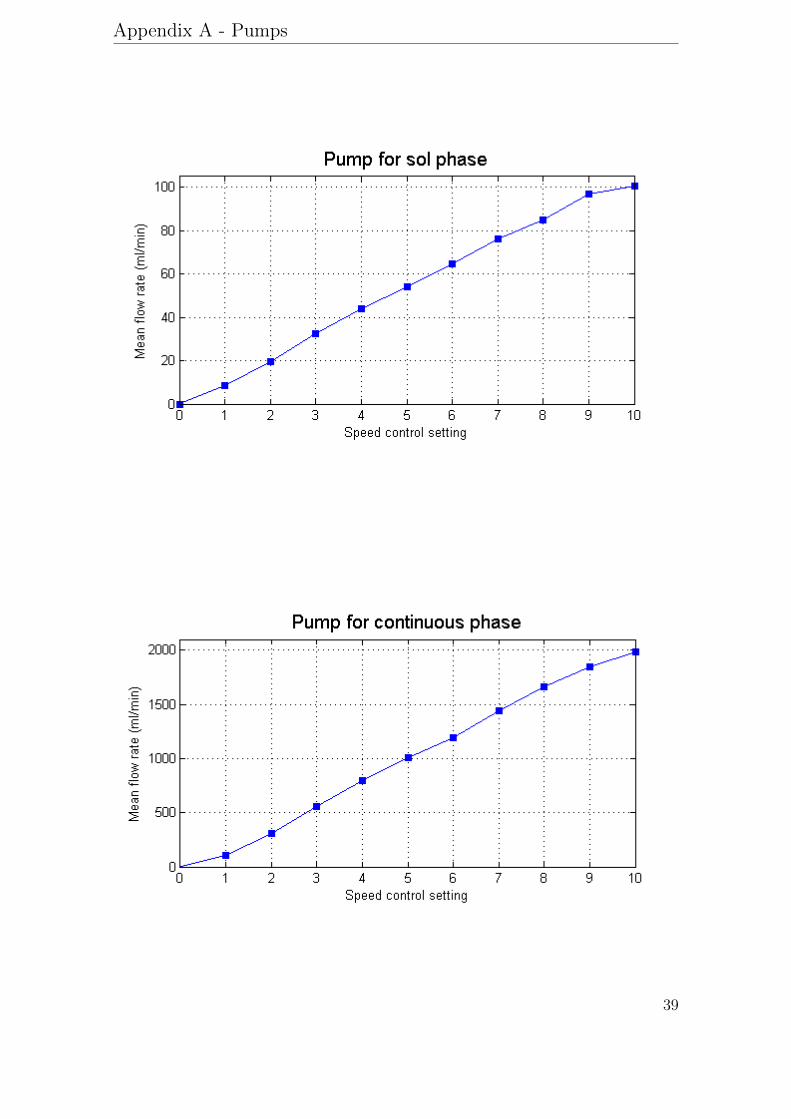
The static mixer setup consisted of two peristaltic pumps with analog speed con-trollers and a plastic pipe containing static mixer elements. For the continuousphase, a Masterflex model 7554-20, 6-600 rpm with easy-load pump head model7518-00 and a Masterflex Tygon Lab tubing model 6409-17 were used. For thesol phase, Masterflex model 7553-85, 1-100 rpm with quick-load pump head model7021-20 and a Masterflex Norprene tubing model 6404-16 were used. Calibrationcurves for the pumps are available in appendix A. A reducer with a diameter of 1.5or 2 mm was placed downstream 10 mixing elements inside a plastic pipe. For aschematic picture of the set-up see figure 12.
Figure 12: A schematic picture of the static mixer emulsification set-up.
Three different reducers with an inner diameter of 3 mm, 2 mm and 1.5 mm wereproduced. Only the two smallest were used in the gelling experiments.
3.2.2 Experimental procedure
An emulsion with silica sol as the dispersed phase was produced with a static mixer.Three experiments were performed, SM 1 - SM 3, with different flows and differentreducers, see table 2. The emulsion was collected and transferred to the lab scalegelling reactor. The gelling procedure in the reactor followed the same procedureas for the membrane emulsification; the emulsion was heated to 80 , addition of asalt and evaporation of water by stepwise lowering of the pressure during which thestirring speed was 400 rpm. The gel was washed with ethanol, calcined at 630 and rehydroxylated with ammonia in the same way as described for the membraneemulsifications experiments.
The ratio by weight of sol to continuous phase with emulsifying agent was ap-proximately 6.8. The flow rates of the pumps were hard to control due to the analogspeed controllers. For all three experiments the flow rate is a rough approximation.
19
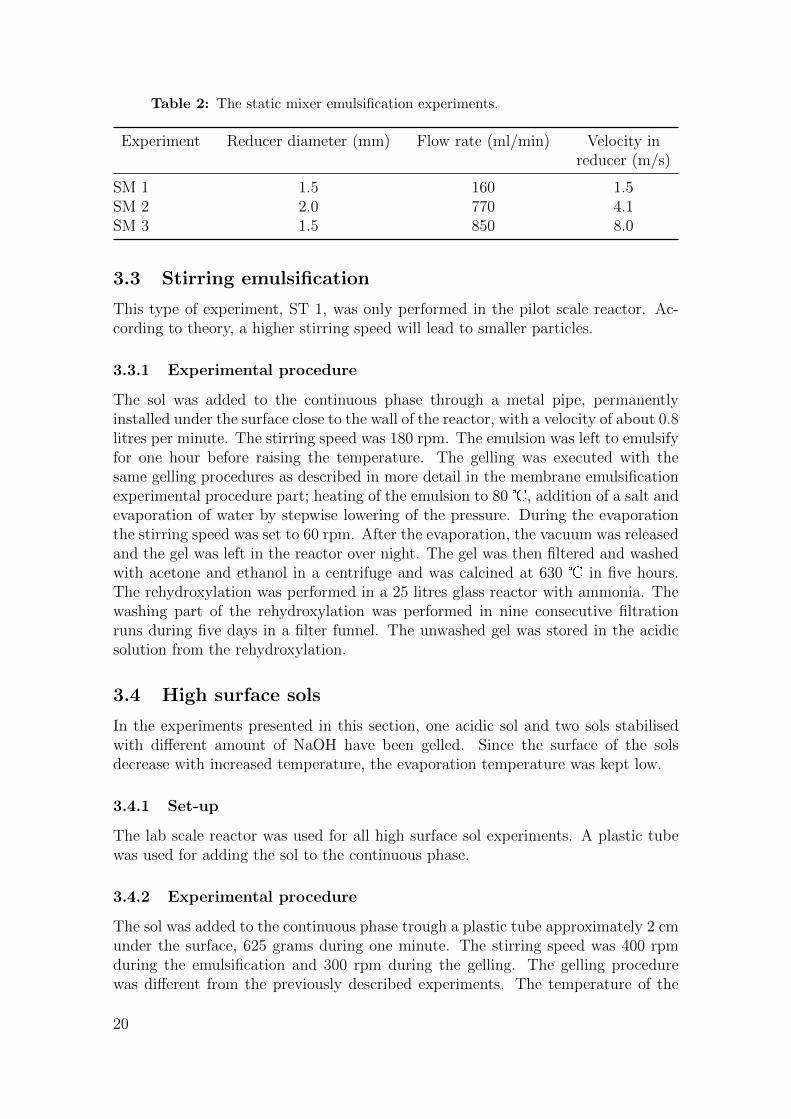
Table 2: The static mixer emulsification experiments.
Experiment Reducer diameter (mm) Flow rate (ml/min) Velocity inreducer (m/s)
SM 1 1.5 160 1.5SM 2 2.0 770 4.1SM 3 1.5 850 8.0
3.3 Stirring emulsification
This type of experiment, ST 1, was only performed in the pilot scale reactor. Ac-cording to theory, a higher stirring speed will lead to smaller particles.
3.3.1 Experimental procedure
The sol was added to the continuous phase through a metal pipe, permanentlyinstalled under the surface close to the wall of the reactor, with a velocity of about 0.8litres per minute. The stirring speed was 180 rpm. The emulsion was left to emulsifyfor one hour before raising the temperature. The gelling was executed with thesame gelling procedures as described in more detail in the membrane emulsificationexperimental procedure part; heating of the emulsion to 80 , addition of a salt andevaporation of water by stepwise lowering of the pressure. During the evaporationthe stirring speed was set to 60 rpm. After the evaporation, the vacuum was releasedand the gel was left in the reactor over night. The gel was then filtered and washedwith acetone and ethanol in a centrifuge and was calcined at 630 in five hours.The rehydroxylation was performed in a 25 litres glass reactor with ammonia. Thewashing part of the rehydroxylation was performed in nine consecutive filtrationruns during five days in a filter funnel. The unwashed gel was stored in the acidicsolution from the rehydroxylation.
3.4 High surface sols
In the experiments presented in this section, one acidic sol and two sols stabilisedwith different amount of NaOH have been gelled. Since the surface of the solsdecrease with increased temperature, the evaporation temperature was kept low.
3.4.1 Set-up
The lab scale reactor was used for all high surface sol experiments. A plastic tubewas used for adding the sol to the continuous phase.
3.4.2 Experimental procedure
The sol was added to the continuous phase trough a plastic tube approximately 2 cmunder the surface, 625 grams during one minute. The stirring speed was 400 rpmduring the emulsification and 300 rpm during the gelling. The gelling procedurewas different from the previously described experiments. The temperature of the
20

water bath was set to 80 and the pressure in the reactor was set to 90 mbar.Evaporation of water started when the reactor temperature was around 50 andcontinued until it had reached 80 . The gel was filtered, washed with ethanol anddried at 90 . Before the calcination, the gel was refluxed in acid, 1.5% HNO3 (aq),for several hours. The gel was calcinated and the surface area and porosity weremeasured.
The three first experiments, HS 1 - HS 3, were performed with a water glasscontaining 5% SiO2 as starting material. The water glass was stabilised with NaOHto SiO2:Na2O molar ratios of 20:1 and 10:1. The sol with molar ratio 20 was usedfor one experiment and the sol with ratio 10 was used for two experiments, one withthe initial SiO2 concentration and one that was concentrated by ultra filtration.
The gelling experiments were performed in the following order: first the sol withmolar ratio 20, then molar ratio 10 with the initial SiO2 concentration and lastmolar ratio 10 concentrated. The sols were stored at 4 until the gelling and oneexperiment was performed every day.
A water glass containing 4.8% SiO2 and a SiO2:Na2O molar ratio of 3.3:1 wasproduced by heating a fumed SiO2 powder in NaOH (aq) for three hours. Thewater glass was then ion exchanged to exchange sodium ions for hydrogen ions. Theformed sol, HS 4, was emulsified, gelled, acid boiled and calcinated under the sameconditions as the Na-stabilised sols.
21

22
4 Results
The results will be presented in three subsections according to their purpose. AllFPIA 3000 analysis reports are available in appendix C.
4.1 Large silica gel particles
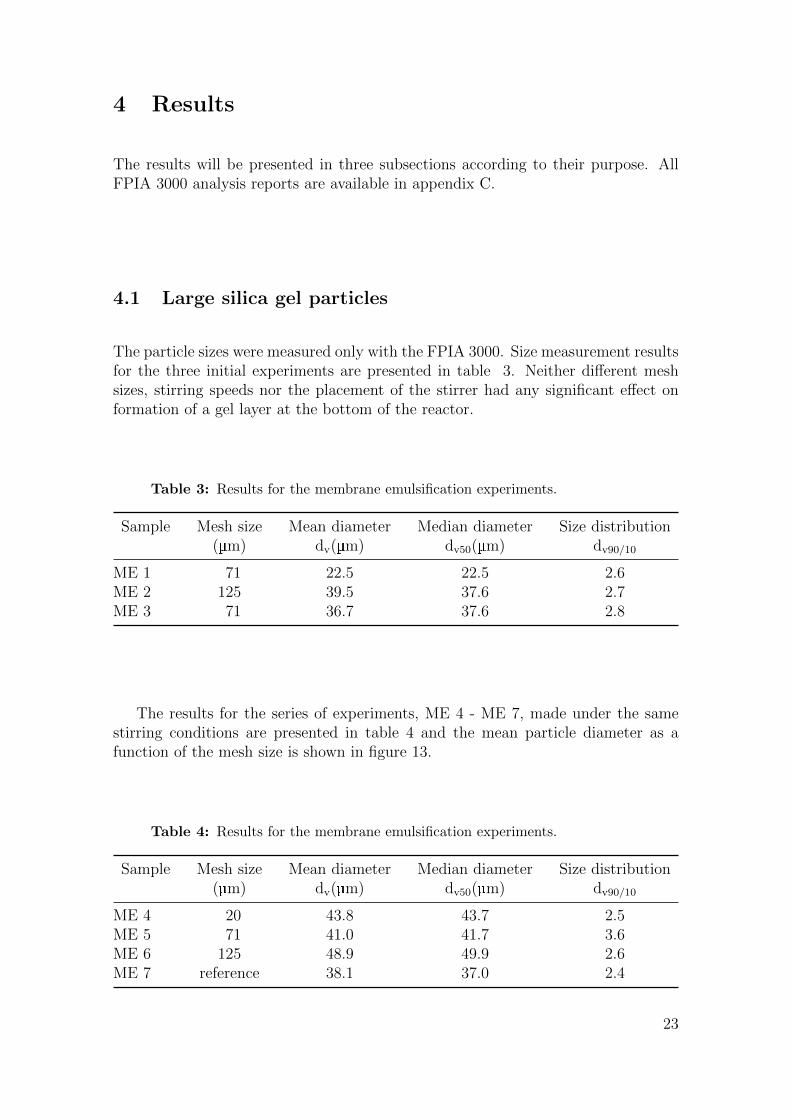
The particle sizes were measured only with the FPIA 3000. Size measurement resultsfor the three initial experiments are presented in table 3. Neither different meshsizes, stirring speeds nor the placement of the stirrer had any significant effect onformation of a gel layer at the bottom of the reactor.
Table 3: Results for the membrane emulsification experiments.
Sample Mesh size Mean diameter Median diameter Size distribution(µm) dv(µm) dv50(µm) dv90/10
ME 1 71 22.5 22.5 2.6ME 2 125 39.5 37.6 2.7ME 3 71 36.7 37.6 2.8
The results for the series of experiments, ME 4 - ME 7, made under the samestirring conditions are presented in table 4 and the mean particle diameter as afunction of the mesh size is shown in figure 13.
Table 4: Results for the membrane emulsification experiments.
Sample Mesh size Mean diameter Median diameter Size distribution(µm) dv(µm) dv50(µm) dv90/10
ME 4 20 43.8 43.7 2.5ME 5 71 41.0 41.7 3.6ME 6 125 48.9 49.9 2.6ME 7 reference 38.1 37.0 2.4
23

Figure 13: Results for the membrane emulsification experiments.
Pictures of all samples made were taken in a light microscope. Pictures of thesamples from the experimental series ME 4 - ME 7 are shown in figure 14. It is moreflakes in the reference sample, ME 7.
Figure 14: Pictures of the samples from the experimental series, (a) ME 4,(b) ME 5, (c) ME6 and (d) ME 7.
Particles from the pilot scale experiment, ME 8, were measured with FPIA 3000and specific surface area and specific pore volume were measured with the N2 ad-sorption desorption method. The mean diameter was 41.4 µm, the dv50 was 37.4 µm
24
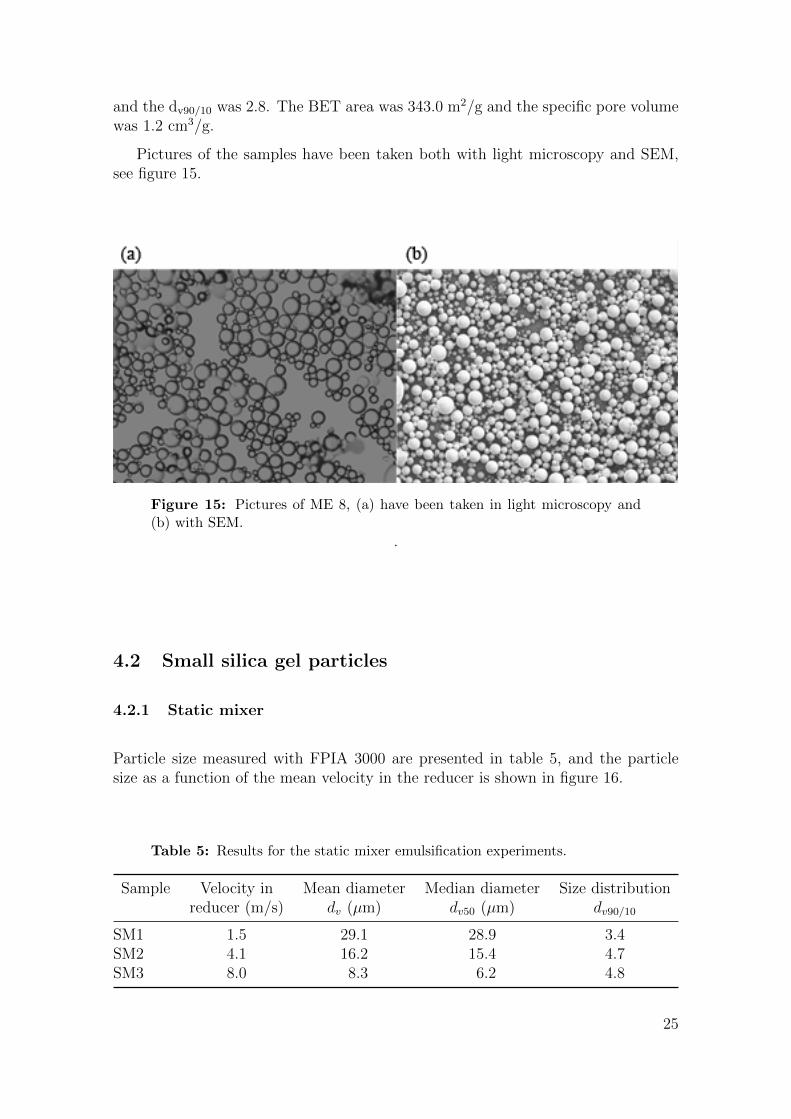
and the dv90/10 was 2.8. The BET area was 343.0 m2/g and the specific pore volumewas 1.2 cm3/g.
Pictures of the samples have been taken both with light microscopy and SEM,see figure 15.
Figure 15: Pictures of ME 8, (a) have been taken in light microscopy and(b) with SEM.
.
4.2 Small silica gel particles
4.2.1 Static mixer
Particle size measured with FPIA 3000 are presented in table 5, and the particlesize as a function of the mean velocity in the reducer is shown in figure 16.
Table 5: Results for the static mixer emulsification experiments.
Sample Velocity in Mean diameter Median diameter Size distributionreducer (m/s) dv (µm) dv50 (µm) dv90/10
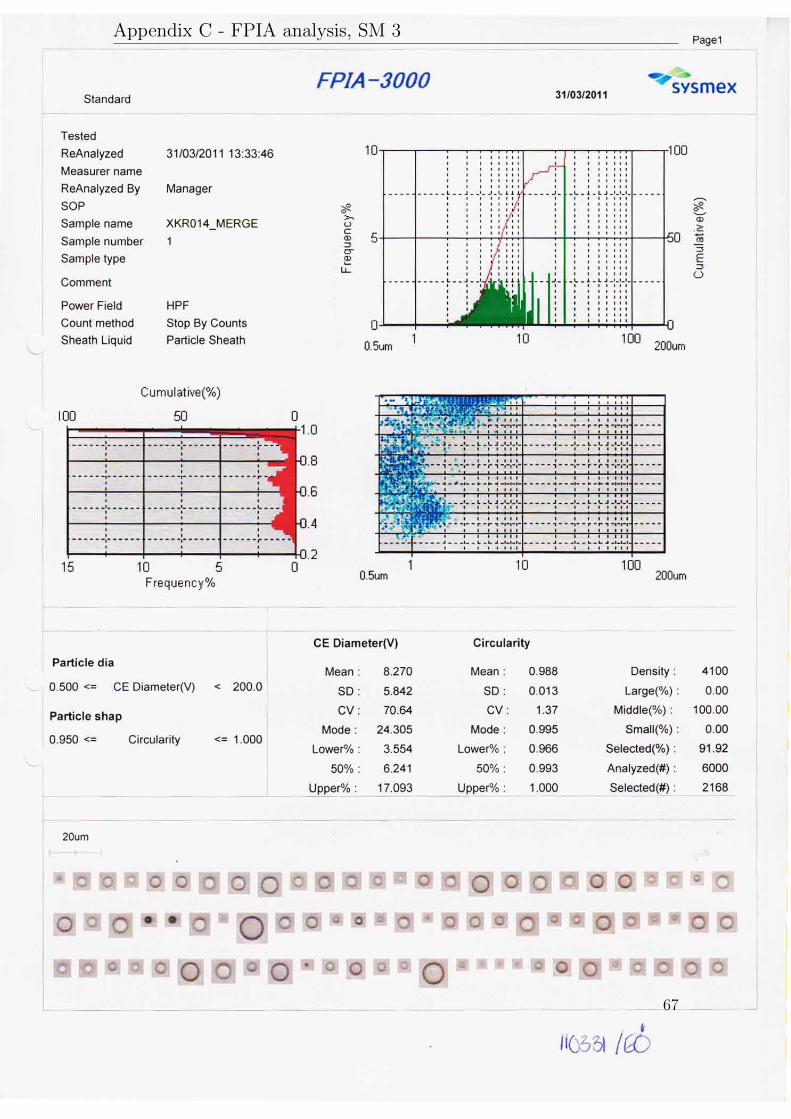
SM1 1.5 29.1 28.9 3.4SM2 4.1 16.2 15.4 4.7SM3 8.0 8.3 6.2 4.8
25

Figure 16: The particle size as a function of the mean velocity in the reducerof the static mixer set-up.
Pictures of the samples from the experimental series is shown in figure 17.
Figure 17: Pictures showing particles from the static mixing emulsificationexperiments. In (a) SM 2 and in (b) SM 3.
4.2.2 Stirring
The particle size analysis from the pilot scale experiment with high stirring speedwere made both with a FPIA 3000 and with a Beckman Coulter counter.
When using the FPIA to analyse the sample the mean diameter was 3.8 µm,the median diameter was 3.5 µm and the dv90/10 was 3.3. The corresponding resultswhen using the Beckman Coulter counter were a slightly higher median diameter
26
of 3.6 µm and a dv90/10 of 3.8. For this sample, the specific surface area was 337.4m2/g.
4.3 High surface area particles
Results from measurements with N2 adsorption desorption technique are presentedin the following sections.
4.3.1 Sodium stabilised sol
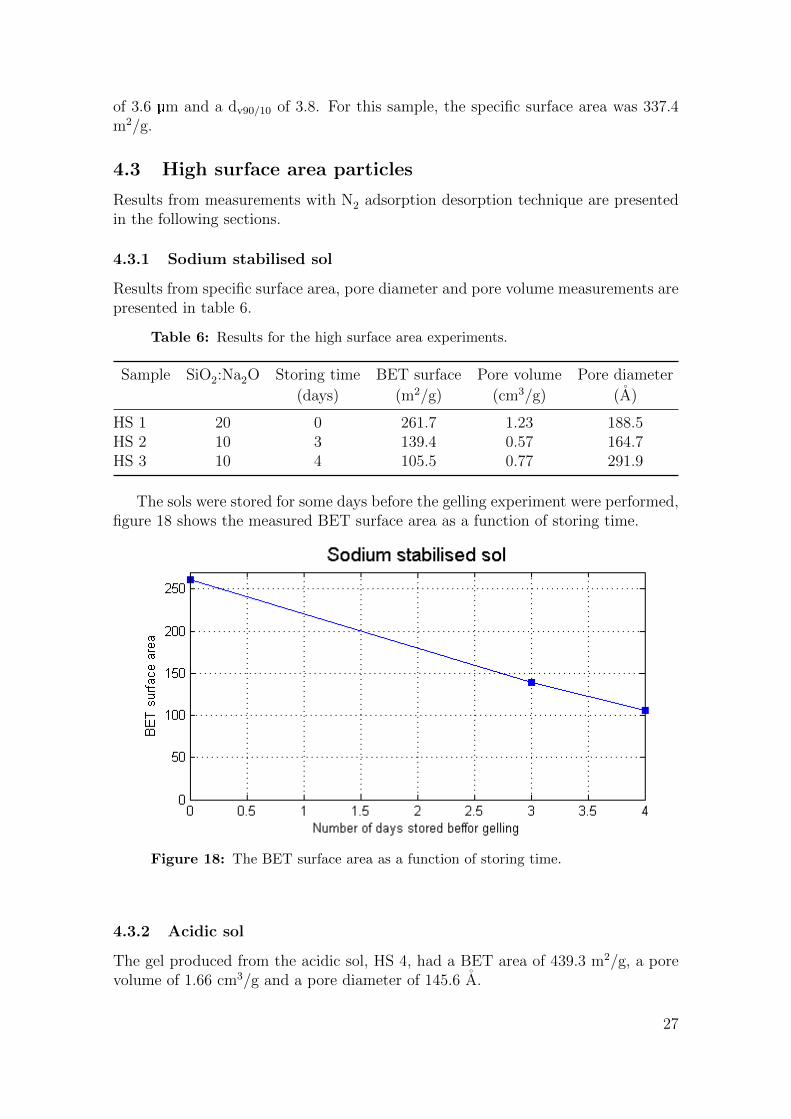
Results from specific surface area, pore diameter and pore volume measurements arepresented in table 6.
Table 6: Results for the high surface area experiments.
Sample SiO2:Na2O Storing time BET surface Pore volume Pore diameter
(days) (m2/g) (cm3/g) (A)
HS 1 20 0 261.7 1.23 188.5HS 2 10 3 139.4 0.57 164.7HS 3 10 4 105.5 0.77 291.9
The sols were stored for some days before the gelling experiment were performed,figure 18 shows the measured BET surface area as a function of storing time.
Figure 18: The BET surface area as a function of storing time.
4.3.2 Acidic sol
The gel produced from the acidic sol, HS 4, had a BET area of 439.3 m2/g, a porevolume of 1.66 cm3/g and a pore diameter of 145.6 A.
27

28
5 Discussion
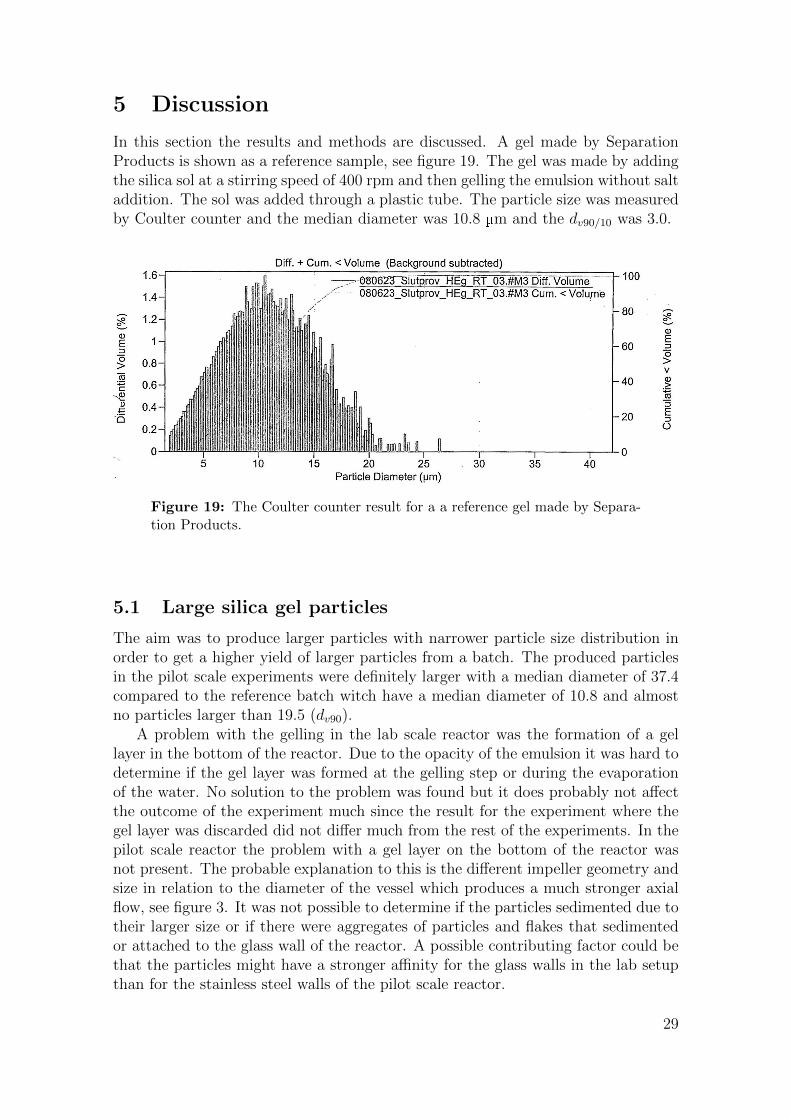
In this section the results and methods are discussed. A gel made by SeparationProducts is shown as a reference sample, see figure 19. The gel was made by addingthe silica sol at a stirring speed of 400 rpm and then gelling the emulsion without saltaddition. The sol was added through a plastic tube. The particle size was measuredby Coulter counter and the median diameter was 10.8 µm and the dv90/10 was 3.0.
Figure 19: The Coulter counter result for a a reference gel made by Separa-tion Products.
5.1 Large silica gel particles
The aim was to produce larger particles with narrower particle size distribution inorder to get a higher yield of larger particles from a batch. The produced particlesin the pilot scale experiments were definitely larger with a median diameter of 37.4compared to the reference batch witch have a median diameter of 10.8 and almostno particles larger than 19.5 (dv90).
A problem with the gelling in the lab scale reactor was the formation of a gellayer in the bottom of the reactor. Due to the opacity of the emulsion it was hard todetermine if the gel layer was formed at the gelling step or during the evaporationof the water. No solution to the problem was found but it does probably not affectthe outcome of the experiment much since the result for the experiment where thegel layer was discarded did not differ much from the rest of the experiments. In thepilot scale reactor the problem with a gel layer on the bottom of the reactor wasnot present. The probable explanation to this is the different impeller geometry andsize in relation to the diameter of the vessel which produces a much stronger axialflow, see figure 3. It was not possible to determine if the particles sedimented due totheir larger size or if there were aggregates of particles and flakes that sedimentedor attached to the glass wall of the reactor. A possible contributing factor could bethat the particles might have a stronger affinity for the glass walls in the lab setupthan for the stainless steel walls of the pilot scale reactor.
29
Whether the wires had any actual effect on the particle size and size distributionis hard to determine from the performed experiments. The result from the FPIA3000 shows that there are almost no difference between the reference sample andthe samples made using membrane emulsification. Microscopy showed clearly thatthe reference sample was full of flakes and had fewer spherical gel particles then thesamples made with wire, which makes the result from these analyses contradictoryand puts into question the reliability of the FPIA 3000. If the yield of large particlesis of interest, the ability to measure the amount of flakes is of course important aswell. The wire probably had a dampening effect on the velocity of the sol before itentered the agitated continuous phase which could be the reason why there are lessflakes and more spherical particles in the samples made with wire.
Literature states that there is a linear relationship between particle size andmembrane pore size [13]. This relationship has not been observed for the performedexperiments. One reason for this could be the difference in setup compared to thosefound in literature. In the used setup, stirring as well as membrane is applied whilethe setups found in literature had no impeller present that could destroy the formeddroplets. The setup used in this project could be expected to give a relationshipthat is a mixture of the one for stirring and the one for membrane emulsificationbecause the stirring will be limiting to the maximum droplet size. This implies thatparticles with narrow particle size distribution could be produced as long as thedroplets emerging from the membrane are not large enough to be destroyed by theimpeller. Small particles produced with wire could hence show a narrow particlesize distribution while a wire that causes large droplets to be formed would yield abroad size distribution after stirring.
Assuming that the particle size and distribution results obtained from analysingthe reference sample is reliable, it can be concluded that the cause for larger particlesbeing produced is not primarily the wire mesh but something else. The referencesample produced before the project started by Separation Products is made usinga flexible plastic tube which has a smaller diameter and is slightly curved. Whenthe sol is added, the velocity could be expected to be lower than for the stiff plastictube almost perpendicular to the surface. The effect of stirring speed, as indicatedby the results, seems to be significant but definitely not large enough to accountfor the total increase in particle size on its own. The final major difference in theprocedures is how the gelling was performed. The reference sample is boiled beforegelling which probably leads to droplet breakup with smaller particles as a result.It can be concluded that the addition of salt that causes gelling before evaporationof the dispersed phase leads to larger particle sizes.
To be able to draw any reliable conclusions from this work it is obvious that moreexperiments need to be made. First of all a more reliable reference sample withoutwire needs to be produced. Then different sol-addition flows should be tested, prefer-ably with a pump where the flow rate can be constant and controlled. The glassreactor could use a better impeller which produces a stronger axial flow to perhapsreduce the impact of layer formation in the bottom. To make the experiments morereproducible and less time consuming for the operator an automated vacuum pumpfor pressure reduction in the reactor is preferred compared to manually adjustingthe pressure during several hours when evaporating the dispersed phase.
30

5.2 Small silica gel particles
The limiting factors for the static mixer experiments were the pressure limit forthe plastic tubes and pipes and the capacity of the peristaltic pumps. The resultwas promising and a distinct, almost linear, correlation between the velocity in thereducer and the particle size was obtained.
The particle size distribution was, however, not narrowed compared with whenusing the standard gelling method. It can be noted that the size distribution broad-ens slightly with increased velocity but it should also be noted that the FPIA 3000is used also for this measurements and that the difference in distribution could bewithin its error margins. The way peristaltic pumps function could possibly alsoplay a part in how the particle size distribution turns out. A peristaltic pump isa positive displacement pump which uses a rotor with a number of rollers. As therotor turns, the part of the tube under compression closes thus forcing the fluid tobe moved through the tube. This causes a pulsing flow and the velocity of the fluidvaries with the pulses.
It was hard to regulate the flow from the pumps due to the analog speed control.To continue the work pumps with a constant non pulsing flow and digital speedcontroller to get an increased reproducibility of the experiments would definitely bepreferable.
The pilot scale experiment stood on its own and was performed because the staticmixer setup was insufficient for producing the desired yield of the sought particlesize. The experiment was based on the fact that increased stirring leads to moredroplet breakup and earlier experience from the supervisor of the project.
When it comes to the experimental part of the pilot scale experiment, it is to rec-ommend that the filtration and washing after the rehydroxylation step is performedin a centrifuge, both to save time and to get a cleaner product. The filtration ofsmall particles takes very long time in funnels since the filter cake gets very compact.
5.3 High surface area particles
The different grades of Kromasil particles produced at Separation Products, fromsilica sol, have the following relations between the pore size and the specific surfacearea: Samples with a pore diameter of 60 A have a specific surface area of around550 m2/g, a diameter 100 A gives 320 m2/g and a diameter of 300 A have a specificsurface area of about 110 m2/g.
The result showing the largest specific surface area for the sodium stabilised solsamples had an area of 291.9 m2/g and a pore diameter of 105.5 A. This indicatesthat this sample have a similar area to pore size ratio compared to the Kromasilparticles described above.
The relatively low specific surface area of the sodium stabilised samples is prob-ably due to the high pH of the sol which results in too large sol particles beforegelling takes place. For a pH between 10 and 11 the solubility of silica in the sol ishigh and hence the particle growth is fast, see section 2.1. Because of the growth ofthe sol particles the specific surface area was lower for the samples that had beenstored in the fridge. However the sols were stable and did not gel during this time.
31
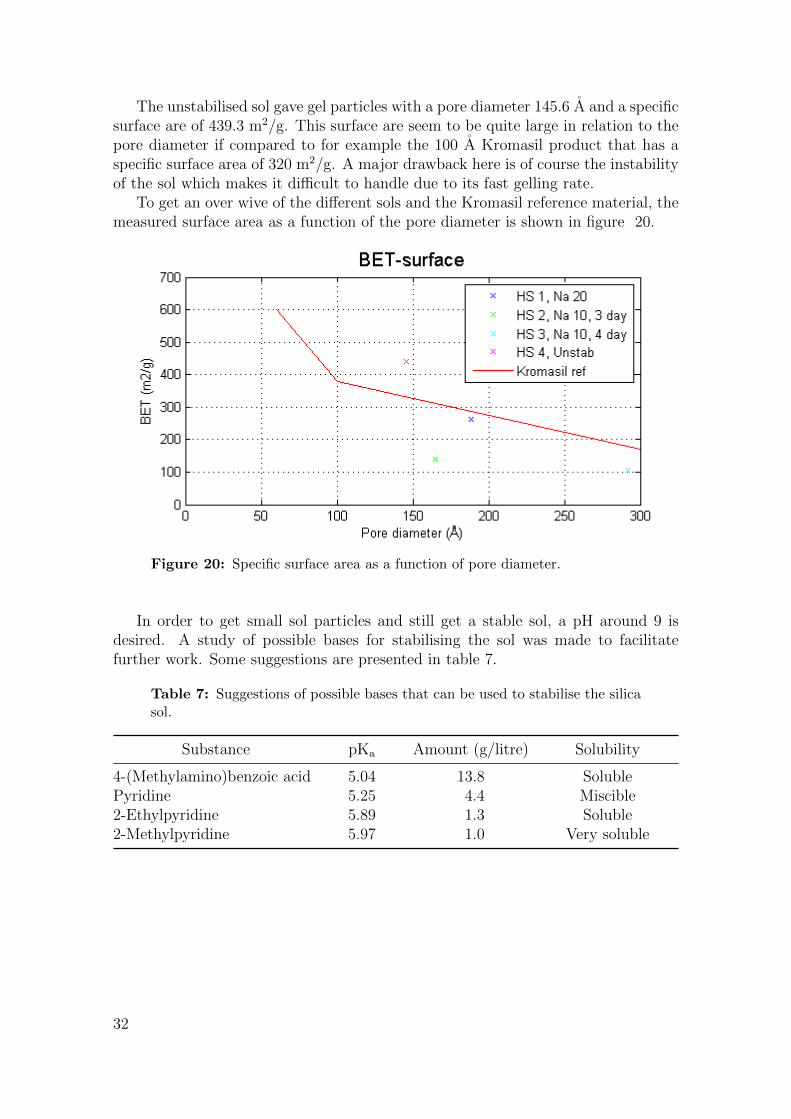
The unstabilised sol gave gel particles with a pore diameter 145.6 A and a specificsurface are of 439.3 m2/g. This surface are seem to be quite large in relation to thepore diameter if compared to for example the 100 A Kromasil product that has aspecific surface area of 320 m2/g. A major drawback here is of course the instabilityof the sol which makes it difficult to handle due to its fast gelling rate.
To get an over wive of the different sols and the Kromasil reference material, themeasured surface area as a function of the pore diameter is shown in figure 20.
Figure 20: Specific surface area as a function of pore diameter.
In order to get small sol particles and still get a stable sol, a pH around 9 isdesired. A study of possible bases for stabilising the sol was made to facilitatefurther work. Some suggestions are presented in table 7.
Table 7: Suggestions of possible bases that can be used to stabilise the silicasol.
Substance pKa Amount (g/litre) Solubility
4-(Methylamino)benzoic acid 5.04 13.8 SolublePyridine 5.25 4.4 Miscible2-Ethylpyridine 5.89 1.3 Soluble2-Methylpyridine 5.97 1.0 Very soluble
32
6 Concluding remarks
The work in this project has shown that it is possible to use new emulsificationmethods to control the average particle diameter of porous silica gel particles. Itis hence possible to produce gel materials with different average particle diameterscompared with Kromasil products commercially available today.
The membrane emulsification method, as used in this project, needs to be morethoroughly evaluated and different types of membranes need to be tested. It shouldbe considered to use a different set-up with a more controllable and even flow of thedispersed phase through the membrane.
Small average particle diameter can probably be achieved with the static mixermethod. An almost linear relationship was found between the fluid velocity throughthe reducer in front of the mixing elements and the particle size. To be able toreach higher velocity and thus smaller particles, a set-up allowing higher pressuresis necessary.
No real conclusions can be drawn from the results of the experiments aimed toproduce particles with higher surface area. Too few experiments were made andthe conditions, such as storage time and production method, were different for eachexperiment and are thus hard to compare.
33

34
7 Acknowledgement
I would like to thank the following people:
My supervisor Anders Torncrona for giving me the opportunity to do mymaster thesis work at Eka Chemicals, Separation Products. Thank you forthis interesting project with a lot of practical experiences.
Professor Krister Holmberg for being my examiner.
The production staff at Separation Products for all the nice coffee breaks andlunches and for helping me with the cleaning of the reactor. A special thanks toCarina Haarala, Sofia Friberg, Henric Fae and Lars-Ake Johansson for helpingme perform the pilot scale experiments during two very long days.
The staff working in the research lab for helping me out with my laboratorywork, especially Peter Gidlund and Maria Forsberg.
QC for running my analysis and helping me understand the analysis results.
My team mates for Varruset Lillemor, Barbro, Ulrika, Kristina and Maria.Thank you for the nice lunch walks with guidance trough Bohus and for thereally nice evening with picnic in Slottsskogen.
My three office mates, Emelie Ohgren, Albin Klint and Hafizur Rahman fornice chats and interesting discussions.
Finally lots of thanks to my family and friends for all your support and en-couragement.
35

36

8 References
[1] Berthod A. Silica: backbone material of liquid chromatographic column pack-ings. Journal of Chromatography A. 1991;549:1–28.
[2] Unger KK. Porous silica. Journal of Chromatography Library. Amsterdam:Elsevier; 1979.
[3] Iler RK. The chemistry of silica. New York: Wiley; 1979.
[4] Brinker CJ, Scherer GW. Sol-gel science. Boston: Academic press, Inc; 1990.
[5] Peters DC. Dynamics of emulsification. In: Harnby N, Edwards MF,Nienow AW, editors. Mixing in the Process Industries. Oxford: Butterworth-Heinemann; 1997. p. 294–321.
[6] Groeneweg F, van Dieren F, Agterof WGM. Droplet break-up in a stirredwater-in-oil emulsion in the presence of emulsifiers. Colloids and Surfaces A:Physicochemical and Engineering Aspects. 1994;91:207–214.
[7] Holmberg K, Jonsson B, Kronberg B, Lindman B. Surfactatnts and Polymersin Aqueous Solution. Chichester: Wiley & Sons, Ltd; 2002.
[8] Sinnott RK. Chemical Engineering Design. vol. 6 of Coulson & Richardson’sChemical Engineering. 4th ed. Butterworth-Heinemann; 2005.
[9] Tilton JN. Fluid and Particle Dynamics. In: Green DW, Perry RH, editors.Perry’s Chemical Engineers’ Handbook. 8th ed. New York: McGraw-Hill; 2008..
[10] Edwards MF, Baker MR. A review of liquid mixing equipment. In: Harnby N,Edwards MF, Nienow AW, editors. Mixing in the Process Industries. Oxford:Butterworth-Heinemann; 1997. p. 118–136.
[11] Thakur RK, Vial C, Nigam KDP, Nauman EB, Djelveh G. Static Mixers inthe Process Industries - A Review. Chemical Engineering Research and Design.2003;81(7):787–826.
[12] Charcosset C, Limayem I, Fessi H. The membrane emulsification process - areview. Journal of Chemical Technology and Biotechnology. 2004;79(3):209–218.
[13] Joscelyne SM, Tragardh G. Membrane emulsification - a literature review.Journal of Membrane Science. 2000;169(1):107–117.
[14] Kandori K, Kishi K, Ishikawa T. Formation mechanisms of monodispersedW/O emulsions by SPG filter emulsification method. Colloids and Surfaces.1991;61:269–279.
[15] Nakashima T, Shimizu M, Kukizaki M. Particle control of emulsion by mem-brane emulsification and its applications. Advanced Drug Delivery Reviews.2000;45(1):47–56.
37

[16] Xu Y. Particle size analyses of porous silica and hybrid silica chromatographicsupport particles: Comparison of flow/hyperlayer field-flow fractionation withscanning electron microscopy, electrical sensing zone, and static light scattering.Journal of Chromatography A. 2008;1191(1-2):40–56.
[17] Sing KSW. Reporting physisorption data for gas/solid systems with specialreference to the determination of surface area and porosity. Pure and AppliedChemistry. 1982;54(11):2201–2218.
38
Appendix A - Pumps
39

40

Appendix B - iFIX, ME 1
41

Appendix B - iFIX, ME 2
42

Appendix B - iFIX, ME 3
43
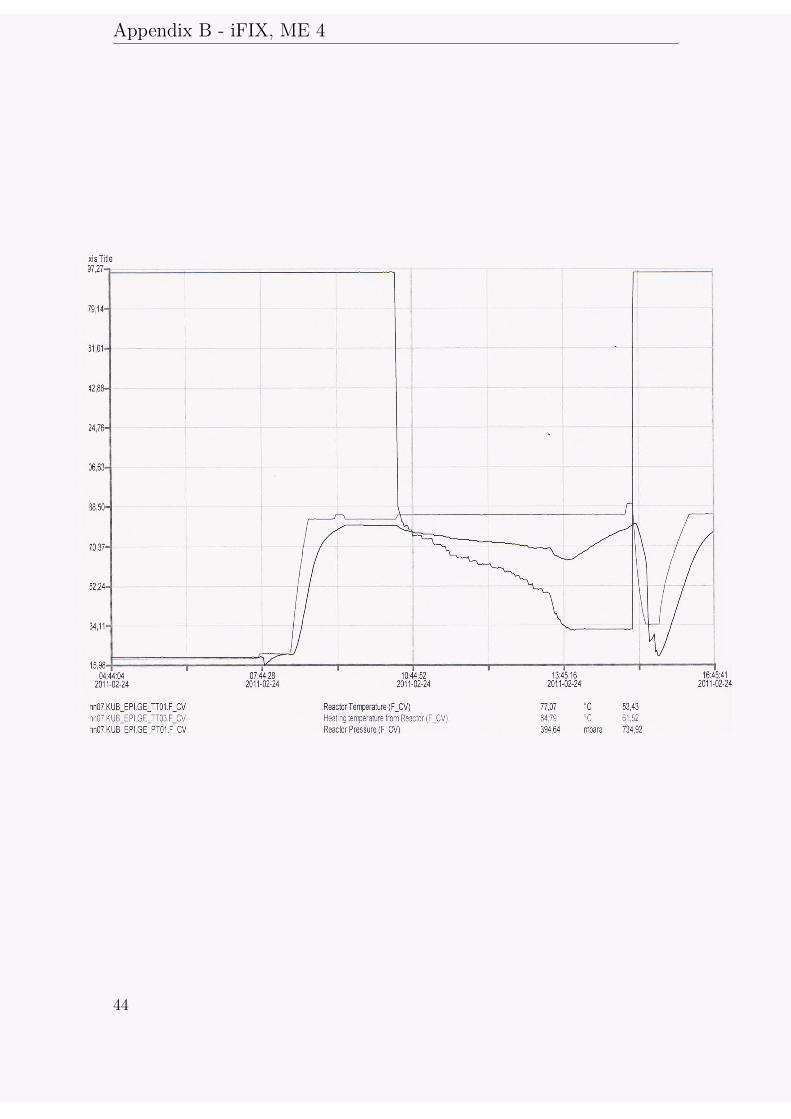
Appendix B - iFIX, ME 4
44
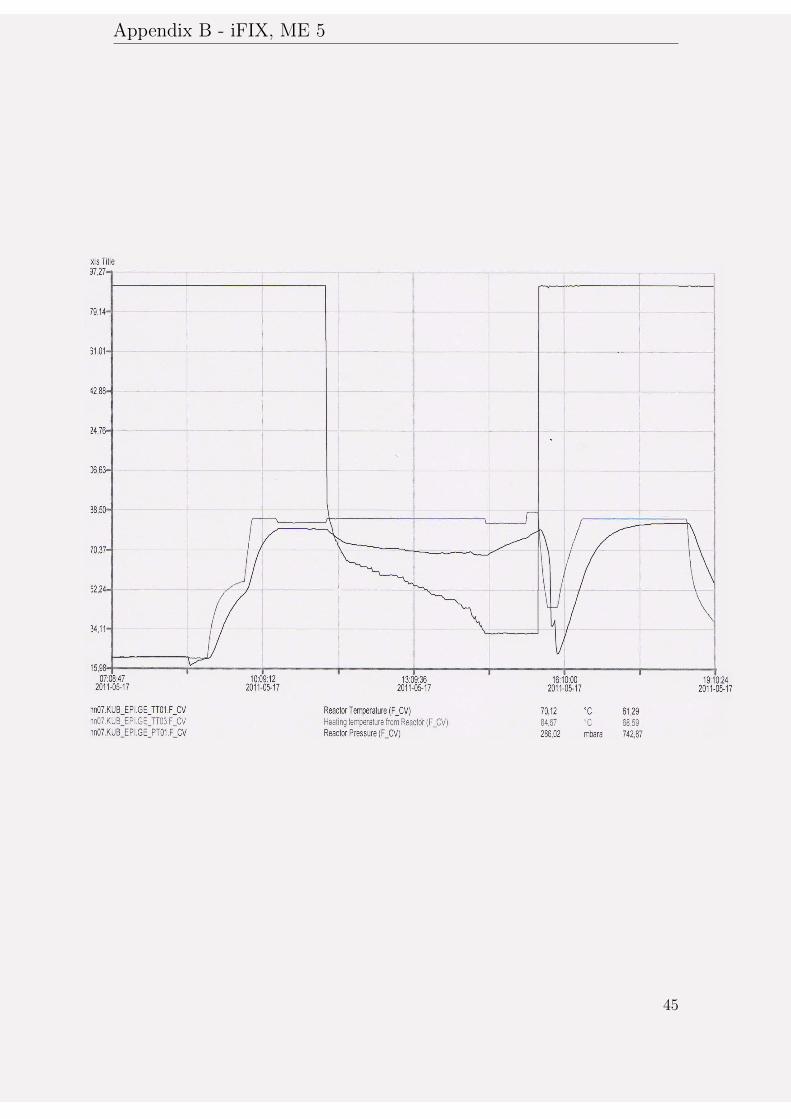
Appendix B - iFIX, ME 5
45

Appendix B - iFIX, ME 6
46

Appendix B - iFIX, ME 7
47

Appendix B - iFIX, ME 8
48

Appendix B - iFIX, SM 1
49

Appendix B - iFIX, SM 2
50

Appendix B - iFIX, SM 3
51

Appendix B - iFIX, ST 1
52

Appendix B - iFIX, HS 1
53

Appendix B - iFIX, HS 2
54

Appendix B - iFIX, HS 3
55

Appendix B - iFIX, HS 4
56

Appendix C - FPIA analysis, ME 1
57

Appendix C - FPIA analysis, ME 2
58
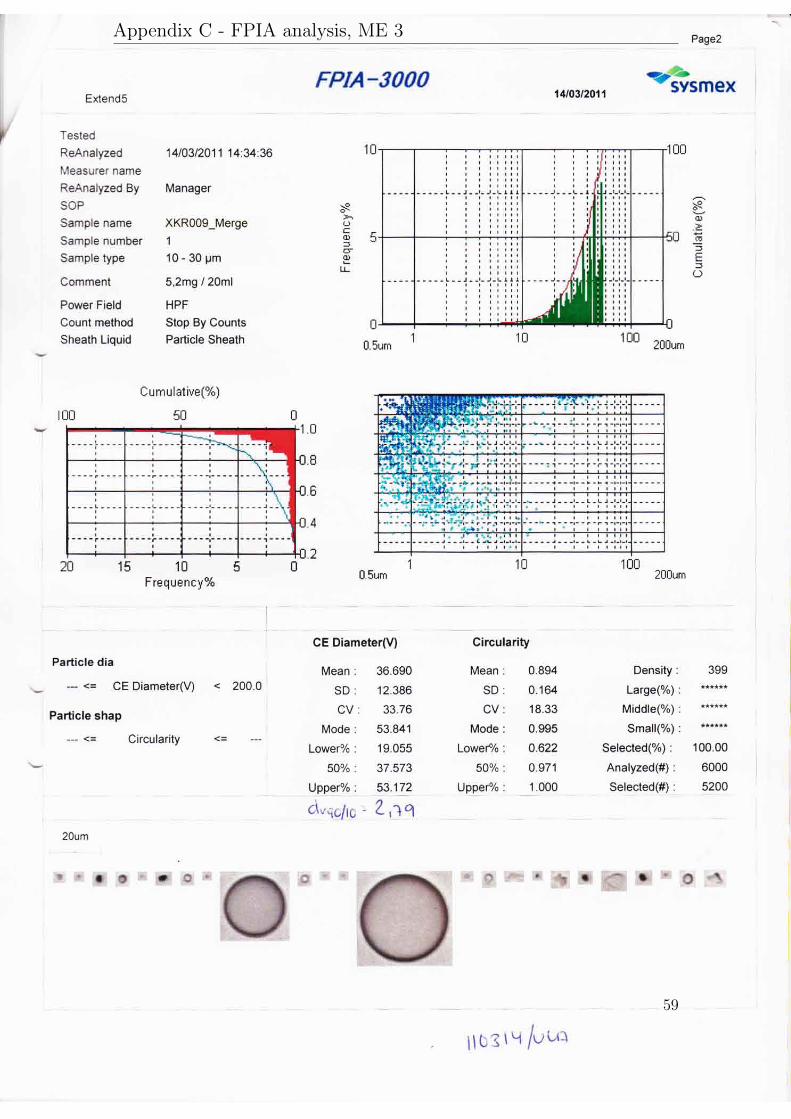
Appendix C - FPIA analysis, ME 3
59

Appendix C - FPIA analysis, ME 4
60

Appendix C - FPIA analysis, ME 5
61

Appendix C - FPIA analysis, ME 6
62

Appendix C - FPIA analysis, ME 7
63

Appendix C - FPIA analysis, ME 8
64
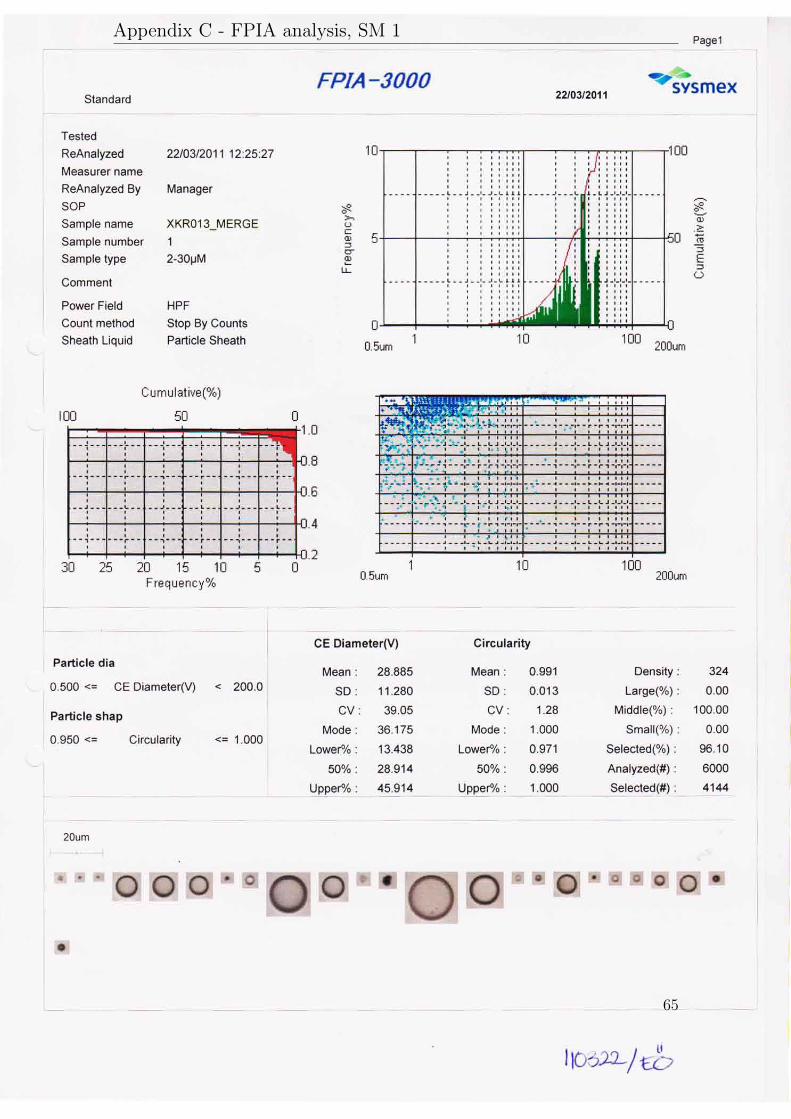
Appendix C - FPIA analysis, SM 1
65

Appendix C - FPIA analysis, SM 2
66
Appendix C - FPIA analysis, SM 3
67
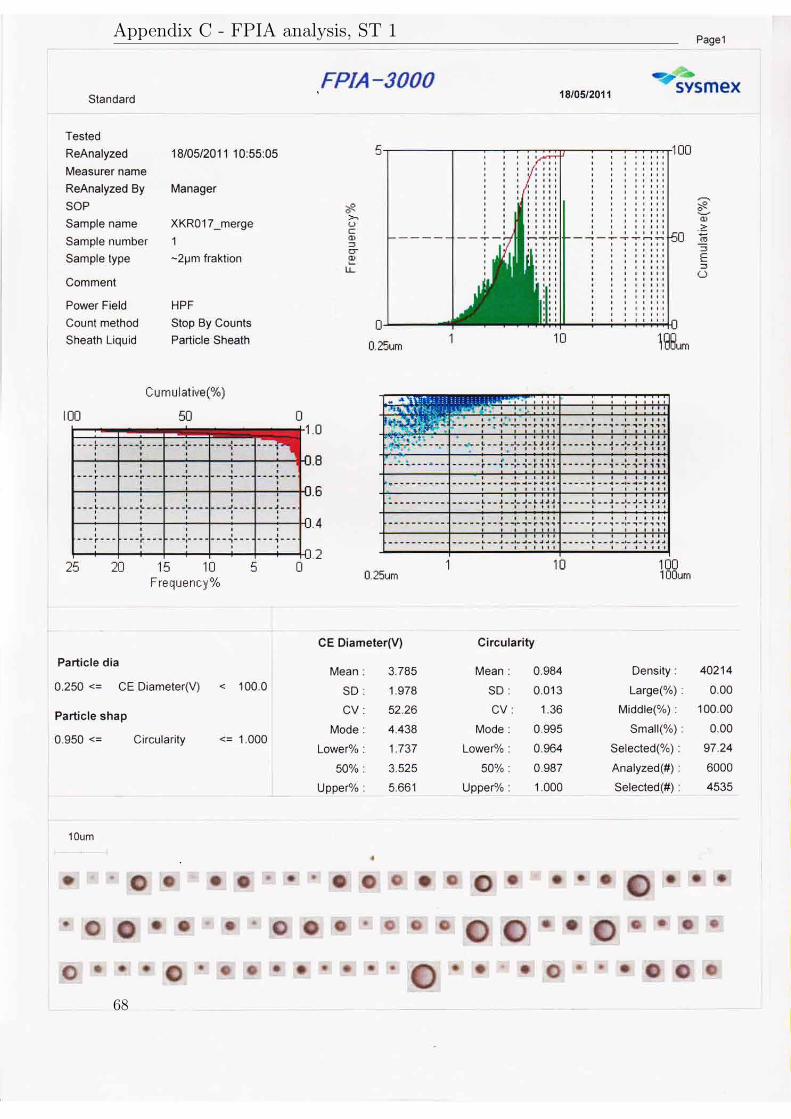
Appendix C - FPIA analysis, ST 1
68