infiltration trench factsheet - university of new hampshire · infiltration trench is a practice...
TRANSCRIPT

Infiltration Trench is a practice that provides temporary storage of runoff using the void spaces within the soil/sand/gravel mixture that is used to backfill the trench for subsequent infiltration into the surrounding sub-soils. Performance results for the infiltration trench can be used for all subsurface infiltration practices including systems that include pipes and/or chambers that provide temporary storage. Also, the results for this BMP type can be used for bio-retention systems that rely on infiltration when the majority of the temporary storage capacity is provided in the void spaces of the soil filter media and porous pavements that allow infiltration to occur. General design specifications for infiltration trench systems are provided in the most recent version of The New Hampshire Stormwater Manual, Volume 2: Post-Construction Best Management Practices Selection and Design.
Examples images from the New Hampshire Stormwater Manual, Volume 2, p. 86
Sample Design Cross Section Plan View
Infiltration Trench Factsheet
Source Category by Land Use Land Surface CoverP Load Export Rate1
(lbs./acre/year)N Load Export Rate2
(lbs./acre/year)Commercial (COM) and Industrial (IND) Directly connected impervious 1.78 15Multi-Family (MFR) and High-Density Residential (HDR) Directly connected impervious 2.32 14.1Medium-Density Residential (MDR) Directly connected impervious 1.96 14.1Low-Density Residential (LDR) - "Rural" Directly connected impervious 1.52 14.1
Prepared By:University of New HampshireStormwater CenterDurham, NHwww.unh.edu/unhscAugust 2017
2 From UNHSC Cost Estimates; converted from 2004 to 2010 dollars using U.S. Department of Labor (USDOL). (2012). Bureau of Labor Statistics consumer price index inflation calculator. http://www.bls.gov/data/inflation_calculator.htm3 Converted from 2010 costs using ENR Cost Index
Infiltration Trench System
Materials and Installation Cost ($/ft3) (2010)2
Design Cost ($/ft3) (2010)
Materials and Installation Cost ($/ft3) (2017)3
Design Cost ($/ft3) (2017)
Rural 8 2.8 9.84 3.44
Mixed 16 5.6 19.68 6.88
Urban 24 8.4 29.52 10.32
General Equations
Pollutant Export Rate by Land Use1
1 From NH Small MS4 General Permit, Appendix F
Physical Storage Capacity: Depth of Runoff * Drainage Area
Cost: Physical Storage Capacity * Cost Index * Adjustment Factor
Yearly Pollutant Removal: Pollutant Load Export Rate * Drainage Area * Efficiency
Cost

BMP Performance Curves for Soil Infiltration Rate: Infiltration Trench
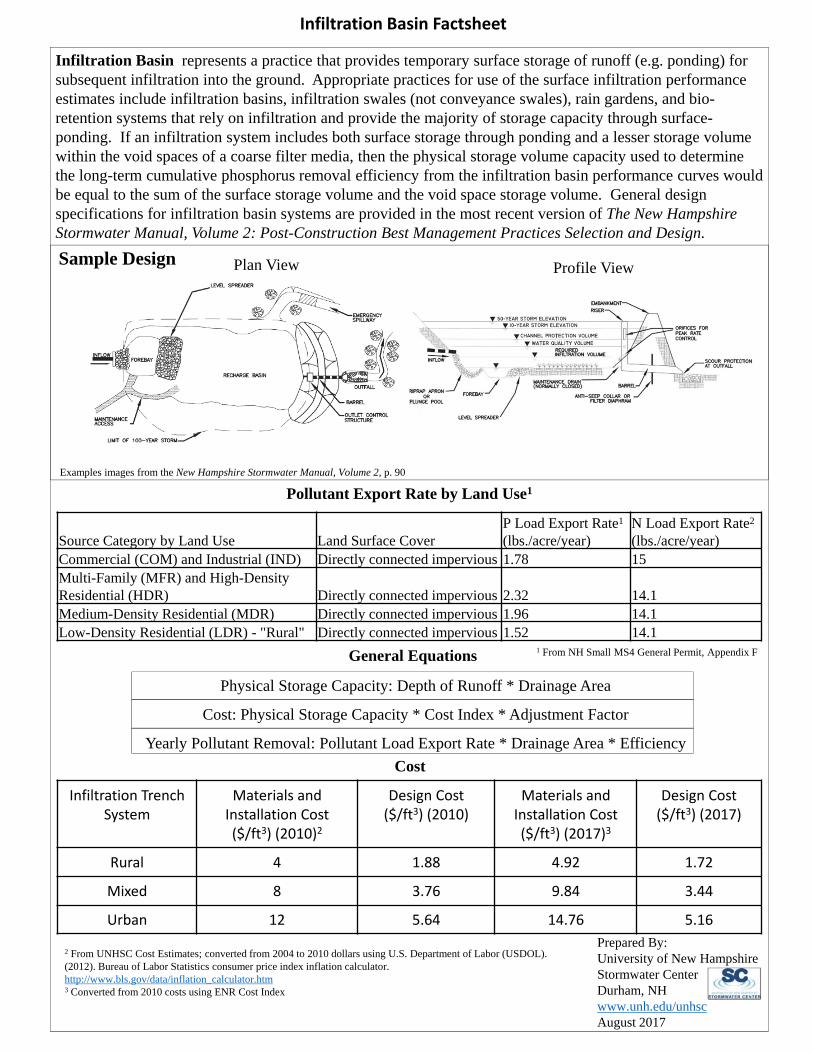
Infiltration Basin represents a practice that provides temporary surface storage of runoff (e.g. ponding) for subsequent infiltration into the ground. Appropriate practices for use of the surface infiltration performance estimates include infiltration basins, infiltration swales (not conveyance swales), rain gardens, and bio-retention systems that rely on infiltration and provide the majority of storage capacity through surface-ponding. If an infiltration system includes both surface storage through ponding and a lesser storage volume within the void spaces of a coarse filter media, then the physical storage volume capacity used to determine the long-term cumulative phosphorus removal efficiency from the infiltration basin performance curves would be equal to the sum of the surface storage volume and the void space storage volume. General design specifications for infiltration basin systems are provided in the most recent version of The New Hampshire Stormwater Manual, Volume 2: Post-Construction Best Management Practices Selection and Design.
Examples images from the New Hampshire Stormwater Manual, Volume 2, p. 90
Sample Design Plan View Profile View
Infiltration Basin Factsheet
Source Category by Land Use Land Surface CoverP Load Export Rate1
(lbs./acre/year)N Load Export Rate2
(lbs./acre/year)Commercial (COM) and Industrial (IND) Directly connected impervious 1.78 15Multi-Family (MFR) and High-Density Residential (HDR) Directly connected impervious 2.32 14.1Medium-Density Residential (MDR) Directly connected impervious 1.96 14.1Low-Density Residential (LDR) - "Rural" Directly connected impervious 1.52 14.1
Prepared By:University of New HampshireStormwater CenterDurham, NHwww.unh.edu/unhscAugust 2017
2 From UNHSC Cost Estimates; converted from 2004 to 2010 dollars using U.S. Department of Labor (USDOL). (2012). Bureau of Labor Statistics consumer price index inflation calculator. http://www.bls.gov/data/inflation_calculator.htm3 Converted from 2010 costs using ENR Cost Index
Infiltration Trench System
Materials and Installation Cost ($/ft3) (2010)2
Design Cost ($/ft3) (2010)
Materials and Installation Cost ($/ft3) (2017)3
Design Cost ($/ft3) (2017)
Rural 4 1.88 4.92 1.72
Mixed 8 3.76 9.84 3.44
Urban 12 5.64 14.76 5.16
General Equations
Pollutant Export Rate by Land Use1
1 From NH Small MS4 General Permit, Appendix F
Physical Storage Capacity: Depth of Runoff * Drainage Area
Cost: Physical Storage Capacity * Cost Index * Adjustment Factor
Yearly Pollutant Removal: Pollutant Load Export Rate * Drainage Area * Efficiency
Cost

BMP Performance Curves for Soil Infiltration Rate: Infiltration Basin

Biofiltration is a practice that provides temporary storage of runoff for filtering through an engineered soil media. The storage capacity is typically made of void spaces in the filter media and temporary ponding at the surface of the practice. Once the runoff has passed through the filter media it is collected by an under-drain pipe for discharge. The performance curve for this control practice assumes zero infiltration. If a filtration system has subsurface soils that are suitable for infiltration, then user should use either the performance curves for the infiltration trench or the infiltration basin depending on the predominance of storage volume made up by free standing storage or void space storage. Depending on the design of the manufactured or packaged bio-filter systems such as tree box filters may be suitable for using the bio-filtration performance results. Design specifications for biofiltration systems are provided in the most recent version of The New Hampshire Stormwater Manual, Volume 2: Post-Construction Best Management Practices Selection and Design.
Examples images from the New Hampshire Stormwater Manual, Volume 2, p. 116
Sample Design
Biofiltration Factsheet
Source Category by Land Use Land Surface CoverP Load Export Rate1
(lbs./acre/year)N Load Export Rate2
(lbs./acre/year)Commercial (COM) and Industrial (IND) Directly connected impervious 1.78 15Multi-Family (MFR) and High-Density Residential (HDR) Directly connected impervious 2.32 14.1Medium-Density Residential (MDR) Directly connected impervious 1.96 14.1Low-Density Residential (LDR) - "Rural" Directly connected impervious 1.52 14.1
Prepared By:University of New HampshireStormwater CenterDurham, NHwww.unh.edu/unhscAugust 2017
2 From UNHSC Cost Estimates; converted from 2004 to 2010 dollars using U.S. Department of Labor (USDOL). (2012). Bureau of Labor Statistics consumer price index inflation calculator. http://www.bls.gov/data/inflation_calculator.htm3 Converted from 2010 costs using ENR Cost Index
Infiltration Trench System
Materials and Installation Cost ($/ft3) (2010)2
Design Cost ($/ft3) (2010)
Materials and Installation Cost ($/ft3) (2017)3
Design Cost ($/ft3) (2017)
Rural 10 3.5 12.3 4.31
Mixed 20 7 24.6 8.62
Urban 30 10.5 36.9 12.93
General Equations
Pollutant Export Rate by Land Use1
1 From NH Small MS4 General Permit, Appendix F
Physical Storage Capacity: Depth of Runoff * Drainage Area
Cost: Physical Storage Capacity * Cost Index * Adjustment Factor
Yearly Pollutant Removal: Pollutant Load Export Rate * Drainage Area * EfficiencyCost
Profile view of a Tree Box Filter. The underdrain makes the system one example of a biofiltration system.

BMP Performance Curve for Biofiltration

Gravel Wetlands consists of one or more flow-through constructed wetland cells, preceded by a forebay. The cells are filled with a gravel media, supporting an organic substrate that is planted with wetland vegetation. During low-flow storm events, the systems is designed to promote subsurface horizontal flow through the gravel media, allowing contact with the root zone of the wetland vegetation. The gravel and planting media support a community of soil microorganisms. Water quality treatment occurs through microbial, chemical, and physical processes within this media. Treatment may also be enhanced by vegetative uptake.. General design specifications for infiltration basin systems are provided in the most recent version of The New Hampshire Stormwater Manual, Volume 2: Post-Construction Best Management Practices Selection and Design.
Examples images from the New Hampshire Stormwater Manual, Volume 2, p. 80
Sample DesignPlan View
Profile View
Gravel Wetlands Factsheet
Source Category by Land Use Land Surface CoverP Load Export Rate1
(lbs./acre/year)N Load Export Rate2
(lbs./acre/year)Commercial (COM) and Industrial (IND) Directly connected impervious 1.78 15Multi-Family (MFR) and High-Density Residential (HDR) Directly connected impervious 2.32 14.1Medium-Density Residential (MDR) Directly connected impervious 1.96 14.1Low-Density Residential (LDR) - "Rural" Directly connected impervious 1.52 14.1
Prepared By:University of New HampshireStormwater CenterDurham, NHwww.unh.edu/unhscAugust 2017
2 From UNHSC Cost Estimates; converted from 2004 to 2010 dollars using U.S. Department of Labor (USDOL). (2012). Bureau of Labor Statistics consumer price index inflation calculator. http://www.bls.gov/data/inflation_calculator.htm3 Converted from 2010 costs using ENR Cost Index
Infiltration Trench System
Materials and Installation Cost ($/ft3) (2010)2
Design Cost ($/ft3) (2010)
Materials and Installation Cost ($/ft3) (2017)3
Design Cost ($/ft3) (2017)
Rural 5.62 1.97 6.91 2.42
Mixed 11.24 3.94 13.82 4.84
Urban 16.86 5.91 20.73 7.26
General Equations
Pollutant Export Rate by Land Use1
1 From NH Small MS4 General Permit, Appendix F
Physical Storage Capacity: Depth of Runoff * Drainage Area
Cost: Physical Storage Capacity * Cost Index * Adjustment Factor
Yearly Pollutant Removal: Pollutant Load Export Rate * Drainage Area * Efficiency
Cost

BMP Performance Curve for Gravel Wetlands

Enhanced Biofiltration is a practice the provides temporary storage of runoff for filtering through an engineered soil media, augmented for enhanced phosphorus removal, followed by detention and denitrification in a subsurface internal storage reservoir (ISR) comprised of gravel. Runoff flows are routed through filter media and directed to the underlying ISR via an impermeable membrane for temporary storage. An elevated outlet control at the top of the ISR is designed to provide a retention time of at least 24 hours in the system to allow for sufficient time for denitrification and nitrogen reduction to occur prior to discharge. The design storage capacity for using the cumulative performance curves is comprised of void spaces in the filter media, temporary ponding at the surface of the practice and the void spaces in the gravel ISR. The cumulative phosphorus load reduction curve for this control is intended to be used for systems in which the filter media has been augmented with materials designed and/or known to be effective at capturing phosphorus. If the filter media is not augmented to enhance phosphorus capture, then the phosphorus performance curve for the Bio-Filter should be used for estimating phosphorus load reductions. The University of New Hampshire Stormwater Center (UNHSC) developed the design of this control practice and a design templated can be found at UNHSC’s website.
Enhanced Biofiltration with Internal Storage Reservoir (ISR) Factsheet
Source Category by Land Use Land Surface CoverP Load Export Rate1
(lbs./acre/year)N Load Export Rate2
(lbs./acre/year)Commercial (COM) and Industrial (IND) Directly connected impervious 1.78 15Multi-Family (MFR) and High-Density Residential (HDR) Directly connected impervious 2.32 14.1Medium-Density Residential (MDR) Directly connected impervious 1.96 14.1Low-Density Residential (LDR) - "Rural" Directly connected impervious 1.52 14.1
Prepared By:University of New HampshireStormwater CenterDurham, NHwww.unh.edu/unhscAugust 2017
2 From UNHSC Cost Estimates; converted from 2004 to 2010 dollars using U.S. Department of Labor (USDOL). (2012). Bureau of Labor Statistics consumer price index inflation calculator. http://www.bls.gov/data/inflation_calculator.htm3 Converted from 2010 costs using ENR Cost Index
Infiltration Trench System
Materials and Installation Cost ($/ft3) (2010)2
Design Cost ($/ft3) (2010)
Materials and Installation Cost ($/ft3) (2017)3
Design Cost ($/ft3) (2017)
Rural 11.56 4.05 14.22 4.98
Mixed 23.12 8.10 28.44 9.95
Urban 34.68 12.15 42.66 14.93
General Equations
Pollutant Export Rate by Land Use1
1 From NH Small MS4 General Permit, Appendix F
Physical Storage Capacity: Depth of Runoff * Drainage Area
Cost: Physical Storage Capacity * Cost Index * Adjustment Factor
Yearly Pollutant Removal: Pollutant Load Export Rate * Drainage Area * Efficiency
Cost

BMP Performance Curve for Enhanced Biofiltration w/ ISR
This Graph is Incorrect: Pictured graph in Appendix F does not match the provided data, instead copy-pasted gravel wetlands data

Porous Pavement consists of a porous surface, base, and sub-base materials which allow penetration of runoff through the surface into underlying soils. The surface materials for porous pavements can consist of paving blocks or grids, pervious asphalt, or pervious concrete. These materials are installed on a base which serves as a filter course between the pavement surface and the underlying sub-base material. The sub-base material typically comprises a layer of crushed stone that not only supports the overlying pavement structure, but also serves as a reservoir to store runoff that penetrates the pavement surface until it can percolate into the ground. General design specifications for porous pavement systems are provided in the most recent version of The New Hampshire Stormwater Manual, Volume 2: Post-Construction Best Management Practices Selection and Design.
Examples images from the New Hampshire Stormwater Manual, Volume 2, p. 120
Sample Design Profile View
Porous Pavement Factsheet
Source Category by Land Use Land Surface CoverP Load Export Rate1
(lbs./acre/year)N Load Export Rate2
(lbs./acre/year)Commercial (COM) and Industrial (IND) Directly connected impervious 1.78 15Multi-Family (MFR) and High-Density Residential (HDR) Directly connected impervious 2.32 14.1Medium-Density Residential (MDR) Directly connected impervious 1.96 14.1Low-Density Residential (LDR) - "Rural" Directly connected impervious 1.52 14.1
Prepared By:University of New HampshireStormwater CenterDurham, NHwww.unh.edu/unhscAugust 2017
2 From UNHSC Cost Estimates; converted from 2004 to 2010 dollars using U.S. Department of Labor (USDOL). (2012). Bureau of Labor Statistics consumer price index inflation calculator. http://www.bls.gov/data/inflation_calculator.htm3 Converted from 2010 costs using ENR Cost Index
General Equations
Pollutant Export Rate by Land Use1
1 From NH Small MS4 General Permit, Appendix F
Physical Storage Capacity: Depth of Runoff * Drainage Area
Cost: Physical Storage Capacity * Cost Index * Adjustment Factor
Yearly Pollutant Removal: Pollutant Load Export Rate * Drainage Area * EfficiencyCost
Infiltration Trench System
Materials and Installation Cost ($/ft3) (2010)2
Design Cost ($/ft3) (2010)
Materials and Installation Cost ($/ft3) (2017)3
Design Cost ($/ft3) (2017)
Porous Asphalt
Porous Concrete
Porous Asphalt
Porous Concrete
Porous Asphalt
Porous Concrete
Porous Asphalt
Porous Concrete
Rural 3.41 11.58 1.19 4.05 4.19 14.24 1.47 4.98
Mixed 6.8 23.16 2.38 8.10 8.38 28.48 2.94 9.96
Urban 10.23 34.74 3.57 12.15 12.57 42.72 4.41 14.94

BMP Performance Curve for Porous Pavement

Grass Swale is a system which consists of a vegetated channel with check dams designed to convey and treat stormwater runoff. The design of allows filtration through the vegetation and check dams and infiltration through the subsurface soil media. Vegetation for the swale is selected based on mowing requirements, expected design flow, and site soil conditions. The channel should be designed to carry the max design flow within the design depth while preventing erosion within the channel. General design specifications for grass swale systems are provided in the most recent version of The New Hampshire Stormwater Manual, Volume 2: Post-Construction Best Management Practices Selection and Design.
Examples images from the New Hampshire Stormwater Manual, Volume 2, p. 145
Sample DesignProfile View
Grass Swale Factsheet
Source Category by Land Use Land Surface CoverP Load Export Rate1
(lbs./acre/year)N Load Export Rate2
(lbs./acre/year)Commercial (COM) and Industrial (IND) Directly connected impervious 1.78 15Multi-Family (MFR) and High-Density Residential (HDR) Directly connected impervious 2.32 14.1Medium-Density Residential (MDR) Directly connected impervious 1.96 14.1Low-Density Residential (LDR) - "Rural" Directly connected impervious 1.52 14.1
Prepared By:University of New HampshireStormwater CenterDurham, NHwww.unh.edu/unhscAugust 2017
2 From UNHSC Cost Estimates; converted from 2004 to 2010 dollars using U.S. Department of Labor (USDOL). (2012). Bureau of Labor Statistics consumer price index inflation calculator. http://www.bls.gov/data/inflation_calculator.htm3 Converted from 2010 costs using ENR Cost Index
Infiltration Trench System
Materials and Installation Cost ($/ft3) (2010)2
Design Cost ($/ft3) (2010)
Materials and Installation Cost ($/ft3) (2017)3
Design Cost ($/ft3) (2017)
Rural
Mixed
Urban
General Equations
Pollutant Export Rate by Land Use1
1 From NH Small MS4 General Permit, Appendix F
Physical Storage Capacity: Depth of Runoff * Drainage Area
Cost: Physical Storage Capacity * Cost Index * Adjustment Factor
Yearly Pollutant Removal: Pollutant Load Export Rate * Drainage Area * Efficiency
Cost

BMP Performance Curve for Grass Swale

Sand Filter is a system which provides filtering of runoff through a sand filter media and temporary storage of runoff within the void spaces prior to discharge by way of an underdrain. Sand filters are generally used for overflow conditions of the primary BMP, and as such often include a pretreatment device to allow coarse settlements to settle out of the water. The top surface of the filter is kept clear of vegetation. General design specifications for sand filter systems are provided in the most recent version of The New Hampshire Stormwater Manual, Volume 2: Post-Construction Best Management Practices Selection and Design.
Examples images from the New Hampshire Stormwater Manual, Volume 2, p. 104
Sample Design
Sand Filter Factsheet
Source Category by Land Use Land Surface CoverP Load Export Rate1
(lbs./acre/year)N Load Export Rate2
(lbs./acre/year)Commercial (COM) and Industrial (IND) Directly connected impervious 1.78 15Multi-Family (MFR) and High-Density Residential (HDR) Directly connected impervious 2.32 14.1Medium-Density Residential (MDR) Directly connected impervious 1.96 14.1Low-Density Residential (LDR) - "Rural" Directly connected impervious 1.52 14.1
Prepared By:University of New HampshireStormwater CenterDurham, NHwww.unh.edu/unhscAugust 2017
2 From UNHSC Cost Estimates; converted from 2004 to 2010 dollars using U.S. Department of Labor (USDOL). (2012). Bureau of Labor Statistics consumer price index inflation calculator. http://www.bls.gov/data/inflation_calculator.htm3 Converted from 2010 costs using ENR Cost Index
Infiltration Trench System
Materials and Installation Cost ($/ft3) (2010)2
Design Cost ($/ft3) (2010)
Materials and Installation Cost ($/ft3) (2017)3
Design Cost ($/ft3) (2017)
Rural 11.49 4.02 14.13 4.94
Mixed 22.98 8.04 28.26 9.88
Urban 34.47 12.06 42.39 14.82
General Equations
Pollutant Export Rate by Land Use1
1 From NH Small MS4 General Permit, Appendix F
Physical Storage Capacity: Depth of Runoff * Drainage Area
Cost: Physical Storage Capacity * Cost Index * Adjustment Factor
Yearly Pollutant Removal: Pollutant Load Export Rate * Drainage Area * Efficiency
Cost
Plan ViewSection View

BMP Performance Curve for Sand Filter

Wet Pond is a class of systems designed to maintain a permanent pool of water year-round. The pool allows for pollutant removal via settling, biological uptake, and decomposition. This allows the system to treat both sediment loads and its commonly associated pollutants along with treating dissolved nutrients through the pond’s biological processes. For areas where water temperature is a concern, an underdrained gravel trench in the bench area around the permanent pool can allow for the extended release of stormwater, minimizing risk of clogging. General design specifications for wet pond systems are provided in the most recent version of The New Hampshire Stormwater Manual, Volume 2: Post-Construction Best Management Practices Selection and Design.
Examples images from the New Hampshire Stormwater Manual, Volume 2, p. 61
Sample DesignProfile View
Wet Pond Factsheet
Source Category by Land Use Land Surface CoverP Load Export Rate1
(lbs./acre/year)N Load Export Rate2
(lbs./acre/year)Commercial (COM) and Industrial (IND) Directly connected impervious 1.78 15Multi-Family (MFR) and High-Density Residential (HDR) Directly connected impervious 2.32 14.1Medium-Density Residential (MDR) Directly connected impervious 1.96 14.1Low-Density Residential (LDR) - "Rural" Directly connected impervious 1.52 14.1
Prepared By:University of New HampshireStormwater CenterDurham, NHwww.unh.edu/unhscAugust 2017
2 From UNHSC Cost Estimates; converted from 2004 to 2010 dollars using U.S. Department of Labor (USDOL). (2012). Bureau of Labor Statistics consumer price index inflation calculator. http://www.bls.gov/data/inflation_calculator.htm3 Converted from 2010 costs using ENR Cost Index
Infiltration Trench System
Materials and Installation Cost ($/ft3) (2010)2
Design Cost ($/ft3) (2010)
Materials and Installation Cost ($/ft3) (2017)3
Design Cost ($/ft3) (2017)
Rural 4.36 1.52 5.36 1.87
Mixed 8.72 3.04 10.72 3.74
Urban 13.08 4.56 16.08 5.61
General Equations
Pollutant Export Rate by Land Use1
1 From NH Small MS4 General Permit, Appendix F
Physical Storage Capacity: Depth of Runoff * Drainage Area
Cost: Physical Storage Capacity * Cost Index * Adjustment Factor
Yearly Pollutant Removal: Pollutant Load Export Rate * Drainage Area * Efficiency
Cost
Plan View

BMP Performance Curve for Wet Pond

Detention Basin consists of a type of system which is primarily intended to provide flood protection by containing the flow within an excavated area and gradually releasing it over the course of a design length of time, with extended dry detention basins typically having a detention time of 24 hours. This reduces the intensity of peak flows, and the detention time allows the treatment of some pollutants, particularly those associated with suspended solids. A detention basin may be combined with other BPMs to combine detention with other treatment methods. Dry detention basins are often referred to as dry ponds, due to their similarity in design to wet ponds. General design specifications for detention basin systems are provided in the most recent version of The New Hampshire Stormwater Manual, Volume 2: Post-Construction Best Management Practices Selection and Design.
Examples images from the New Hampshire Stormwater Manual, Volume 2, p. 159
Sample DesignProfile View
Extended Dry Detention Basin Factsheet
Source Category by Land Use Land Surface CoverP Load Export Rate1
(lbs./acre/year)N Load Export Rate2
(lbs./acre/year)Commercial (COM) and Industrial (IND) Directly connected impervious 1.78 15Multi-Family (MFR) and High-Density Residential (HDR) Directly connected impervious 2.32 14.1Medium-Density Residential (MDR) Directly connected impervious 1.96 14.1Low-Density Residential (LDR) - "Rural" Directly connected impervious 1.52 14.1
Prepared By:University of New HampshireStormwater CenterDurham, NHwww.unh.edu/unhscAugust 2017
2 From UNHSC Cost Estimates; converted from 2004 to 2010 dollars using U.S. Department of Labor (USDOL). (2012). Bureau of Labor Statistics consumer price index inflation calculator. http://www.bls.gov/data/inflation_calculator.htm3 Converted from 2010 costs using ENR Cost Index
Infiltration Trench System
Materials and Installation Cost ($/ft3) (2010)2
Design Cost ($/ft3) (2010)
Materials and Installation Cost ($/ft3) (2017)3
Design Cost ($/ft3) (2017)
Rural 4.36 1.52 5.36 1.87
Mixed 8.72 3.04 10.72 3.74
Urban 13.08 4.56 16.08 5.61
General Equations
Pollutant Export Rate by Land Use1
1 From NH Small MS4 General Permit, Appendix F
Physical Storage Capacity: Depth of Runoff * Drainage Area
Cost: Physical Storage Capacity * Cost Index * Adjustment Factor
Yearly Pollutant Removal: Pollutant Load Export Rate * Drainage Area * Efficiency
Cost
Plan View

BMP Performance Curve for Extended Dry Detention Basin