t-1 checklist infiltration tools v. 3 - caltrans · t-1 checklist infiltration tools v. 3.01 user...
TRANSCRIPT

T-1 Checklist Infiltration Tools v. 3.01 User Manual
February 28, 2013
CTSW-SA-12-239.09.04
Final
California Department of Transportation Division of Environmental Analysis
Stormwater Program 1120 N Street, Sacramento, California 95814
http://www.dot.ca.gov/hq/env/stormwater/index.htm

THIS PAGE INTENTIONALLY LEFT BLANK
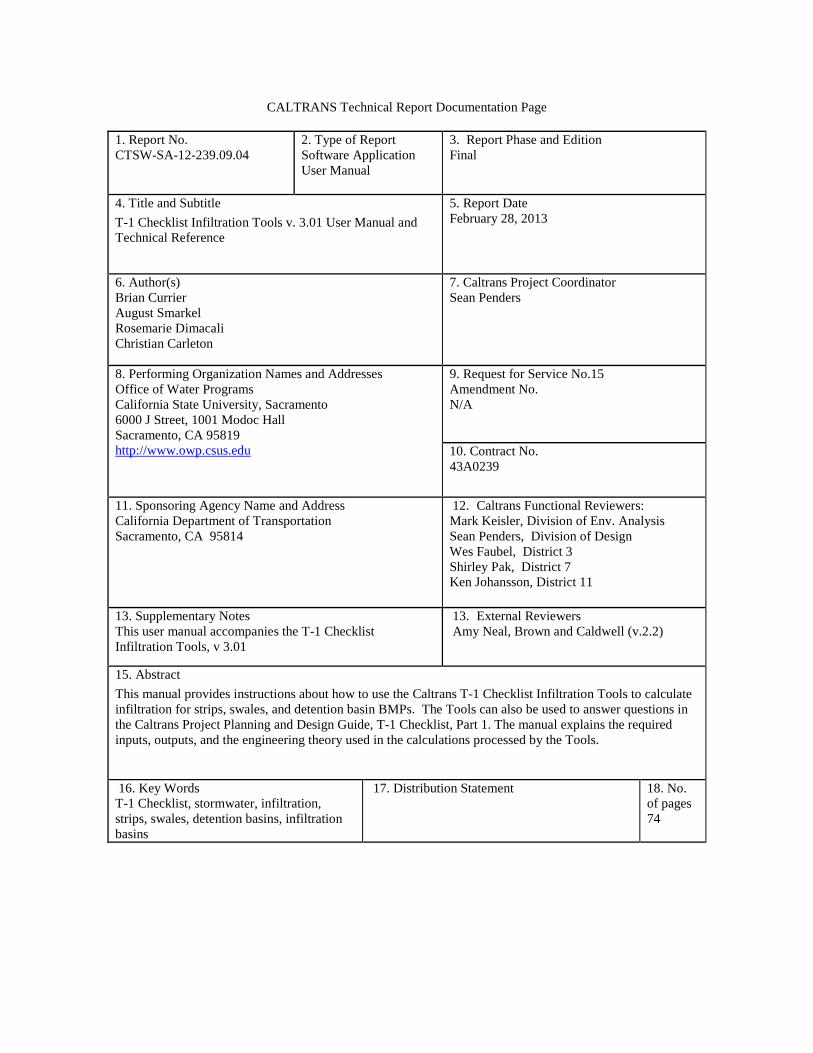
CALTRANS Technical Report Documentation Page
1. Report No. CTSW-SA-12-239.09.04
2. Type of Report Software Application User Manual
3. Report Phase and Edition Final
4. Title and Subtitle T-1 Checklist Infiltration Tools v. 3.01 User Manual and Technical Reference
5. Report Date February 28, 2013
6. Author(s) Brian Currier August Smarkel Rosemarie Dimacali Christian Carleton
7. Caltrans Project Coordinator Sean Penders
8. Performing Organization Names and Addresses Office of Water Programs California State University, Sacramento 6000 J Street, 1001 Modoc Hall Sacramento, CA 95819 http://www.owp.csus.edu
9. Request for Service No.15 Amendment No. N/A
10. Contract No. 43A0239
11. Sponsoring Agency Name and Address California Department of Transportation Sacramento, CA 95814
12. Caltrans Functional Reviewers: Mark Keisler, Division of Env. Analysis Sean Penders, Division of Design Wes Faubel, District 3 Shirley Pak, District 7 Ken Johansson, District 11
13. Supplementary Notes This user manual accompanies the T-1 Checklist Infiltration Tools, v 3.01
13. External Reviewers Amy Neal, Brown and Caldwell (v.2.2)
15. Abstract This manual provides instructions about how to use the Caltrans T-1 Checklist Infiltration Tools to calculate infiltration for strips, swales, and detention basin BMPs. The Tools can also be used to answer questions in the Caltrans Project Planning and Design Guide, T-1 Checklist, Part 1. The manual explains the required inputs, outputs, and the engineering theory used in the calculations processed by the Tools.
16. Key Words T-1 Checklist, stormwater, infiltration, strips, swales, detention basins, infiltration basins
17. Distribution Statement
18. No. of pages 74

For individuals with sensory disabilities, this document is available in alternate formats upon request.
Please call or write to: Storm Water Liaison, Caltrans Division of Environmental Analysis, MS-27 PO Box 942874, Sacramento, CA 94274-0001 (916) 653-8896 Voice, or dial 711 to use a relay service. DISCLAIMERS Any statements expressed in these materials are those of the individual authors and do not necessarily represent the views of CALTRANS, which takes no responsibility for any statement made herein. CALTRANS has not independently verified the results, conclusions or claims presented herein. No reference made in this publication to any specific method, product, process, or service constitutes or implies an endorsement, recommendation, or warranty thereof by CALTRANS. The materials are for general information only and do not represent a finding of fact, standard of CALTRANS, nor are they intended as a reference in purchase specifications, contracts, regulations, statutes, or any other legal document. CALTRANS makes no representation or warranty of any kind, whether expressed or implied, concerning the accuracy, completeness, suitability, or utility of any information, apparatus, product, or process discussed in this publication, and assumes no liability therefor. This information should not be used without first securing competent advice with respect to its suitability for any general or specific application. Anyone utilizing this information assumes all liability arising from such use, including but not limited to infringement of any patent or patents. Technical Memoranda are used for timely documentation and communication of preliminary results, interim reports, or more localized or special purpose information that may not have received formal outside peer reviews or detailed editing. Software applications are provided by CALTRANS “as is” and any express or implied warranties, including, but not limited to, the implied warranties of merchantability and fitness for a particular purpose are disclaimed. In no event shall CALTRANS be liable for any direct, indirect, incidental, special, exemplary, or consequential damages (including, but not limited to, procurement of substitute goods or services; loss of use, data, or profits; or business interruption) however caused and on any theory of liability, whether in contract, strict liability, or tort (including negligence or otherwise) arising in any way out of the use of this software, even if advised of the possibility of such damage. Copyright (2012) California Department of Transportation All Rights Reserved

T-1 Checklist Infiltration Tools v. 3.01 User Manual
February 28, 2013
i
Table of Contents
1 Introduction ........................................................................................................................... 1
1.1 Background and Purpose ...................................................................................................1
1.2 Calculation Assumptions...................................................................................................2
2 Strip and Swale Infiltration Tool (SSIT) ............................................................................. 3
2.1 Default Values ...................................................................................................................5
2.2 User Input: Area and Rainfall ...........................................................................................5
2.3 User Input: Native Soil or Fill ...........................................................................................8
2.4 User Input: Amended Soil .................................................................................................9
2.5 Results: Native Soil or Fill (rate-based calculation) .......................................................11
2.6 Results: Amended Soil (volume-based calculation) .......................................................11
2.7 Design Assumption Checks ............................................................................................12
2.8 SSIT Results Worksheet..................................................................................................13
3 Basin Infiltration Tool (BIT) .............................................................................................. 15
3.1 Link to Strip and Swale BMP for Optional Treatment Train ..........................................16
3.2 Site Characteristics ..........................................................................................................16
3.3 Basin Characteristics .......................................................................................................17
3.4 Soil Characteristics ..........................................................................................................18
3.5 Orifice Characteristics .....................................................................................................19
3.6 Size Basin and Calculate WQV Infiltrated .....................................................................19
3.7 Tracking Volume vs. Time..............................................................................................20
3.8 BIT Results Worksheet ...................................................................................................21
4 Definitions ............................................................................................................................ 23
5 References ............................................................................................................................ 25
6 List of Appendices ............................................................................................................... 26

T-1 Checklist Infiltration Tools v. 3.01 User Manual
February 28, 2013
ii
List of Tables
Table 1 Default values and units ..................................................................................................... 5
List of Figures
Figure 1 SSIT, Input worksheet overview ...................................................................................... 4 Figure 2 SSIT, User input: Area and rainfall .................................................................................. 7 Figure 3 Schematic of contributing drainage area, pervious area, and BMP amendment area ...... 8 Figure 4 SSIT, User input: Native soil or fill.................................................................................. 8 Figure 5 SSIT, Soil infiltration properties (user input or auto-fill)................................................. 9 Figure 6 SSIT, User input: Amended soil (user input or auto-fill) ............................................... 10 Figure 7 Schematic of strip profile changes with construction phases ......................................... 10 Figure 8 SSIT, Results: Native soil or fill (answers T-1 Checklist, Part 1, Question 5b) ............ 11 Figure 9 SSIT, Results: Amended soil (answers T-1 Checklist, Part 1, Question 5d) ................. 12 Figure 10 SSIT, Design assumption checks showing violations .................................................. 13 Figure 11 SSIT, Results worksheet ............................................................................................... 14 Figure 12 BIT, Input worksheet overview .................................................................................... 16 Figure 13 BIT, Site characteristics ................................................................................................ 17 Figure 14 BIT, Basin characteristics ............................................................................................. 18 Figure 15 BIT, Soil characteristics ............................................................................................... 19 Figure 16 BIT, Orifice characteristics .......................................................................................... 19 Figure 17 BIT, Size basin and calculate WQV infiltrated ............................................................ 20 Figure 18 BIT, Volume vs. time output ........................................................................................ 20 Figure 19 BIT, Results worksheet ................................................................................................ 22

T-1 Checklist Infiltration Tools v. 3.01 User Manual
February 28, 2013
1
1 Introduction The T-1 Checklist was developed to assist designers with identifying and selecting project-specific best management practices (BMPs) as described in Appendix E of the Project Planning and Design Guide (PPDG) (Caltrans 2012). The T-1 Checklist implements the BMP selection process in the PPDG that identifies top BMP candidates. The selection process is primarily based on expected infiltration and the type of pollutant that is being targeted. The T-1 Checklist Infiltration Tools v. 3.01 were developed to provide designers with a consistent and documented method of calculating infiltration for input to the T-1 Checklist. The Infiltration Tools are not intended for use as structural design tools.
1.1 Background and Purpose Questions 5 and 7 on the T-1 Checklist, Part 1 require the designer to know the percentage of the water quality volume (WQV) that certain BMPs or combinations of BMPs will infiltrate. The T-1 Checklist Infiltration Tools were developed as a set of Microsoft® Excel worksheets contained within a single workbook that allow the designer to calculate the potential infiltration within a drainage area. The workbook contains two separate tools: the Strip and Swale Infiltration Tool (SSIT) and the Basin Infiltration Tool (BIT). The SSIT was created to estimate infiltration for biofiltration strips and swales, infiltration trenches, and other subsurface infiltration practices. The BIT was created to estimate infiltration for detention basins and infiltration basins. The values generated by these tools are intended to be used in the T-1 Checklist, which requires the input of an infiltration estimate for four conditions: 1) flow across native soil or existing fill, 2) flow across amended soil, 3) infiltration basins, and 4) detention basins.
Strip and Swale Infiltration Tool (SSIT) The SSIT was designed to address T-1 Checklist, Part 1, Questions 5b and 5d, which require an estimate of the percentage of WQV infiltrated for biofiltration strips and swales. Question 5b is concerned with infiltration by the native soil or fill. Question 5d refers to infiltration by the proposed amended soil (e.g., native or fill soil with incorporated compost).
The SSIT calculates infiltration for three scenarios: existing, proposed design, and isolated net new impervious (NNI). The values calculated for the existing scenario are not used to answer T-1 Checklist questions. They are used only to compare the pre-project and post-project water balance. The proposed design scenario calculates how much water can be infiltrated from the entire contributing drainage area. The isolated NNI scenario only considers the net new impervious area as if it was hydraulically isolated from the actual drainage area. Since projects only require treatment of the runoff volume increase from the net new impervious area, the SSIT calculation is done to show how much of the NNI runoff volume can be infiltrated. Note that 100% treatment of NNI is required (if feasible), but 100% infiltration is not required.
Basin Infiltration Tool (BIT) The BIT was designed to address T-1 Checklist, Part 1, Questions 7b and 7c, which require an estimate of the percentage of WQV infiltrated for strip and swale BMPs in conjunction with infiltration basins (7b) and detention basins (7c).

T-1 Checklist Infiltration Tools v. 3.01 User Manual
February 28, 2013
2
1.2 Calculation Assumptions To estimate infiltration, certain site-specific values of soil properties that are not readily available were assumed. These assumed values are costly and time-consuming to obtain, so the values were developed based on best professional judgment after consulting available literature and are used as default values in the Infiltration Tools. The user can change the assumed values in the Default Values worksheet if more appropriate site-specific data is available. For more information about the assumed values and a review of calculation methodology, see “T-1 Checklist Infiltration Tools v3.01 Technical Reference” CTSW-SA-12-239.09.05.
T-1 Checklist Infiltration Tools v. 3.01 User Manual
February 28, 2013
3
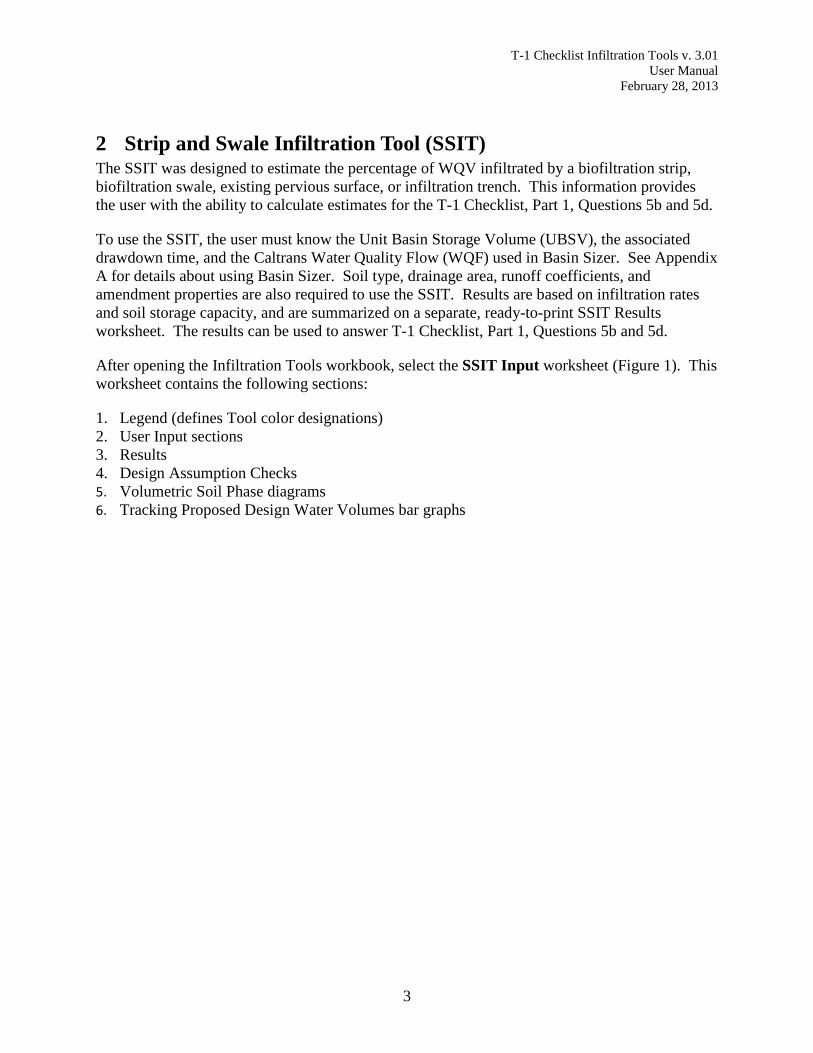
2 Strip and Swale Infiltration Tool (SSIT) The SSIT was designed to estimate the percentage of WQV infiltrated by a biofiltration strip, biofiltration swale, existing pervious surface, or infiltration trench. This information provides the user with the ability to calculate estimates for the T-1 Checklist, Part 1, Questions 5b and 5d.
To use the SSIT, the user must know the Unit Basin Storage Volume (UBSV), the associated drawdown time, and the Caltrans Water Quality Flow (WQF) used in Basin Sizer. See Appendix A for details about using Basin Sizer. Soil type, drainage area, runoff coefficients, and amendment properties are also required to use the SSIT. Results are based on infiltration rates and soil storage capacity, and are summarized on a separate, ready-to-print SSIT Results worksheet. The results can be used to answer T-1 Checklist, Part 1, Questions 5b and 5d.
After opening the Infiltration Tools workbook, select the SSIT Input worksheet (Figure 1). This worksheet contains the following sections:
1. Legend (defines Tool color designations) 2. User Input sections 3. Results 4. Design Assumption Checks 5. Volumetric Soil Phase diagrams 6. Tracking Proposed Design Water Volumes bar graphs

T-1 Checklist Infiltration Tools v. 3.01 User Manual
February 28, 2013
4
Figure 1 SSIT, Input worksheet overview

T-1 Checklist Infiltration Tools v. 3.01 User Manual
February 28, 2013
5
2.1 Default Values The user can change the default values on the Default Values worksheet. The values, displayed in Table 1, can be restored using the Restore default values button on the worksheet. Table 1 Default values and units
Parameter Unit Default Value
Conductivity of soil in/hr Conservative values from PPDG, Design Guidelines, Infiltration Trenches, Table 3-1
Runoff coefficient for the net new impervious area
Not applicable Asphalt street value from Caltrans Highway Design Manual (HDM 2010), Table 819.2B
Specific gravity of soil particles Not applicable 2.65
Density of water g/cm3 or entered by user
1
Amendment Type Unit Compost Sand High void space modular drainage cells
Bulk density of the amendment g/cm3 0.5 1.7 0.055
Specific gravity of the amendment Not applicable 0.8 2.65 1.1
Infiltration rate for amendment in/hr 8 8 500
Void ratio of final compacted soil Not applicable 0.54 0.5 19
2.2 User Input: Area and Rainfall This section of the SSIT (Figure 2) contains required user inputs that allow the Tool to estimate precipitation volumes and runoff volumes from pervious and impervious areas.
Unit basin storage volume from Basin Sizer, where C = 1.0 – Use Basin Sizer to determine the UBSV (Appendix A). A runoff coefficient of 1 must be used in Basin Sizer because all losses must be calculated within the SSIT. This will give a UBSV that is the rainfall depth over the entire area.
Drawdown time used in Basin Sizer – The drawdown time is an input for both the Basin Sizer and Infiltration Tools. The same drawdown time must be used in each. Based on the drawdown time, Basin Sizer selects the appropriate UBSV. A BMP must be able to process the UBSV within the drawdown time to be ready for another storm.
Rainfall rate from Basin Sizer “Caltrans Water Quality Flows” – Use Basin Sizer to determine WQF (Appendix A).

T-1 Checklist Infiltration Tools v. 3.01 User Manual
February 28, 2013
6
Contributing Drainage Area (CDA), including all impervious area – The CDA is the drainage area contributing runoff to the strip or swale. Input the area for existing conditions and for the proposed design in square feet (ft2) or acres (Figure 2). Landscaped (pervious) areas that do not receive runoff from impervious (paved) surfaces and drain to the BMP are part of the contributing drainage area (CDA). The user must select the correct units in the “Units” column by clicking the cell highlighted in white. For the “Isolated NNI” column, the CDA is calculated as the sum of the “Net new impervious (NNI) area” plus “Additional impervious area seeking treatment credit”.
Total impervious area – Impervious areas located within the CDA that include roadways, roofs, and similar improvements that restrict the infiltration of water into underlying soils. This value must be equal or smaller than the CDA.
Net new impervious (NNI) area – The NNI area is the increase in impervious surface within the CDA due to the project design. This value is calculated by the difference between the impervious area of the proposed and existing conditions. For existing conditions, this value is 0.
Additional impervious area seeking treatment credit – Any area additional to the NNI area that the designer would like credit for treating. This can include NNI area from other drainage areas within the project or treatment requirements within the CDA that are not tied to the NNI area (e.g., TMDLs).
Pervious Area: Relief (see HDM, Figure 819.2A) – Select the appropriate slope from the cell dropdown options: No Pervious Area; Steep, slopes above 30%; Hilly, slopes of 10% to 30%; Rolling, slopes of 5% to 10%; Flat land, slopes of 0% to 5 %; or No Pervious Area.
Pervious Area: Vegetal Cover (see HDM, Figure 819.2A) – Select the appropriate plant type and coverage scenario from the cell dropdown options: No Pervious Area; No effective plant cover, bare or very sparse; Poor to fair, <20% cover; Fair to good, 50% cover; Good to excellent, 90% cover; or No Pervious Area.
Pervious Area: Surface storage (see HDM, Figure 819.2A) – Select the appropriate description of surface storage from the cell’s drop-down options: No Pervious Area; Negligible, drainageways steep and small; Low, no ponds or marshes; Normal, lakes and pond marshes; High, large flood plain storage; and No Pervious Area.
Input cells for pervious area will turn red if the CDA is completely impervious and “No Pervious Area” is not selected. Cells also display in red if there is pervious area within the CDA and “No Pervious Area” is selected.
Pervious runoff coefficient (based on HDM) – Calculated from user inputs for “Relief,” “Vegetal Cover,” “Surface Storage,” and “Native or fill (underlying) HSG soil type.” The calculation follows the procedure found in the HDM. If “No Pervious Area” is selected for any of the pervious area options, the “Pervious runoff coefficient” is set to the default value of 0.9. If there is no pervious area the CDA and impervious area values must be equal.

T-1 Checklist Infiltration Tools v. 3.01 User Manual
February 28, 2013
7
Runoff coefficient of the contributing drainage area – The runoff coefficient is an area-weighted coefficient calculated for the combined pervious and impervious areas within the CDA.
BMP amendment area –The BMP amendment area is the treatment area using soil amendment. Strip and swale areas can be combined.
Percentage of BMP area/contributing drainage area – This factor is an output that helps the user assess the relative availability of land for BMPs. The user should not expect substantial infiltration from projects with values below 5% and poorly infiltrating soils. Projects with values above 10% can usually achieve substantial infiltration.
Figure 2 SSIT, User input: Area and rainfall If a site has an existing strip, swale, or trench, input the BMP amendment area in the “Existing” column (shown in Figure 2). If not, enter 0. For a proposed design, initially input the maximum area able to receive soil amendments. After all input is completed and the results are shown, this value can be reduced to find the most cost-effective solution. If cells are highlighted in red, a design assumption has been violated. The user should finish entering all other inputs and auto-fills before addressing violations or errors (see Section 2.7). Figure 3 shows a schematic of a contributing drainage area, available pervious area, and BMP amendment area.
T-1 Checklist Infiltration Tools v. 3.01 User Manual
February 28, 2013
8
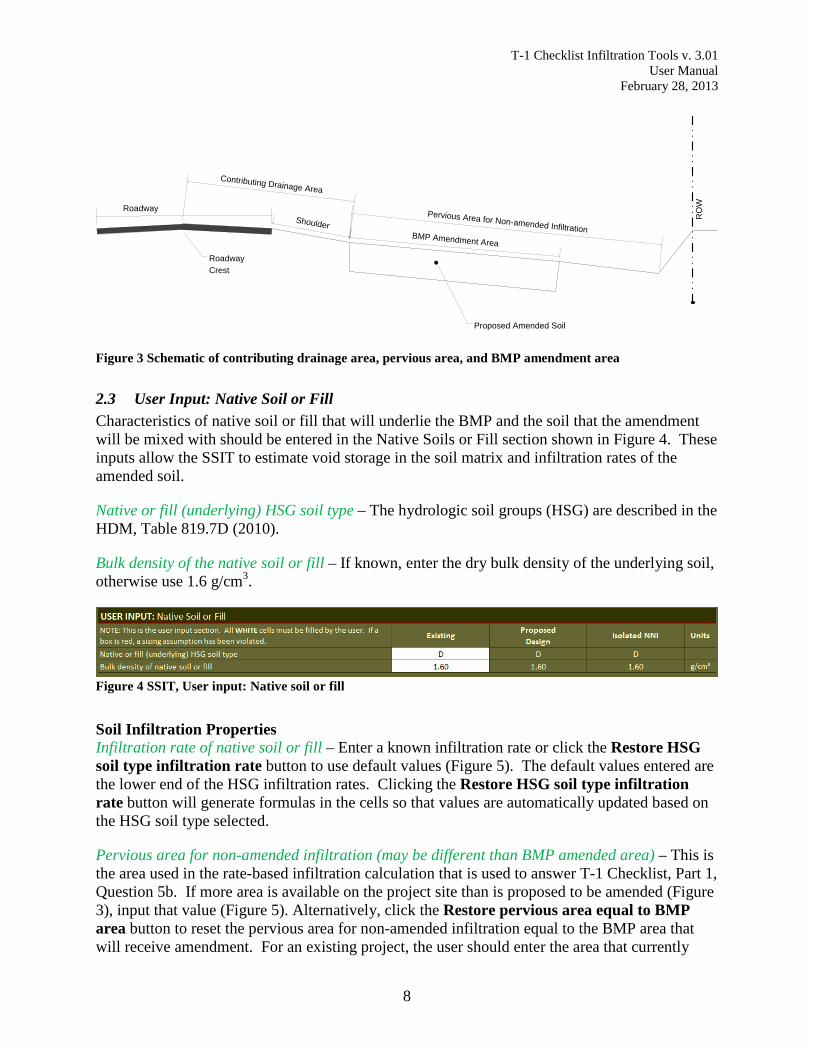
Figure 3 Schematic of contributing drainage area, pervious area, and BMP amendment area
2.3 User Input: Native Soil or Fill Characteristics of native soil or fill that will underlie the BMP and the soil that the amendment will be mixed with should be entered in the Native Soils or Fill section shown in Figure 4. These inputs allow the SSIT to estimate void storage in the soil matrix and infiltration rates of the amended soil.
Native or fill (underlying) HSG soil type – The hydrologic soil groups (HSG) are described in the HDM, Table 819.7D (2010).
Bulk density of the native soil or fill – If known, enter the dry bulk density of the underlying soil, otherwise use 1.6 g/cm3.
Figure 4 SSIT, User input: Native soil or fill Soil Infiltration Properties Infiltration rate of native soil or fill – Enter a known infiltration rate or click the Restore HSG soil type infiltration rate button to use default values (Figure 5). The default values entered are the lower end of the HSG infiltration rates. Clicking the Restore HSG soil type infiltration rate button will generate formulas in the cells so that values are automatically updated based on the HSG soil type selected.
Pervious area for non-amended infiltration (may be different than BMP amended area) – This is the area used in the rate-based infiltration calculation that is used to answer T-1 Checklist, Part 1, Question 5b. If more area is available on the project site than is proposed to be amended (Figure 3), input that value (Figure 5). Alternatively, click the Restore pervious area equal to BMP area button to reset the pervious area for non-amended infiltration equal to the BMP area that will receive amendment. For an existing project, the user should enter the area that currently
RoadwayShoulder
BMP Amendment Area
Pervious Area for Non-amended Infiltration
Contributing Drainage Area
Roadway Crest
Proposed Amended Soil
RO
W

T-1 Checklist Infiltration Tools v. 3.01 User Manual
February 28, 2013
9
receives runoff from impervious surfaces. Be aware that any existing curb and gutter often route water directly to pipes or lined channels. In this case, pervious areas are bypassed so the user should enter 0.
Figure 5 SSIT, Soil infiltration properties (user input or auto-fill)
2.4 User Input: Amended Soil There are six user inputs in this section (Figure 6). The first two inputs quantify the amendment properties. The third and fourth inputs allow the user to specify the amount of amendment and the uncompacted depth of the mixture. The fifth input is used with the native soil infiltration rate to determine the amended soil infiltration rate. The sixth input can be determined by compaction testing, or can be estimated by the existing calculation using the default void ratio. Figure 7 shows the construction phases and terminology of amendment incorporation. To use the default amendment properties, click the Select and use default amendment properties button, then select the amendment type. After selecting the amendment type, verify that the properties displayed are representative of the amendment type and usage for the project.
Bulk density of amendment – This is the bulk density of the dry amendment. The SSIT default value for compost is 0.5 g/cm3. The default value can be changed in the Default Values worksheet.
Specific gravity of amendment particles – This is the density of the amendment particles divided by the density of water. The SSIT default value for compost is 0.8.
Depth of incorporation – This is the depth of soil and compost mixture before compaction. The Caltrans compost specification recommends 12 to 18 inches. To achieve a maximum volume infiltrated, the default value is set to a depth of 18 inches.
Depth of amendment placement – This is the depth at which the amendment will be placed on top of the soil before it is incorporated into the soil. The Caltrans compost specification recommends 4 inches of amendment. The default value is set to 4 inches.
Infiltration rate of amendment – This is the infiltration rate of the amendment, given as a linear rate of inches per hour. This will be used to compute the amended soil infiltration rate based on a volume–weighted average of the infiltration rates of the soil and the amendment.
Final bulk density – If the final dry bulk density of the amended soil is known (compost incorporated with native soil or fill), then overwrite the existing calculation with the known

T-1 Checklist Infiltration Tools v. 3.01 User Manual
February 28, 2013
10
value. The designer should keep this value below the bulk density value that restricts root penetration or aeration, which is 1.8 g/cm3 for sands and 1.4 g/cm3 for clays (Arshad et al. 1996). Since the SSIT assumes a final porosity of 0.35, the resulting bulk density values are usually below these thresholds unless very little compost is used.
Final depth with compaction – This is the calculated depth of the compost and soil mixture based on the “Final bulk density value”.
Figure 6 SSIT, User input: Amended soil (user input or auto-fill)
Shoulder
Amended and Native Soil or Fill
Final Grade (Before placement
of amendment)
Temporary Grade (Before incorporation and compaction)
Final Grade After Compaction (Allow for uplift from root growth and thatch layer)
Amendment
Strip Profile Changes with Construction Phases
Existing Proposed Design
(before amendment) (initial placement) (after incorporation)
Proposed Final Grade
Native Soil or Fill
Depth ofIncorporation
Depth of Placement
Figure 7 Schematic of strip profile changes with construction phases

T-1 Checklist Infiltration Tools v. 3.01 User Manual
February 28, 2013
11
2.5 Results: Native Soil or Fill (rate-based calculation) This section displays results based on the assumption that infiltration is limited by the rate at which water can infiltrate into the native soil or fill. Infiltration results (Figure 8) for the native soil or fill include the estimated runoff coefficient for downstream BMPs, the runoff volume from the CDA, the total volume of runoff infiltrated, the percentage of the total runoff volume infiltrated, and the percentage of WQV from the net new impervious area (including additional impervious area seeking treatment credit) that is infiltrated with native soil or fill. The result for the T-1 Checklist, Part 1, Question 5b is shown in yellow. If the results display “N/A,” there is no net new impervious area and no additional impervious area seeking treatment credit. This results in no WQV. The T-1 Checklist, Part 1, Question 5d applies only to projects with a WQV.
The WQF is the rate-based flow equivalent to the WQV such that the amount of water treated by a WQV capture device is also treated by a WQF device over the historic hydrologic record. The equivalent percentage of the WQV that can infiltrate may exceed 100%, but the calculation is limited by the total runoff volume generated by the impervious area. Consider a scenario in which there are 4 existing lanes and 1 lane is being added. Only one-fifth of the impervious area is NNI area, which is used to calculate the WQV. So, if the designer was to install a flow-through BMP (e.g., non-amended strip) that could infiltrate all of that WQF, it would infiltrate 500% of the WQF and equivalent WQV. The SSIT will cap the result at 500% although the BMP may have a higher capacity. Since only 500% of the WQF from the net new impervious surface will reach the BMP, the designer can only get credit for 500%.
Figure 8 SSIT, Results: Native soil or fill (answers T-1 Checklist, Part 1, Question 5b)
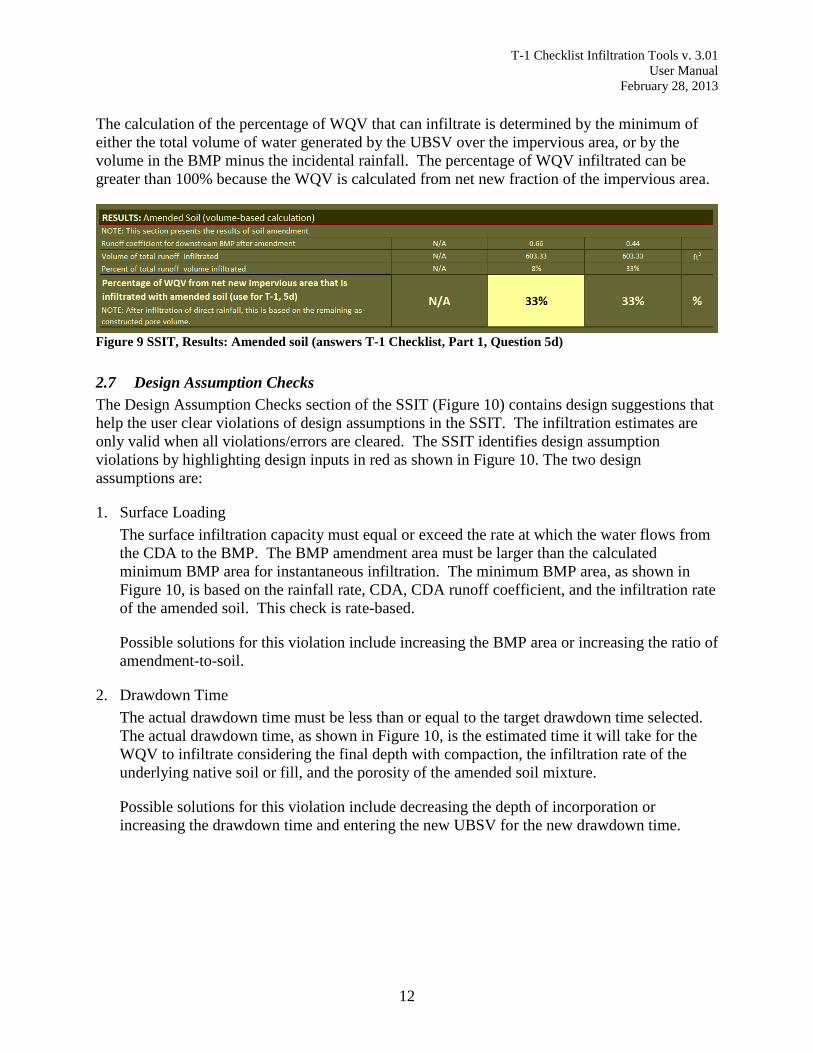
2.6 Results: Amended Soil (volume-based calculation) This section provides results based on the assumption that infiltration is limited by the available pore space (e.g., volume) in the amended soil.
Infiltration results for amended soil (Figure 9), include the estimated runoff coefficient for downstream BMPs, the total volume of runoff infiltrated, the percentage of the total runoff volume infiltrated, and the percentage of WQV from the net new impervious area that is infiltrated.
The result for the T-1 Checklist, Part 1, Question 5d is shown in yellow. If the results display “N/A,” there is no net new impervious area and no additional impervious area seeking treatment credit. This results in no WQV. The T-1 Checklist, Part 1, Question 5d applies only to projects with a WQV.
T-1 Checklist Infiltration Tools v. 3.01 User Manual
February 28, 2013
12
The calculation of the percentage of WQV that can infiltrate is determined by the minimum of either the total volume of water generated by the UBSV over the impervious area, or by the volume in the BMP minus the incidental rainfall. The percentage of WQV infiltrated can be greater than 100% because the WQV is calculated from net new fraction of the impervious area.
Figure 9 SSIT, Results: Amended soil (answers T-1 Checklist, Part 1, Question 5d)
2.7 Design Assumption Checks The Design Assumption Checks section of the SSIT (Figure 10) contains design suggestions that help the user clear violations of design assumptions in the SSIT. The infiltration estimates are only valid when all violations/errors are cleared. The SSIT identifies design assumption violations by highlighting design inputs in red as shown in Figure 10. The two design assumptions are:
1. Surface Loading The surface infiltration capacity must equal or exceed the rate at which the water flows from the CDA to the BMP. The BMP amendment area must be larger than the calculated minimum BMP area for instantaneous infiltration. The minimum BMP area, as shown in Figure 10, is based on the rainfall rate, CDA, CDA runoff coefficient, and the infiltration rate of the amended soil. This check is rate-based.
Possible solutions for this violation include increasing the BMP area or increasing the ratio of amendment-to-soil.
2. Drawdown Time The actual drawdown time must be less than or equal to the target drawdown time selected. The actual drawdown time, as shown in Figure 10, is the estimated time it will take for the WQV to infiltrate considering the final depth with compaction, the infiltration rate of the underlying native soil or fill, and the porosity of the amended soil mixture.
Possible solutions for this violation include decreasing the depth of incorporation or increasing the drawdown time and entering the new UBSV for the new drawdown time.

T-1 Checklist Infiltration Tools v. 3.01 User Manual
February 28, 2013
13
Figure 10 SSIT, Design assumption checks showing violations
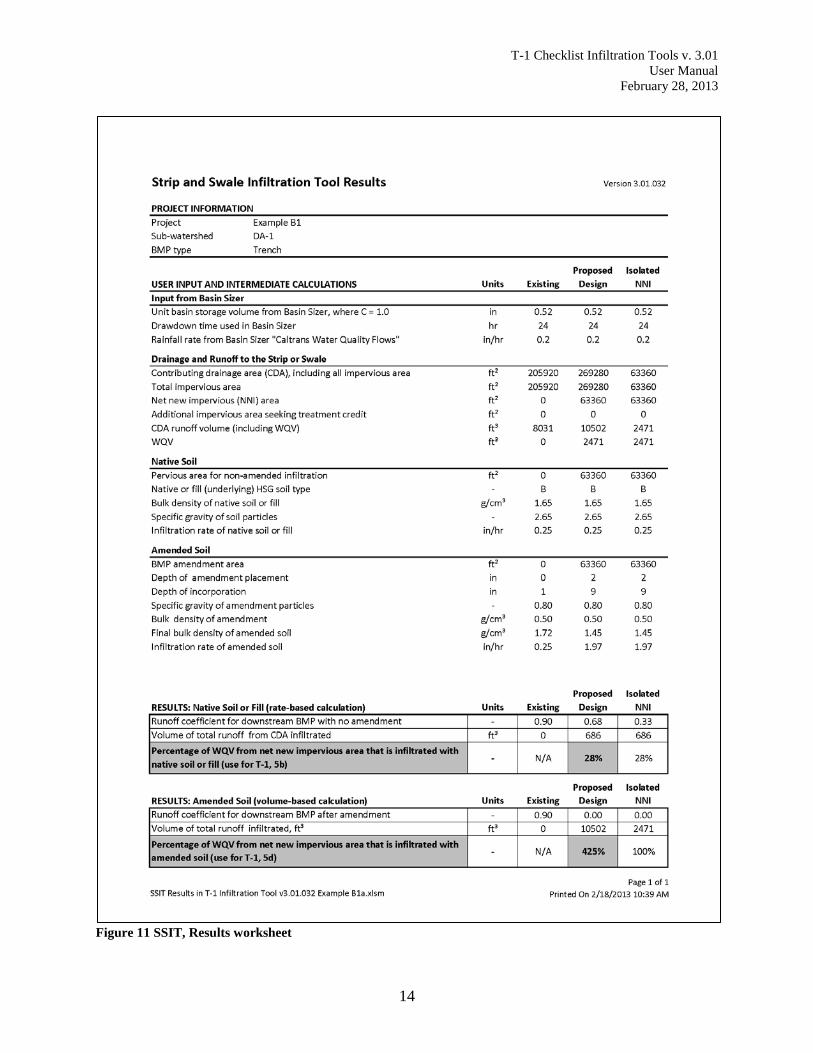
2.8 SSIT Results Worksheet The user selects the SSIT Results worksheet to obtain the final results in a ready-to-print format (Figure 11). The SSIT Results worksheet includes user inputs for reference and results for infiltration with and without amendment. The final step is for the user to review the SSIT Input worksheet for cells highlighted in red, which indicate that a sizing assumption for amended soil calculations was violated and needs to be fixed (see Section 2.7).
T-1 Checklist Infiltration Tools v. 3.01 User Manual
February 28, 2013
14
Figure 11 SSIT, Results worksheet

T-1 Checklist Infiltration Tools v. 3.01 User Manual
February 28, 2013
15
3 Basin Infiltration Tool (BIT) The BIT was designed to estimate the percentage of WQV infiltrated for detention basins and infiltration basins. The Tool has the capability to estimate infiltration where the basin is downstream of other BMPs such as biofiltration strips or swales or infiltration trenches. It answers T-1 Checklist, Part 1, Questions 7b and 7c.
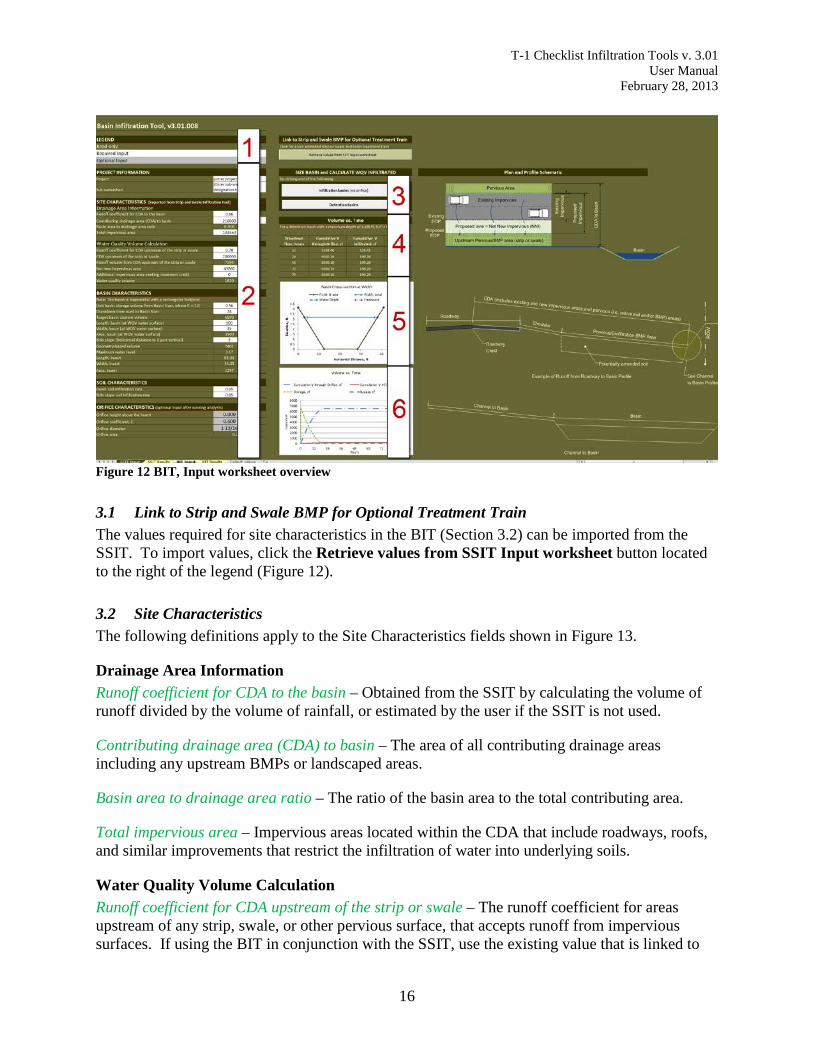
To use the BIT, the user must have site characteristic information such as UBSV, drawdown time, soil type, drainage area, and runoff coefficients. Infiltration is estimated based on the inundated soil surfaces throughout the period of basin drawdown. For detention basins, the BIT sizes the orifice drain to accomplish target drawdown while accounting for infiltration. Results are summarized on a separate, ready-to-print BIT Results worksheet. The results can be used to answer T-1 Checklist, Part 1, Questions 7b and 7c. After opening the Infiltration Tools workbook, select the BIT Input worksheet (Figure 12). The worksheet contains the following sections:
1. Legend (defines Tool color designations) 2. User Input sections 3. Size Basin and Calculate WQV Infiltrated buttons 4. Volume vs. Time table (Results) 5. Basin Cross-section at Width graph 6. Volume vs. Time graph
T-1 Checklist Infiltration Tools v. 3.01 User Manual
February 28, 2013
16
Figure 12 BIT, Input worksheet overview
3.1 Link to Strip and Swale BMP for Optional Treatment Train The values required for site characteristics in the BIT (Section 3.2) can be imported from the SSIT. To import values, click the Retrieve values from SSIT Input worksheet button located to the right of the legend (Figure 12).
3.2 Site Characteristics The following definitions apply to the Site Characteristics fields shown in Figure 13.
Drainage Area Information Runoff coefficient for CDA to the basin – Obtained from the SSIT by calculating the volume of runoff divided by the volume of rainfall, or estimated by the user if the SSIT is not used.
Contributing drainage area (CDA) to basin – The area of all contributing drainage areas including any upstream BMPs or landscaped areas.
Basin area to drainage area ratio – The ratio of the basin area to the total contributing area.
Total impervious area – Impervious areas located within the CDA that include roadways, roofs, and similar improvements that restrict the infiltration of water into underlying soils.
Water Quality Volume Calculation Runoff coefficient for CDA upstream of the strip or swale – The runoff coefficient for areas upstream of any strip, swale, or other pervious surface, that accepts runoff from impervious surfaces. If using the BIT in conjunction with the SSIT, use the existing value that is linked to

T-1 Checklist Infiltration Tools v. 3.01 User Manual
February 28, 2013
17
the SSIT. If there is no strip or swale then this value should be equal to the runoff coefficient for CDA to the basin.
CDA upstream of the strip or swale – The area upstream from the edge of pavement. Typically, this is the area of the roadway including the proposed area.
Runoff volume from CDA upstream of the strip or swale – The volume of water resulting from application of the UBSV on the area upstream of the strip or swale.
Net new impervious area – The net new impervious (NNI) area is calculated in the SSIT or it can be entered here if the BIT is being used independently.
Additional impervious area seeking treatment credit – Any area in addition to the NNI area that the designer would like credit for treating. This can include NNI areas from other drainage areas within the project or treatment requirements within the CDA that are not tied to NNI area such as some TMDL retrofit requirements.
Water quality volume – The runoff volume from the NNI area resulting from a storm depth equal to the UBSV from Basin Sizer.
Figure 13 BIT, Site characteristics
3.3 Basin Characteristics The following definitions apply to the Basin Characteristics fields shown in Figure 14.
Unit basin storage volume from Basin Sizer, where C = 1.0 – Use Basin Sizer to determine the UBSV (Appendix A). A runoff coefficient of 1 must be used in Basin Sizer because all losses must be calculated in the SSIT. This will give a UBSV that is the rainfall depth over the entire area.
Drawdown time used in Basin Sizer – The drawdown time is a required input for both the Basin Sizer and Infiltration Tools. The same drawdown time must be used in each. Based on the drawdown time, Basin Sizer selects the appropriate UBSV. A BMP must be able to process the UBSV within the drawdown time to be ready for another storm. If an upstream strip or swale is used, the drawdown time here must match the SSIT.

T-1 Checklist Infiltration Tools v. 3.01 User Manual
February 28, 2013
18
Target basin capture volume – The volume of water from the UBSV that will enter the basin as a result of runoff from the CDA. This BIT calculation subtracts infiltration occurring in any upstream strip or swale, if applicable.
Length, basin; Width, basin; and Area, basin (at WQV water surface) – Enter the length and width values for the basin at the water surface (not including the freeboard). The resulting area is calculated by the Tool as the product of the length and width input values. The length must be longer than or equal to the width.
Side slope (horizontal distance to 1 part vertical) – Enter the horizontal distance proportional to one unit of vertical distance.
Geometry-based volume – The storage volume of the basin (not including the freeboard). This value is calculated by the tool based on the available area, side slope, and the target basin capture volume. It is calculated after the user clicks one of the size basin and calculate infiltration buttons as discussed in section 3.6. This value changes as the BIT generates new iterations to find the water depth of the basin required to match the target basin capture volume. When the area of the BMP is sufficient, this value will equal the target basin capture volume.
Maximum water level; Length, invert; Width, invert; and Area, invert – The Tool calculates these four values for the user. These values give the length, width, and area of the bottom of the basin.
Figure 14 BIT, Basin characteristics
3.4 Soil Characteristics Invert and side slope soil infiltration rates are entered in the Soil Characteristics section (Figure 15). Separate inputs are required for these two infiltration rates because some side slopes may have higher compaction or differing soil than their invert.
Invert soil infiltration rate – Enter the infiltration rate of the basin invert soil. This value may be different from surface soil infiltration rates measured. If a direct measurement is not available, consider using the soil information at the proposed invert depth provided via the Caltrans Water Quality Planning Tool.
Side slope soil infiltration rate – Enter the infiltration rate of the basin side slopes. Consider any change in infiltration rate due to compaction.
T-1 Checklist Infiltration Tools v. 3.01 User Manual
February 28, 2013
19
Figure 15 BIT, Soil characteristics
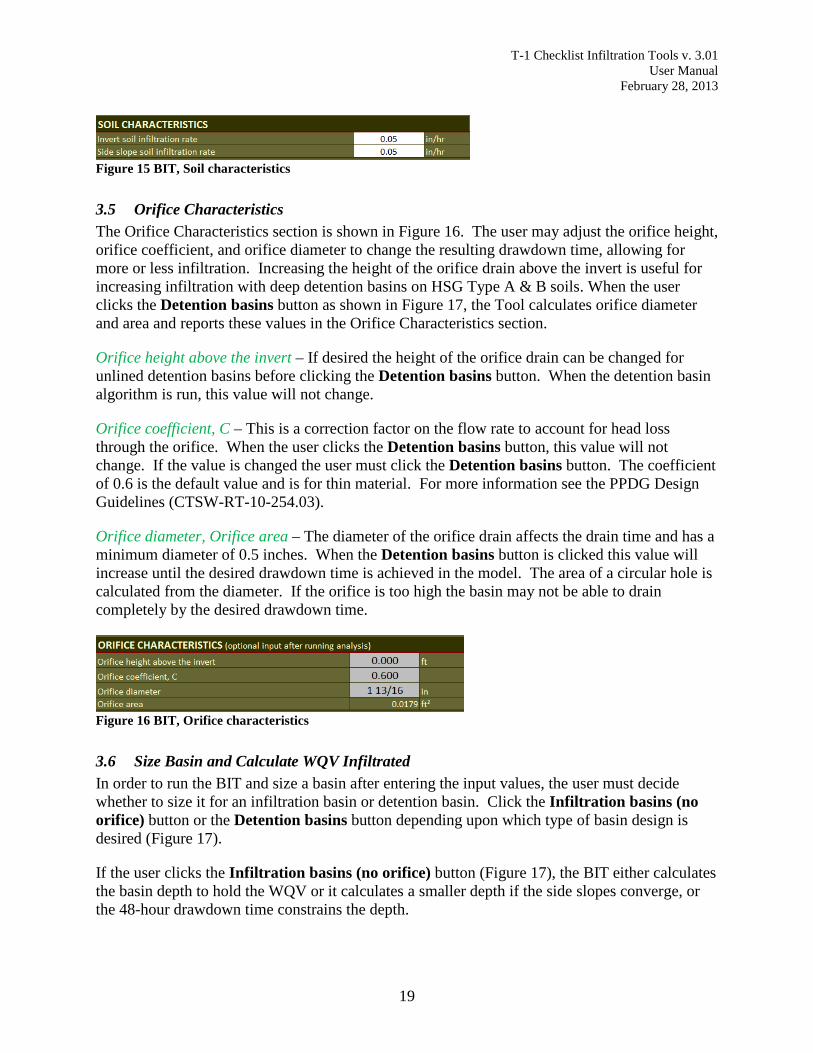
3.5 Orifice Characteristics The Orifice Characteristics section is shown in Figure 16. The user may adjust the orifice height, orifice coefficient, and orifice diameter to change the resulting drawdown time, allowing for more or less infiltration. Increasing the height of the orifice drain above the invert is useful for increasing infiltration with deep detention basins on HSG Type A & B soils. When the user clicks the Detention basins button as shown in Figure 17, the Tool calculates orifice diameter and area and reports these values in the Orifice Characteristics section.
Orifice height above the invert – If desired the height of the orifice drain can be changed for unlined detention basins before clicking the Detention basins button. When the detention basin algorithm is run, this value will not change.
Orifice coefficient, C – This is a correction factor on the flow rate to account for head loss through the orifice. When the user clicks the Detention basins button, this value will not change. If the value is changed the user must click the Detention basins button. The coefficient of 0.6 is the default value and is for thin material. For more information see the PPDG Design Guidelines (CTSW-RT-10-254.03).
Orifice diameter, Orifice area – The diameter of the orifice drain affects the drain time and has a minimum diameter of 0.5 inches. When the Detention basins button is clicked this value will increase until the desired drawdown time is achieved in the model. The area of a circular hole is calculated from the diameter. If the orifice is too high the basin may not be able to drain completely by the desired drawdown time.
Figure 16 BIT, Orifice characteristics
3.6 Size Basin and Calculate WQV Infiltrated In order to run the BIT and size a basin after entering the input values, the user must decide whether to size it for an infiltration basin or detention basin. Click the Infiltration basins (no orifice) button or the Detention basins button depending upon which type of basin design is desired (Figure 17).
If the user clicks the Infiltration basins (no orifice) button (Figure 17), the BIT either calculates the basin depth to hold the WQV or it calculates a smaller depth if the side slopes converge, or the 48-hour drawdown time constrains the depth.

T-1 Checklist Infiltration Tools v. 3.01 User Manual
February 28, 2013
20
If the user clicks the Detention basins button the BIT will size the basin to hold the WQV or until the side slopes converge, which is the maximum volume for a basin with the input dimensions. The BIT then calculates the optimum orifice diameter to meet the user-specified drawdown time.
Figure 17 BIT, Size basin and calculate WQV infiltrated
3.7 Tracking Volume vs. Time The BIT tracks volumes infiltrated, orifice-discharged, and bypasses as a function of drawdown time. Graphs of Basin Cross-section at Width and Volume vs. Time are shown in Figure 18.
Figure 18 BIT, Volume vs. time output

T-1 Checklist Infiltration Tools v. 3.01 User Manual
February 28, 2013
21
3.8 BIT Results Worksheet The user selects the BIT Results worksheet to obtain the final results in a ready-to-print format. The Basin Results worksheet (Figure 19) includes a summary of user inputs, a schematic of the basin, a graph of water volumes during the drawdown of the basin, a Water Balance table, and a Water Quality Volume Results table.
In the Water Quality Volume Results table, the “WQV Infiltrated” is the percentage of impervious area runoff that can infiltrate in the specified basin and in any upstream strips and swales relative to the WQV. When the user clicks the Infiltration basins (no orifice) button (Figure 17), the BIT provides the answer to T-1 Checklist, Part 1, Question 7b. When the user clicks the Detention basins button, the BIT provides the answer to T-1 Checklist, Part 1, Question 7c. The Water Quality Volume Results table also provides the percentage of WQV treated in the basin, which is the sum of orifice discharge volume and basin infiltration volume divided by the WQV. This does not include the percentage treated by upstream strips and swales since the SSIT does not check to see if minimum treatment design criteria from the PPDG have been met.

T-1 Checklist Infiltration Tools v. 3.01 User Manual
February 28, 2013
22
Figure 19 BIT, Results worksheet

T-1 Checklist Infiltration Tools v. 3.01 User Manual
February 28, 2013
23
4 Definitions This section contains definitions of key terms used in the SSIT and BIT.
Bulk density: The dry particle mass per total soil volume. This value must be displayed in units consistent with the density of water; typical values are shown in SI. Values for amendments can vary widely. For example, when shredded bark is used, bulk density can be as low as 0.1. For compost, values range from 0.5 for loose material to 0.9 for low void space. A value of 1.7 is typical for sand prior to compaction.
Contributing drainage area (CDA): The total area that generates runoff to the BMP. This area excludes the area of the BMP under analysis.
Density of water: The user has the choice to work in US standard or SI units. This value is only used to compute the porosity of the soil, which is dimensionless. As long as all other soil densities are entered in the same unit of measurement, the porosity will be correct. Unit weight can be used instead of density, as long as the input cells display units consistent with the density of water in the Default Values worksheet.
Depth of incorporation: The depth of amendment plus the depth of native soil or fill that will be disturbed when incorporating amendments.
Depth of placement: The depth at which the compost is placed above the finish grade (FG) before incorporation.
Drawdown time: This is the amount of time required to empty the BMP. This value is used in Basin Sizer to determine the UBSV. All BMPs must treat the WQV calculated from the UBSV within the drawdown time used in Basin Sizer. The BMP must empty by the drawdown time so that it is ready to receive runoff from a subsequent storm event as large as the UBSV.
Hydrologic Soil Group (HSG) soil type: The hydrologic soil group defined by the USDA (A, B, C, or D) corresponding to the native soil or fill.
Infiltration rate of amended soil: This is the rate (depth per time) that water enters the surface of the amended soil/compost mixture. The default calculation uses a volume-weighted infiltration rate between the native soil rate and an assumed compost rate of 8 in/hr.
Infiltration rate of native soil or fill: This rate is based on the HSG soil type selected. The provided value can be overridden in the Tool.
Loading rate: This is the normalized loading rate to the BMP based on the contributing drainage area and BMP area.
Net new impervious (NNI) area: This value is calculated by subtracting the existing impervious area from the proposed impervious area.

T-1 Checklist Infiltration Tools v. 3.01 User Manual
February 28, 2013
24
Pervious area for non-amendment infiltration: This is the area that would act as the infiltration area that infiltrates runoff from impervious surfaces. It is the total pervious area that receives flow (sheet or concentrated) from the contributing drainage area. It may be greater than the area in which the designer chooses to construct a BMP using amendments.
Rainfall rate from Basin Sizer “Caltrans Water Quality Flows”: The rainfall rate given by Basin Sizer. The rainfall rate is used to determine loading rates to the amended BMP and non-amended pervious areas.
Runoff coefficient: The ratio of runoff volume from the CDA to the rainfall volume (rain depth multiplied by CDA). This coefficient is used for both water quality volumes and flows, but not for larger flood flows.
Specific gravity of compost particles: The average density of the compost particles relative to the density of water. The default value is set at 0.8.
Specific gravity of native soil or fill: The density of soil particles relative to the density of water, usually between 2.6 and 2.75.
Unit Basin Storage Volume (UBSV): The rainfall depth given by Basin Sizer for a given rain gauge selection, drawdown time, and a runoff coefficient equal to 1.0.
Volume of total runoff infiltrated (ft3): The volume of water that infiltrates from the CDA. This calculation is made assuming that the water that falls directly on the BMP will infiltrate first and then any remaining capacity is used to infiltrate runoff from the CDA.

T-1 Checklist Infiltration Tools v. 3.01 User Manual
February 28, 2013
25
5 References Arshad, M.A., B. Lowery, and B. Grossman. 1996. Physical Tests For Monitoring Soil Quality. In Methods For Assessing Soil Quality, ed. J.W. Dorah and A.J. Jones, 133-142. Madison, WI: Soil Sci. Soc. Am. Spec. Publ. 49.
Caltrans. 2012. Project Planning and Design Guide. CTSW-RT-10-254.03 (May 2012 revision to July 2010 publication). Sacramento: Caltrans.

T-1 Checklist Infiltration Tools v. 3.01 User Manual
February 28, 2013
26
6 List of Appendices Appendix A. Using Basin Sizer for Infiltration Tools Input Appendix B. Example Problems Appendix C. Update Log

A-1
Appendix A. Using Basin Sizer for Infiltration Tools Input Basin Sizer is a software application that is used to retrieve information for sizing a stormwater basin. The program can be downloaded from: http://www.water-programs.com/BasinSizer/Basinsizer.htm.
To get the required values from Basin Sizer (Figure A.1) for use in the Infiltration Tools: 1. Click the Caltrans Methods tab. 2. Click the approximate location of the Project Site from the map on the left. 3. Select a Rainfall Station. 4. In the Water Quality Volumes section:
a. Select the appropriate Drawdown Time (hours) from the dropdown list. b. From the Runoff Coefficient dropdown list, choose 1.00. Use this value because runoff
coefficients are applied in the Tools, so applying a value in Basin Sizer would double count volume reductions.
Input the Unit Basin Storage Volume (inches) value into both the SSIT and BIT. 5. Input the rainfall rate value displayed in the Caltrans Water Quality Flows section into the
SSIT.
Figure A.1 Basin Sizer, Caltrans Methods

THIS PAGE INTENTIONALLY LEFT BLANK

B-1
Appendix B. Example Problems The following series of example problems are provided so that users who are new to the T-1 Checklist Infiltration Tools can become familiar with how different scenarios are entered in the Tools. The example problems consist of the following:
B.1 Add 1 lane to 3 existing lanes, remove existing curb, Type B soil B.2 Add 1 lane to 3 existing lanes, existing sheet flow, Type B soil B.3 Add 1 lane to 3 existing lanes, existing sheet flow, Type B soil in an arid region using
non-compost amendment B.4 Clearing error on drawdown time and BMP area, Type C soil B.5 Limited space, compare compost and coarse sand amendments, Type B soil B.6 Limited space sand amendment without incorporation, arid region, Type A soil B.7 Limited space resulting in undersized infiltration or full-size detention basins B.8 Limited space resulting in undersized infiltration and undersized detention basins B.9 Treatment train
The first example problem provides a detailed explanation of each user-entered value and the subsequent results. The remaining eight example problems show how different scenarios are addressed and their results.
B-2
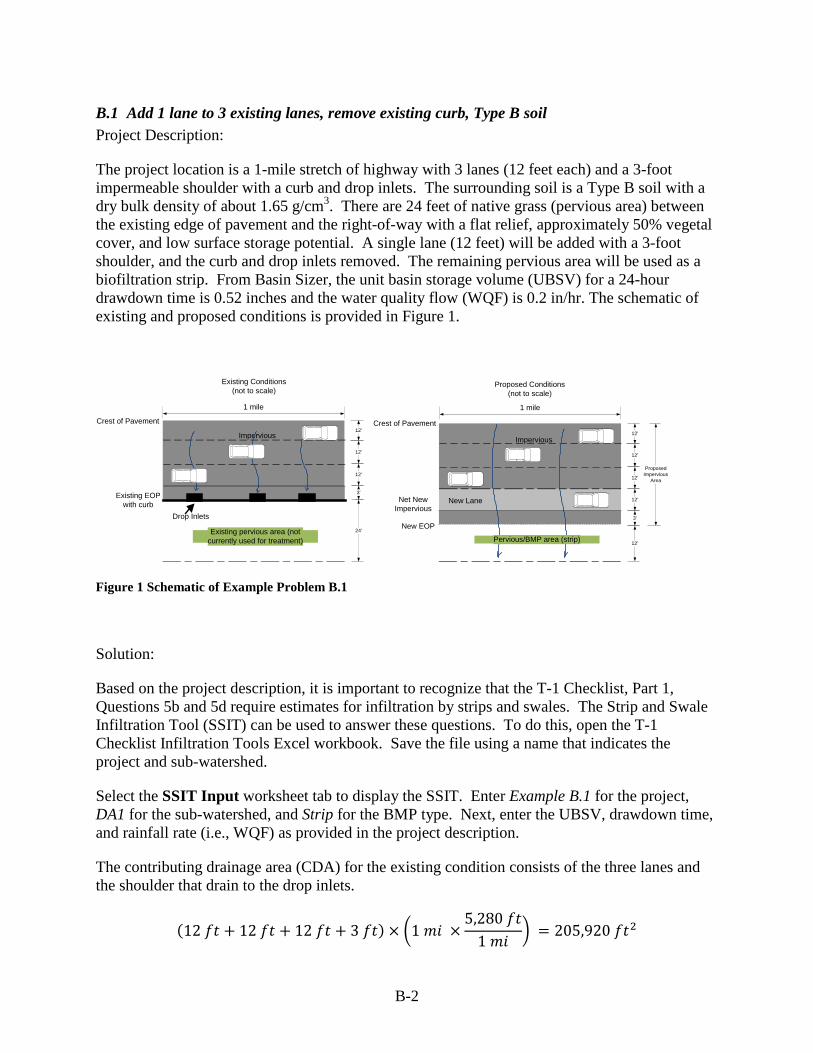
B.1 Add 1 lane to 3 existing lanes, remove existing curb, Type B soil Project Description:
The project location is a 1-mile stretch of highway with 3 lanes (12 feet each) and a 3-foot impermeable shoulder with a curb and drop inlets. The surrounding soil is a Type B soil with a dry bulk density of about 1.65 g/cm3. There are 24 feet of native grass (pervious area) between the existing edge of pavement and the right-of-way with a flat relief, approximately 50% vegetal cover, and low surface storage potential. A single lane (12 feet) will be added with a 3-foot shoulder, and the curb and drop inlets removed. The remaining pervious area will be used as a biofiltration strip. From Basin Sizer, the unit basin storage volume (UBSV) for a 24-hour drawdown time is 0.52 inches and the water quality flow (WQF) is 0.2 in/hr. The schematic of existing and proposed conditions is provided in Figure 1.
Figure 1 Schematic of Example Problem B.1
Solution:
Based on the project description, it is important to recognize that the T-1 Checklist, Part 1, Questions 5b and 5d require estimates for infiltration by strips and swales. The Strip and Swale Infiltration Tool (SSIT) can be used to answer these questions. To do this, open the T-1 Checklist Infiltration Tools Excel workbook. Save the file using a name that indicates the project and sub-watershed.
Select the SSIT Input worksheet tab to display the SSIT. Enter Example B.1 for the project, DA1 for the sub-watershed, and Strip for the BMP type. Next, enter the UBSV, drawdown time, and rainfall rate (i.e., WQF) as provided in the project description.
The contributing drainage area (CDA) for the existing condition consists of the three lanes and the shoulder that drain to the drop inlets.
(12 𝑓𝑡 + 12 𝑓𝑡 + 12 𝑓𝑡 + 3 𝑓𝑡) × �1 𝑚𝑖 ×5,280 𝑓𝑡
1 𝑚𝑖� = 205,920 𝑓𝑡2
Existing Conditions(not to scale)
1 mile
Crest of Pavement
3'
24'
Proposed Conditions(not to scale)
New EOP
1 mile
12'
12'
3'
12'
Impervious
12'
New LaneNet New Impervious
ProposedImpervious
Area
Crest of Pavement
Pervious/BMP area (strip)
12'
12'
Impervious
12'
Existing pervious area (not currently used for treatment)
12'Existing EOP with curb
Drop Inlets
B-3
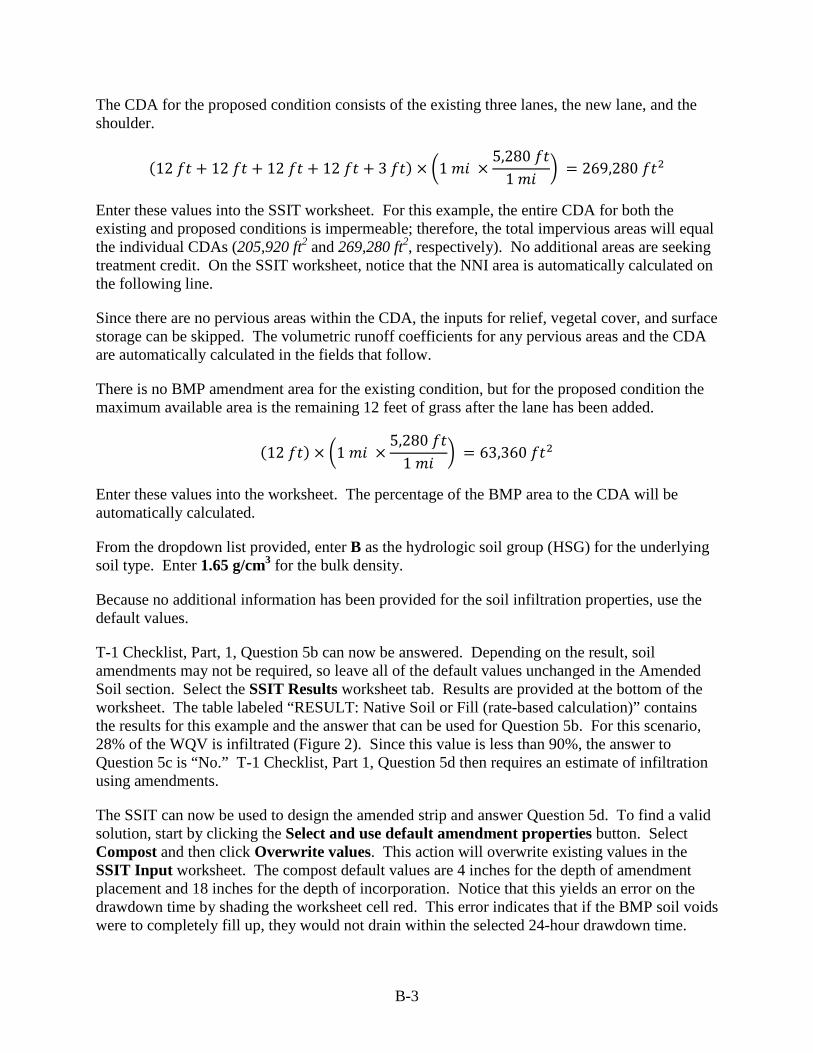
The CDA for the proposed condition consists of the existing three lanes, the new lane, and the shoulder.
(12 𝑓𝑡 + 12 𝑓𝑡 + 12 𝑓𝑡 + 12 𝑓𝑡 + 3 𝑓𝑡) × �1 𝑚𝑖 ×5,280 𝑓𝑡
1 𝑚𝑖� = 269,280 𝑓𝑡2
Enter these values into the SSIT worksheet. For this example, the entire CDA for both the existing and proposed conditions is impermeable; therefore, the total impervious areas will equal the individual CDAs (205,920 ft2 and 269,280 ft2, respectively). No additional areas are seeking treatment credit. On the SSIT worksheet, notice that the NNI area is automatically calculated on the following line.
Since there are no pervious areas within the CDA, the inputs for relief, vegetal cover, and surface storage can be skipped. The volumetric runoff coefficients for any pervious areas and the CDA are automatically calculated in the fields that follow.
There is no BMP amendment area for the existing condition, but for the proposed condition the maximum available area is the remaining 12 feet of grass after the lane has been added.
(12 𝑓𝑡) × �1 𝑚𝑖 ×5,280 𝑓𝑡
1 𝑚𝑖� = 63,360 𝑓𝑡2
Enter these values into the worksheet. The percentage of the BMP area to the CDA will be automatically calculated.
From the dropdown list provided, enter B as the hydrologic soil group (HSG) for the underlying soil type. Enter 1.65 g/cm3 for the bulk density.
Because no additional information has been provided for the soil infiltration properties, use the default values.
T-1 Checklist, Part, 1, Question 5b can now be answered. Depending on the result, soil amendments may not be required, so leave all of the default values unchanged in the Amended Soil section. Select the SSIT Results worksheet tab. Results are provided at the bottom of the worksheet. The table labeled “RESULT: Native Soil or Fill (rate-based calculation)” contains the results for this example and the answer that can be used for Question 5b. For this scenario, 28% of the WQV is infiltrated (Figure 2). Since this value is less than 90%, the answer to Question 5c is “No.” T-1 Checklist, Part 1, Question 5d then requires an estimate of infiltration using amendments.
The SSIT can now be used to design the amended strip and answer Question 5d. To find a valid solution, start by clicking the Select and use default amendment properties button. Select Compost and then click Overwrite values. This action will overwrite existing values in the SSIT Input worksheet. The compost default values are 4 inches for the depth of amendment placement and 18 inches for the depth of incorporation. Notice that this yields an error on the drawdown time by shading the worksheet cell red. This error indicates that if the BMP soil voids were to completely fill up, they would not drain within the selected 24-hour drawdown time.

B-4
There is no error on the BMP area because the ratio of 4 inches of compost in 18 inches of incorporation (22% compost) provides sufficient surface infiltration capacity.
Option A:
One possible solution is to use a longer drawdown time, but that will require using the Basin Sizer to get the associated UBSV, which will be larger. An alternate solution is to decrease the depth of the amended soil. This may seem counter-intuitive because decreasing the depth of amended soil will decrease the total pore void volume. However, the drawdown time error that is being addressed is based on the total available BMP pore void volume, not the volume that would be filled by the design storm runoff. For this example, change the depth of amendment placement to 2 inches and the depth of incorporation to 9 inches. This change keeps the same soil mixture (22% compost) and removes the error, which means the BMP soil voids will completely drain within the drawdown time. The last table in the SSIT Results worksheet labeled “RESULT: Amended soil (volume-based calculation)” contains the results and the answer that can be used to answer T-1 Checklist, Part 1, Question 5d. For this design, the percentage of WQV infiltrated is 425% (Figure 2). Since this value is greater than 90%, the answer to Question 5e is “Yes”, and the T-1 Checklist then skips to Question 13.
It is important to recognize that the SSIT was developed to quantify the amount of the WQV infiltrated and to provide answers for T-1 Checklist, Part 1, Questions 5b and 5d. While it is the designer’s responsibility to decide if the depth of incorporation should be deeper than what the SSIT allows, only the error-free results of the SSIT should be used to answer Questions 5b and 5d. However, using a depth of incorporation that is deeper than what the SSIT allows must be compensated for by proportionately increasing the amount of compost that is required to achieve error-free SSIT results. For this example, if 18 inches of incorporation was used in the design instead of 9 inches, the depth of amendment used in the design should increase proportionately from 2 inches to 4 inches. This depth of amendment will match the amendment-to-soil ratio that results in an error-free SSIT result (22% compost, for this example). Remember that the deeper, as-designed depth of incorporation should not be input into the SSIT and the error-free SSIT results should be used to answer Questions 5b and 5d.
Option B:
The initial solution described previously in this section is over-designed because it can infiltrate 4.5 times the WQV. This strip design can be optimized to reduce the BMP size and cost because the PPDG only requires 90% infiltration of the WQV to avoid comparison to other BMP options (see T-1 Checklist, Part 1, Question 5e). Reduce the BMP amendment area from 63,360 sq ft to 33,347 sq ft. Remember to overwrite the value for the pervious area for non-amended infiltrations so that it is 63,360 sq ft. Leaving the depth of amendment at 2 inches, start adjusting the depth of incorporation to reduce the percent infiltrated while keeping it greater than 90%. Notice that with a depth of incorporation of 4 inches (50% compost) the design results in 93% infiltration of the WQV. This design will reduce construction costs while maintaining infiltration greater than 90%. Figure 3 shows the results for this new optimized design.
Notice that the answer to Question 5b remains the same for both the initial and optimized amendment designs. Also note that for the reduced area in the optimized design, if the final

B-5
design uses the 18 inch depth of incorporation from the compost specification, then the depth of amendment must be increased from 4 inches to 9 inches to maintain the 50% compost ratio.

B-6
Figure 2 Initial design results for Example Problem B.1, Option A

B-7
Figure 3 Optimized design results for Example Problem B.1, Option B

B-8
B.2 Add 1 lane to 3 existing lanes, existing sheet flow, Type B soil Project Description:
The project location is a 1-mile stretch of highway with 3 lanes (12 feet each) and a 3-foot impermeable shoulder. The surrounding soil is a Type B soil with a dry bulk density of about 1.65g/cm3. There are 24 feet of native grass (pervious area) between the existing edge of pavement and the right-of-way with a flat relief, approximately 50% vegetal cover, and low surface storage potential. A single lane (12 feet) will be added with a 3-foot shoulder, and the remaining pervious area will be used as a biofiltration strip. From Basin Sizer, the unit basin storage volume (UBSV) for a 24-hour drawdown time is 0.52 inches and the water quality flow (WQF) is 0.2 in/hr. The schematic of existing and proposed conditions is provided in Figure 4.
Figure 4 Schematic of Example Problem B.2
Solution:
Example Problem B.2 is the same as B.1 except that for the existing condition the runoff crosses the 24-foot wide pervious area.
(24 𝑓𝑡) × �1 𝑚𝑖 ×5,280 𝑓𝑡
1 𝑚𝑖� = 126,720 𝑓𝑡2
Enter this value in Pervious area for non-amended infiltration for the existing condition. This value allows the SSIT to estimate existing infiltration. Complete the remainder of the example as described for B.1, Option A. Results are shown in Figure 5.
Existing Conditions(not to scale)
Existing EOP
1 mile
Crest of Pavement
3'
24'
Proposed Conditions(not to scale)
New EOP
1 mile
12'
12'
3'
12'
Impervious
12'
New LaneNet New Impervious
ProposedImpervious
Area
Crest of Pavement
Pervious/BMP area (strip)
12'
12'
Impervious
12'
Existing pervious area
12'

B-9
Figure 5 Design results for Example Problem B.2

B-10
B.3 Add 1 lane to 3 existing lanes, existing sheet flow, Type B soil Project Description:
The project is in an arid region that does not support dense vegetation. The existing condition is a 1-mile stretch of highway with 3 lanes (12 feet each) and a 3-foot impermeable shoulder. The surrounding soil is a Type B soil with a dry bulk density of about 103 lb/ft3. There are 24 feet of bare soil between the existing edge of pavement and the right-of-way with a flat relief, no effective vegetal cover, and low surface storage potential. A single lane (12 feet) will be added with a 3-foot shoulder. From Basin Sizer, the unit basin storage volume (UBSV) for a 24-hour drawdown time is 0.52 inches and the water quality flow (WQF) is 0.2 in/hr. The schematic of existing and proposed conditions is provided in Figure 6. Compare sand and alternative media infiltration trenches (Options A & B). Also consider treating existing pavement runoff in lieu of new pavement runoff (Option C).
Figure 6 Schematic of Example Problem B.3
Solution:
The existing impervious area is
(39 𝑓𝑡) × �1 𝑚𝑖 ×5,280 𝑓𝑡
1 𝑚𝑖� = 205,920𝑓𝑡2
The proposed design impervious area is
(51 𝑓𝑡) × �1 𝑚𝑖 ×5,280 𝑓𝑡
1 𝑚𝑖� = 269,280 𝑓𝑡2
The WQV is
0.9 �0.52 𝑖𝑛 1𝑓𝑡
12 𝑖𝑛� (12 𝑓𝑡 × 5280 𝑓𝑡) = 2741𝑓𝑡3
Existing Conditions(not to scale)
Existing EOP
1 mile
3'
24'
Proposed Conditions(not to scale)
New EOP
1 mile
12'
12'
3'
12'
Impervious
12'
New LaneNet New Impervious
ProposedImpervious
Area
Crest of Pavement
Pervious/BMP area (strip)
12'
12'
Impervious
12'
Existing impervious area
12'

B-11
Option A:
The trench will be filled with sand. When initially placed the sand has a bulk density of 106 lb/ft3. Since the units are in lb/ft3, first make the adjustment so that the Tool will calculate in lb/ft3. Select the Default Values worksheet and change the density of water to 62.4 lb/ft3. Next, select the SSIT Input worksheet and notice that all of the bulk densities are in the units of lb/ft3. Click the Select and use default amendment properties button. Select Sand and click Overwrite values. Note that the depth of amendment placement and the depth of incorporation should be equal since the trench will be filled with sand and will not be mixed with the subsoil. If possible, verify that the material properties of the amendment given in the Tool are representative of amendments that will be used for this project. Since no specific information about the amendment is given in this example problem, use the default sand properties.
The BMP amendment area need not use all of the available pervious area. For this example, use a 2-foot wide trench along the entire project length. Calculate the BMP area.
(2 𝑓𝑡) × �1 𝑚𝑖 ×5,280 𝑓𝑡
1 𝑚𝑖� = 10,560 𝑓𝑡2
Since the pervious area for non-amended infiltration is greater than the BMP area, calculate the pervious area and enter it in the SSIT Input worksheet. This will overwrite the formula that sets the pervious area for non-amended infiltration equal to the BMP amendment area.
(12 𝑓𝑡) × �1 𝑚𝑖 ×5,280 𝑓𝑡
1 𝑚𝑖� = 63,360 𝑓𝑡2
Select the SSIT Results worksheet (Figure 8). The results show that 105% of the WQV is infiltrated for the volume-based amended soil results, which is about four times as much water as the rate-based result.
Option B:
The trench will be filled with high void ratio modular plastic drainage cells consisting of approximately 15% solids and 85% voids by volume. This scenario will require less excavation for the same level of infiltration. The approach for this option is to maximize depth and calculate the width required to capture 100% of the WQV. The bulk density, specific gravity, and void ratio will not change during construction since this media will not compact like soil does. The media is available in stackable sheets that are 1-inch thick, so precise depths can be achieved. Enter the inputs similar to the steps described in Option A. Click the Select and use default amendment properties button. Select High void space modular drainage cells and click Overwrite values.
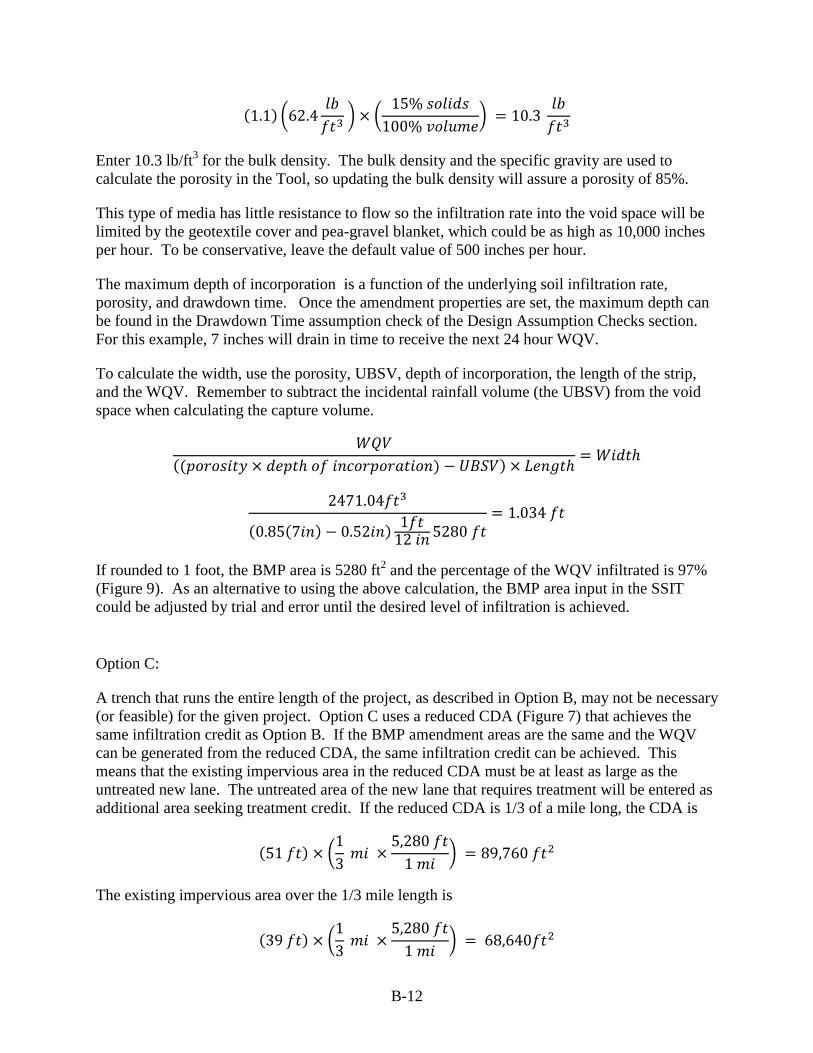
Verify the material properties of the amendment. Since the SSIT assumes larger drainage cells with a bulk density of 3.43 lb/ft3 and a porosity of 95%, the bulk density for these stackable sheets must be updated to correspond to a porosity of 85%. The specific gravity of the plastic is about 1.1 and the porosity is 85% porosity, which results in a bulk density of about 10.3 lb/ft3.
B-12
(1.1) �62.4𝑙𝑏𝑓𝑡3
� × �15% 𝑠𝑜𝑙𝑖𝑑𝑠
100% 𝑣𝑜𝑙𝑢𝑚𝑒� = 10.3
𝑙𝑏𝑓𝑡3
Enter 10.3 lb/ft3 for the bulk density. The bulk density and the specific gravity are used to calculate the porosity in the Tool, so updating the bulk density will assure a porosity of 85%.
This type of media has little resistance to flow so the infiltration rate into the void space will be limited by the geotextile cover and pea-gravel blanket, which could be as high as 10,000 inches per hour. To be conservative, leave the default value of 500 inches per hour.
The maximum depth of incorporation is a function of the underlying soil infiltration rate, porosity, and drawdown time. Once the amendment properties are set, the maximum depth can be found in the Drawdown Time assumption check of the Design Assumption Checks section. For this example, 7 inches will drain in time to receive the next 24 hour WQV.
To calculate the width, use the porosity, UBSV, depth of incorporation, the length of the strip, and the WQV. Remember to subtract the incidental rainfall volume (the UBSV) from the void space when calculating the capture volume.
𝑊𝑄𝑉((𝑝𝑜𝑟𝑜𝑠𝑖𝑡𝑦 × 𝑑𝑒𝑝𝑡ℎ 𝑜𝑓 𝑖𝑛𝑐𝑜𝑟𝑝𝑜𝑟𝑎𝑡𝑖𝑜𝑛) − 𝑈𝐵𝑆𝑉) × 𝐿𝑒𝑛𝑔𝑡ℎ
= 𝑊𝑖𝑑𝑡ℎ
2471.04𝑓𝑡3
(0.85(7𝑖𝑛) − 0.52𝑖𝑛) 1𝑓𝑡12 𝑖𝑛 5280 𝑓𝑡
= 1.034 𝑓𝑡
If rounded to 1 foot, the BMP area is 5280 ft2 and the percentage of the WQV infiltrated is 97% (Figure 9). As an alternative to using the above calculation, the BMP area input in the SSIT could be adjusted by trial and error until the desired level of infiltration is achieved.
Option C:
A trench that runs the entire length of the project, as described in Option B, may not be necessary (or feasible) for the given project. Option C uses a reduced CDA (Figure 7) that achieves the same infiltration credit as Option B. If the BMP amendment areas are the same and the WQV can be generated from the reduced CDA, the same infiltration credit can be achieved. This means that the existing impervious area in the reduced CDA must be at least as large as the untreated new lane. The untreated area of the new lane that requires treatment will be entered as additional area seeking treatment credit. If the reduced CDA is 1/3 of a mile long, the CDA is
(51 𝑓𝑡) × �13
𝑚𝑖 ×5,280 𝑓𝑡
1 𝑚𝑖� = 89,760 𝑓𝑡2
The existing impervious area over the 1/3 mile length is
(39 𝑓𝑡) × �13
𝑚𝑖 ×5,280 𝑓𝑡
1 𝑚𝑖� = 68,640𝑓𝑡2

B-13
There is still 2/3 of a mile of the new lane that requires treatment, so the additional area seeking treatment credit is
(12 𝑓𝑡) × �23
𝑚𝑖 ×5,280 𝑓𝑡
1 𝑚𝑖� = 42,240𝑓𝑡2
This area is less than the existing impervious area within the reduced CDA, so the WQV can be generated from the reduced CDA.
The BMP amendment area in Option B can be achieved by making the strip 3 feet wide. Since the WQV can be generated from the reduced CDA, a level of infiltration similar to the level in Option B is achieved with the same BMP amendment area (Figure 10).
Figure 7 Schematic of Example Problem B.3 Option C
Proposed Conditions(not to scale)
New EOP
1 mile
12'
12'
3'
12'
Impervious
12'
Net New Impervious
ProposedImpervious
Area
Crest of Pavement
Pervious Area
12'Additional Area Seeking
Treatment
Reduced CDA Untreated Area
New Lane

B-14
Figure 8 Design results for Example Problem B.3, Option A

B-15
Figure 9 Design results for Example Problem B.3, Option B

B-16
Figure 10 Design results for Example Problem B.3, Option C

B-17
B.4 Clearing error on drawdown time and BMP area, Type C soil Project Description:
The project location is a 1-mile stretch of highway with 2 lanes (12 feet each) and a 3-foot impermeable shoulder. The surrounding soil is a Type C soil with a dry bulk density of about 1.6 g/cm3. There are 28 feet of native grass (pervious area) between the existing edge of pavement and the right-of-way with a flat relief, approximately 50% vegetal cover, and low surface storage potential. Two lanes (12 feet each) will be added with a 3-foot shoulder, and the remaining pervious area will be used as a biofiltration strip. From Basin Sizer, the unit basin storage volume (UBSV) for a 24-hour drawdown time is 0.52 inches and the water quality flow (WQF) is 0.2 in/hr. The schematic of existing and proposed conditions is provided in Figure 11.
Existing Conditions(not to scale)
Existing EOP
Impervious
1 mile
Crest of Pavement
Existing pervious area (no soil-amended BMP)
12'
12'
3'
28'
Proposed Conditions(not to scale)
New EOP
Impervious
1 mile
Crest of Pavement12'
12'
3'
4'
12'New LaneNet New
Impervious
ProposedImpervious
Area
New Lane 12'
Pervious/BMP area (strip)
Figure 11 Schematic of Example Problem B.4
Solution:
Set the existing impervious area to
(27 𝑓𝑡) × �1 𝑚𝑖 ×5,280 𝑓𝑡
1 𝑚𝑖� = 142,560𝑓𝑡2
Set the proposed impervious area to
(51 𝑓𝑡) × �1 𝑚𝑖 ×5,280 𝑓𝑡
1 𝑚𝑖� = 269,280 𝑓𝑡2
Click the Select and use default amendment properties button. Select Compost and click Overwrite values. If possible, verify that the material properties of the amendment given in the Tool are representative of amendments that will be used for this project. Since no specific information about the amendment is given in this example problem, use the default compost properties. After setting all of the initial properties, a drawdown time error is shown in the Design Assumption Checks section of the SSIT worksheet. This means that the BMP will not drain from a saturated condition in the given drawdown time. Similar to Example Problem B.1, making the BMP shallower will capture less volume, but it will empty faster. Using a depth of

B-18
incorporation of 9 inches eliminates the drawdown time error. Alternatively, if the drawdown time is changed, the UBSV must be changed.
To save compost cost, the amount of compost applied can often be adjusted proportional to the reduced depth of incorporation. If the depth of incorporation was reduced from 18 inches to 9 inches, the depth of compost would proportionately reduce from 4 inches to 2 inches. However, using 2 inches of compost causes a surface loading error as shown in the Design Assumption Checks section of the worksheet. This means that the strip infiltration rate is less than the surface loading rate to the strip. Since the strip infiltration is estimated by the volume-weighted average of the soil infiltration rate and compost infiltration rate, surface infiltration can be improved by increasing the amount of compost. In this example, returning the compost depth to 4 inches clears the error. This helps to ensure that the runoff from the WQF will go into the amended soil and not over it. In this solution, infiltration with amendment is 88%, but there is no infiltration of the WQV without amendment (Figure 12). Increasing the BMP area would also clear the surface loading error, but the BMP area is already maximized in this example.

B-19
Figure 12 Design results for Example Problem B.4

B-20
B.5 Limited space, compare compost and coarse sand amendments, Type B soil Project Description:
The project location is a 1,000-foot by 2,000-foot existing parking lot, which drains to a 30-foot by 2,000-foot area of native grass. The vegetated area has a flat relief, is approximately 50% vegetal cover, and provides low surface storage potential. The surrounding soil is a Type B soil with a dry bulk density of about 1.5 g/cm3. Due to a TMDL requirement, the project will add a compost amendment to the vegetated area and then landscape it so that all of the parking lot runoff will be treated. From Basin Sizer, the unit basin storage volume (UBSV) for a 24-hour drawdown time is 0.52 inches and the water quality flow (WQF) is 0.2 in/hr. The schematic of existing and proposed conditions is provided in Figure 13.
Existing Conditions(not to scale)
2000'
1000'Impervious
Proposed Conditions(not to scale)
2000'
1000'Impervious
30'
Impervious
Existing pervious area 30'Pervious/BMP area (strip)
Figure 13 Schematic of Example Problem B.5
Solution:
For this example the CDA and the impervious area is the same in both the existing and the proposed cases. Set all of the areas listed above to
(1000 𝑓𝑡) × (2000 𝑓𝑡) = 2,000,000𝑓𝑡2
This is an example of a BMP retrofit project so there is no NNI area. Instead, make the “Additional impervious area seeking treatment credit” equal to the CDA to make all impervious surfaces contribute to the WQV.
Click the Select and use default amendment properties button. Select compost and click Overwrite values. Verify that the material properties of the amendment are representative of amendments that will be used for this project. Since no specific information about the amendment is given in this example problem, use the default compost properties. Using the default values of 4 inches of compost and a total depth of incorporation of 18 inches, a surface loading error is shown in the Design Assumption Checks section. This error indicates that the area is not large enough or the infiltration rate is not high enough. Since the strip area cannot be increased, the ratio of compost to soil is increased to improve the surface conductivity.

B-21
Using 15 inches of compost on 3 inches of soil (depth of incorporation remains at 18 inches) eliminates the surface loading error and results in 35% infiltration (Figure 14). A similar result could be achieved with 18 inches of amendment as sand and 18 inches of incorporation (no tilling into underlying soils), which models an infiltration trench. This option may be appropriate where climate is not conducive to vegetation.

B-22
Figure 14 Design results for Example Problem B.5

B-23
B.6 Limited space sand amendment without incorporation, arid region, Type A soil Project Description:
The project location is a 1,000-foot by 2,000-foot existing parking lot, which drains to a 20-foot by 2,000-foot area of native grass. The vegetated area has a flat relief, is approximately 50% vegetal cover, and provides low surface storage potential. The surrounding soil is a Type A soil with a dry bulk density of about 1.6 g/cm3. Due to a TMDL requirement, the project will replace the vegetated area with an infiltration trench backfilled with coarse sand to treat all of the parking lot runoff. The uncompacted stock sand has a bulk density of 1.7 g/cm3 and a specific gravity of 2.65. From Basin Sizer, the unit basin storage volume (UBSV) for a 24-hour drawdown time is 0.52 inches and the water quality flow (WQF) is 0.16 in/hr. The schematic of existing and proposed conditions is provided in Figure 15.
Figure 15 Schematic of Example Problem B.6
Solution:
For this example the existing and proposed CDA and the existing and proposed total impervious areas are all the same. Set all of the areas listed above to
(1000 𝑓𝑡) × (2000 𝑓𝑡) = 2,000,000𝑓𝑡2
Set the BMP area equal to (20 𝑓𝑡) × (2000 𝑓𝑡) = 40,000𝑓𝑡2
Click the Restore pervious area equal to BMP area button.
Option A:
The depth of incorporation is equal to the depth of placement since sand will not be incorporated into the underlying soil. Click the Select and use default amendment properties button. Select Sand and click Overwrite values. If possible, verify that the material properties of the amendment given in the Tool are representative of amendments that will be used for this project. Since no specific information about the amendment is given in this example problem, use the default sand properties. The existing soil must be excavated to the final compacted depth of the
Existing Conditions(not to scale)
2000'
1000'Impervious
Proposed Conditions(not to scale)
2000'
1000'Impervious
20'
Impervious
Existing pervious area 20'Sand

B-24
sand to accommodate the sand placement. The area is constrained, so the depth of excavation must be increased to capture more volume. The maximum depth of sand after compaction, that still meets the drawdown time, is about 72 inches. The depth of placement value is 74 inches, which compacts to 71 inches. In Figure 16, notice how much more infiltration occurs with amendment, even though the existing soil is Type A. This design would require shoring. To avoid increased costs for excavation and shoring the depth could be reduced to 36 inches, capturing only 50% of the WQV. This change would require 38 inches of sand placement and 38 inches of incorporation, which compacts to 36 inches. This means only a 3-foot excavation depth would be required. The results can be seen in Figure 16.
Option B:
To avoid shoring costs the trench will be filled with a high void ratio alternative trench material. The units are large plastic boxes. Change the amendment properties inputs similar to what was used for sand, with the exception that the final bulk density and porosity are known. The bulk density at placement will be the same as the final bulk density. Enter the final bulk density, rather than allow the Tool to calculate it. The specific gravity of the plastic is about 1.1 and the bulk density of a unit with 95% porosity is about 0.055 g/cm3.
(1.1) �1𝑔𝑐𝑚3 � × �
5% 𝑠𝑜𝑙𝑖𝑑𝑠100% 𝑣𝑜𝑙𝑢𝑚𝑒
� = 0.055 𝑔𝑐𝑚3
If the depth is adjusted to 24 inches of depth the BMP could infiltrate 99% of the WQV. These results can be seen in Figure 17.

B-25
Figure 16 Design results for Example Problem B.6, Option A

B-26
Figure 17 Design results for Example Problem B.6, Option B

B-27
B.7 Limited space resulting in undersized infiltration or full-size detention basins Project Description:
The project location is a 1-mile stretch of highway with 2 lanes (12 feet each) and a 3-foot impermeable shoulder. There are no pervious areas. A single lane (12 feet) will be added with a 3-foot shoulder. The runoff will be treated by a basin that must fit within a 50-foot by 60-foot area. The infiltration rate of the underlying soil is 0.8 in/hr. The basin sides will have a 3:1 slope and are compacted so the infiltration rate is effectively 0 in/hr. From Basin Sizer, the unit basin storage volume (UBSV) for a 48-hour drawdown time is 0.52 inches. Determine the percentage of the WQV that will be infiltrated by an infiltration basin and by a detention basin. The schematic of existing and proposed conditions is provided in Figure 18.
New Lane
Proposed Conditions(not to scale)
New EOP
1 mile
Crest of Pavement
3'
12'
12'
Impervious
12'
CD
A to
Bas
in
Basin
Existing Conditions(not to scale)
Existing EOP
1 mile
Crest of Pavement
3'
12'
12'
Impervious
Figure 18 Schematic of Example Problem B.7
Solution:
Within the SSIT, set the existing impervious area to
(27 𝑓𝑡) × �1 𝑚𝑖 ×5,280 𝑓𝑡
1 𝑚𝑖� = 142,560 𝑓𝑡2

B-28
Set the proposed impervious area to
(39 𝑓𝑡) × �1 𝑚𝑖 ×5,280 𝑓𝑡
1 𝑚𝑖� = 205,920𝑓𝑡2
Enter 0 for the BMP amendment area. Proceed to the BIT and enter 60 feet and 50 feet of the length and width of the basin. Enter 0.8 in/hr for the invert soil infiltration rate, 0 in/hr for the side slopes infiltration rate, and 3 for the side slope. Click the Retrieve values from SSIT Input worksheet button to fill in the other inputs. To run an infiltration basin model, click the Infiltration basins button. To run a detention basin model, click the Detention basins button. The infiltration basin solution for this example is shown in Figure 19; the detention basin solution is shown in Figure 20. The amount of infiltration achieved by the detention basin is less than the infiltration basin since the compacted side slopes account for a greater portion of the available area, which leaves a smaller uncompacted invert area. While smaller in capture volume, the shallower infiltration basin has a larger uncompacted invert area and higher infiltration results.
In contrast to the infiltration results, the infiltration basin treated less of the WQV (215%) compared to the WQV treated by the detention basin (325%). The deeper detention basin did not bypass because it was large enough for the target capture volume. Note that a baffle would be required for the detention basin to achieve a length to width ratio of 2:1.

B-29
Figure 19 Infiltration basin design results for Example Problem B.7

B-30
Figure 20 Detention basin design results for Example Problem B.7

B-31
B.8 Limited space resulting in undersized infiltration and undersized detention basins Project Description:
The project location is a 1,000-foot by 2,000-foot existing parking. The surrounding soils are Type A soils with an assumed infiltration rate of 1 in/hr. Due to a TMDL requirement all of the parking lot runoff will be treated by a basin. There is an area that would allow for construction of a basin with a water surface area that is 200-feet by 50-feet. The sides will have a 3:1 slope. The basin will be excavated rather than bermed, so highly-compacted side slopes are not necessary. From Basin Sizer, the unit basin storage volume (UBSV) for a 48-hour drawdown time is 0.52 inches. Determine the percentage of the WQV that will be infiltrated by an infiltration basin and by a detention basin. The schematic of existing and proposed conditions is provided in Figure 21.
Figure 21 Schematic of Example Problem B.8
Solution:
Because of the desire to treat all of the drainage area, the “Additional impervious area seeking treatment credit” is set to equal the CDA. This will maximize the WQV and the credit that can be taken for TMDL compliance. The infiltration basin solution is shown in Figure 22 and the detention basin solution is shown in Figure 23.
The infiltration basin infiltrated more water than the detention basin. However, the capture volume (and treatment) of the detention basin was greater. Even though neither basin captures the target volume, the detention basin may be preferred from a treatment perspective. As for infiltration, the two types of basins are practically equivalent (within the same T-1 Checklist infiltration category of 20% to 50%).
Existing Conditions(not to scale)
2000'
1000'Impervious
Proposed Conditions(not to scale)
2000'
1000'Impervious
CD
A to
Bas
in
Basin

B-32
Figure 22 Infiltration basin design results for Example Problem B.8
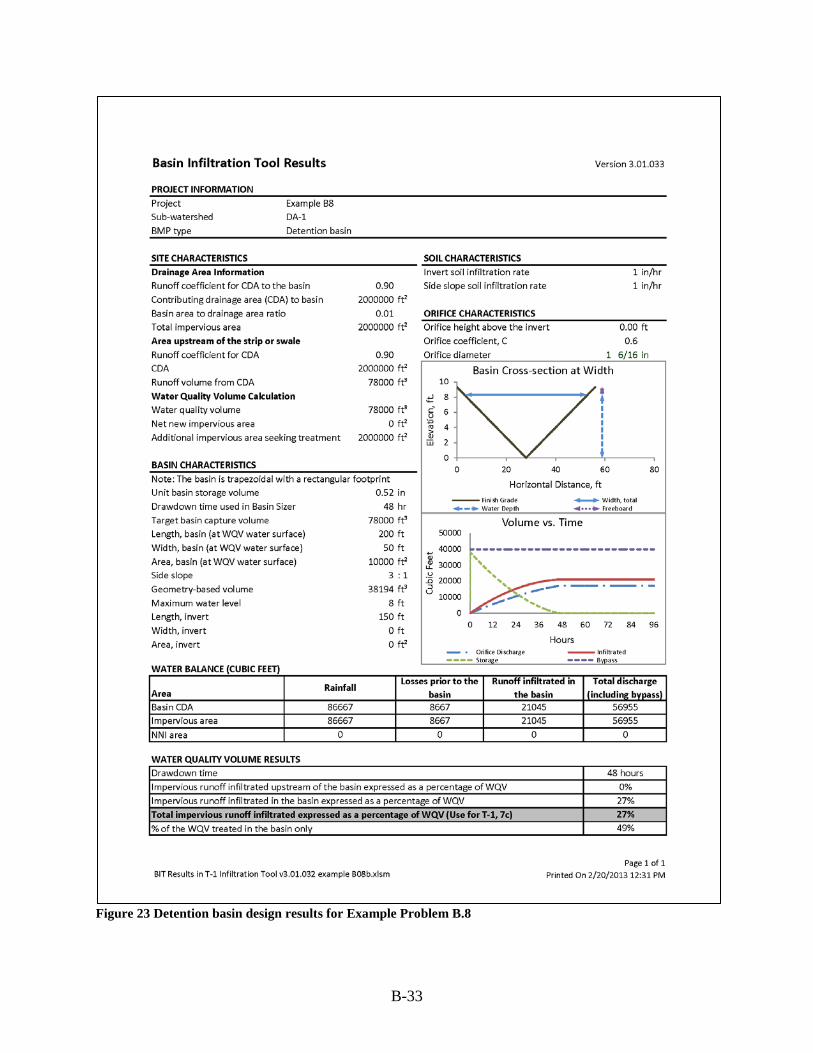
B-33
Figure 23 Detention basin design results for Example Problem B.8

B-34
B.9 Treatment train Project Description:
The project area is 10 acres. The surrounding soils are Type B soils with a bulk density of 1.6 g/cm3. Due to a TMDL requirement all of the runoff will be treated. There is an area that would allow for construction of a 0.5 acre vegetated conveyance strip and swale and a basin with a water surface area that is 100-feet by 50-feet. The sides will have a 3:1 slope. The basin will be excavated rather than bermed, so highly-compacted side slopes are not necessary. Using a 48-hour drawdown time in Basin Sizer, the unit basin storage volume (UBSV) is 0.7 inches and the water quality flow (WQF) is 0.2 in/hr. Determine the percentage of the WQV that will be infiltrated and treated by the vegetated strip/swale and detention basin treatment train. The schematic of the proposed condition is provided in Figure 24.
Proposed Conditions(not to scale)
EOP
1.1 mileCrest of Pavement
12'
12'
12'
12'
Impervious 12'
12'
Basin
3'
3.75'Pervious Area/ Swale
Figure 24 Schematic of Example Problem B.9
Solution:
The existing impervious area is the same as the proposed impervious area
(75 𝑓𝑡) × �1.1 𝑚𝑖 ×5,280 𝑓𝑡
1 𝑚𝑖�
1 𝑎𝑐43,560 𝑓𝑡2
= 10 𝑎𝑐
The pervious area for the proposed swale is
(3.75 𝑓𝑡) × �1.1 𝑚𝑖 ×5,280 𝑓𝑡
1 𝑚𝑖�
1 𝑎𝑐𝑟𝑒43,560 𝑓𝑡2
= 0.5 𝑎𝑐
When the given information is input into the SSIT, the SSIT shows that the loading rate to the strip and swale is greater than the infiltration rate of the strip and swale. This can be fixed by

B-35
increasing the amount of compost. Enter 9 inches of amendment, which assures the WQF will enter the pore space of the strip and swale. However, the pore space only results in infiltration of 42% of the WQV (Figure 25). A basin will be used to capture the remaining WQV.
Next, select the BIT Input worksheet. To use the output from the SSIT as inputs for the BIT, click the Retrieve values from the SSIT Input worksheet button. Once the BIT has retrieved the information from the SSIT, enter the length and width of the basin at the water surface, the side slopes of the basin, and the infiltration rates. The length must be the larger dimension of the basin (100 feet) and the width must be the smaller dimension of the basin (50 feet). Since the basin in this example is excavated into the native soil, use the HSG Type B soil infiltration rate of 0.25 in/hr for both the invert infiltration rate and the side slope infiltration rate. Click the Detention basins button. Once the algorithm has finished running, select the BIT Results worksheet (Figure 26).
Note that the total WQV treated by the treatment train should include the volume treated by the basin and upstream treatment. Since upstream treatment in not quantified in this example, it can be assumed to at least equal the amount of upstream infiltration. In this case, 58% treatment in the basin plus 42% upstream infiltration results in at least 100% treatment of the WQV.

B-36
Figure 25 SSIT results page for Example Problem B.9

B-37
Figure 26 BIT results page for Example Problem B.9

THIS PAGE INTENTIONALLY LEFT BLANK

C-1
Appendix C. Infiltration Tools Update Log The following tables are a record of the major changes and updates made to the T-1 Checklist Infiltration Tools. This log is provided as a reference so users can see what changes have been made to previous versions of the Tools.
Version 3.01
Date Initials Description 1/28/2013 AS improved unit selection for density in the default values worksheet 1/28/2013 AS added amendment property selection pop up window; added default
values for various amendment types; removed bulk density calculation button; added amended soil infiltration rate to SSIT results page
1/14/2013 AS limited the percent treated result in the BIT to not exceed the fraction of the WQV that flows to the basin
1/14/2013 AS set the limit for maximum impervious infiltration results in the SSIT to not exceed the impervious area runoff volume (previously set at CDA runoff)
1/10/2013 AS removed the ability to override the infiltration rate and rainfall rate in the Design Assumptions Checks section of the SSIT to prevent undocumented changes in soil amendment design; the associated button to restore original calculated values was also removed
1/09/2013 AS added a row within the Design Assumption Check section of the SSIT to test and report whether the design assumption is violated for surface loading
1/08/2013 AS improved display and print quality of the results worksheets; renamed the results worksheets
12/11/2012 AS change description of additional area seeking treatment to clarify that additional area seeking treatment can occur within or without the CDA
12/3/2012 AS/bkc reorganize, format, and calculate BIT Water Balance and WQV Results tables in the Basin Results worksheet
11/30/2012 – 1/14/2013
AS
linked the upstream runoff coefficient in the BIT to the minimum runoff coefficient between the rate-based and volume-based results in the SSIT; added logic to prevent using the volume-based result when a design assumption is violated; added logic to the link for the CDA calculation in the BIT as determined by the choice for runoff coefficient
11/16/2012 AS added user input for total impervious area to calculate a more accurate water balance; previous versions assumed a runoff coefficient that caused water balance errors when the CDA contained substantial pervious areas
10/29/2012 AS added “No Pervious Area” options and updated affected calculations and entered 1.6 for the default bulk density
Version 3.0
Date Initials Description
C-2
9/10/2012 AS change definition of "depth of incorporation" to coincide with definition in the Compost specification (now includes both amendment layer and depth of disturbed soil under the amendment)
9/10/2012 AS modified auto-fill so NNI column replicates “Proposed” column for soil and amendment depths
9/10/2012 AS proposed design automatically equal existing values for UBSV, drawdown time, and WQF
9/24/2012 AS add distinct input for impervious area; calculate NNI; add "Additional area seeking treatment credit" and include with NNI for WQV calculation; calculate pervious RC from user dropdown; calculate composite RC for CDA; calculate NNI for Isolated NNI as sum of Proposed NNI and Proposed "Additional area seeking treatment credit"
9/25/2012 bkc organize SSIT Results worksheets, add WQV
Version 2.2
Date Initials Description October 2011 AS fixed runoff coefficient for downstream BMPs for native or existing fill to
account for pavement losses. 11/4/2011 bkc spell check 11/4/2011 bkc text changes on Notes for strip and swale 11/7/2011 bkc finished Janet's editorial 11/7/2011 bkc change calculation on NNI from difference between existing and
proposed to proposed*%NNI (this allows the TMDL situation) 11/8/2011 bkc remove quotes from CALCULATE "WQV infiltrated" and use all caps 11/8/2011 bkc clarified that the retrieval of strip info in basin tool brings over results
(runoff coefficient) for amended biofiltration 11/8/2011 bkc expand sig fig of bulk density to hundredths 11/8/2011 bkc resized column G on Strip&Sw Infiltration 11/8/2011 bkc fit both results pages to one page each for printing 11/8/2011 bkc changed 'an detention basin' to 'a detention basin' and 'an infiltration
basin' in the macro for Volume vs. Time results