industry & analysis - international trade...
TRANSCRIPT

Industry & AnalysisSpotlight Series
July 16, 2014
For U.S. Government Use Only 1
Civil Nuclear Energy
Jonathan ChesebroSenior Nuclear Trade Specialist
Office of Energy and Environmental Industries
Speakers
Supply Chain Services
Office of Supply Chain, Professional, and Business Services
For U.S. Government Use Only 2
Bruce HarshSupply Chain, Retail Distribution/Cold
Chain, Franchising
Eugene AlfordExpress Delivery

Jon ChesebroSenior Nuclear Trade Specialist
Office of Energy and Environmental Industries
Industry & Analysis Spotlight Series:
Civil Nuclear Energy
An ITA Sector Spotlight – July 16, 2014

Agenda
4
• Civil Nuclear Energy Sector Overview
• U.S. Civil Nuclear Industry’s Competitive Strengths
• Coordinated U.S. Efforts to Support Nuclear Power
• 2014 Civil Nuclear Top Market Studyo Methodology
o Rankings
o Country Case Studies

“The United States will continue to promote the safe and secure use of nuclear power
worldwide through a variety of bilateral and multilateral engagements… Going
forward, we will expand these efforts to promote nuclear energy generation
consistent with maximizing safety and nonproliferation goals.”
Climate Action Plan, 2013
The President’s Messages on Global Civil Nuclear Energy
5
“We must harness the power of nuclear energy on behalf of our efforts to combat climate change, and to advance peace and opportunity for all people.”Speech in Czech Republic, 2009
Key Drivers: Energy security/long-term security of supply More than 1.3 billion people globally are without
access to electricity Clean, base-load source of energy Significant source of jobs and economic benefits

435 Nuclear Reactors Operating in 30 Countries (374 GWe; 12.3% of electricity) 72 reactors currently under construction in 15 countries 173 reactors planned in 26 countries over next 8-10 years, worth $700+ billion 310 reactors proposed in 38 countries over next 15 years, worth $1.6+ trillion
Global Status of Nuclear Energy Construction Outlook
6
10+ Reactors 1-9 Reactors Might Build Won't Build

Life Cycle of a Nuclear Power Station
Pre-Construction• Engineering & procurement contract: $5-12 bn• Siting and environmental analysis, licensing
applications• Long-lead items ordered (e.g. reactor vessel)Construction•400,000 cubic yards of concrete•66,000 tons of steel•44 mi. of piping and 300 mi. of electric wiring•130,000 electrical components•1,400-1,800 jobs (peak employment as high as 2,400)
Operation• Maintenance & refueling outages every 18-24 mo.
(one third of fuel assemblies replaced; 1,000 additional workers)
• 20 metric tons of uranium fuel consumed annually*• Steam generators and reactor vessel heads
upgraded when necessary• Power uprates occasionally implemented (~2% to
20% increase in megawatt capacity)• Annually: $430 million in local sales of goods and
services; $40 million In total labor income; $20 million in state and local taxes*
• 400-700 permanent jobs*• Supplies electricity to 623,000 people each year
(city the size of Boston or Seattle)*
Decommissioning•Radioactive components and structures are cleaned or dismantled, packaged, and shipped to storage sites; containment and turbine buildings deconstructed
Used fuel management•Used fuel stored in steel-lined, concrete pools or in massive steel and concrete canisters
•Reprocessing facilities recycle used fuel for new fuel and to reduce volume, heat, and toxicity
•Recycling by products and/or used fuel sent to permanent repository
0 10 20 30 40 50 60 70 80 90 100Pre-Operation
(6-10 years) Operation (40-80 years)Decommissioning and
used fuel management
*Based on a 1,000MW nuclear power plant
Source: NEI7

U.S. Nuclear Industry Supply Chain Subsectors
8
• Advisory and Legal Support Services: address the development of legal and regulatory regimes, licensing support, siting, environmental impact analyses, legal advice, and tender writing and development. Standards development and trade association activities are also included within this subsector.
• Design, Construction, and Operation: technology design and engineering, procurement, project management, site preparation, plant construction, and plant operation and maintenance. This subsector addresses all activities in the engineering, procurement, and construction (EPC) phase of a project and also covers utilities that operate plants and companies that provide plant maintenance and repair.
• Components: manufacturers that seek commercial opportunities throughout a plant’s lifecycle, including parts required for operation and maintenance, uprates and upgrades. We delineate this subsector to reflect commercial opportunities for component manufacturers independent of Nuclear Steam Supply System (NSSS) providers.
• Fuels: includes all aspects of the fuel cycle including mining and milling uranium, enrichment, conversion, fabrication of assemblies, refueling, transportation of fuel, and fuel storage.
• Back-End Services: services related to plant decommissioning and used fuel management, including waste management and removal, remediation, used fuel management, interim storage and transportation, geologic disposal and reprocessing, and recycling of plant byproducts.

U.S. Civil Nuclear Industry’s Competitive Strengths
Expert leader in civil nuclear power development.
Unmatched experience with civil nuclear energy.
Top-performing companies all along the nuclear value chain.
Nuclear industry is known for supporting the development of local industry and contributing to deepen long term bilateral relationship.
Regulatory system is recognized as the global “gold standard” for nuclear safety.
U.S. Export-Import Bank (ExIm) provides financing for U.S. civil nuclear products and services to international markets (no minimum or maximum transaction limit). 9

Challenges Facing U.S. Industry
State-owned nature of most foreign competition• Includes direct government ownership and management, favorable financing,
industrial coordination, and support for manufacturers.• Key state-owned competitors include France (EdF and Areva), Russia (Rosatom) and
South Korea (KEPCO). Need for additional bilateral nuclear cooperation agreements (“123 Agreements”)
• Required for legal civil nuclear trade.• United States currently has 23 agreements covering 47 countries, plus Taiwan and the
International Atomic Energy Agency.• Key potential markets not covered include Vietnam and Saudi Arabia.
Vital but complex U.S. export controls process Lack of a global nuclear liability regime
• Complicates commercial arrangements and prevents swift and certain payment of damages in unlikely event of nuclear accident.
Erosion of U.S. manufacturing capacity• Lack of domestic orders.
10

Civil Nuclear Trade Initiative (CNTI)
Industry Input
• Formally: consensus advice from industry via 36 member Civil Nuclear Trade Advisory Committee (CINTAC)
• Informally: outreach to and discussions with industry reps
USG Coordination
• Lead on civil nuclear commercial issues through interagency working groups
• Coordinate broader U.S. government activities through the White House Director for Nuclear Energy Policy
• Conduct annual Top Market Study to drive priorities
• Support industry participation in International nuclear energy forums (IAEA, IFNEC and GIF)
Trade Policy and Promotion Activities
• Civil Nuclear Trade Policy and Advocacy Missions
• Bilateral Declarations regarding civilian nuclear commercial cooperation
• Nuclear Standards Workshop
• U.S. Industry Program at the IAEA
• CSC nuclear liability promotion
• Financing workshops
Stakeholder Resources
• Civil Nuclear Trade Newsletter
• Specialized industry Reports (i.e. Top Market Study, SMR Report)
• Industry Briefings
• Promotional Materials
• Export Data
• Webinars
• Market Intelligence Briefs
Objective: Increase commercial benefits from nuclear cooperation with other countries

• RD&D• Infrastructure• Fuel Cycle• Licensing• Nonproliferation• International
Cooperation
• Industry Analysis• Commercial Liaisons• Advocacy• Dual-Use Licensing
• Foreign Policy• Nonproliferation• 123 Agreements• Infrastructure
• Standards• Licensing• Bilateral cooperation
Financing Policy Export Credit Financing
White House Director for Nuclear Energy Policy
• Coordinate U.S. government policy and activities
• Enhance interaction with foreign decision makers
• Financing for: Feasibility Studies Reverse trade missions
Industry Advisory Committee
(CINTAC)
Coordinated U.S. Efforts to Support Nuclear Energy

Civil Nuclear Energy Top Markets Study for U.S. Exports, 2014-2028:
An Assessment Tool for Focusing U.S. Government Resources
13

Civil Nuclear Top Markets Study
14
• Purpose: to identify best prospect markets where ITA and U.S. Government activities can most effectively be leveraged to support the success of U.S. companies in the civil nuclear energy sector
• Methodology Overview• 13 Country Case Studies
o Bulgariao Canadao Chinao Czech Republico Japano Malaysiao Mexico
o Polando Republic of Koreao Saudi Arabiao Turkeyo United Arab Emirateso United Kingdomo Vietnam

Assessment Methodology Reflects our Work Flow Model
Civil Nuclear Trade Advisory Committee Recommendations
Information from Industry
Engagement
Qualitative Data Sources and Analysis
Intel from Officers at U.S. Embassies
U.S. government responds to identified challenges and opportunities to maximize
the potential for export success
Collect
ITA/OEEI produces original analysis and recommendations
Analyze
Act
Coordinated with “Atoms for Prosperity” Interagency Team
Recommendations
Lessons Learned

Mature Market and Decommissioning• Country has significant experience operating nuclear plants and is currently decommissioning plants or has announced plans to do so. Political
climate does not favor nuclear power.• Top markets: (1) Japan, (2) Germany, (3) Switzerland, (4) Belgium• Short/mid/long term export opportunities: Plant operation and maintenance, components, fuels, back-end services, decommissioning
and decontamination
Mature and Maintaining Fleet • Country has significant experience operating NPPs but does not have plans to expand its existing fleet. Political climate favors nuclear power. • Top markets: (1) Canada, (2) Taiwan, (3) Spain, (4) Netherlands• Short term opportunities: Plant operation and maintenance, components, fuels, • Mid/long term opportunities: back-end services
Existing Market and Expanding Fleet • Country has one or more operating commercial NPPs and interest in expanding its fleet. Expansion has been noted via public announcements,
tenders, construction to expand an existing plant or build a new plant, and projected commission dates for new nuclear plants.• Top markets: (1) China, (2) UK, (3) India, (4) Brazil, (5) Mexico, (6) Bulgaria, (7) Czech Republic• Short term opportunities: site selection and environmental assessments; design, construction, and operation; components; fuels• Long term opportunities: back-end services
Newly Emerging Market• No operating reactors, but clear government support for a civil nuclear energy program - country is taking tangible steps to develop
the necessary regulatory framework, has established sites for its first plant, or is building its first plants• Top markets: (1) Vietnam, (2) UAE, (3) Saudi Arabia, (4) Poland, (5) Lithuania, (6) Jordan, (7) Turkey • Short term export opportunities: advisory and legal support services, education and workforce development• Mid/long term export opportunities: site selection and environmental assessments; design, construction, and operation; components; fuel
Civil Nuclear Top Markets Study - Methodology
16
Civil Nuclear Top Markets Study - Methodology
17
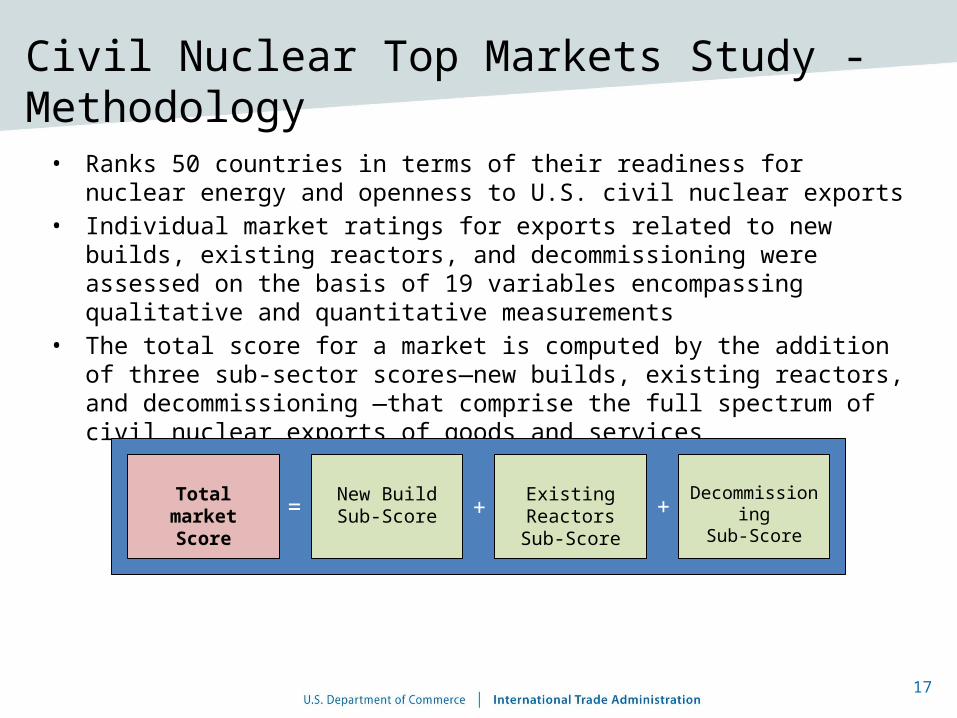
• Ranks 50 countries in terms of their readiness for nuclear energy and openness to U.S. civil nuclear exports
• Individual market ratings for exports related to new builds, existing reactors, and decommissioning were assessed on the basis of 19 variables encompassing qualitative and quantitative measurements
• The total score for a market is computed by the addition of three sub-sector scores—new builds, existing reactors, and decommissioning —that comprise the full spectrum of civil nuclear exports of goods and services
Total market Score
New BuildSub-Score
Existing ReactorsSub-Score
DecommissioningSub-Score= + +
Civil Nuclear Top Markets Study - Methodology
18
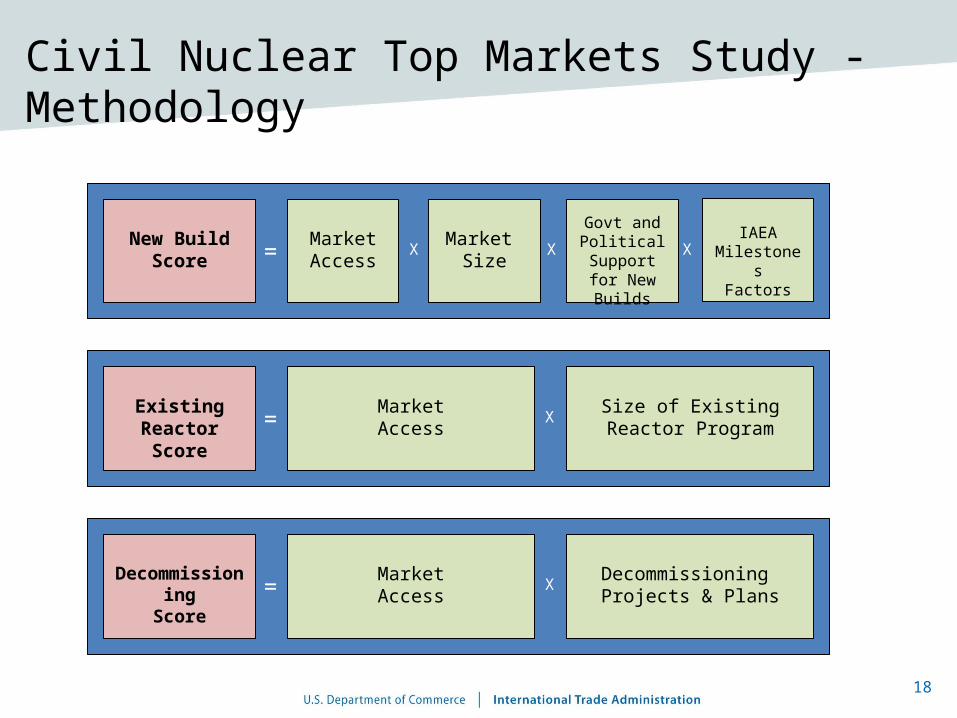
New BuildScore
Market Access= X Market
Size
Govt and Political
Support for New Builds
XIAEA
MilestonesFactors
X
Existing ReactorScore
MarketAccess= X Size of Existing Reactor
Program
DecommissioningScore
MarketAccess= X Decommissioning
Projects & Plans

Methodology – Criteria (1/4)
1) China 2) UK
Total Score 18.2 17.2Weighted factor for new build =
(market access X size of potential market X interest in expanding new NPPs X Milestones factors)/50
New Build Score 15.8 12.4
Weighted factor for existing plant exports = (market access X size of existing program)/5
Existing Plant Score 2.4 2.4
Weighted factor for decommissioning = (decommissioning X market access)/5
Decommissioning Score 0 2.4
Value & Description Weight Weighted Section Score 3 3
Market Access for New Builds
Strength of foreign competition for new builds
0 U.S. completely occluded 1 High 2 Average competition 3 Low 1
2 2
Expected U.S. Content 0 U.S. completely occluded 1 Low 2 Medium 3 High
1 1
Market Access for Other Subsectors
Strength of foreign competition for other subsectors
0 U.S. completely occluded 1 High 2 Average competition 3 Low 1
2 2
Expected U.S. Content 0 U.S. completely occluded 1 Low 2 Medium 3 High
1 2
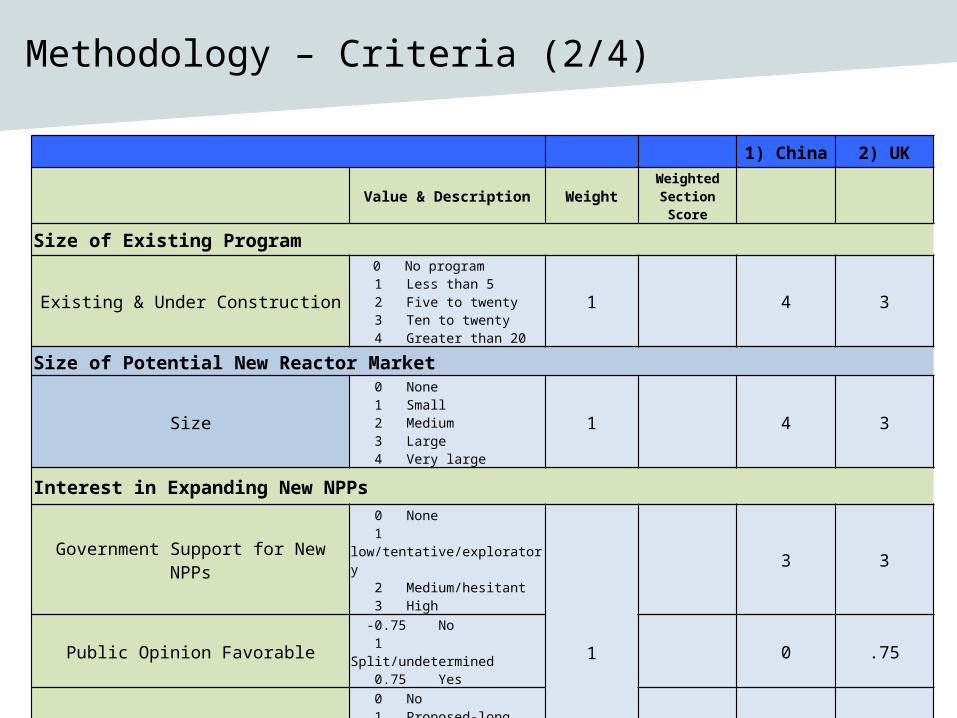
Methodology – Criteria (2/4)
1) China 2) UK
Value & Description Weight Weighted Section Score
Size of Existing Program
Existing & Under Construction
0 No program 1 Less than 5 2 Five to twenty 3 Ten to twenty 4 Greater than 20
1 4 3
Size of Potential New Reactor Market
Size
0 None 1 Small 2 Medium 3 Large 4 Very large
1 4 3
Interest in Expanding New NPPs
Government Support for New NPPs 0 None 1 low/tentative/exploratory 2 Medium/hesitant 3 High
1
3 3
Public Opinion Favorable -0.75 No 1 Split/undetermined 0.75 Yes
0 .75
Plans for New NPPs 0 No 1 Proposed-long term 2 Planned-near term
2 2
Current NPP Construction 0 No 1 Yes 1 0

Methodology – Criteria (3/4)
1) China 2) UK
Value & Description Weight Weighted Section Score
IAEA Milestones Factors (Infrastructure + International agreements + Electricity needs + Financial fitness) Infrastructure
Liability Framework
0 No 1 Intent to join 2 1960 Paris or 1963 Vienna Convention only 3 1997 Vienna Protocol, 2004 Paris Protocol, or CSC
0.5 1 2
123 Agreement
123 Agreement 0 No 1 in discussion/other arrangement 2 Yes
0.5 2 2
Electricity Needs
Projected Electricity Demand Growth 1 Low 2 Medium 3 High
0.5
3 1
Domestic Energy Availability 1 Net coal &/or nat gas exporter 2 Net total fossil fuel exporter 3 Net energy importer
3 3

Methodology – Criteria (4/4)
1) China 2) UK
Value & Description Weight Weighted Section Score
IAEA Milestones Factors (Infrastructure + International agreements + Electricity needs + Financial fitness) Financial Fitness
Ex-Im Bank Long-Term Exposure Fee Level 0 6 or 7 1 4 or 5 2 2 or 3 3 0 or 1
0.5
2 3
Ability to Finance NPP 1 Low 3 Medium 5 High
5 5
GDP 1 Bottom quartile 2 Second quartile 3 Third quartile 4 Top quartile
4 4
World Bank Ease of Doing Business Indicator - 2014
1 Bottom quartile 2 Second quartile 3 Third quartile 4 Top quartile
2 4
Decommissioning
Plans for Decommissioning or Site Remediation
0 No 1 Yes, small scale 2 Yes, medium scale 3 Yes, large scale
1 0 3

Top 50 Overall Ranking
1) China2) United Kingdom3) Vietnam4) India5) Brazil6) United Arab Emirates7) Mexico8) Saudi Arabia9) Bulgaria10) Poland11) Czech Republic12) South Africa13) Republic of Korea14) Sweden15) Japan16) Lithuania17) Slovakia18) Argentina19) Canada20) Slovenia21) Jordan22) Turkey23) Ukraine24) Egypt25) Malaysia
26) Romania27) Kazakhstan28) Finland29) Hungary30) Taiwan 31) Germany32) Indonesia33) Russia34) Switzerland35) Chile36) Philippines37) France38) Spain39) Netherlands40) Australia41) Belgium42) Nigeria43) Kuwait44) Ghana45) Bangladesh46) Kenya47) Belarus48) Mongolia49) Niger50) Italy
New Builds
1) China
2) United Kingdom
3) Vietnam
4) Brazil
5) UAE
6) India
7) Saudi Arabia
8) Mexico
9) Poland
10) Lithuania
Existing Plants
1) China
2) United Kingdom
3) India
4) Japan
5) Ukraine
6) Taiwan
7) Canada
8) Rep. of Korea
9) Sweden
10) Russia
Decommissioning
1) United Kingdom
2) Japan
3) Germany
4) Canada
5) Taiwan
6) Sweden
7) Ukraine
8) Hungary
9) Russia
10) Switzerland
The Results – a detailed ranking of export markets by subsector

24
China
Vietnam
Brazil
Mexico
Bulgaria
Czech Rep
Rep. K
oreaJap
an
Slova
kia
Canad
aJord
an
Ukraine
Malaysi
a
Kazakh
stan
Hungary
German
yRussi
aChile
France
Netherl
ands
Belgium
Kuwait
Bangla
desh
Belaru
sNige
r
Uzbekista
n0
1
2
3
4
5
6
7
8
9
10
Country Rankings
Saudi Arabia (#8): No reactors in operation but planning to build 16; no
123 Agreement
China (#1): 20 operating reactors, 28
reactors under construction
Japan (#15): All 48 reactors are offline (restarting some
soon); opportunities for post-Fukushima decontamination
and remediation services
Malaysia (#25): strong interest in developing nuclear power but no
operational reactors or reactors under construction
Germany (#31): 17 operational reactors; phasing out nuclear;
decommissioning opportunities
Ghana (#44): No reactors – actively considering a nuclear
energy program

Country Case Studies
25
• 13 Country Case Studieso Bulgariao Canadao Chinao Czech Republico Japano Malaysiao Mexicoo Polando Republic of Koreao Saudi Arabiao Turkeyo United Arab Emirateso United Kingdomo Vietnam

ChinaType: Existing and Expanding
Overall Rank: 1
New Builds
1
China has the fastest growing nuclear energy program in the world and is the top ranking export market in this study. China is on pace to triple its nuclear capacity to 58 GWe by 2020, and it plans to begin marketing its indigenously designed reactors for export in 2015. Foreign competition for access to the Chinese market is high, and China has become increasingly self-sufficient for its nuclear power technology needs, which will limit U.S. content in exports for new reactors. However, ample opportunities exist for U.S. industry in all aspects of the fuel cycle.
Each Country Case Study Includes:
Country Case Study - Example
Sub-Sector Rank
Existing Reactors
1
Decommissioning
1
Overview of nuclear in that country Planned nuclear energy projects Commercial opportunities Challenges and barriers to U.S. civil nuclear exports Nuclear infrastructure in that country U.S. Government cooperation International Engagement Recommendations for USG export promotion activities

Top Markets Study Appendix
27
Includes information on• Civil Nuclear Subsector Definitions• Role of U.S. Government Agencies in Civil Nuclear Energy• Key Trade Policy Issues in Civil Nuclear Energy
o Liabilityo Export controls o Financingo 123 Agreements

ITA Industry & AnalysisCivil Nuclear Contacts
Jon Chesebro [email protected] 202.482.1297
Adam O’Malley [email protected] 202.482.4850
Man Cho [email protected] 202.482.5159

Industry and Analysis’Spotlight on Supply Chain:
Express Delivery, Retail Distribution and Franchising
July 16, 2014
Prepared by Office of Supply Chain, Professional and Business Services
For U.S. Government Use Only 29

U.S. Department of CommerceInternational Trade Administration
Presenters• Bruce Harsh – Supply Chain, Retail
Distribution/Cold Chain, Franchising• Eugene Alford – Express Delivery
For U.S. Government Use Only 30
U.S. Department of CommerceInternational Trade Administration
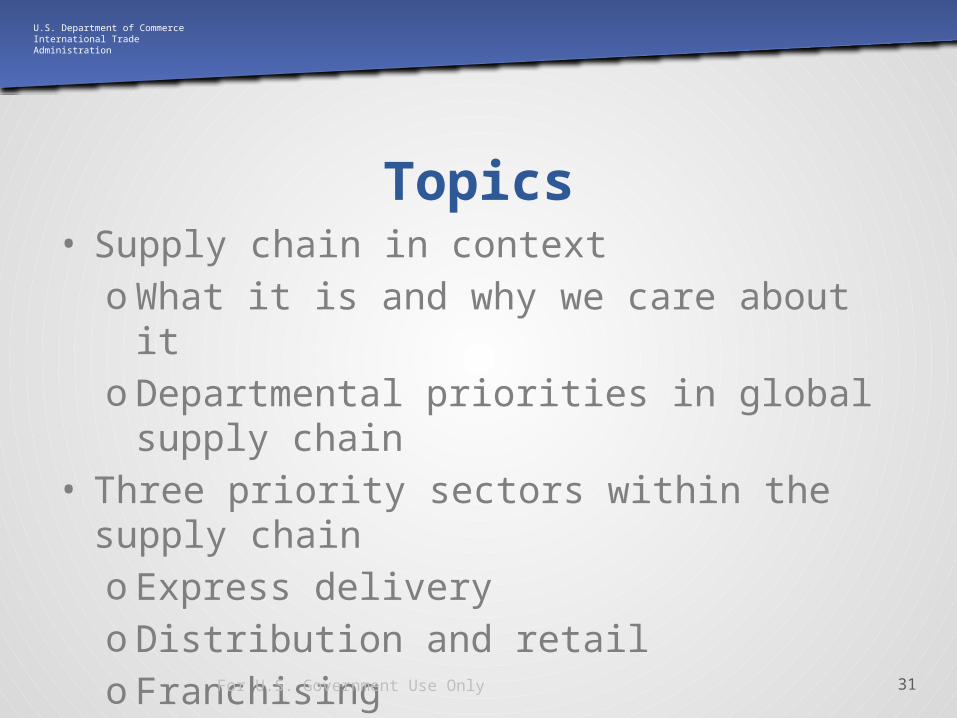
Topics• Supply chain in context
oWhat it is and why we care about itoDepartmental priorities in global supply
chain• Three priority sectors within the supply
chaino Express deliveryoDistribution and retailo Franchising
For U.S. Government Use Only 31
U.S. Department of CommerceInternational Trade Administration
Supply Chain and Distribution Services
For U.S. Government Use Only 32
U.S. Department of CommerceInternational Trade Administration
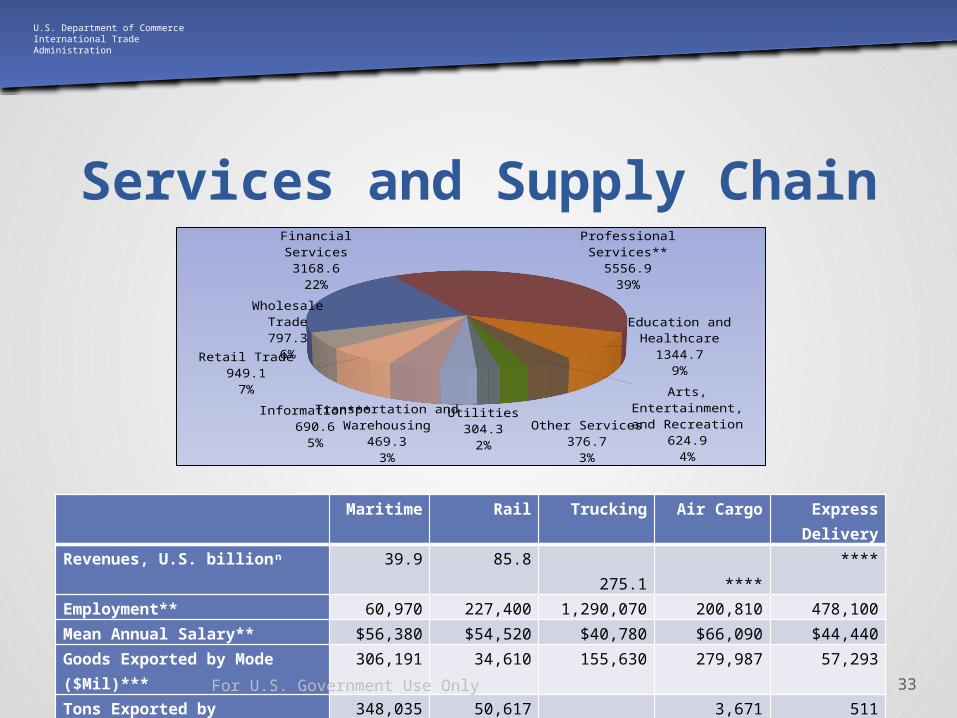
Services and Supply ChainFinancial Services3168.622%
Professional Services**
5556.939%
Education and Healthcare
1344.79%
Arts, Entertain-ment, and Recreation
624.94%
Other Services376.73%
Utilities304.32%
Transportation and Warehous-ing
469.33%
Information***690.65%
Retail Trade949.17%
Wholesale Trade797.36%
Maritime Rail Trucking Air Cargo Express Delivery
Revenues, U.S. billionⁿ 39.9 85.8 275.1 **** ****Employment** 60,970 227,400 1,290,070 200,810 478,100Mean Annual Salary** $56,380 $54,520 $40,780 $66,090 $44,440Goods Exported by Mode ($Mil)***
306,191 34,610 155,630 279,987 57,293
Tons Exported by Mode(1000s)***
348,035 50,617 57,565 3,671 511
NAICS codes 483 482 484 481 492.1For U.S. Government Use Only 33

U.S. Department of CommerceInternational Trade Administration
Scale of Supply Chain• Total U.S. spending (2013): $1.39 trillion• Flows through borders/customs -- $1.5T
outbound, $2.5T inbound• International comparisons – 17.8% of GDP in
China, 13% of GDP in India, 7% of GDP in Europe, 8.5% of GDP in U.S.
• Sector employment (U.S.): 11 million
For U.S. Government Use Only 34

U.S. Department of CommerceInternational Trade Administration
Supply chain as business issue…
• Top business issue – supply chain revolutiono All industries, all sectorso Corporate financialso Global sourcing and new business modelso Influences investment and hiring decisionso Focus on border management
• Factor in investment and hiring decisionso New trade and investment patterns
• Supply chain is globalizationo Investment-driven trade and competitiono Expanded development and trade benefits
For U.S. Government Use Only 35

U.S. Department of CommerceInternational Trade Administration
And therefore a trade issue…
• Aligning trade and investment policy to business reality
• Growing visibility, various approaches:o WTO/DOHA – Positive listo NAFTA – Sector and investment chapterso FTA’s – Broader and more sector and investment chapters and annexeso APEC – Trade facilitation and customs
• Breakthrough – WTO Trade Facilitation Agreemento Practical focus on customs and border managemento Impact quantified in WEF report (2013)
For U.S. Government Use Only 36
U.S. Department of CommerceInternational Trade Administration
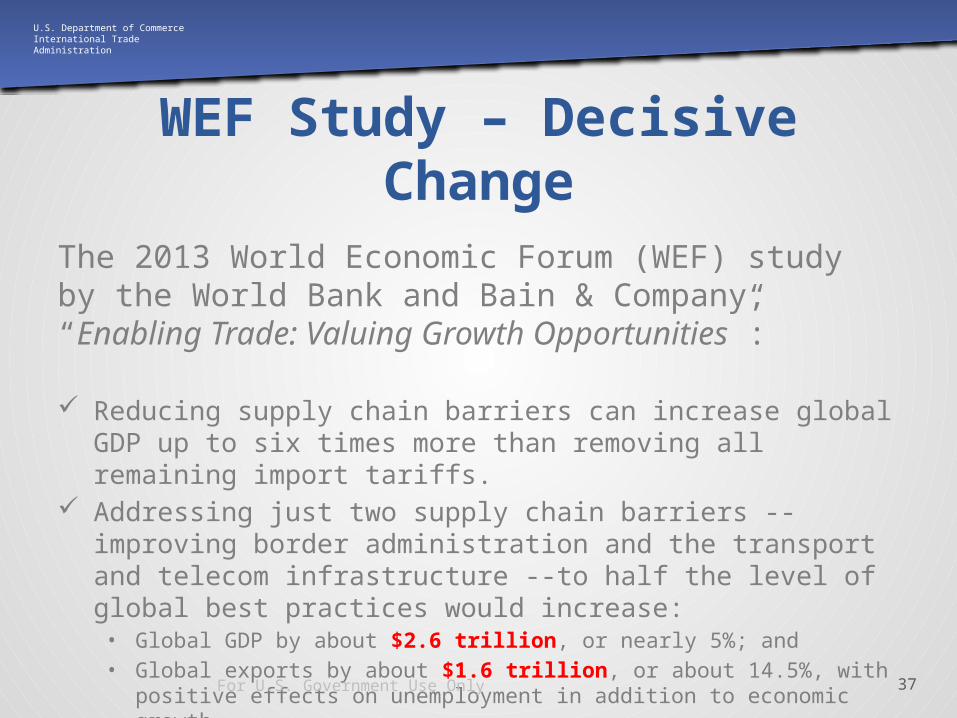
WEF Study – Decisive Change
The 2013 World Economic Forum (WEF) study by the World Bank and Bain & Company, “Enabling Trade: Valuing Growth Opportunities”:
Reducing supply chain barriers can increase global GDP up to six times more than removing all remaining import tariffs.
Addressing just two supply chain barriers -- improving border administration and the transport and telecom infrastructure --to half the level of global best practices would increase:
• Global GDP by about $2.6 trillion, or nearly 5%; and • Global exports by about $1.6 trillion, or about 14.5%, with positive
effects on unemployment in addition to economic growth.For U.S. Government Use Only 37
U.S. Department of CommerceInternational Trade Administration
Now a top USG and DOC priority
• Reducing transaction costs and processing times for exports – ITDS Single Windowo Implement Executive Order of 19 February 2014
• Implementing the WTO Trade Facilitation Agreement for better customs processing and border management
• Implementing the recommendations of the Advisory Committee on Supply Chain Competitiveness
Supports reality of NEI NextSectoral work in key sectors supports those projects
For U.S. Government Use Only 38

U.S. Department of CommerceInternational Trade Administration
Our Supply Chain Priorities• Leading role for ITA and for Department in
interagency program to build International Trade Data System (ITDS), or Single Window system for USo Leading role in external engagement program – domestic and
international – for entire program• Implementing WTO TF agreement
o Central coordinating point for industry input into implementationo Focus on North America, implementing PEC recommendations
• Sectoral expertise – select sectors (Express Delivery, Franchising, Retail)
Use ACSCC as central mechanism to secure industry guidance across entire supply chain complex
For U.S. Government Use Only 39

U.S. Department of CommerceInternational Trade AdministrationExpress Delivery by the Numbers (UPS, FedEx, DHL,
TNT)
30 Million Daily
Packages
0.014% U.S. GDP
0.007% U.S.
EmploymentFor U.S. Government Use Only 40

U.S. Department of CommerceInternational Trade Administration
Impact on the U.S. EconomyExpress Delivery
U.S. Revenue: $200 billionEmployment: 1.1 millionJobs Supported: 2.75 millionU.S. Global Market Size: $26 billion Daily Packages Delivered: 30 millionTransport Vehicles: 187 thousand
For U.S. Government Use Only 41

U.S. Department of CommerceInternational Trade Administration
Express DeliveryLeading Markets, Challenges and
Opportunities
• Challenges: ground transportation, air cargo restrictions and aviation negotiations
• Opportunities: SME access to global market
• Challenges: Domestic delivery licensing, state postal regulator/competitor, customs clearance, full use of aviation rights/air hubs
• Opportunities: Improving supply chain infrastructure, $14 billion market
• Challenges: TTIP and TiSA negotiations, airport night flight restrictions, align security regimes, postal legislation
• Opportunities: Well established supply chainsFor U.S. Government Use Only 42

U.S. Department of CommerceInternational Trade Administration
Express Delivery• 30% of express delivery revenues are global• Supports 2.75 million total jobs• Ships $2T in goods annually• U.S. trade policy has aggressively opened
markets and leveled competitive playing fields for U.S. express operators:o U.S. FTAs include an Express Delivery
Services annex
For U.S. Government Use Only 43
U.S. Department of CommerceInternational Trade Administration
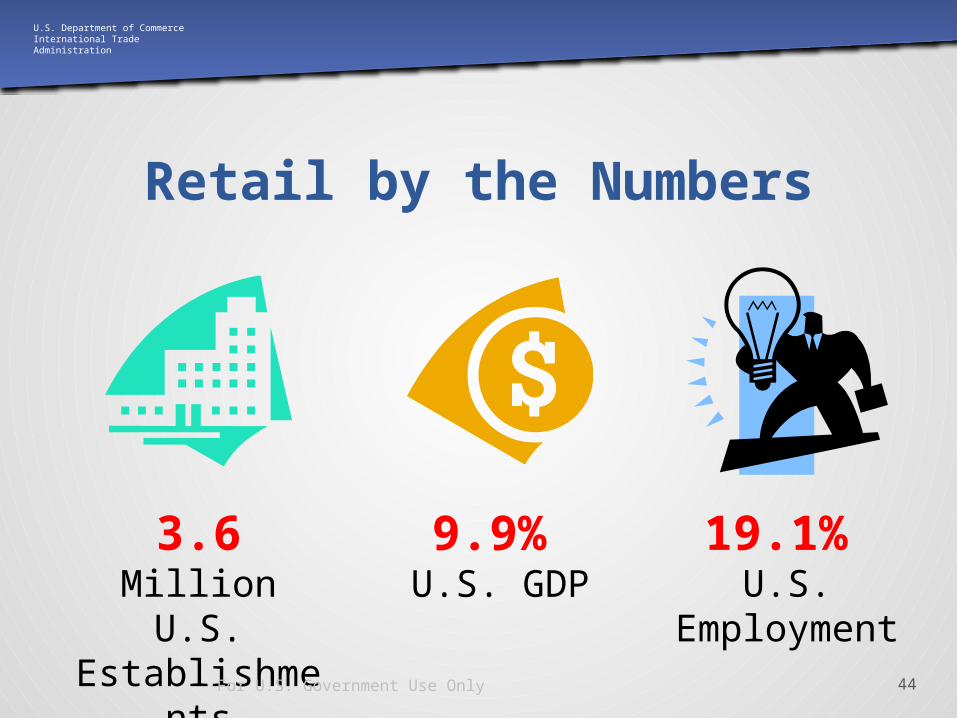
Retail by the Numbers
3.6 Million U.S.
Establishments
9.9% U.S. GDP
19.1% U.S.
EmploymentFor U.S. Government Use Only 44
U.S. Department of CommerceInternational Trade Administration
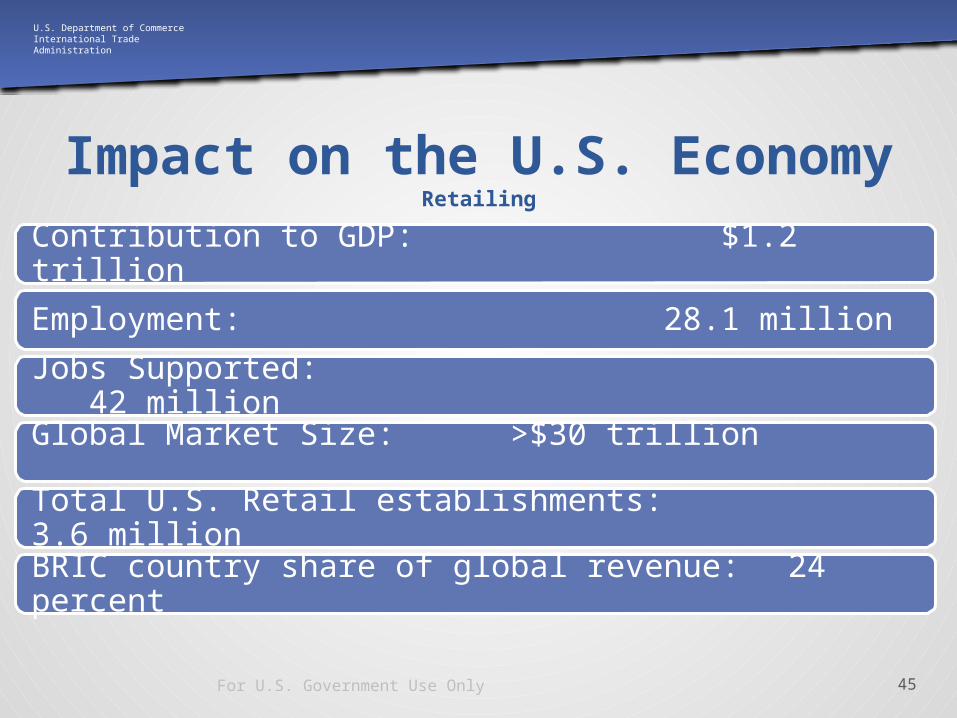
Impact on the U.S. EconomyRetailing
Contribution to GDP: $1.2 trillionEmployment: 28.1 millionJobs Supported: 42 millionGlobal Market Size: >$30 trillion Total U.S. Retail establishments: 3.6 millionBRIC country share of global revenue: 24 percent
For U.S. Government Use Only 45

U.S. Department of CommerceInternational Trade Administration
RetailingLeading Markets, Challenges and
Opportunities
• Challenges: Complicated and fluctuating Multi-Brand FDI restrictions, Poor supply chain infrastructure
• Opportunities: $1.88T Retail Market by 2018
• Challenges: Low reliability with retail suppliers, Local regulations on foreign operators can be arbitrary
• Opportunities: Improving supply chain infrastructure, $4.6T household spending in 2014• Challenges: Many mature retail
markets, Supply chain infrastructure very inefficient
• Opportunities: $1.9 T household spending by 2018
For U.S. Government Use Only 46

U.S. Department of CommerceInternational Trade Administration
Franchising by the Numbers
770 Thousand
U.S. Establishmen
ts
4.1% U.S. GDP
5.8% U.S.
EmploymentFor U.S. Government Use Only 47

U.S. Department of CommerceInternational Trade Administration
Impact on the U.S. EconomyFranchising
Contribution to GDP: $494 billionEmployment: 8.5 millionTotal U.S. Gross Output: $841 billionU.S. Revenue Growth Rate 4.8 percent Total U.S. Franchise Establishments: 770 thousandEmployment Growth Rate: 2.6 percent
For U.S. Government Use Only 48

U.S. Department of CommerceInternational Trade Administration
FranchisingLeading Markets, Challenges and
Opportunities
• Markets Represents 5% of GDP• 9% market growth in 2013• Employ over 800,000 people.• Government supports
Franchising • Challenges: Supply Chain
Security, Logistics Costs• Opportunities: Market
proximity
• GDP Growth 5-6%• 300-350 Million in Middle Income • 30 % Annual Market Growth • Challenges: Supply chain
infrastructure • Opportunities: $3.3B Market in 2014
For U.S. Government Use Only 49

U.S. Department of CommerceInternational Trade Administration
Franchising is Small Business and a Job Creator
• Franchising offers great self-employment opportunities• Franchising is mistakenly identified only by McDonald’s,
Yum Brands and other famous companies• However, the industry is mostly made up of small business
owners• Industries such as tutoring, home/commercial cleaning,
moving, fitness, and child care rely on franchising concepts • For the last 7 years, franchising has created jobs faster than
all other businesses in the United States• Veteran Friendly. Over 600 franchise concepts have signed
on to offer veteran discounts, and streamline the process
For U.S. Government Use Only 50

U.S. Department of CommerceInternational Trade Administration
Examples of ITA and Interagency Activities
• ITDS Implementation – Presidential Executive Ordero BIEC, EEC
• Trade Agreement: TTIP, TPP, and TiSAo I&A participates in development of policy positions on cross border
trade of services negotiationso Ongoing research on relevant U.S.-EU trade issues for use by DOC,
USTR and other USG decision-makers• World Trade Organization Trade Facilitation
Agreement
For U.S. Government Use Only 51
U.S. Department of CommerceInternational Trade Administration
Contact• Bruce Harsh – Supply Chain Team Lead
[email protected] 202-482-4582• Eugene Alford – Express Delivery Services
[email protected] 202-482-• John Miller – Retail Services
[email protected] 202-482-1316• Richard Boll – Franchising
[email protected] 202-482-1135
For U.S. Government Use Only 52

U.S. Department of CommerceInternational Trade Administration
Thank You
For U.S. Government Use Only 53