study. pub date pub type - files.eric.ed.gov
TRANSCRIPT

DOCUMENT RESUME
ED 402 677 EA 028 142
AUTHOR Achilles, C. M.; And OthersTITLE Education's Equivalent of Medicine's Framingham Heart
Study.PUB DATE Mar 96NOTE 20p.; Paper presented at the Annual National
Conference on Creating the Quality School (5th,Oklahoma City, OK, March 27-30, 1996).
PUB TYPE Speeches/Conference Papers (150) ReportsResearch /Technical (143)
EDRS PRICE MFO1 /PCO1 Plus Postage.DESCRIPTORS *Academic Achievement; Blacks; *Class Size; *Early
Intervention; *High Risk Students; Kindergarten;Longitudinal Studies; Outcomes of Education;Prevention; Primary Education; Program Effectiveness;Scores; *Teacher Student Ratio
IDENTIFIERS *Student Teacher Achievement Ratio Project TN;Tennessee
ABSTRACTSince 1984, large-scale, longitudinal, and
experimental research on class size has been conducted in Tennessee.Project STAR (Student-Teacher Achievement Ratio) changed in 1989 tothe Lasting Benefits Study (LBS) and Project Challenge. In 1985almost 7,000 students in kindergarten were randomly assigned toeither small classes, regular-sized classes, or regular-sized classeswith a full-time aide. This paper summarizes the project's researchfindings to date. Findings indicate that small is better, especiallyin the early years of schooling. The program resulted in improvedacademic performance, improved cognitive scores on measures, fewergrade retentions, more on-task time for teachers, a higher level ofstudent engagement, and a reduced test-score gap between white andnonwhite students. The paper also compares STAR to the Framingham(Massachusetts) Heart Disease Epidemiology Study. It describes howthe program can ameliorate the effects of poverty and other factorsthat place children at risk. The achievement gap between black andwhite students does not open at grade 1 if both groups are placedtogether in small kindergarten classes by random assignment. Smallclasses beginning in kindergarten or first grade seem to preventlater school problems; however, later application of small-classtreatment appears to have limited value. Seven tables are included.(Contains 13 references.) (LMI)
***********************************************************************
Reproductions supplied by EDRS are the best that can be madefrom the original document.
***********************************************************************

EDUCATION'S EQUIVALENT OF
MEDICINE'S FRAMINGHAM HEART STUDY
Paper Prepared forFifth Annual National Conference on
Creating the Quality SchoolOklahoma City, OK
March 27-301996
C.M. Achilles, Professor,Educational Leadership, EMU, Ypsilanti, MI, 48197
B.A. Nye, Principal Investigator and Executive DirectorTennessee State University (TSU), Center for Research and Policy, (RPC)
Jayne B. Zaharias, Co-Investigator and Research Director,Academic Skills Area, RPC/TSU
B.D. Fulton, Research Specialist andV. Cain, Research Associate,
RPC/TSU, 330 10th Avenue North, Nashville, TN 37203-3401.
U.S. DEPARTMENT OF EDUCATIONOffice of Educational Research and Improvement
EDUCATIONAL RESOURCES INFORMATIONCENTER (ERIC)
This document has been reproduced asreceived from the person or organizationoriginating it.
Minor changes have been made toimprove reproduction quality.
Points of view or opinions stated in thisdocument do not necessarily representofficial OERI position or policy.
2BEST COPY AVAILABLE
"PERMISSION TO REPRODUCE THISMATERIAL HAS BEEN GRANTED BY
IM, 61 c- A i'lles
TO THE EDUCATIONAL RESOURCESINFORMATION CENTER (ERIC)"

Education's Equivalent - revision-4/1/96
EDUCATION'S EQUIVALENT OF
MEDICINE'S FRAMINGHAM HEART STUDY 1
IntroductionSince 1984, large-scale, longitudinal, and experimental research has
been conducted in Tennessee. That such long-term and serious research canbe sustained in education is unusual, but what is even more important is thegenuine Institution of Higher Education (IHE), State Education Agency(SEA), policy boards, and Local Education Agency (LEA) cooperation that, inmany cases, has outlasted the persons who represented these levels of workthroughout the years. Governors, legislators, State Board of Educationrepresentatives, education commissioners, principal investigators (P.I.$),superintendents, principals and teachers, researchers and SEA staff havechanged, but the research continues. The accumulating database that makesthis work education's equivalent of Medicine's Framingham Heart Study
What began as Project STAR (Student-Teacher Achievement Ratio)evolved in 1989 to the Lasting Benefits Study (LBS) and Project Challenge.Both the STAR and LBS studies spawned subsidiary and ancillary studiesemploying the STAR and LBS database or conceptual bases). Both STARand LBS built upon the foundation "pilot study" called the DuPont study thatpreceded STAR by two years and helped interest TN policy people in aserious study of class-size and student achievement. The DuPont study wasreported mostly in several student dissertations conducted at Tennessee StateUniversity (TSU) and directed by Dr. Helen Bain who became a STAR PI in1984.
Project STAR SynopsisProject STAR began in fall, 1985 with almost 7,000 pupils in
kindergarten (K) who were randomly assigned in 79 schools in 42 of TN's 138school districts. Pupils were in classes of 13-17 (Small or S), 22-26 (Regularor R) and Regular with a full-time aide (RA). Teachers were assigned toclasses at random. In fall, 1986 pupils moved to grade 1 and remained
1 C.M. Achilles, Professor, Educational Leadership, EMU, Ypsilanti, MI, 48197; BA. Nye,Executive Director, Center for Research and Policy (RPC), Tennessee State University (TSU);Jayne B. Zaharias, Research Director Academic Skills Area RPC/TSU; B.D. Fulton, ResearchSpecialist and V. Cain, Research Associate, RPC/TSU, 330 10th Avenue North, Nashville, TN37203-3401. Achilles was one PI for STAR and he continues class-size studies at RPC/TSU.Revision of paper at AASA, San Diego, 3/8/96.
2
3

Education's Equivalent - revision-4/1/96
basically in the same class-size units, moving as cohorts each year. Newteachers and aides [if in the (RA) condition] were randomly assigned. Thisprocess repeated each grade K-3. After grade 3 the pupils returned to theregular class-size condition of the district. The sample increased at grade 1 asTN did not have required K at the time that STAR began. New pupils whoentered in grade 1 were randomly assigned to (S), (R), (RA). As part of the"in-school design" each school that had (S) also had at least one (R) and one(RA) class. This simplified the study in terms of data collection, etc., but alsocontrolled for district and building-level variables.
Each spring the pupils were tested in controlled conditions on theappropriate form of the Norm-Referenced Test (NRT), the StanfordAchievement Test (SAT) batteries. Students also took TN's objective-drivenCriterion Referenced Test (CR1) called Basic Skills First (BSF). Researcherscollected demographic data, logs of teacher and aide time, questionnaire dataon classroom practices, student self-concept responses on the SCAMIN, and avariety of context and other data.
Although the experiment was self-contained in the participating schoolswith all three conditions, researchers established an external set of 21comparison schools. Selected from within STAR districts, the comparisonschools were as nearly like the STAR school in each comparison-schooldistrict as possible. The only contact with these schools was that researchersobtained the test scores of the age-alike cohorts, K-3.
Two main rules guided STAR: 1) students should not in any way bepenalized by being in STAR and 2) researchers touched nothing except classsize and, of course, random assignment, but (R) and (RA) were randomizedwith the (S). All analyses were conservative. Researchers recognized theinfluence of teachers and classmates on a pupil's scores and used the classaverage as the unit of analysis because this was a study of class size. Therewere at least 100 classes of each (S, R, RA) condition each year, K-3.
STAR was conducted by a consortium of four IHEs, directed by staff ofthe SEA, and advised by a) an advisory board of LEA and other persons andb) a panel of external consultants. To assure objectivity, the primary analysiswas contracted to an external statistics and design consultant; secondary andconfirmatory analyses were done by the various Pis. Summary results ofSTAR have been reported elsewhere. (S) classes outperformed (R) and (RA)classes statistically and educationally significant in all locations, for allgroups, each year, and cumulatively for all three years. These gains wereboth on CRT and NRT measures. By the end of grade 3, there were notdifferences in such things as attendance or discipline, but in (S) there were a)less retention in grade and b) more early identification of youngsters whoneeded special attention to succeed. Studies of teachers in high and low-performing (S) and (R) classes indicated some of the things that (S)conditions seemed to facilitate.
3

Education's Equivalent - revision-4/1/96
Other STAR-Related StudiesLBS researchers are still following STAR pupils and are analyzing the
test and other results. There have been two studies of student engagementand participation of STAR pupils (grades 4 and 8). Students are in grade 10in 1996. In grade 8, the last year for which we have analyzed data, the (S)pupils were still outperforming (R) and (RA) pupils in a statisticallysignificant manner, but differences among the groups were fading some after5 years of no "treatment."
In Project Challenge state policy persons provided funding so that 16 ofthe state's poorest systems could apply STAR finding and reduce class sizesK-3 to about 1:15. On average, the Challenge systems that started the 1:15treatment in 1989 ranked well below the state average performance 2 are now(1995) near or above the state average. This was a move from about anaverage of 99 in 1989 to 78 in reading in 1995 and from 85 to 56 in math onstate tests at grades 2, 3, and 4. Challenge is not an experiment; it is a policyapplication of experimental results. The way Challenge was phased inprovided some important information for future considerations. Mostimportant is the conclusion that the (S) treatment seems most useful if it isapplied as early as possible in a pupil's school experience. Small classesbeginning in K or grade 1 seem to prevent later school problems, but laterapplication of (S) apparently has limited remedial value.
Throughout STAR, LBS and Challenge the research team has kept thepositive cooperation of all "actors" in this study. The state has put modestfunding into the continuation. Local personnel have continued to assist indata collection. They have also helped researchers with some "ancillary"studies including dissertation research to answer new questions as they ariseand by assisting in the two participation studies by having teachers do specialdata collections. The STAR-related database is "on-line." The databaseincludes over 11,000 students, with key demographics, test scores, andrecords of schools attended, special services, etc.
Added Elements of CooperationAlthough we have not yet begun to "milk" the database, we do have
tentative answers to key questions. Our analyses continue to raise otherquestions. STAR's findings have also excited some continuing cooperationoutside of STAR's immediate legacy.
Two STAR-incited studied have added to the knowledge base and haveconfirmed STAR's results by achieving very similar effect sizes (ES) for small-
2 With 138 districts in the state, the average rank would be 69. A district ranked 70-138 wouldbe below average. For summary reporting purposes, we discuss the average rank of the 16Challenge districts and the improvement of that rank over time.
4
5

Education's Equivalent - revision-4/1/96
class gains. Success Starts Small (SSS) was a year-long observational studyin two schools matched except for K and grades 1 and 2 class sizes. Oneschool averaged 1:24; the SSS school averaged 1:14.
In Burke County, NC there was a "natural experiment" of youngsters ingrades 1-3 in classes of 1:17 and of 1:25 or so. Researchers from TN and NCworked with staff from a Regional Laboratory (SERVE) to analyze studentgains and teacher behaviors in 1:17 and 1:25 classes.
Results from these and the STAR studies are slowly getting into theresearch literature and generating interest in some states. At last count,leaders in about 15 states have, or are seriously considering, class-size ideasas part of state-wide education planning and legislation. This list may beincomplete: AZ, CA, FL, IL, IN, KY, NC, NE, NH, OK, TN, TX, UT, VA, WV.
Researchers from TSU are cooperating with researchers at theUniversity of London and with other groups to share and re-analyze thedatabase. The cooperation will expand the reanalyses using differentprocedures will provide added important findings.
Summary of FindingsWhat are we learning? Of greatest importance, we are able to show
definitively what many parents and teachers have long known. Small isbetter, especially in the early years of schooling. Better seems to be muchmore than simply better test score results (Hey, home-school supporters,private school people and even some education-for-pay people not only knowthis , they do small classes). Here are a few not-surprising findings, ortentative findings awaiting more detailed analyses:
Pupils in (S) outperform pupils in (R) and (RA) on all cognitive measuresand the early treatment lasts at least into grade 8 after the K-3 start.
Pupils in (S) have relatively fewer examples of poor discipline.
The (S) classes seem to overcome the known deleterious effects of bigschools.
Random assignment pupils [STAR (R) pupils] outperform non-randomassigned pupils K-3 [STAR Comparison (R) pupils).
Teachers have more on-task time in (S) than in (R) and this stays constantall year. In (R) the on-task behaviors decline over the year (tired teachersand kids. Burnout?).
There are relatively fewer retentions in grade in (S). This is not only bettereducation practice, but it could save money, and grade retention is closelyassociated with dropouts. If so, reducing retention in grade could be very
56

Educcaion's Equivalent - rcvision-4/1/96
efficient and help pay for smaller classes.
Students in (S) are more engaged and participative in school more thanare students in (R) and (RA). This may influence their staying in school tograduation.
The traditional test-score gap between white and non-white pupils doesnot open as much in (S) as in (R) and (RA). The merits of this will requireserious analysis, especially in the total structure of U.S. education.
Early identification of special needs in (S) seems to reduce later specialeducation placements. This may save much money for use in other ways.
Student scores in (S) are up in all tested areas, not just in targeted areascharacteristic of special projects (reading and math, usually). Thus (S) is abroad-scale change, not a bandaid (project), approach to improvingachievement.
It appears that "instructional" aides do not contribute much to pupil gains.Recall, however, that in STAR there was no special training of teachers oraides. Training may help, but without such training, students in K-3perform better in (S) than in (R) and better in (R) than in (RA) generally.Consider the implications of this, especially since the group that gets leastbenefit seems to be Black males, and teacher aides are commonly used asa remedial intervention in education.
The (S) treatment is more preventative than remedial. If a student doesnot experience 1:15 when first entering the "system," there is little gainunless educators use tutorials or expensive other "treatments."
Now What?Table 1 is a summary of some of the sources and authors that make up
the expanding STAR-related database. The few results identified here for thebenefits of (S) over the "regular" way are enough to point to an entirelydifferent plan for American education. STAR researchers do not advocatejust reducing class sizes , K-3, and continuing with education as usual. The K-3 start opens up new vistas for education restructuring. A resturcturing , ifyou will, built on data and driven by cooperation to see what progress is beingmade, and why. Wouldn't it be professional, for once, to point to asubstantive research base to support what we do or propose to do ineducation? Where, for example, are data to support many of the "fads" that
6

Education's Equivalent - revision-4/1/96
are "buzzwords" such as "TQM", or "technology"? 3 The research base isthere for class-size changes. Let's use it until substantive research providesequal or better results to guide change. Let's build change upon it. Now.
STAR's Comparison to Major Research in Another Field
Beginning in 1948 the federal government began supporting alongitudinal study of heart disease. The study involved no specific"treatment," but did build upon a carefully developed database that allowedgeneralizations to be made over time. The Framingham Heart DiseaseEpidemiology Study had, among other things, the following characteristics.(Table 2)
Table 2. Summary Description of the Framingham Heart Study*
Since 1948 he federal government's Framingham heart study has followed arepresentative sample of 5,209 adult residents in Framingham, Massachusetts.These people have been tracked using:
standardized biennial cardiovascular examination,
daily surveillance of hospital admissions,
death information, and
information from physicians and other sources outside the clinic.
* Information from varied corn uter-based sources.
3 Data do support some projects such as Success for All or Reading Recovery, but in manysettings, more than half of the pupils need special projects. The "bandaid" mentality ofadding projects will not provide the base for substantial education reform. A problem existshere because the researchers who developed the projects have a "product" to sell, andproducts are visible and glitzy.
78

Education's Equivalent - revision- 4/I/96
The objective has been to study the epidemiology of cardiovascular diseases --to learn the circumstances under which they arise, evolve and terminatefatally in the general population.
The Framingham study is designed to find out how those who developcardiovascular diseases differ from those who remain free of the diseases overa longer period of time.
To provide some idea of the size of the Framingham study and onedivision by demographics (male-female), consider Table 3 which showsinformation on the study population and sample. The study was set upbetween 1948 and 1950. The persons enrolled for the study ranged in agefrom 30 to 59 designated as a stratified random sample of residents ofFramingham, MA.
The following are excerpts from the six-year follow-up study of the originalFramingham Heart Study. (Kannel, Dawber, Kagan, Revotski, & Stokes,1961). When reading these items, think of terms used in education, such asdropout, early intervention, poverty, etc.
Because coronary heart disease (CHD) is often manifested as suddenunexpected death or "silent" infarction and since the immediate mortalityin those surviving to enter a hospital is still distressingly high in spite ofthe best therapeutic efforts, it appears that a preventive program isclearly necessary. (p. 30. Emphasis added.)
... it seems evident that efforts at prevention must begin many yearsbefore the appearance of clinical CHD. (p. 30)
This allows the identification of the coronary prone individual manyyears before the occurrence of clinically recognizable disease. (p. 30)
Multiple interrelated factors have been demonstrated to be associated withincreased risk development of CHD. (p. 30. Emphasis added.) [Considermultiple risk factors for at-risk children, such as poverty + race + one parent+ ... ?]
8 9

Education's Equivalent - revision-4/1/96
Table 3. Composition of Framingham Heart Study Group'
Total Men Women
Random Sample 6507 3074 3433
Respondents 4469 2024 2445
Volunteers 740 312 428
(TOTAL) (5209) (2336) (2873)
Respondents Free of CHD* 4393 1976 2417
Volunteers free of CHD 734
Total Free of CHD 5127 2283 2844Framingham Study Group
*Coronary Heart Disease. ( ) added to original table.
1Kannel, W. B., Dawber, T. R., Kagan, A., Revotskie, N., & Stokes, J., III. (1961, July-
December). Factors of risk in the development of coronary heart disease--six-year follow-upexperience: The Framingham Study. Annals of Internal Medicine, 55 (old series, vol. LIX).33-50. (p. 35). Table shown as Table 1 in original source.
9 1O
Education's Equivalent - revision-4/1/96
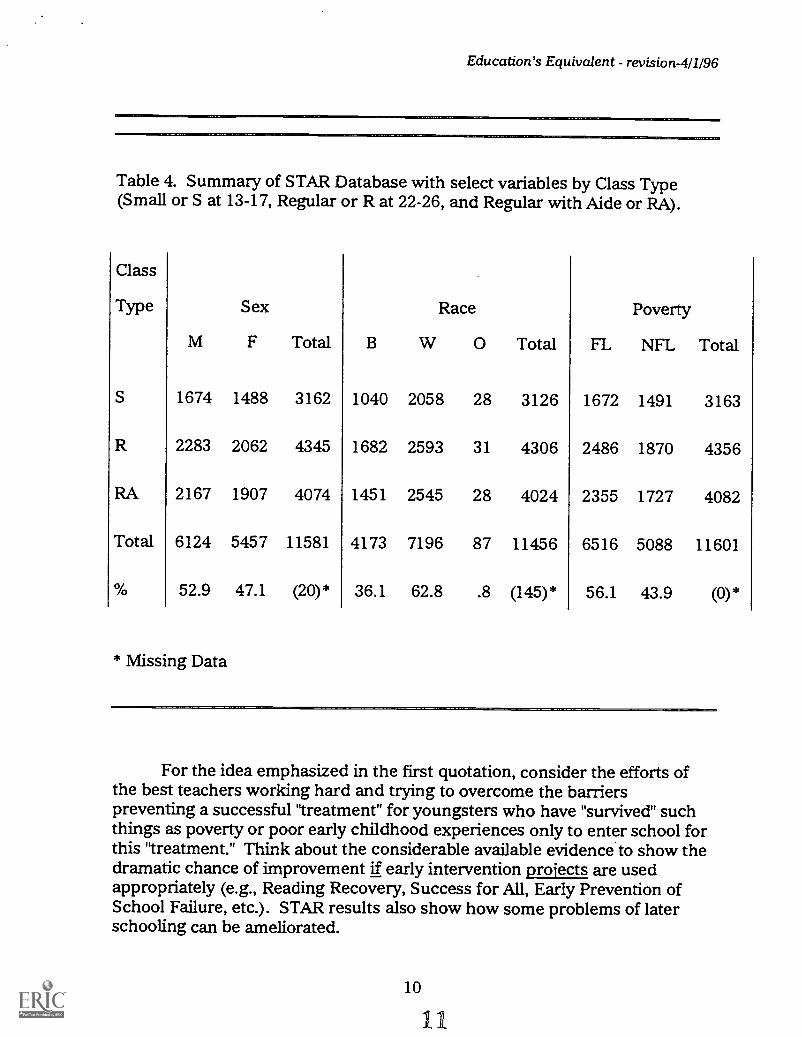
Table 4. Summary of STAR Database with select variables by Class Type(Small or S at 13-17, Regular or R at 22-26, and Regular with Aide or RA).
Class
Type Sex Race Poverty
M F Total B W 0 Total FL NFL Total
S 1674 1488 3162 1040 2058 28 3126 1672 1491 3163
R 2283 2062 4345 1682 2593 31 4306 2486 1870 4356
RA 2167 1907 4074 1451 2545 28 4024 2355 1727 4082
Total 6124 5457 11581 4173 7196 87 11456 6516 5088 11601
0/0 52.9 47.1 (20)* 36.1 62.8 .8 (145) * 56.1 43.9 (0)*
* Missing Data
For the idea emphasized in the first quotation, consider the efforts ofthe best teachers working hard and trying to overcome the barrierspreventing a successful 'treatment" for youngsters who have "survived" suchthings as poverty or poor early childhood experiences only to enter school forthis "treatment." Think about the considerable available evidence to show thedramatic chance of improvement if early intervention projects are usedappropriately (e.g., Reading Recovery, Success for All, Early Prevention ofSchool Failure, etc.). STAR results also show how some problems of laterschooling can be ameliorated.

.77 t 4/196L4-441.411 AM 7VCIZ rev -1/.
Table 4 includes data from Project STAR showing pupils (K-3) who hadat least one year of involvement in one of three class-type conditions: Smallclass or (S) of 13-17 pupils, Regular class or (R) of 22-26 pupils, or Regularwith Aide class or (RA). The STAR population was 11,601, or more than twicethe Framingham study. Table 4 shows distribution into race (B, W, 0), Sex(M, F) and Free Lunch (FL) or Not Free Lunch (NFL). Note that on thepoverty index, more than half of the pupils are "at risk." Since this is the case,should we expect that a program for at-risk students should be designed toreplace the present project mentality?
Noted demographer Harold Hodgkinson has identified poverty as themajor variable that impedes a pupil's school success. He also noted the highpercentages of minority pupils who are in poverty. Hodgkinson (1992) said:
Given that minorities are more likely to be in poverty than whites (mostpoor kids are white, although black and Hispanic kids have a muchhigher percentage of their total number poor) and given our look at thefuture, we might ask how schools are likely to fare with the clientele wehave isolated. The best guess would be -- reasonably well. . . . America'slowest 35 percent (in terms of school attainment) is truly awful, due tofactors that were present when they first knocked on the kindergartendoor. (Factors such as: poverty, out of wedlock birth, teen births,cocaine-addicted at birth, short of food and housing, born premature, areonly a few.) (p. 8. Emphasis added.)
Yet, educators must work with all youngsters who arrive at theschoolhouse door, regardless of their entering condition. (This in spite ofTQM's ideal of zero defect!) If pupils are "at risk" when they arrive at school,then educators must seek to remedy those problems as well as seeking toadvance the academic achievement agenda. Hodgkinson (1995) says that thebest predictor for school failure is poverty, a point echoed by others.
Cooley (1993) notes that in Pennsylvania just three variables (poverty,single-parent home, and parent not a high school graduate) account for over"60 percent of the variation in the average student performance" in the schooldistricts studied (p. 5). These districts also generally have fewer resources foreducation, making them acutely feel 'the difficulty of the educational task." Inother words, it is not that these pupils cannot learn, it is a question of addedtime and financial resources to address "the difficulty of the educational task."
Although small classes may seem like they will cost more than largerclasses, first impressions may be deceiving. Data from Project STAR,however, suggest that both retention in grade and the pesky test-scoreachievement gap between White and non-White students are ameliorated bystarting the students in their schooling experiences in small classes of
11
12

Education's Equivalent - revision-4/1/96
approximately 1:15 (e.g., Finn and Achilles, 1990; Robinson, 1990). Thissmall-class condition also improves the probability that students willparticipate more actively in positive aspects of schooling, and that suchparticipation improves the student's chances of obtaining positive test resultsand of not withdrawing from school (Finn, 1989). Finn (1993) also addressesthe role of multiple risk factors and the potential of the small-class conditionto help reduce the impact of these. The conditions mentioned here all poseavenues to reducing education costs and achieving added gains.
Table 5 shows the average score for student promotion fromkindergarten to grade 1 in Project STAR, using the appropriate level of theStanford Achievement Test (SAT) test battery, the SESAT. Notice that a childwith a score of 423, 424, 425, and 426 would, on average, be promoted in asmall class (S) but the same child would be retained in a regular class (R).
Tables 6 and 7 are based on results obtained on Tennessee's criterion-referenced test (CRT) built on the curriculum objectives. The Basic SkillsFirst (BSF) test had several items relating to each curriculum objective. Topass an objective, a student had to get correct responses on 3 of 4 (or 4 of 4)questions relating to the objective. Besides computing the percent passing, itwas also possible to tabulate the absolute number and percent of all BSFquestions that a student answered correctly.
Table 6 presents data on the percent of White and Black studentspassing the BSF. Notice the large difference (17.4) between Black studentperformance in (S) and in (R) and the relatively low absolute difference (4.1)in the performance when the Black and White students are compared in (S).Black students show a test-score deficit between (S) and (R) that is 2.4 timesthat of White students in the equivalent class-size condition.
Table 7 reports the percent of grade-one reading BSF items correct byclass type (S or R) by race at grade 1 both for Project STAR students who hadkindergarten (K) and those with no K Besides demonstrating the test-scorevalue of K, the results clearly show the differential and positive benefits toBlack students of starting school in a (S) kindergarten. Black students in (S)in (K) correctly answered 87% of the items for grade 1 correctly, and Blackstudents in (R) answered only 77% of the items correctly, a benefit of 10%favoring the (S) condition. White students in the (R) condition in (K)answered 86% of the grade-1 items correctly, and those in the (S) conditiononly were 2% better, at 88%. It is clear that by placing Black and Whitestudents in (R) classes (the usual practice in schools), an achievement gapopens and that gap does not open at grade 1 if both groups are put into the(S) condition by random assignment.

Education's Equivalent - revision-4/1/96
In Letters to a SERIOUS Education President, Sarason (1993) statesthat education can have one of two purposes, to repair and to prevent (p. 3).Until now educators have seemed to emphasize repair, using a hodge-podgeof bandaid-like projects geared to remediation, rather than emphasizing thepotential of education to prevent through an improved program base. Thesort of information presented here from Project STAR would clearly triggerchanges in medicine. Based on results emphasizing prevention of CHD,doctors have been urging better lifestyles, improved diets, and increasedexercise (among other things). There have been marked improvements inpreventing and in treating CHD. And, in education, what action haveeducators taken on at least equivalent data?
13 14

Education's Equivalent - revision-4/1/96
SELECTED REFERENCES
Cooley, W. W. (1993, May). The Difficulty of the Educational Task.Pittsburgh, PA: University of Pittsburgh, Educational Policy Studies,#16.
Dawber, T. R (1980). The Framingham Study: The Epidemiology ofAtherosclerotic Disease. Cambridge, MA: Harvard University Press.
Finn, J. D. (1989, Summer). Withdrawing from school. Review ofEducational Research, 59 (2), 117-142.
Finn, J. D. (1993). School Engagement and Students at Risk. Washington,DC: Department of Education, OERI. NCES 93-470.
Finn, J. D., & Achilles, C. M. (1990, Fall). Answers and questions about classsize: A statewide experiment. American Educational Research Journal,27 (3), 557-577.
Finn, J. D., & Cox, D. (1992, Spring). Participation and withdrawal amongfourth-grade pupils. American Educational Research Journal, 29 (1),141-162.
Hodgkinson, H. (1992). A Demographic Look at Tomorrow. Washington,DC: Institute for Educational Leadership.
Hodgkinson, H. (1995, October). What should we call people? Race, class,and the census for 2000. Phi Delta Kappa, 77 (2), 173-179.
Kannel, W. B., Dawber, T. R., Kagan, A., Revotskie, N., & Stokes, J., III.(1961, July-December). Factors of risk in the development of coronaryheart disease--six-year follow-up experience: The Framingham Study.Annals of Internal Medicine, 55 (old series, vol. LIX). 33-50. (p. 35).Table show as Table 1 in original source.
Mc Masters, L. (1994-1995). Importance of a school-based pre kindergartenprogram to achievement and school success. National Forum ofTeacher Education Journal, 4 (1), 49-54.
Mosteller, F. (1995, Summer/Fall). The Tennessee study of class size in theearly school grades. The Future of Children: Critical Issues forChildren and Youths, 5 (2), 113-127.
14 15

Education's Equivalent revision-411/96
Sarason, S. B. (1993). Letters to a SERIOUS Education President. ThousandOaks, CA: Corwin Press.
Word, et al. (1990). Project STAR Final Report. Nashville, TN: TennesseeState Department of Education.
References, etc. are available.
Numerous articles, papers, and reports of class-size research areavailable through ERIC (using as authors Achilles, Bain, Boyd-Zaharias, Finn,Nye, or some of the other authors shown in Table 1 for material that is STARrelated). The RPC/TSU also has available a bibliography of STAR, otherclasssize and related articles and research report. For a small fee, materials areavailable directly from RPC/FSU, as noted on the cover of this summary.

Education's Equivalent - revision-411/96
Table 1. Samples of Studies Derived from and Building upon the STARInitiative Classed as "Subsidiary" (directly from STAR), "Ancillary" (buildingon and using STAR database) and "Related" (triggered by STAR results andusually involving STAR researchers).
CATEGORY, TITLE & PURPOSE
Subsidiary Studies
Lasting Benefits Study to follow STAR pupils
Project Challenge (TN)
Participation on Grades 4, 8
Ancillary Studies (Use or extend STAR data. Some
of these are dissertations.)
Retention in Grade
Achievement Gap
Value of K in Classes of Varying Sizes
(tests scores)
School-Size and Class Size Issues
Random v. Non-Random Pupil Assignment and
Achievement
Class Size and Discipline in Grades 3,5,7
Outstanding Teacher Analysis
(top 10% of STAR teachers)
Related Studies
Success Starts Small: Grade 1 in Chapter 1 (1:14,
1:23) Schools, Burke Co., NC
DATE(S)
1989-Present
1989-Present
1990, 1994
1994
1994
1985-1989
1985-1989
1985-1989
1989,1991,1993
1985-1989
1993-1995
AUTHOR(S) OR PUBLICATION
Nye et al., 1994
Nye et al., 1994, Voelkl, 1995
Finn, 1989
Finn and Cox, 1992
Harvey, 1994
Bingham, 1993
Nye et al., 1994-1995
Nye, K., 1995
Zaharias, 1995
In Process, Hibbs.
Bain et al., 1992
Achilles et al., 1994
* is is no comp e e. prove es samp es o i e types o s es one. o au i ors appear in t ere erences
in the exact way listed here. This table appears in several STAR reports in substantially this same form.

Education's Equivalent - revision-4/1/96
Table 5. Average scores for promotion/retention by class type for STAR,Kindergarten to Grade 1. (Scores on SESAT.)
S R Difference Favoring (S)
Promote
Retain
Range*
441
422
19
435
427
8
6
5*
* A pupil with a score of 423, 424, 425, 426 will be retained in Regular classbut the same pupil will be passed to the next grade in a Small class, onaverage.
Table 6. Average Percent of Pupils Passing BSF Reading: Grade 1, STAR
Class TypeDifference
(S-R) orStatus Grade Small Reg. (S) Average
Minority 1 65.4% 48.0% 17.4
Non-Minority 1 69.5% 62.3% 7.2
Difference * 4.1% 14.3%
* Results suggest that the usual practice of "Regular" classes opens theachievement gap between Black and White pupils early in schooling. InSTAR the "Regular" classes may have been smaller than the U.S. average; theywere about 23 pupils.
17 is

Education's Equivalent - revision-4/I/96
Table 7. Percent by class type, Race (BL/WH), of BSF items correct, grade 1with K and without K (rounded).
BSF Grade 1 Reading (% Correct)
With K No K DIFF
White S 88 85 3
R 86 80 6
Diff 2 5
RA 86 82 4
Black S 87 79 8
R 77 74 3
Diff 10 5
RA 79 77 2
Difference by Race by Class Type
W-B S
R
RA
1 6
9 6
7 5
* Note that (K) is a benefit to pupil scores by grade 1, and that if both Blackand White pupils are randomly placed in Small classes (1:15) the achievementgap is very small when compared to the difference in Regular classes of about1:23.

Education's Equivalent - revision-4/1/96
AUTHOR NOTES
The National Education Longitudinal Study (NELS) database may be amore true comparison with the Framingham Heart Study than STAR sinceNELS is not involved in "treatment," but only in collecting data and instudying status vis-a-vis post hoc issues.
The forthcoming national Early Head Start (EHS) study will have largeamounts of data from both experimental (various EHS treatments) andcontrol youth and families. This has the potential to extend NELS downwardto ages 1-4 (the Control group) and also to extend the Perry Preschool, HeadStart, STAR, etc. results of early treatment (the various EHS treatmentsinvolved will be the experimental base).
The author, however, contends that STAR and similar databases shouldnot only provide outstanding education research opportunities, but that theSTAR data should be used as a base for program (vs project) restructuring ofeducation.
The author appreciates the library research assistance of Billie Rohl, thetyping of Marcie Kennedy, and the suggestions of Susan Hoover, Ed.D. Anyglitches, however, are the author's.
2019

U.S. Department of EducationOffice of Educational Research and Improvement (OEM)
Educational Resources Information Center (ERIC)
REPRODUCTION RELEASE
I. DOCUMENT IDENTIFICATION:
(Specific Document)
ERIC
Title: Eciceca /71,2 4, teit 47. /"'1,110'41
Cfr-t/47Author(s): (40 dic )344. z f://00/..
Corporate Source: Publication Date:
sbe/f..6
II. REPRODUCTION RELEASE:In order to disseminate as widely as possible timely and significant materials of interest to the educational community, documents announced
in the monthly abstract journal of the ERIC system, Resources in Education (RIE), are usually made available to users in microfiche, reproduced
paper copy, and electronic/optical media, and sold through the ERIC Document Reproduction Service (EDRS) or other ERIC vendors. Credit isgiven to the source of each document, and, if reproduction release is granted, one of the following notices is affixed to the document.
If permission is granted to reproduce and disseminate the identified document, please CHECK ONE of the following two options and sign at
the bottom of the page.
4Check here
For Level 1 Release:Permitting reproduction inmicrofiche (4' x 6" film) orother ERIC archival media(e.g., electronic or optical)and paper copy.
Signhere-->please
The sample sticker shown below will beaffixed to all Level 1 documents
PERMISSION TO REPRODUCE ANDDISSEMINATE THIS MATERIAL
HAS BEEN GRANTED BY
TO THE EDUCATIONAL RESOURCESINFORMATION CENTER (ERIC)
Level 1
The sample sticker shown below will beaffixed to all Level 2 documents
PERMISSION TO REPRODUCE ANDDISSEMINATE THIS
MATERIAL IN OTHER THAN PAPERCOPY HAS BEEN GRANTED BY
`9
e\cc
TO THE EDUCATIONAL RESOURCESINFORMATION CENTER (ERIC)
Level 2
Documents will be processed as indicated provided reproduction quality permits. If permissionto reproduce is granted, but neither box is checked, documents will be processed at Level 1.
4MC II
Check hereFor Level 2 Release:Permitting reproduction inmicrofiche (4" x 6" film) orother ERIC archival media(e.g., electronic or optical),but not in paper copy.
Signatu
"/ hereby grant to the Educational Resources Information Center (ERIC) nonexclusive permission to reproduce and disseminatethis document as indicated above. Reproduction from the ERIC microfiche or electronic/optical media by persons other thanERIC employees and its system contractors requires permission from the copyright holder. Exception is made for non-profitreproduction by libraries and other service agencies to satisfy information needs of educators in response to discrete inquiries."
TiTgizatIonlA ress:
Coliele fiGoe. E. Ae4,f..,
YpSi &46./ 747C 1:44i y/77
Printed Name/Position/Title;,
C-41/ /1e-Adies, rnrephone:
30 YY9 azys--FAX:
3/3 ST7E-Mail Address:
c,daes e_ich
Date:
r/27/e(over)