in-field charcoal stove emission factors and indoor air ... filein-field charcoal stove emission...
TRANSCRIPT

In-field charcoal stove
emission factors and
indoor air pollution in Nairobi, Kenya
Michael Johnson1, Nick Lam2, Todd Wofchuck2, Rufus Edwards1, and David Pennise2
1 School of Medicine, University of California, Irvine, California2 Berkeley Air Monitoring Group, Berkeley, California

Introduction
• Kenya’s household energy sources are like much of Sub-Saharan Africa and the rest of the developing world– Kerosene: 5.9 million homes
– Charcoal: 2.8 million homes
– Fuelwood: 4 million homes
(HEDON 2008)
• Much potential to reduce greenhouse gas emissions and exposure to health damaging pollutants by promoting a switch to cleaner burning fuels and improved stoves
Purpose
• Determine in-field emission factors for charcoal
stoves (in realistic household settings)
– CO2, CH4, total non-methane hydrocarbons (TNMHC),
CO, PM, SO2
– Compare to IPCC default emission factors and other
laboratory test data
• Simultaneously measure indoor air pollution
levels (during charcoal stove use)
– CO, PM2.5, SO2, HCHO (formaldehyde)
– Compare to WHO and US EPA guidelines
Methods: Overview & Design
• 4 households
– 3 controlled cooking tests (ugali)
– 1 typical evening meal
• New Jiko improved charcoal stove and charcoal given to each household
– lit for at least 3 hours the day before testing to
volatize any residual water and other volatile
compounds in the stove

Methods: Emissions Sampling• Emissions collected directly above stove using a 3-pronged
aluminum sampling probe (Johnson et al., 2009)
• 3-sided aluminum curtain placed around the stove to minimize impacts from air currents
• Sample split into two lines:
– 1 leading to an emission sample collection bag
– 1 to a real-time CO-CO2 monitor, followed by a SO2 monitor• A simultaneously collected sample was used to correct
emissions for background concentrations in the kitchen
• Small aliquots of the emissions and kitchen background samples transferred to metal-coated multilayer Tedlar (MMT) bags
– GC analysis of CO2, CO, CH4, and TNMHC (UC Irvine)
• Teflon filters inserted in-line to determine PM emissions

Methods: CO2-equivalent Emissions
•– GWPi is the 100 year global warming potential
for each gas (relative to CO2)
– GHGi is the molar quantity of each greenhouse gas emitted
– CO2e(full): CO2 (1), CH4 (25), CO (1.9), TNMHC (4.1) (IPCC 1990; IPCC/Solomon 2007)
• Black carbon analyses pending
– CO2e(Kyoto): CO2 (1), CH4 (25)
∑ ×= ii2 GHGGWPeCO

Methods: Indoor Air Measurements
• Simultaneous with emissions measures
• Instruments installed 1.0 meter (m) from the center of the stoveand 1.5 m above the ground
• PM2.5: Real-time (TSI DustTrak 8520) and pump and filter sampling
• Real-time SO2: RKI SC-01 (RKI Instruments, USA)
• Real-time CO: Draeger PAC III (Draeger, Germany). • HCHO (formaldehyde): collected with Waters Sep Pak
aldehyde cartridges (Waters Corp., USA); analyzed by HPLC by Berkeley Analytical Associates (Berkeley, CA, USA)
• Statistical analyses performed on SAS version 9.1 using general linear models (Proc GLM) with repeated measures, when appropriate, to account for repeated tests within the same households
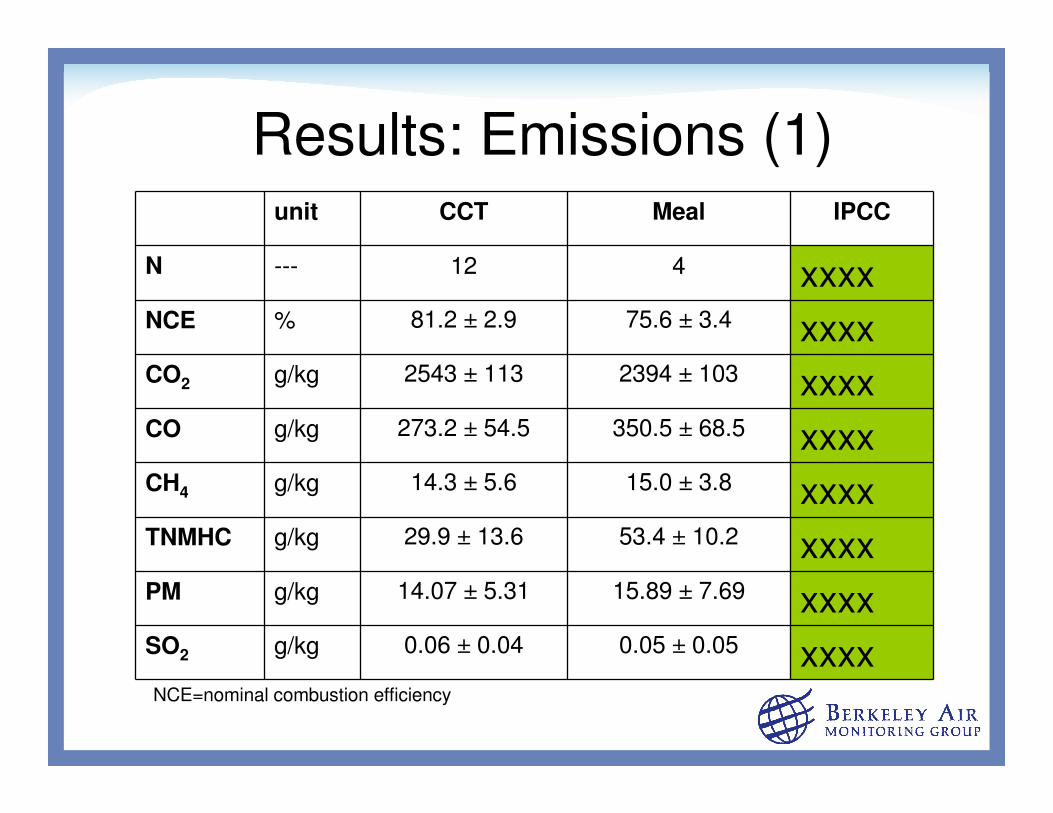
Results: Emissions (1)unit CCT Meal IPCC
N --- 12 4 xxxxNCE % 81.2 ± 2.9 75.6 ± 3.4 xxxxCO2 g/kg 2543 ± 113 2394 ± 103 xxxxCO g/kg 273.2 ± 54.5 350.5 ± 68.5 xxxxCH4 g/kg 14.3 ± 5.6 15.0 ± 3.8 xxxxTNMHC g/kg 29.9 ± 13.6 53.4 ± 10.2 xxxxPM g/kg 14.07 ± 5.31 15.89 ± 7.69 xxxxSO2 g/kg 0.06 ± 0.04 0.05 ± 0.05 xxxxNCE=nominal combustion efficiency
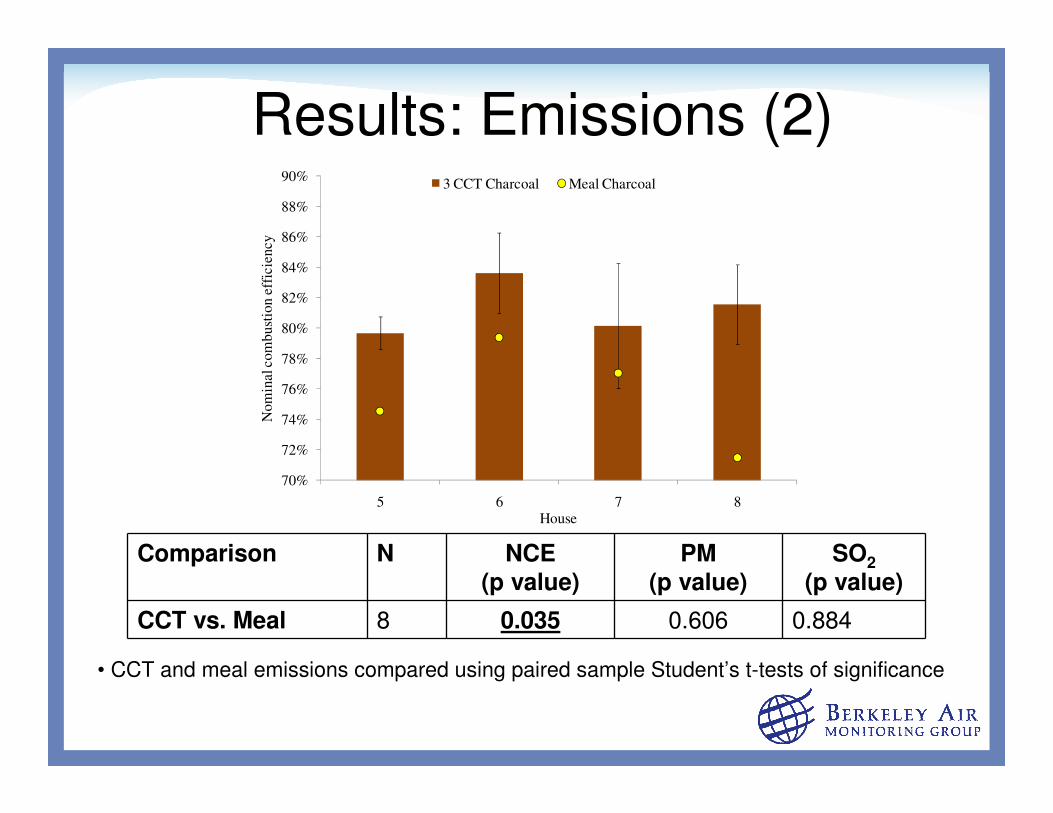
Results: Emissions (2)
Comparison N NCE
(p value)
PM
(p value)
SO2
(p value)
CCT vs. Meal 8 0.035 0.606 0.884
• CCT and meal emissions compared using paired sample Student’s t-tests of significance
70%
72%
74%
76%
78%
80%
82%
84%
86%
88%
90%
5 6 7 8
Nom
inal com
bust
ion
eff
icie
ncy
House
3 CCT Charcoal Meal Charcoal
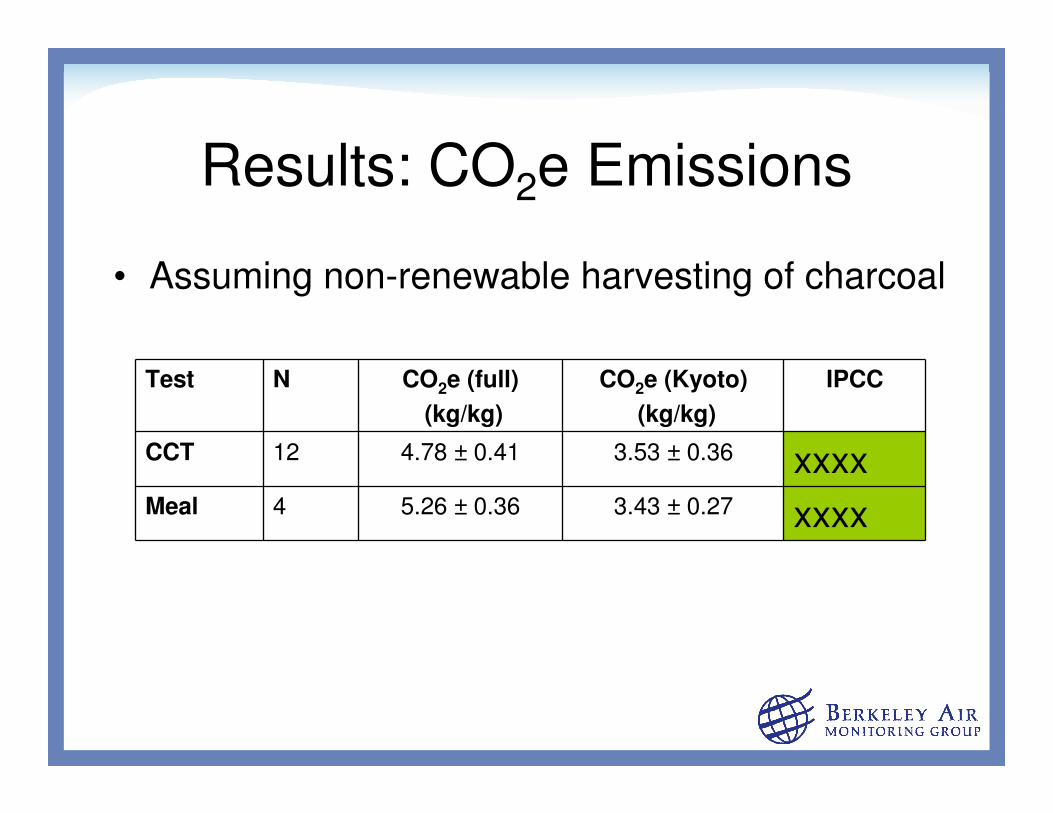
Results: CO2e Emissions
• Assuming non-renewable harvesting of charcoal
Test N CO2e (full)
(kg/kg)
CO2e (Kyoto)
(kg/kg)
IPCC
CCT 12 4.78 ± 0.41 3.53 ± 0.36 xxxxMeal 4 5.26 ± 0.36 3.43 ± 0.27 xxxx
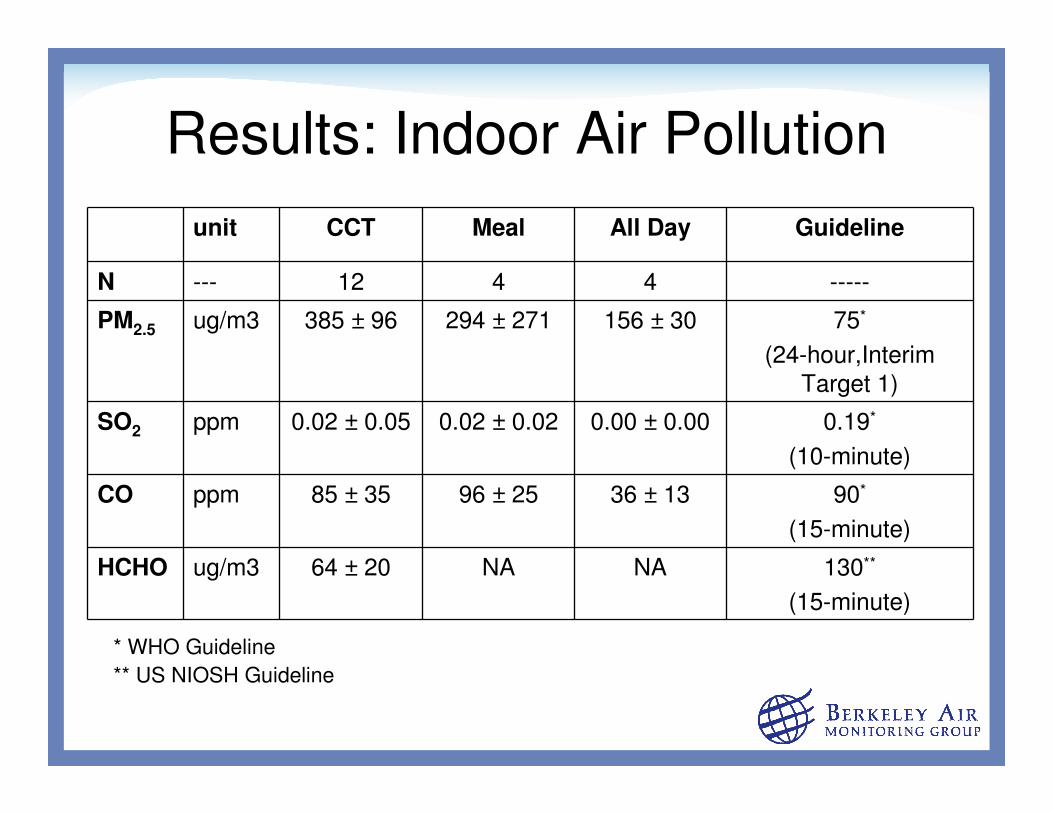
Results: Indoor Air Pollution
* WHO Guideline
** US NIOSH Guideline
unit CCT Meal All Day Guideline
N --- 12 4 4 -----
PM2.5 ug/m3 385 ± 96 294 ± 271 156 ± 30 75*
(24-hour,Interim
Target 1)
SO2 ppm 0.02 ± 0.05 0.02 ± 0.02 0.00 ± 0.00 0.19*
(10-minute)
CO ppm 85 ± 35 96 ± 25 36 ± 13 90*
(15-minute)
HCHO ug/m3 64 ± 20 NA NA 130**
(15-minute)
Results: Comparison Between
Emissions and Indoor Air Pollution
• ** chart to come: showing PM, SO2, and CO emissions vs. IAP **

Discussion
• In-field emission factors vs. IPCC default values…
• Indoor air concentrations vs. guidelines…
• CCT vs. typical meals…
• Emissions vs. IAP…