improving public sector service delivery: the importance
TRANSCRIPT

Improving Public Sector Service Delivery: TheImportance of Management
Sabrin Beg, Anne Fitzpatrick, and Adrienne M. Lucas∗
August 29, 2021
Abstract
Deficient public sector management in developing countries can constrain servicedelivery due to the complementarity between manager and worker effort. Through a210 school randomized controlled trial we compare T1) training teachers and managersin differentiated instruction (teaching at students’ learning levels) and providing man-agers a classroom practices checklist; T2) T1 plus training on managerial best practicesfocused on “People Management”; and a control group. Both interventions equally in-creased standard measures of school management focused on instructional practices andstudent test scores 0.11SD, 30 percent of a learning-year. T2 differentially improvedstandard measures of People Management but not productivity. The simple, objectivechecklist increased the impact of teacher training relative to other similar trainings.One year later, the interventions had persistent effects on management quality withoutadditional training.
JEL Codes: H40, I25, I28, M53, M54, O15, O43
Keywords: managers, management, education, primary school, targeted instruc-tion, teaching at the right level, external validity, differentiated instruction
∗Beg: Department of Economics, University of Delaware. Fitzpatrick: Department of Economics, Uni-versity of Massachusetts Boston. Lucas: Department of Economics, University of Delaware, 419 PurnellHall, Newark, DE 19716, CGD, J-PAL, and NBER. [email protected]. 302.831.1901. We gratefully ac-knowledge generous funding for the evaluation from the World Bank Strategic Impact Evaluation Fund andUNICEF. Moussa Blimbo, Annie Duflo, Willa Friedman, Rebecca Thornton, and Sharon Wolf contributedto early stages of project development. For useful comments and suggestions, we thank Noam Angrist,Jim Berry, John Floretta, Seema Jayachandran, Chris Karbownik, Ken Leonard, Heidi McAnnally-Linz,Stephen O’Connell, Jenny Perlman and seminar participants at Emory University, the International FoodPolicy Research Institute, Princeton University, the University of Delaware, the University of Michigan, theUniversity of Pittsburgh, and the University of Vermont. For excellent research management and assistanceand policy-maker engagement we thank Henry Atimone, Renaud Comba, Bridget Gyamfi, Joyce Jumpah,Edward Tsinigo, and the entire Innovations for Poverty Action Ghana team. This would not have beenpossible without our government partners at the Ministry of Education and Ghana Education Services.

1 Introduction
Public service provision in developing countries is often deficient. Specifically in education,
the stark differences between countries in the amount of education students acquire per
year of schooling demonstrate the variation in productivity levels between countries and
the lack of productivity in some countries. Obvious evidence of low quality management
in schooling includes teachers and principals being frequently absent, many teachers who
are present are not teaching, and schools have substantial year over year teacher turnover.
Management quality is correlated with more productivity both in the private (e.g. Bloom
and Van Reenen 2007; Hsieh and Klenow 2009) and public sectors (Rasul and Rogger 2018;
Tsai et al. 2015; Bloom et al. 2015; Lemos and Scur 2016; Crawfurd 2017; Lemos et al.
2021) yet most evidence on improving management is from the private sector. Many tools
used to improve productivity in the private sector are unavailable in the public sector–public
sector management is constrained by rigid hierarchies and pay structures, weak incentives,
and limited scope for hiring and firing. Yet, given the likely complementarity between
worker and management effort as in the private sector, inadequate public sector management
both suppresses existing productivity and reduces the likelihood that promising reforms
are implemented correctly. This paper focuses on both frontline civil servants and their
managers and asks two related questions about public sector management: 1) can public
sector managerial capacity be increased? 2) what changes in managerial skills are most
salient to combine with working training to improve productivity?
To answer these questions we partnered with the Ministry of Education in Ghana to
create a three armed randomized controlled trial (RCT) focusing on the relative and absolute
importance of three aspects of management–Instructional Management, People Management,
and Other Management, three aspects highlighted in the World Management Survey (WMS)
(Bloom et al. 2015). Instructional Management focuses on what happens in the classroom,
People Management measures how the teaching and supervisory agents interact, and Other
Management encompasses additional management tasks that are not directly related to
1

instruction or supervision.
The treatments reflected the realities, confines, and interests of the Ghanaian educa-
tion sector and were randomized across 210 schools in 20 districts across 8 of 10 regions
of Ghana during the 2018-2019 academic year. In Treatment 1, teachers received training
in and materials for differentiated instruction (teaching students at their learning level in-
stead of grade level across three primary school grades). Additionally, school principals and
supervisors received guidance to improve their basic management. They attended the dif-
ferentiated instruction training and were encouraged to support their teachers by observing
teaching and completing a check-list that highlighted the elements of differentiated instruc-
tion. Together this intervention focused on the Instructional Management elements from the
WMS–standardization of instructional planning processes, personalization of instruction and
learning, data-driven planning and student transition, and performance tracking. Treatment
2 had all the components of Treatment 1 plus an additional, multiple-day enhanced manage-
ment training and associated materials for principals and supervisors that focused on People
Management–mentoring and improving the collaborative nature of their relationships with
teachers. The final group was the control group that continued with business as usual. All
material design and distribution and training was implemented by existing government civil
servants under the Ghanaian Ministry of Education umbrella.
Both interventions increased management quality, improved classroom operations, and
increased student test scores. Both interventions increased the Instructional Management
index by 0.4 standard deviations (SD) relative to the control group. The intervention that
included the enhanced management training increased the People Management index by
about 0.6SD relative to the control schools and twice the increase in the intervention that
did not include Enhanced Management training. Finally, aspects of Other Management
increased equally across the two arms even though they were not specifically covered in
the training but could readily follow when managers were more engaged. Therefore, the
management components of two interventions were effective.
2

The two interventions resulted in more engaged principals, teachers, and students and
teachers implemented the program in their classrooms. These changes to school and class-
room operations were approximately equal across the two interventions, even though the
intervention with enhanced management differentially improved the People Management
Index. Principals were about 11 percentage points (26 percent) more likely to be present,
teachers were about 12 percentage points (18 percent) more likely to be in the classroom and
17 percentage points (37 percent) more likely to be engaged with students, and classrooms
were more student-centered with a 17 percentage point (35 percent) increase in the likelihood
that a student spoke during an observation. About 60 percent of schools had divided their
students by learning levels across three primary grades during unannounced visits. The in-
terventions further changed the teachers’ and principals norms–teachers were less accepting
of shirking by their peers and principals, and.principals held teachers to higher standards.
Perhaps due to increased effort or expectations, teachers in the intervention that included
enhanced management reported a higher incidence of work related stress and burnout.
After approximately one year of exposure to this intervention, student test scores in-
creased by about 0.11 SD on a combined test of mathematics and English that included
both grade level and foundational material. Relative to the control group, this was an ad-
ditional one third of a year of schooling. When considering the subjects separately, math
scores increased about 0.13 SD and English scores increased about 0.07 SD. Across all the
two interventions, the point values are very similar (at most 0.01SD different), and we fail
to reject that the two interventions had the same effect.
Implementation persisted in the school year after the intervention even in the absence
of additional materials and limited training for only one teacher per school. Because the
intervention required teachers of three grades to work together and new teachers would not
have been centrally trained, the leadership and support of the principal was more important
in this second year. In this year in which only school leaders and supervisors provided
support, about 40 percent of schools divided their students by learning level for part of the
3
school day, 70 percent of the year 1 effect, equal across both treatments. The persistence of
the intervention again points to the importance of Instructional Management.
We attribute these improvements in management, operations, and test scores to the
complementarity between management and teacher training–a previous intervention that
provided a similar training only to teachers did not improve learning after one year (Duflo,
Kiessel, and Lucas 2021). Therefore, improvements in Instructional Management generated
by the combination of training in differentiated instruction and basic management appear
key to improving student learning.
In addition to its policy relevance, our paper makes three related contributions to the
economics literature. First, in contribution to the literature on public sector management,
the intervention improved school management and shows that, while both are correlated
with baseline student test scores, Instructional Management is more important for student
learning than People Management. In the private sector, firms with more effective manage-
ment are more productive (e.g. Bloom and Van Reenen 2007; Hsieh and Klenow 2009; see
summary in Bloom and Van Reenen 2011). Further, consulting firms can increase private
sector firm productivity (Bloom et al. 2013; Bloom et al. 2018; Bruhn et al. 2018). Consid-
ering public sector entities as firms is a more recent literature, which similarly started with
correlations–higher quality management practices were associated with the more project
completion (Nigerian Civil Service) or higher quality outcomes (hospitals in the US and
England) (Rasul and Rogger 2018; Tsai et al. 2015). Specifically in education, our estimate
of a 1SD increase in management quality being correlated with a 0.15SD higher student
test scores is in the middle of previous estimates of 0.06 to 0.4SD higher test scores across
other countries (Bloom et al. 2015; Lemos and Scur 2016; Crawfurd 2017; Lemos et al.
2021). Few papers attempt to change management quality in the public sector. A 2017
systematic review found no studies that trained the managers of front-line civil servants in
developing countries (Finan et al. 2017).1 Recent studies have sought to improve school
1The evidence in developed countries is further scant and often involves massive (300 hour) time invest-ments (Fryer 2017).
4

management improvement through the outsourcing of management to private sector firms
(Romero, Sandefur, and Sandholtz 2020), creating coaching or training layers parallel to the
existing system (Cilliers et al. 2020a; Cilliers et al. 2020b), lengthy programs provided by
international foundations (Ganimian and Freel 2020), or encouraging continuous assessment
and/or school improvement plans (de Hoyas et al. 2019; Berry et al. 2020; Muralidharan
and Singh 2020). We show that increasing management quality within existing systems is
possible and that a classroom observation checklist was as effective in increasing student test
scores as a more elaborate multi-day management training even though the more general
management training differentially improved management quality.
Second, we show the complementarity of providing teachers with training in superior
teaching methods, in this case differentiated instruction, and improving school management.
When implemented within existing government management and supervision structures, pre-
vious studies found training in and materials for differentiated instruction led to no increase
in test scores after one year (Banerjee et al. 2017; Duflo, Kiessel, and Lucas 2021). Our
effect sizes are similar in magnitude to the version implemented under careful NGO super-
vision (Banerjee et al. 2017). As with teacher training alone, others have found that neither
capacity building workshops nor development of school improvement plans improved stu-
dent test scores after one year (de Hoyas et al. 2019; Muralidharan and Singh 2020).2 This
complementarity between teacher training and management engagement has implications for
scaling other successful NGO or researcher-initiated programs, particularly differentiated in-
struction, which is currently being implemented in ten different African countries in addition
to Ghana, affecting 70 million school children at scale (TaRL 2020).
Third, the entire intervention from the design of the materials to the implementation was
undertaken by the government showing that existing government structures have spare capac-
ity and can take effective programs to scale with sufficient political will without outsourcing
to private providers or NGOs. Expanding access to effective programs through government
2de Hoyas et al. (2020) found positive effects on student passing rates and reduction in failure rates twoyears after the conclusion of a two year performance management intervention.
5

implementation is neither trivial or obvious. Well-designed programs may prove effective
when implemented at a smaller scale, but a scaled-up government-led implementation is
both more complicated and necessary for these program to achieve broader impact (Mu-
ralidharan and Niehaus 2017; Bold et al. 2018). Previous attempts to scale NGO-initiated
education programs within existing systems have shown the challenges of government im-
plementation (Banerjee et al. 2017; Bold et al. 2018; Muralidharan and Singh 2020). In
other contexts, bureaucratic inefficiencies and limitations to state capacity in program imple-
mentation are broadly documented (Muralidharan, Niehaus, and Sukhtankar 2016). Vivalt
(2020) confirms that across studies, government-implemented programs have smaller effect
sizes than those implemented by academics or NGOs. Lack of capacity, support structures,
and systems of accountability influence the state’s ability to deliver efficient and effective
services (Finan, Olken, and Pande 2017). Ghana’s government effectiveness based on the
Worldwide Governance Indicators is above the average for sub-Saharan Africa, but below
that of India’s and the worldwide median (World Bank 2018). Therefore, we do not claim
that something is particularly special or effective about the government of Ghana, instead
that this program was broadly embraced and integrated into the education system instead
of being seen as an outside imposition.
2 Background on the Ghanaian Education Sector
As with many other countries, Ghana is beset with the challenge of heterogeneous class-
rooms and low average student achievement (Glewwe and Muralidharan 2016; Ministry of
Education 2018; Dulfo, Kiessel, and Lucas 2021). Primary schools in Ghana are grades 1
(P1) through 6 (P6). In primary schools teachers are classroom teachers, teaching all sub-
jects to their assigned students. This intervention focuses on upper-primary grades, grades 4
through 6. After completion of grade 6, students continue to Junior High School for grades
JHS1 through JHS3, similar to grades 7 through 9 in the US. Government schools should
not charge tuition. At the conclusion of JHS3, students can continue on to secondary school
6

for an additional three years in either an academic or vocational track. The official language
of instruction is English starting in grade 4.3
At the time of the intervention, the Ghanaian school year started in mid-September and
ended in late July. Each school year is divided into three 12-14 week terms with 25 days of
holidays before Terms 2 and 3.
Government primary schools in Ghana are under the purview of Ghana Education Ser-
vices (GES), a Ministry of Education (MoE) agency that is responsible for the implementa-
tion of all pre-tertiary educational policies in Ghana. Government primary school teachers
are employed centrally by GES who assigns each teacher to a specific school and is respon-
sible for all teacher transfers between schools. A head teacher, known as a school principal
or school leader in other contexts, oversees each school. Head teachers are almost always
previous classroom teachers. Most do not have any additional formal training prior to be-
coming a head teacher and 28 percent never had any principal-specific training prior to this
intervention. Each school belongs to a circuit of approximately 9 geographically proximate
schools, overseen by a circuit supervisor. As with head teachers, circuit supervisors are al-
most always previous teachers and, like head teachers, receive almost no additional formal
training. Circuit supervisors act as liaisons between the school and the District Education
Office.
3 Intervention
A school based intervention can target managers (i.e. principals), workers (i.e. teachers),
neither, or both. Most studies to improve classroom activities focus on teachers while pro-
viding strong management support from an NGO or a research team. Those studies that
have focused exclusively on teachers without additional support have not improved learning
after one year, including those with a similar pedagogy design in Ghana and India (Banerjee
3In lower primary school, the official language of instruction is the National Literacy Acceleration Program(NALAP) language assigned to each school. The NALAP languages are assigned at geographic units largerthan a school and do not always match the actual local language of the school.
7

et. al 2017; Duflo, Kiessel, and Lucas 2021). Similarly, those that have focused exclusively
on management have not improved learning after one year (Karthik; Ganimian;). Therefore,
the salient interventions are one in which both managers and workers are engaged, lever-
aging the potential complementarity between these layers of the civil service.4 We test the
effect of two different versions of a combined principal and teacher intervention relative to
each other and a control arm. All material development and training occurred using existing
government personnel and systems. We briefly describe each treatment below. Appendix
sub-section A.1 contains additional details.
3.1 Treatment 1–Differentiated Instruction + Basic Management
Differentiated Instruction
Teachers, head teachers, and circuit supervisors received training in and materials to
implement differentiated instruction. To implement differentiated instruction at the start of
each term, teachers in grades 4 through 6 were to test students in both English and math
using a simple tool, modeled after the annual status of education report (ASER) assessment
in India, that determined students’ learning levels. For one hour each day, four days per
week, 8 weeks per term, the teachers of grades 4 through 6 were to divide their students by
learning level instead of grade level, differentiating their instruction based on the learning
level of the student instead of the grade level.5 The intervention particularly emphasized the
importance of foundational skills on which grade-level competencies could be built. It also
encouraged student engagement rather than rote, passive memorization. The teaching and
learning materials supported a more active, learner centered teaching practice, but were not
scripted lessons.
Basic Management
4More formally, consider an intervention that can target workers (w) or managers (m) with each inter-vention denoted as (w,m). An exhaustive program design would be (0, 0), (1, 0), (0, 1) and (1, 1). Studieshave shown that (1, 0) without additional external support is ineffective. Similarly (0, 1) has also been showto be ineffective. Therefore we focus on two versions of (1, 1) relative to each other and (0, 0).
5Students could be in a different math and English levels, and they could move between levels during theschool year as their progression warranted.
8

The basic management intervention focused on Instructional Management. Head teach-
ers and circuit supervisors were invited to the teacher training and then provided a GES-
designed classroom observation form that emphasized the core components of differentiated
instruction–dividing students by learning level, teaching at the level of the student, and
engaging in active, student centered pedagogy. They were encouraged to use this checklist
in their routine observation of teaching, providing them a straightforward task to complete.
While some elements of the checklist were differentiated instruction specific, e.g. dividing
students by learning level, others were part of a broadly more engaged teaching practice and
could be used during non-differentiated instruction time. This replaced an existing form that
focused primarily on whether students were completing exercise books at the expected rate
and the teacher was covering the assigned annual curriculum.
To ensure government ownership of the interventions and in response to interest from
national level education personnel, each term a national level monitoring team visited each
study district to observe the intervention.6 They visited 88 percent of treatment schools each
term. This further signaled to the teachers, head teachers, circuit supervisors, and district
education officials that this intervention had the support of the national leaders in education.
3.2 Treatment 2–Differentiated Instruction + Basic Management
+ Enhanced Management
Treatment 2 received the same differentiated instruction and basic management interventions
as in treatment 1.
Enhanced Management
To improve People Management, head teachers and circuit supervisors received addi-
tional training, a handbook, and quick reference cards on how to be effective supporters of
teachers both during differentiated instruction and in their broader teaching practice. At the
conclusion of the training, head teachers and circuit supervisors received a phone number
6National level monitors visit schools as regular policy, but less frequently, visiting about 16 percent ofschools each year. When education reforms are implemented in Ghana, this monitoring design is common.
9

that they could call or text with questions or concerns, effectively a “help-desk.” During the
implementation of the program, head teachers received automated, supportive text messages
on a weekly basis to remind them of key targeted instruction components and dates, e.g.
“Remember to conduct the student leveling this week.” Unlike the task-based instructional
management above, this intervention was more holistic and sought to transform the relation-
ship between teachers and their two immediate layers of supervisors into one of collaborative
support for improved learning.
4 Empirical Strategy
The primary conceptual difficulty in estimating the effect of management quality on class-
room activities and student outcomes is its potential correlation with other unobserved
aspects of the school that also influence the same outcomes. To overcome this difficulty,
we conducted a randomized controlled trial. We randomized 210 schools into one of three
treatments: differentiated instruction plus basic management (DIB), differentiated instruc-
tion plus basic and enhanced management (DIBE), and control. From this randomization
design, estimation of treatment is straightforward. Specifically we estimate,
yis = α + β1DIBs + β2DIBEs + Γ′Xis + εis (1)
where yis is outcome y for respondent i in school s, DIBs is an indicator variable equal to one
if the school was a the differentiated instruction plus basic management treatment, DIBEs
indicates schools in the differentiated instruction plus basic and enhanced management treat-
ment, Xis are a vector of school and individual level controls including strata fixed effects
and baseline level yis as appropriate, and εis is a cluster-robust error term assumed to be
uncorrelated between schools but allowed to be correlated within a school. In student level
regressions, to improve precision we additionally control for student age and age squared,
baseline grade level, and an indicator variable for being female.
10

In this specification, each β is the effect of each treatment relative to the control group.
The difference between β1and β2 is the differential effect of the enhanced management train-
ing.
We test the impact of the treatments on school management practices and norms, class-
room activities, program implementation, and students’ test scores, attendance, and persis-
tence in school.
5 Sample Selection and Data
In this section we first describe how we constructed the sample and then the data collected.
5.1 Sample Selection and Randomization Procedure
This study occurred in 20 districts spread across eight of ten regions of Ghana.7 These
districts contained 145 circuits, i.e. sets of geographically proximate schools overseen by a
single circuit supervisor. We excluded 5 circuits from the study ex ante, leaving 140 study
circuits.8
From the 140 study circuits, we randomly assigned 70 circuit supervisors to receive the
DI + Basic Management intervention and 70 circuit supervisors to receive the DI + Basic +
Enhanced Management intervention. We randomly selected two eligible schools from each
circuit. Within each of the DI + Basic Management circuits, we randomly allocated one
of the two eligible schools to be a control school and the other eligible school to be a DI
+ Basic Management school. To be consistent across all circuits, within each of the DI +
7The districts were between the 77th and 1st (lowest) percentile of the national district level povertyranking. These districts were selected because one of the funders of the implementation, the United NationsChildren’s Fund (UNICEF), had existing relationships with these districts.
8We excluded two circuits to use for piloting. Three additional circuits were excluded because they didnot have at least two primary schools that met the eligibility criteria: they had to operate one shift perday and have positive enrollment and separate sections for P4 through P6. Schools with shifts have alteredtime-tables that would not be amenable to differentiated instruction time, and schools with multiple gradestaught in a single classroom would not have enough teachers to separately teach three learning levels. Ourinitial universe of schools was from the union of the official Education Management Information System(EMIS) and the United Nations Children’s Fund (UNICEF) rosters of schools. Because neither the EMISnor UNICEF data contained the relevant details, we contacted each school to confirm its characteristics.
11

Basic + Enhanced Management circuits, we randomly selected one of the two eligible schools
to receive the DI + Basic + Enhanced Management intervention and removed the second
school from the study. Our sampling strategy ensures that the circuit and school selection
is identical in the two groups. The resulting experimental sample is 210 schools. The study
design is pictured in Figure 1. As circuit supervisors of control schools received the DI +
Basic intervention, our estimates are lower bound of the overall effect size relative to a pure
control school. The effect of a trained CS on an otherwise untreated school is likely small.
They were instructed not to use the DI observation form in non-DI schools, and we did
not observe any control schools dividing their students by learning levels. As the previous
versions of DI were barely implemented and the methods did not transfer even between
educators in the same school, spillovers are unlikely (Duflo, Kiessel, and Lucas 2021). If
spillovers happened, they will bias our results towards 0.
[Figure 1 about here]
This scheme results in three intervention arms, i.e. two treatment arms and one control
arm, with 70 schools in each arm. Our design has the advantage of allowing us to measure
the impact of DI + Basic Management compared to business-as-usual, and the impact of
DI + Basic + Enhanced compared to business-as-usual. It also allows us to compare the
differential effect of adding the Enhanced Management intervention relative to the DI +
Basic Management intervention alone. In all cases we establish both effectiveness and cost-
effectiveness.
5.2 Data Collection
To evaluate the effect of the two interventions, we conducted four full rounds of data
collection–a baseline prior to implementation, two monitoring checks during the implementa-
tion year, and a follow-up survey in the final term of the implementation year–and a truncated
monitoring round the year after the intervention. The full project timeline appears in Figure
2.
12

[Figure 2 about here]
Baseline
To ensure a baseline prior to any students receiving treatment, the baseline occurred in
May and June 2018, near the end of the 2017-2018 academic year, with the training occurring
in August 2018 between the 2017-2018 and the 2018-2019 academic years.
During baseline data collection we surveyed all 140 circuit supervisors and the head
teachers and P4 through P6 teachers at each of the 210 study schools on their backgrounds
and existing management and teaching practices. Additional details on the management
measures appear in Section 5.3. We further surveyed and tested a random sample of 30
students from each school, 15 from P4 and 15 from P5.9 The student assessments included
both foundational and grade level content. Additional details on test construction appear
in Appendix Section A.2. Because test questions were designed to cover grades P1 through
P6 content, we used item response theory to compute an overall test score and standardize
based on the baseline mean and standard deviation. We surveyed and tested 5,893 students
at baseline.
Spot-checks
We conducted two spot-check visits during the 2018-2019 school year, one in Term 1 and
one in Term 2. During each spot-check visit enumerators arrived unannounced and recorded
the attendance of the head teacher, teacher, and baseline students. Circuit supervisors, head
teachers and teachers responded to surveys on program take-up and implementation and
management. We also conducted two classroom observations during the first two periods
of the day in each P4 through P6 classroom, noting teacher presence, whether students
were divided by grade level instead of learning level, and the use of teaching and learning
materials. We further collected basic demographics on any new head teachers or teachers
since the baseline.
9If a school had more than one section of a grade, we first randomly selected a section then selectedstudents from that section. If a school had fewer than 15 present students, we surveyed and tested allstudents who were present.
13

Achievement Follow-up
At the end of the 2018-2019 school year, we attempted to survey and invigilate exams for
all baseline students. These tests were similar to those at baseline, but included additional
harder questions with some of the easier questions removed. In addition we conducted circuit
supervisor, head teacher, and teacher interviews. These surveys collected information on
school enrollment, organization and management, teacher support, mentorship, and program
implementation.
Post-Intervention Spot Check
We started an additional spot-check round during the second term of academic year
2019-2020, the year after the end of the intervention. In March of 2020, we stopped field
activities after reaching only 60 percent of schools for the safety of our enumerators and
study participants due to increasing Covid-19 transmission in Ghana. The content of this
incomplete round was similar to the previous spot-check rounds.
5.3 Management Indices
We used the previously validated Development World Management Survey (D-WMS) as a
framework for the measurement of managerial practices (Lemos and Scur 2016). Because of
the content of the interventions, we focus on three measures of management–Instructional
Management, People Management, and Other Management–creating an index to capture
each. In each case, we followed Anderson (2008) to standardize and combine data reported
by teachers, head teachers, and circuit supervisors to create each index.The exact questions
for each index appear in Appendix Section A.3.
Instructional Management
The Instructional Management Index captures of the elements of the D-WMS that
were directly targeted by the implementation of the DI + Basic Management intervention–
standardization of instructional planning processes, personalization of instruction and learn-
ing, data-driven planning and student transition, and performance tracking.
14

People Management
The People Management Index captures the elements of the D-WMS that were targeted
by the Enhanced Management Training–performance review and performance dialogue.
Other Management
The final index includes all other aspects of management not directly covered in the
training but which could naturally follow from other improved practices–adopting educa-
tional best practices, continuous improvement, and consequence management.
As validation of these measures, we show that each is positively correlated with student
test scores in Appendix Figure A2.
5.4 Summary Statistics and Baseline Balance
Table 1 displays the summary statistics and tests for baseline balance across the three treat-
ment arms.10 Panel A contains student level variables, Panel B contains teacher level vari-
ables, Panel C are head teacher and school level variables, and Panel D are CS level variables.
Columns 1 through 3 are the sample means and standard deviations for each treatment arm
and column 4 provides the p-value for the test that the three arms are statistically equal.
Across all means tested, none of the differences are statistically significant different.
[Table 1 about here]
A few statistics, which are statistically equal across all arms, are of note. Students were
on average about 12 years old. Recall that these are students in grades 4 and 5 at baseline.
If a student started grade 1 on time at age 6, then that student would be age 9 or 10 near
the end of grade 4 and age 10 or 11 near the end of grade 5. Therefore, these students were
substantially older, indicating either delayed entry or grade repetition, or both. About 53
percent of students, 74 percent of teachers, 80 percent of head teachers, and 90 percent of
circuit supervisors were male. Teachers were about 31 years old, head teachers were about
10We use item response theory to put all tests on the same scale and standardize scores based on controlgroup baseline mean and standard deviation.
15

42 years old, and circuit supervisors were 45 years old. Almost all teachers (91 percent) had
a bachelor’s degree or a diploma, and 28 percent of head teachers had received no pre-service
or in-service training specifically about being a head teacher.
6 Results
6.1 Management
Both interventions improved management quality in the treatment schools. Table 2 contains
these results. Relative to a control group management score standardized to mean 0 and
standard deviation of 1, the two interventions increased the Instructional Management score
by about 0.3SD, with a larger but statistically equivalent point value for the intervention
that included enhanced management (column 1). Recall that the DI + basic management in-
tervention was largely focused on Instructional Management. The effects of the interventions
on the individual components of the Instructional Management Index appear in Appendix
Table A1.
[Table 2 about here]
The enhanced management training focused on People Management. While the point
values for both interventions are positive, the effect on People Management is only statisti-
cally significant for the intervention that included enhanced management (column 2). The
intervention with enhanced management increased the people management index by 0.6SD.
We reject the equality of the coefficients across the two interventions at the 0.01 level .
The effects estimated separately for each component of the intervention appear in Appendix
Table A2.
In the final column of Table 2 we test for the effects of the intervention on Other
Management–aspects of management not directly targeted by either intervention but which
could have improved as head teachers became more interested and engaged in their schools
16

and the school climate changed as documented in this sub-Section below. These aspects in-
creased in both arms–about 0.4SD for the DI+basic intervention and 0.7SD for the DI+basic+enhanced
intervention–with the effect of the intervention that included enhanced management statis-
tically larger at the 10 percent level (p-value=0.06). Appendix A3 contains the estimates of
the effect on each piece of the Other Management index separately.
One potential concern with these management findings is that head teachers and circuit
supervisors learned from the training what was expected of them and told enumerators the
expected behaviors but did not implement them. In Appendix Table A4 we divide the
management indices into subordinate, e.g. what teachers said about head teachers, and
self-reported measures. The findings are similar when re-estimated over only subordinate
or only self-reported measures. As the teachers were subject to the same training in both
interventions, any experimenter demand effect would not be differential by treatment status
for those individuals. In the subordinate indices the statistically larger point value for the
DI+Basic+Enhanced intervention relative to the DI+Basic intervention is confirmed.
6.2 School Operations
To test for changes in school operations we conducted two unannounced spot checks when
schools were supposed to be holding normal school operations and DI lessons. Head teachers
can only implement management changes when school is in session, they are present, and
their teachers are present. We test for these outcomes in Table 3. Relative to a control
group mean of 96%, the interventions increased the likelihood that school was in session by 3
percentage points (column 1). Head teachers cannot be effective leaders and teachers cannot
be effective conveyors of knowledge if they are absent. Head teachers were 11 (DI+basic) or
15 (DI+basic+enhanced) percentage points more likely to be present relative to a control
group mean of 42 percent (column 2). We do not find any effect on teacher attendance
(column 3). On average only 62 percent of teachers across all three arms were present at
17

the start of our spot-check visits.11 The additional enhanced management training did not
differentially change any of the outcomes.
[Table 3 about here]
In addition to increasing the likelihood that schools were in session and head teachers
were present, the interventions changed what was happening in the classrooms as shown
in Table 4. Even though the interventions did not affect the likelihood that a teacher was
physically present at school, they both increased the likelihood that a teacher was in the
classroom by 13 (DI+Basic) and 11 (DI+Basic+Enhanced) percentage points (column 1).
The interventions provided materials, instruction on making materials, and training in
and sample activities to encourage active learning. Teachers in treatment schools were more
likely to be using teaching and learning materials–19 percentage points in the DI+Basic inter-
vention and 13 percentage points in the DI+Basic+Enhanced intervention. Teachers were 17
(DI+Basic+Enhanced) and 21 (DI+Basic) percentage points more likely to be engaged with
students and students were 16 (DI+Basic+Enhanced) or 18 (DI+Basic) percentage points
more likely to actively participate in the observed lesson by either asking or answering a ques-
tion. In all cases the point values are larger for the DI+Basic intervention and in one case
we reject that the changes are statistically equivalent–teachers in the DI+Basic intervention
were more likely to use materials than those in the DI+Basic+Enhanced intervention. In
Column 5 we combine the measures in Columns 2 through 4 into a single Active Learning
Index. This index increased by 0.47SD in DI+Basic and 0.36SD in DI+Basic+Enhanced.
We reject that these values are equal.12 Therefore, classrooms in DI+Basic schools appear
to have become more active than those in DI+Basic+Enhanced and both have more active
learning than in control schools. We discuss the potential source of and implications for this
difference by treatment status more in Section 8.
11About half of this absenteeism appears to be chronic–being absent at the first spot check increased thelikelihood of being absent at the second spot check by 15 percentage points (p = 0.01)–making it difficult tochange.
12In Appendix Table A5 we re-esimate columns 2-5 for the classrooms that had a teacher present, findingsimilar results, including the statistically significant difference between DI+Basic and DI+Basic+Enhancedfor both TLM Use and the Active Learning Index.
18

[Table 4 about here]
These observations occurred across the first two periods of the day, yet DI time was only
one period long. The most common time for DI implementation was Period 1.13 Therefore,
teachers appear to be implementing active learning strategies outside of strictly DI periods.
In Appendix Table A6 we estimate the outcomes in Table 4 separately by Period finding
statistically significant positive effects of the interventions in all outcomes in each Period.
The value on the Active Learning Index falls more for DI+Basic+Enhanced schools between
the two Periods leading to statistically different point estimates for the two interventions in
Period 2 (when schools were less likely to be doing DI) with a higher value for the DI+Basic
intervention.
In addition to training in active pedagogy, DI implementation included dividing students
by learning levels for one Period each day. To implement DI, teachers had to establish
each student’s learning level through a brief test, divide students by learning levels, and use
the Teacher’s Manual as a guide for lessons. The first four columns of Table 5 are teacher
self-reported measures of implementation. Over 95 percent of teachers reported that they
completed the leveling (column 1), about 90 percent reported that they did DI at least four
days in the prior week (column 2), about 78 percent reported that they had done or were
planning to do DI the day of the enumeration visit (column 3), and at our final visit of the
year about 76 percent reported still having their copy of the DI manual, which contained
the entire year’s skeleton lesson plans (column 4). Teachers were marginally more likely
(p-value=0.08) to have done the leveling in the DI+Basic+Enhanced arm (column 1). The
other effects are statistically equivalent across the two treatments, but in all cases the point
values are larger for the DI+Basic+Enhanced intervention.14
13About 43 percent of head teachers reported that their school implemented DI in Period 1, 35 percent inPeriod 2, and 22 percent at another time of day.
14We verified the teacher responses finding similarly strong responses from the head teachers aboutwhether they verified that teachers completed the leveling correctly (with marginally stronger effects forthe DI+Basic+Enhanced arm, p-value=0.09), the school did DI last week, and they still had their DI man-ual during our last visit. Head teachers also demonstrated their knowledge about DI and comfort with beingable to explain the procedure to teachers. Results not presented.
19

[Table 5 about here]
The adherence to the differentiated instruction model is collaborated by observations–we
observed about 58 (DI+Basic) or 62 (DI+Basic+Enhanced) percent of schools teaching their
students by learning level instead of grade level during the at least one of first two periods of
the day of our unannounced visits (column 5). This likely understates the true adherence as
22 percent of head teachers reporting that their school conducted DI lessons at times other
than the first two periods of the day.15 Column 6 combines these outcomes into a single
index finding a positive effect of both interventions and a larger, but statistically equivalent,
point value for the DI+Basic+Enhanced intervention.
The intervention further changed the climate of the school–making shirking less accept-
able and increasing retention. We provided both teachers and head teachers vignettes in
which a hypothetical student, teacher, head teacher, or circuit supervisor was shirking, e.g.
managers not providing useful feedback or someone being chronically absent, and asked the
respondents whether the behavior was acceptable. Table 6 contains these results, replac-
ing the dependent variable in Equation 1 with an index over the vignettes about a specific
agent. Treatment teachers judge shirking behavior by teachers more negatively by about
0.3SD (column 1). They judge shirking by all school agents, an index that combines re-
sponses about students, teachers, head teachers, and circuit supervisors, more negatively
by 0.3SD (DI+Basic) or 0.4SD (DI+Basic+Enhanced) (column 2). Head teachers similarly
view shirking by teachers more harshly–about 0.3SD (column 3). While the point values are
negative on the overall index of head teachers’ views, it is not statistically significant.16
[Table 6 about here]
15The training recommended implementing differentiated instruction in either of the first two periods ofthe day, on Tuesdays through Fridays, and starting the third week of the term. We timed our visits to matchthese guidelines. Some schools (22%) modified their exact implementation to suit the needs of their studentsby holding DI lessons as the last period of the day or just before or after the lunch break.
16Appendix Table A7 presents the opinions about other agents at the school separately–in almost all casesthe point values are negative but not always statistically significant. Treatment teachers are statisticallysignificantly less likely to accept shirking by hypothetical head teachers while we are unable to reject thattreatment and control head teachers viewed shirking by their hypothetical head teacher peers similarly.
20

As both head teachers and teachers were exerting more effort, as measured by atten-
dance (head teachers) and time in the classroom (teachers), and shirking behavior was being
judged more harshly, we tested whether the interventions increased stress and burnout.
These results appear in Appendix Table A8. The interventions at most marginally increased
a composite index that includes questions on both stress and burnout. Teachers in the
DI+basic+enhanced intervention had a 0.16SD higher value on this index (p<0.10) relative
to a control group mean of 0 and standard deviation of 1. Both teachers and head teachers
had positive statistically insignificant point values in the DI+Basic management interven-
tion. The additional enhanced management did not change head teacher stress and burnout
(coefficient = 0.000).
6.3 Student Achievement and Attrition
We estimate the effect of the program on student achievement using Equation 1 with a
student’s endline score as the dependent variable, including their baseline test score as an
additional covariate. Table 7 contains these results. Students in either the DI+Basic or
DI+Basic+Enhanced treatment increased their overall test scores by 0.11SD (column 1)
with 0.13SD improvements in Math (column 2) and 0.07SD improvements in English (column
3).17 Over this same period, control group students learned about 0.3SD, therefore, these test
score increases are equivalent to about one third of a year of learning. In all cases we fail to
reject the equality of the effect across the two arms and the point values are within 0.01SD of
each other. Therefore, even though the quality of People Management differentially changed
in the DI+Basic+Enhanced intervention, the test score improvements were almost identical
across the DI+Basic and the DI+Basic+Enhanced interventions.
17Appendix Table A9 provides additional estimates of the effects on test scores. Panel A limits the controlsto baseline test score and strata only finding similar estimates. Panels B-D estimate the effect on differentsubsets of questions: the foundational questions (i.e. those most similar to the ASER), the upper-levelquestions, and anchor questions that all students completed. We find statistically significant improvementsacross almost all types of questions with the exception of grade-level English scores increases that remainpositive but are no longer statistically significant for the DI+basic+enhanced intervention. The largest pointvalues are for the foundational questions.
21

[Table 7 about here]
As with any RCT, one concern is attrition at the follow-up generating selection into
the test. To limit attrition we tracked all students not present in school at the start of
the follow-up visit, eventually testing 96 percent of all baseline students. We tested 1.5
percentage points fewer students from the DI+Basic+Enhanced arm than the control group
but this is not differential by both test score and treatment (Appendix Table A10). In
Appendix Table A11 we provide Lee (2009) bounds accounting for this attrition. The point
values are similar with the same statistical significance as those with the full sample.
We tested for heterogeneity in program impacts on student test scores by students’ base-
line test score, gender, grade level at baseline, parents’ literacy, and a school amenity index,
finding no heterogeneous effects (Appendix Table A12).18 Appendix Figure A3 displays the
non-parametic test results. While previous studies of remedial interventions found larger
effects for students with the lowest baseline scores, our study as with other studies of Dif-
ferentiated Instruction programs that tailored instruction to multiple learning levels did not
(Banerjee et al. 2007; Banerjee et al. 2017; Duflo, Kiessel, and Lucas 2021).
An additional concern with interventions that divide students by learning level is that
students might become discouraged if they are in the lowest learning level, increasing absen-
teeism, drop out, or a dislike of school. Students in the DI+Basic intervention were about 3
percentage points less likely to be present, but their schools were about 3 percentage points
more likely to be open (and we could not check attendance in closed schools), therefore the
net effect relative to the control group is approximately 0 (Appendix Table A13, column 1).
We find the intervention decreased the likelihood that the student was still attending the
study school according to the teacher or head teacher at the spot-check by about 2 percentage
18We tested for heterogeneity by test score as students who were the most behind grade level might havebenefited more, by gender because of evidence from Ghana that head teachers are systematically biasedagainst female teachers (Beg, Fitzpatrick, and Lucas 2021) and therefore might also exhibit bias towardsfemale students, by student grade level as students at different places in their scholastic journeys mighthave had different experiences, by parent literacy as a proxy for whether the student was a first generationlearner and could get help at home if needed, and finally by school amenities in case the intervention wasparticularly well suited for schools with different levels of existing resources.
22

points (Appendix Table A13, column 2). This will be the sum of students changing schools
and those no longer attending any school. Among the students we reached, we find no dif-
ference in the likelihood that the student stated he was still enrolled in a school (Appendix
Table A13, column 3). As an additional measure of potential disillusionment, we test what
students thought of math and English, the subjects that were focus of the intervention and
their aspirations for future study with the results in Table A14. Students did not change the
likelihood that their favorite subject was either math or English (control group mean of 79
percent). The point value is positive for DI+Basic and negative for DI+Basic+Enhanced,
and we can reject equality between the two intervention arms (p-value=0.02). Students in
the DI+Basic intervention were 5 percentage points more likely than students in the con-
trol schools to say that they liked English or math “very much” (control group mean of 79
percent), statistically larger than the DI+Basic+Enhanced value. The intervention did not
change the likelihood that students aspired to graduate from (non-compulsory) senior high
school (control group mean of 97 percent).
6.4 Persistent Effects
In this subsection we provide evidence that the effects of the intervention persisted into
the year following the intervention. At the conclusion of the main intervention year, head
teachers and teachers were instructed to continue with the intervention but they received no
additional materials. GES invited one teacher from each school to a brief refresher training
prior to the start of the subsequent school year. We planned two data collection exercises
for this post-intervention year–a spot-check during Term 2 (February-April 2020) and a full
follow-up, including management questions, during Term 3 (May-July 2020). The spot-check
was truncated due to Covid-19 and the full follow-up did not happen.
From the data we collected during the post-intervention year, we have three measures of
management quality–teacher and head teacher retention and a single Management index. In
Table 8 we test the effect of the interventions on these outcomes. In the control group about
23

59 percent of teachers from Term 1 of the intervention year were still teaching in the same
school. The interventions increased the likelihood that a teacher was still in the school by
18 (DI+Basic) and 8 (DI+Basic+Enhanced) percentage points, 30 and 14 percent increases
relative to the control mean (column 1). We reject equality across the two interventions.
Teacher retention has two components–does the teacher want to stay and does the head
teacher want the teacher to stay.19 The increase across both treatments could reflect the
more supportive work environment–across both arms teachers indicated that head teachers
were more likely to provide useful feedback and mention something that teachers were going
well as part of that feedback (Table A2)–and satisfaction with seeing that students were
learning that was reflected in the qualitative follow-up. Teachers did report higher levels of
stress and burnout in the DI+Basic+Enhanced intervention and head teachers might have
been more likely to encourage less effective teachers to leave the school in that intervention,
potentially leading to less retention in the DI+Basic+Enhanced intervention. Neither inter-
vention statistically significantly increased the likelihood that the head teacher was still the
head teacher of the school in the year after the intervention.
[Table 8 about here]
In column 3 of Table 8 we combine the available management questions into a single man-
agement index, finding that management quality persisted–school management was 0.26SD
(DI+Basic) and 0.38SD (DI+Basic+Enhanced) higher in the treatment schools.20 We at-
tempted to observe classes in all study schools but had to stop fieldwork after reaching only
60 percent of schools. Based on this truncated round, about 40 percent of schools were still
dividing their students by learning levels for one of the first two periods of the day (Table
8, column 4).
19Neither actor has complete autonomy over the decision as all transfer requests go through Ghana Edu-cation Services.
20In this truncated round the treatment did not statistically significant change student attendance or on-time progression. Students who were P4 at baseline and should have been in P6 at this follow-up were 4percentage points (DIB) and 5 percentage points (DIBE) less likely than students in control schools to beenrolled in the study school. As we asked the enrollment questions of teachers and head teachers this mayreflect that the teachers and head teachers were more aware of their students due to the intervention as theattendance levels were not different by treatment status.
24

7 Cost Effectiveness
We use the ingredients method to assess cost effectiveness. For the one year intervention on
which the achievement results are based, the DI+Basic Management intervention cost $41
per student and the DI+Basic+Enhanced Management cost $74 per student. As the achieve-
ment effect sizes were approximately the same across the two interventions, the DI+Basic
Management intervention was clearly more cost effective. To scale this relative to the ef-
fect size per $100, this would be 0.26SD per $100 for DI+Basic Management and 0.14SD
per $100 for DI+Basic+Enhanced Management. To scale this as a price per year of learn-
ing in this context, DI+Basic Management costs $125 per student per year of learning and
DI+Basic+Enhanced costs $228 per student per year of learning.21 Any achievement effects
in the second year due to schools continuing to implement the program with minimal training
of one teacher and no additional materials will increase the cost effectiveness. Unfortunately,
we were unable to collect achievement data in the year after the intervention.
8 Discussion
We find that the two interventions equally improved Instructional Management but the
DI+Basic+Enhanced intervention differentially improved both People Management and Other
Management. When considering what was actually happening in the classroom, Active
Learning improved more in DI+Basic intervention while DI Implementation was sugges-
tively stronger in the DI+Basic+Enhanced intervention. Student learning increased equally
across the two interventions.
Comparing either intervention relative to the control group and previous findings on
similar teacher training alone in both Ghana (Duflo, Kiessel, and Lucas 2021) and India
(Banerjee et al. 2017) shows that augmenting teacher training with management support
increases student learnning. Further comparing either treatment to the control group and
21Both of these scaling methods make assumptions about the linearity of returns. We provide them toallow readers to compare this study’s cost effectiveness to other studies.
25

previous findings in Argentina (Ganimian 2020) and India (Muralidharan and Singh 2021)
on management training alone shows the complementarity between management and teacher
training.
The statistically equivalent and almost identical point values in learning increases be-
tween the two treatment arms is consistent with two potentially simultaneously occurring
phenomena. First, Instructional Management could be more important for student learning
than People or Other Management–school meetings, CS visits (independent of classroom ob-
servations), and whether teachers consider their managers good mentors are less important
in the education production function than providing classroom observations and accompany-
ing feedback. Based on a mediation analysis, schools with larger Instructional Management
increases also had larger test score gains (Appendix Figure A5). In contrast, the relationship
between increased People Management increases and test scores is flat–schools with larger
gains in People Management had the same test score increases as those with smaller gains in
People Management. Second, the enhanced management caused head teachers to focus more
on other aspects of management and less on whether active learning was happening in the
classroom. As measured by attendance, HTs in the two arms appear to increase effort the
same amount, but spread over more things–meetings, etc–in the arm that included enhanced
management training.
This suggests that the simple rule of thumb observation form and encouragement to
use it caused head teachers to focus more on instructional improvement and the additional,
enhanced management training may have distracted them from this goal.
9 Conclusions
Despite a recognition in the last 20 years of the importance of management for private
sector productivity, much less work has been done on the importance of management for
public sector service delivery. As a proof of concept, we showed that management quality
in Ghanaian schools is associated with higher student test scores as has been shown in 7
26

other countries. Further, we implemented a 210 school, 3 arm randomized controlled trial
in partnership with the Ministry of Education of Ghana to test the importance of manage-
ment in public service delivery. We find that even though the treatment with additional
enhanced management training improved management more than a more basic management
intervention, both classroom activities and student achievement improved equally across the
two interventions. The two interventions increased student test scores by 0.11 SD, about one
third of a year of learning in this context. Despite only minimal training of one teacher the
year after the end of the main intervention, we still observed compliance with differentiated
instruction at a level that was 70 percent of the level during the initial supported year.
Management is likely a key component to increase student learning at scale. We show
the complementarity between a teacher training and a supervisor checklist that supported
improvement in Instructional Management in improving student learning.
27

References
Banerjee, Abhijit, Rukmini Banerji, James Berry, Esther Duflo, Harini Kannan,Shobhini Mukerji, Marc Shotland, and Michael Walton, “From proof of conceptto scalable policies: challenges and solutions, with an application,” Journal of EconomicPerspectives, 2017, 31 (4), 73–102.
Bloom, Nicholas and John Van Reenen, “Measuring and explaining management prac-tices across firms and countries,” The quarterly journal of Economics, 2007, 122 (4),1351–1408.
and , “Human resource management and productivity,” in “Handbook of labor eco-nomics,” Vol. 4, Elsevier, 2011, pp. 1697–1767.
, Aprajit Mahajan, David McKenzie, and John Roberts, “Do Management Inter-ventions Last? Evidence from India,” Working Paper 24249, National Bureau of EconomicResearch January 2018.
, Benn Eifert, Aprajit Mahajan, David McKenzie, and John Roberts, “Doesmanagement matter? Evidence from India,” The Quarterly Journal of Economics, 2013,128 (1), 1–51.
, Renata Lemos, Raffaella Sadun, and John Van Reenen, “Does managementmatter in schools?,” The Economic Journal, 2015, 125 (584), 647–674.
Bold, Tessa, Mwangi Kimenyi, Germano Mwabu, Alice Nganga, and JustinSandefur, “Experimental evidence on scaling up education reforms in Kenya,” Journalof Public Economics, 2018, 168, 1 – 20.
Bruhn, Miriam, Dean Karlan, and Antoinette Schoar, “The impact of consultingservices on small and medium enterprises: Evidence from a randomized trial in Mexico,”Journal of Political Economy, 2018, 126 (2), 635–687.
Cilliers, Jacobus, Brahm Fleisch, Cas Prinsloo, and Stephen Taylor, “How toimprove teaching practice? An experimental comparison of centralized training and in-classroom coaching,” Journal of Human Resources, 2020, 55 (3), 926–962.
Crawfurd, Lee, “School Management and Public Private Partnerships in Uganda,” Journalof African Economies, 08 2017, 26 (5), 539–560.
Duflo, Annie, Jessica Kiessel, and Adrienne Lucas, “Bypass or Engage the Teacher:Four Models to Increase Student Learning in Existing Systems,” 2020. Working paper.
, , and , “Experimental Evidence on Alternative Policies to Increase Learning atScale,” Working Paper 27298, National Bureau of Economic Research March 2021.
Finan, Frederico, Benjamin A Olken, and Rohini Pande, “The personnel economicsof the developing state,” in “Handbook of Economic Field Experiments,” Vol. 2, Elsevier,2017, pp. 467–514.
28

G, Jr Fryer Roland, “Management and Student Achievement: Evidence from a Random-ized Field Experiment,” Working Paper 23437, National Bureau of Economic ResearchMay 2017.
Glewwe, Paul and Karthik Muralidharan, “Improving school education outcomes indeveloping countries: Evidence, Knowledge gaps, and Policy Implications,” in “Handbookof Economics of Education,” Vol. 5, North Holland, 2016, pp. 653–743.
Hsieh, Chang-Tai and Peter J Klenow, “Misallocation and manufacturing TFP inChina and India,” The Quarterly journal of economics, 2009, 124 (4), 1403–1448.
Lemos, Renata and Daniela Scur, “Developing management: An expanded evaluationtool for developing countries,” London School of Economics, Centre for Economic Perfor-mance, London, 2016.
, Karthik Muralidharan, and Daniela Scur, “Personnel management and school pro-ductivity: Evidence from india,” Technical Report, National Bureau of Economic Research2021.
Muralidharan, Karthik and Abhijeet Singh, “Improving Public Sector Managementat Scale? Experimental Evidence on School Governance India,” Working Paper 28129,National Bureau of Economic Research November 2020.
and Paul Niehaus, “Experimentation at scale,” Journal of Economic Perspectives,2017, 31 (4), 103–24.
, , and Sandip Sukhtankar, “Building state capacity: Evidence from biometric smart-cards in India,” American Economic Review, 2016, 106 (10), 2895–2929.
Rasul, Imran and Daniel Rogger, “Management of bureaucrats and public service de-livery: Evidence from the nigerian civil service,” The Economic Journal, 2018, 128 (608),413–446.
Romero, Mauricio, Justin Sandefur, and Wayne Aaron Sandholtz, “Outsourcingeducation: Experimental evidence from Liberia,” American Economic Review, 2020, 110(2), 364–400.
Tsai, Thomas C, Ashish K Jha, Atul A Gawande, Robert S Huckman, NicholasBloom, and Raffaella Sadun, “Hospital board and management practices are stronglyrelated to hospital performance on clinical quality metrics,” Health affairs, 2015, 34 (8),1304–1311.
Vivalt, Eva, “How much can we generalize from impact evaluations?,” 2016.
29

A Appendix
A.1 Additional Intervention Details
Teacher Material Development
Since the success of a program at scale depends on government systems supporting and
sustaining the intervention, this intervention involved all relevant government agencies from
the inception–Ghana Education Services (GES) and its subsidiaries including the Basic Edu-
cation Division (BED), National Council for Curriculum and Assessment (NaCCA), and the
National Inspectorate Board (NIB). This intervention consisted of materials, personnel, and
training, all of which was implemented exclusively through the existing government system
with the exception of one person who monitored the help-desk who was a UNICEF intern.
The National Council for Curriculum and Assessment (NaCCA), the board responsible
for managing and implementing government curriculum policy, led the development of DI
materials. A NaCCA Resource Development Team conducted an initial review of existing
GES materials and materials used in the previous implementation of targeted instruction
in Ghana, the Teacher Community Assistant Initiative (TCAI), which targeted students in
grades 1 through 3. They then modified these existing resources and designed and developed
new materials as appropriate for older learners. The teaching materials included topics to
cover each day, and ideas for class, group, and individual activities. These were not scripted
lessons, leaving teachers the latitude to pick the activities that most resonated with their
students.
A core team of the National Teaching Council (NTC), the council responsible for licensing
teachers in Ghana, developed the training materials and facilitator manuals.
Teacher Training
Teacher training was a cascade model. NTC trained 24 national trainers. The national
trainers trained 160 District Teacher Support Team (DTST) members, i.e. district-level
government employees regularly responsible for in-service teacher training. These DTST
30

members trained the treatment teachers, head teachers, and circuit supervisors. The training
included time to practice differentiated instruction with other training participants.
The main teacher training occurred for 5 days prior to the start of the 2018-2019 academic
year with shorter refresher trainings prior to the start of each term, 3 day at the start of
term 2 and 2 days at the start of term 3.
Enhanced Management Material Development
The National Inspectorate Board (NIB), the board that oversees school inspection and
evaluation, developed the circuit supervisors’ and head teachers’ management intervention
materials including the their manuals, quick reference cards, and content for text message
reminders. Much of the content was a condensed version of the existing manual for head
teachers and circuit supervisors, Leadership for Learning. The management manuals were
not limited to DI content, instead reminding head teachers and circuit supervisors how to
be effective school leaders and support teachers, broadly. The training focused on guidelines
for productive classroom observations, including providing helpful feedback.
Enhanced Management Training
The management training lasted occurred after the teacher training prior to the start
of the 2018-2019 academic year. The initial training was 3 days with 2 days of refresher
training prior to the start of Term 2, and a 1 day refresher training prior to the start of
Term 3.
Implementation
The training suggested that schools implement DI during the first period of the day.
Schools could implement it at a time that worked best for them–43 percent selected Period
1, 33 percent Period 2, and 22 percent another time of day.
In the first two terms the teaching observation forms were completed on paper. In term
3, these forms were completed on a tablet through the mobile School Report Card (mSRC)
system that all head teachers, both treatment and control, had.
31

A.2 Test Construction
We designed the test to include both foundational concepts and grade level content. The
majority of questions were adapted from the examinations used in Duflo, Kiessel, and Lucas
(2020), which had been originally developed by education stakeholders in the Ministry of
Education to reflect grade 1 through grade 4 material. Based on piloting and findings from
Duflo, Kiessel, and Lucas (2020), many students in grade 4 and 5, our target grades, still
tested at that level. We added additional questions that were inspired by questions from the
Ghana National Education Assessment grade 3 and 6 exams. Enumerators conducted the
assessments one-on-one. Based on piloting, the grade level of the source of the assessments,
and data from Duflo, Kiessel, and Lucas (2020), the exam questions were divided into three
difficulty levels: easier, medium, and harder. In consideration of student and enumerator
time, not all students were asked all questions. The tests were semi-adaptive: all students
started with the medium questions, then progressed to either the easier or harder questions
based on their performance. As all students completed the same anchor (medium) questions,
we used item response theory to put all scores on a common scale. Teachers did not see the
exams nor did students retain any papers that they could have shared with their teachers.
These were not the same exams that teachers used to level students. Appendix Figure A1
contains the test score distribution at baseline.
[Appendix Figure A1 about here]
A.3 Management Index Construction
[needs to be updated from table A1, 2, 3]
Instructional Management:
Headteacher reported: (1) Conducted a 5-minute classroom observation in previous term
for P4-P6 teachers, (2) Conducted a 30-minute classroom observation in previous term for
P4-P6 teachers, (3) Conducts classroom observations of all teachers frequently. (4) CS
observed classroom teaching at least once per term. (5) Pupil scores are used for promotion
32

(6) Teachers use lesson plans everyday (7) Teachers pay attention to individual student needs
in their classroom.
School-wise average of teacher reported variables: (1) HT/CS conducted a 5-minute
classroom observation in previous term. (2) HT/CS gave feedback after observation. (3)
HT/CS conducted a 30-minute classroom observation in previous term.
People Management:
Headteacher reported: (1) Provides suggestions to teachers for improving their teaching
(2) Takes the initiative to discuss matters when a teacher has problems in the classroom
(3) Provides constructive feedback to teachers in school. (4) held staff meetings with all
teachers (5) Agrees CS is (i) good mentor (ii) good manager (iii) provides valuable work (iv)
works with HT to solve problems (6) CS visited the school at least twice per term. (7) CS
conducted at least two meetings per term with the head teacher.
School-wise average of teacher reported variables: (1) HT held at least two staff meetings
per term with all teachers. (3) HT/CS provided useful feedback after classroom observation.
(4) HT/CS feedback included praise. (5) HT/CS feedback included suggestions for improve-
ment. (6) Teacher strongly agrees that (i) she/he is valued and appreciated (ii) HT/CS have
helped him/her become a better teacher (iii) HT is a good manager
Other Management: (1) Ensures teacher skills are always improving, (2) Ensures that
teachers are held accountable for the attainment of the school’s goals, (3) Encourage teachers
to try new teaching practices e.g. based on teacher trainings. (4) Had meetings with parents.
(5) Teachers receive rewards for good performance, (6) School had records for student at-
tendance, (7) School had records for teacher attendance, (8) Teachers encourage students to
approach them outside class for supplemental help if students are facing difficulty in learning
in class, (9) The school uses student’s scores to establish the teachers’ effectiveness, (10) The
school uses teacher’s feedback to guide goals and development plans, (11) Teachers share
new teaching practices with other teachers in the school. (12) HT present.
Appendix Figure 2 shows the correlation between each of these indices and student test
33

scores.
[Appendix Figure 2 about here]
A.4 Additional Results
Tables A1 through A3 contain the effect of the interventions on each component of the
management indices.
[Appendix Table A1 about here]
[Appendix Table A2 about here]
[Appendix Table A3 about here]
Table A4 shows the effect of the intervention on classroom activities conditional on teach-
ers being present.
[Appendix Table A4 about here]
Table A5 confirms the implementation of DI based on survey responses by the head
teachers.
[Appendix Table A5 about here]
Table A6 reports the effects of the intervention on teacher and head teacher work stress
and burnout.
[Appendix Table A6 about here]
Table A7 divides the test into foundational (Panel A) and upper level questions (Panel
B).
[Appendix Table A7 about here]
Table A8 provides effects only on the test questions common to all students.
34

[Appendix Table A8 about here]
Table A9 tests whether the treatment made students more or less likely to appear in the
achievement endline.
[Appendix Table A9 about here]
Despite finding at most minimal differential selection, and not by treatment and baseline
test score, we provide Lee (2009) bounds in Table A10.
[Appendix Table A10 about here]
Table A11 provides tests for heterogeneous treatment effects by baseline test score, stu-
dent gender, being a P4 student in the year prior to the intervention (instead of P5), and
whether either parent was literate, finding no statistically significant differential effects.
[Appendix Table A11 about here]
Table A12 shows that students were marginally less likely to be present the day of a spot
check (column 1) and were equally likely to say that they still attended the study school
(column 2).
[Appendix Table A12 about here]
Table A13 shows that the program did not cause students to become disillusioned about
school.
[Appendix Table A13 about here]
35
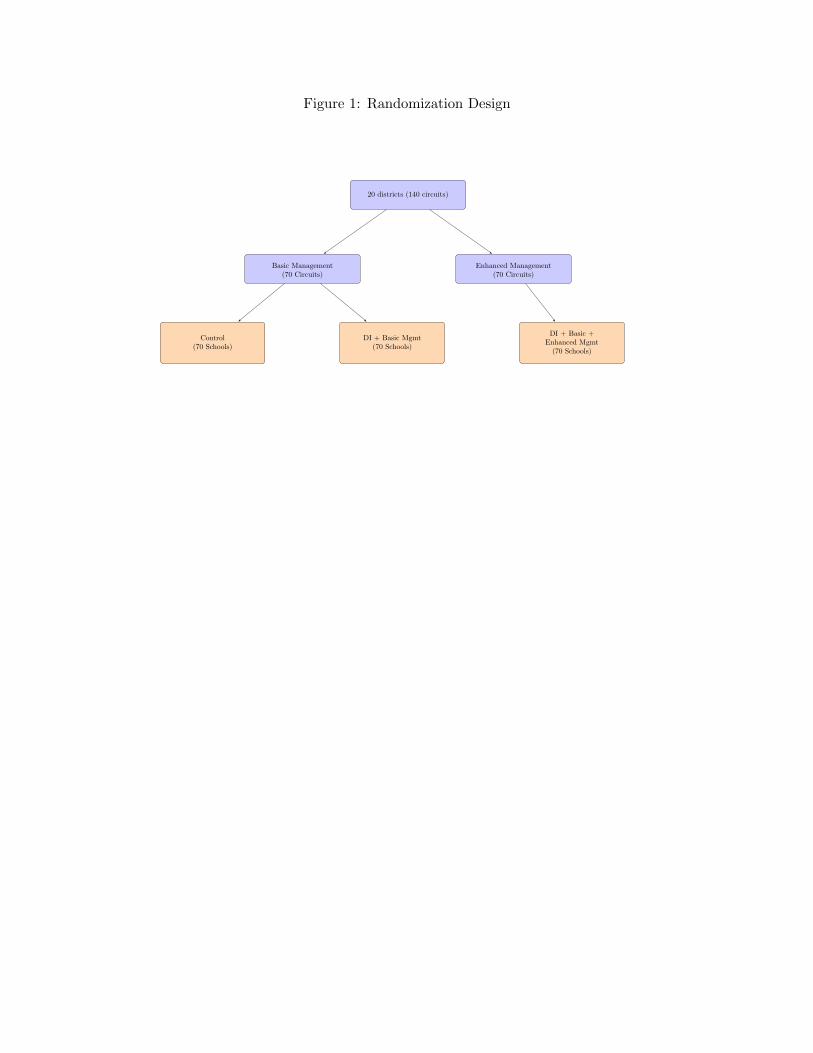
Figure 1: Randomization Design
20 districts (140 circuits)
Basic Management(70 Circuits)
Enhanced Management(70 Circuits)
Control(70 Schools)
DI + Basic Mgmt(70 Schools)
DI + Basic +Enhanced Mgmt(70 Schools)

Figure 2: Timeline of Study Activities
BASELINE SURVEYS (MAY-
JUNE)
2017-18 SCHOOL YEAR
ENDS
TI AND MGMT TRAINING
MOP-UP TRAININGS
2018-19 SCHOOL YEAR
STARTS
SPOT CHECK 1
TERM 1 ENDS
REFRESHER TI TRAINING
TERM 2 STARTS
REFRESHER MGMT
TRAINING
SPOT CHECK 2
TERM 2 ENDS
TERM 3 STARTS
ENDLINE SURVEYS (MAY-JUNE)
2018-19 SCHOOL YEAR ENDS
Apr-18 May-18 Jun-18 Jul-18 Aug-18 Sep-18 Oct-18 Nov-18 Dec-18 Jan-19 Feb-19 Mar-19 Apr-19 May-19 Jun-19 Jul-19 Aug-19

Table 1: Summary Statistics
—Control— DI+Basic Mgmt DI+Basic+ EnhMgmt
Joint P-Value
Panel A: Student-Level Variables (1) (2) (3) (4)Male 0.53 0.54 0.53 0.83
(0.50) (0.50) (0.50)P4 student 0.50 0.51 0.50 0.14
(0.50) (0.50) (0.50)Age 12.17 12.05 12.12 0.62
(1.77) (1.88) (1.83)Baseline Math 0.01 -0.02 0.01 0.84
(0.99) (0.99) (1.02)Baseline English -0.00 0.00 0.00 1.00
(0.97) (1.01) (1.00)Baseline Composite Score 0.00 -0.01 0.01 0.97
(0.98) (1.00) (1.02)N 2031 1932 1930
Panel B: Teacher-Level VariablesMale 0.74 0.75 0.73 0.94
(0.44) (0.44) (0.46)Age 31.64 31.57 30.96 0.18
(6.90) (7.38) (6.05)Years Experience as a Teacher 6.17 6.13 5.95 0.63
(5.97) (6.10) (5.44)Teacher Present at Arrival 0.84 0.86 0.89 0.68
(0.36) (0.35) (0.31)# HT Class Observations (Term 1 and 2) 9.03 8.81 8.04 0.86
(15.11) (12.57) (12.93)HT Gives Feedback About Teaching 0.74 0.77 0.79 0.56
(0.44) (0.42) (0.41)N 217 226 228
Panel C: Head Teacher and School-LevelVariablesMale 0.81 0.86 0.86 0.73
(0.39) (0.35) (0.35)Age 42.90 40.67 42.84 0.19
(8.84) (8.18) (9.54)Years Experience as HT 6.81 6.03 7.64 0.15
(5.93) (4.90) (5.94)School Enrollment P4-P5 71.83 80.69 74.46 0.30
(32.35) (48.18) (50.57)N 70 70 69
Panel D: CS-Level VariablesMale 0.92 0.89 0.43
– (0.27) (0.31)Age 45.93 44.36 0.19
– (6.37) (7.80)Number of Schools in Circuit – 8.36 8.40 0.93
– (2.71) (2.33)Years Experience as CS – 3.72 3.52 0.55
(3.09) (3.18)N – 70 70
Notes: Each cell presents the mean, with standard deviations in parentheses, of variables from the baseline survey. One head teacherdeclined the baseline survey. Column 4 presents the p-value on the F-test of joint equality for columns 1−3, controlling for strata(district) and using standard errors clustered at the school level. ∗p < 0.10, ∗ ∗ p < 0.05, ∗ ∗ ∗p < 0.01.

Table 2: Management Outcomes Indices
Index:InstructionalManagement
People
ManagementAll Other
Management(1) (2) (3)
DI + Basic Mgmt 0.284∗∗ 0.198 0.368∗∗
(0.141) (0.158) (0.143)
DI + Basic + Enhanced Mgmt 0.362∗∗∗ 0.637∗∗∗ 0.650∗∗∗
(0.127) (0.154) (0.166)
Observations 210 210 210R2 0.24 0.34 0.21Mean Dep., Control 0.00 -0.00 0.00P-Value Same Effect 0.43 0.01 0.06
Notes: The outcome variables are standardized indices of management outcomes. All regressionsinclude baseline management index and district fixed effects.∗p < 0.10, ∗∗p < 0.05, ∗∗∗p < 0.01

Table 3: Attendance at Unannounced Spot Checks
Attendance:School inSession Head Teachers Teachers
(1) (2) (3)DI + Basic Mgmt 0.029∗ 0.111∗ 0.042
(0.016) (0.064) (0.037)
DI + Basic + Enhanced Mgmt 0.028∗ 0.148∗∗ 0.028(0.016) (0.064) (0.042)
Observations 420 419 1,175R2 0.07 0.14 0.09Mean Dep., Control 0.96 0.42 0.62P-Value Same Effect 0.93 0.57 0.73
Notes: Regressions include district and survey round fixed effects. Stan-dard errors clustered at the school level appear in parenthesis. Column1: An indicator for whether or not students were having classes theday of the unannounced spot check. Columns 2 and 3: Additional co-variates: respondent baseline attendance, age, gender, experience, agesquared, and experience squared. Column 2: Indicators for whethera head teacher was present in school at the start of the unannouncedspot checks. Column 3: Indicators for whether a teacher was present inschool at the start of the unannounced spot checks. Additional covari-ate: Grade level taught.∗p < 0.10, ∗∗p < 0.05, ∗∗∗p < 0.01

Table 4: Changes in Classroom Activities
Dependent Variable:Teacher inClassroom Any TLM Use
Engaged
Teacher
Engaged
Student
ActiveLearning
Index(1) (2) (3) (4) (5)
DI + Basic Mgmt 0.130∗∗∗ 0.192∗∗∗ 0.206∗∗∗ 0.180∗∗∗ 0.470∗∗∗
(0.032) (0.032) (0.025) (0.029) (0.060)
DI + Basic + Enhanced Mgmt 0.111∗∗∗ 0.126∗∗∗ 0.172∗∗∗ 0.163∗∗∗ 0.362∗∗∗
(0.034) (0.032) (0.026) (0.029) (0.059)
Observations 2,462 2,462 2,462 2,462 2,462R2 0.07 0.08 0.10 0.08 0.10Mean Dep., Control 0.68 0.48 0.46 0.48 0.00P-Value Same Effect 0.51 0.03 0.21 0.52 0.06
Notes: Unit of observation: class period by survey round. Regressions include whether the obser-vation is from the first or second spot check, whether the observation is from the first or secondclass period observed, the average percent of teachers present during the baseline survey, andstrata (district) fixed effects. Standard errors clustered at the school level appear in parenthesis.Linear probability models. Column 1: Whether the teacher was present during the entire class-room observation. Column 2: Whether teaching and learning materials were being used in theclassroom. Column 3: Whether the teacher was engaged with their students. Absent teachersare considered “not engaged.” Column 4: Whether a student was able to express their own ideaduring the classroom observation.∗p < 0.10, ∗∗p < 0.05, ∗∗∗p < 0.01

Table 5: Teacher DI Implementation
Dependent Var:Did
LevelingDI
Last WeekDI
TodayOwns DIManual
ClassIn Levels
DIImp Index
(1) (2) (3) (4) (5) (6)DI+Basic Mgmt 0.957∗∗∗ 0.898∗∗∗ 0.779∗∗∗ 0.759∗∗∗ 0.582∗∗∗ 0.509∗∗∗
(0.012) (0.021) (0.029) (0.034) (0.047) (0.125)
DI+Basic+Enhanced Mgmt 0.983∗∗∗ 0.935∗∗∗ 0.792∗∗∗ 0.774∗∗∗ 0.615∗∗∗ 0.533∗∗∗
(0.010) (0.017) (0.029) (0.036) (0.046) (0.122)
Observations 1,126 1,126 1,126 590 412 210R2 0.91 0.79 0.57 0.57 0.44 0.23P-Value Same Effect 0.08 0.14 0.74 0.74 0.57 0.88
Notes: Regressions include teacher age, gender, experience, age squared and experience squared,and district and survey round fixed effects. Standard errors clustered at the school level appear inparenthesis. No control teachers undertook any of these actions, therefore the values are 0 for controlschools. Column 1: Whether the teacher self-reported conducting the leveling exam. Column 2:Whether the teacher reported having split students by levels instead of by class at least 4 times inthe past week. Column 3: Whether the teacher reported doing DI or planning to do DI that day.Column 4: Whether the teacher reported at the endline still owning the DI manual. Column 5:Whether the class was split by levels during the unannounced spot checks. Column 6: An index of DIimplementation, at the school level.∗p < 0.10, ∗∗p < 0.05, ∗∗∗p < 0.01

Table 6: Norms of Acceptable Behavior
Teacher Opinions
of Teachers
Teacher Opinions of
All Roles(Index)
HT Opinions
of Teachers
HT Opinions of
All Roles(Index)
(1) (2) (3) (4)DI + Basic Mgmt -0.261∗∗ -0.310∗∗∗ -0.251∗ -0.038
(0.108) (0.105) (0.152) (0.153)
DI + Basic + Enhanced Mgmt -0.354∗∗∗ -0.401∗∗∗ -0.301∗∗ -0.206(0.107) (0.118) (0.142) (0.156)
Observations 461 461 209 209R2 0.28 0.28 0.26 0.28Mean Dep., Control -0.00 0.00 -0.00 -0.00P-Value Same Effect 0.36 0.40 0.74 0.28
Notes: Respondents were asked at endline questions regarding whether or not a particular action by a hypotheticalperson (student, teacher, head teacher, circuit supervisor) was acceptable or not. Sample of teachers is restricted tothose from baseline. Indices of questions about hypothetical people in a particular role, grouped by respondent type,standardized by control group mean and standard deviation. Regressions include respondent age, gender, experience,age squared and experience squared, and district and survey round fixed effects. Standard errors clustered at theschool level appear in parentheses. Column 1: Index of assessments of hypothetical teachers by teachers. Column 2:Index combining all teacher responses. Column 3: Index of assessments of hypothetical teachers by head teachers.Column 4: Index over all vignettes reported by head teachers.∗p < 0.10, ∗∗p < 0.05, ∗∗∗p < 0.01

Table 7: Student Test Scores
CombinedScore
MathScore
English
Score(1) (2) (3)
DI + Basic Mgmt 0.108∗∗∗ 0.140∗∗∗ 0.065∗∗∗
(0.021) (0.026) (0.022)
DI + Basic + Enhanced Mgmt 0.107∗∗∗ 0.131∗∗∗ 0.076∗∗∗
(0.024) (0.029) (0.024)
Observations 5,608 5,608 5,608R2 0.74 0.63 0.71Mean Dep., Control 0.33 0.32 0.30P-Value Same Effect 0.95 0.75 0.63
Notes: Regressions include controls for student age, age-squared,grade at baseline, baseline assessment scores, female, and strata(district) fixed effects. Standard errors clustered at the schoollevel appear in parenthesis. Scores standardized relative to thebaseline pooled sample.∗p < 0.10, ∗∗p < 0.05, ∗∗∗p < 0.01

Table 8: Outcomes in Year After Implementation
TeacherRetention
HTRetention
SC3 Indexof Mgmt
Class inLevels
(1) (2) (3) (4)DI + Basic Mgmt 0.178∗∗∗ 0.065 0.263∗∗ 0.416∗∗∗
(0.046) (0.081) (0.131) (0.072)
DI + Basic + Enhanced Mgmt 0.083∗ 0.082 0.382∗∗∗ 0.448∗∗∗
(0.050) (0.084) (0.129) (0.091)
Observations 687 208 208 127R2 0.18 0.09 0.56 0.39Mean Dep., Control 0.59 0.59 0.00 0.00P-Value Same Effect 0.03 0.84 0.42 0.77
Notes: Data collected during an unannounced spot check in Term 2 of the yearafter the intervention. Not all schools were reached due to Covid-19 related ces-sation of fieldwork. Linear probability models. Regressions include district fixedeffects, with standard errors clustered at the school level. Column 1: whether ornot a teacher from the first unannounced spot check in the year of the interventionwas still working at the school as of the unannounced spot check during Term2 of the year after the intervention. Column 2: Whether the head teacher fromthe evaluation year was still the head teacher of the same school during Term 2of the year after the intervention. Column 3: whether students were divided intolevels. Column 4: Swindex of all available management variables. All regressionsinclude strata (district) fixed effects. Standard errors clustered at the school levelappear in parenthesis.∗p < 0.10, ∗∗p < 0.05, ∗∗∗p < 0.01

Appendix Figures

Figure A1: Distribution of Student Test Scores at Baseline

Figure A2: Correlation Between Management and Student Test Scores
-.4-.2
0.2
.4Ba
selin
e Te
st S
core
-2 -1 0 1 2Management Practices Baseline

Figure A3: Non-Parametric Test Results

Figure A4: Mediation Analysis: Correlation of Management and Test Score Treatment Effects

Appendix Tables

Table A1: Individual Components of Instructional Management Index
DI+Basic
DI+Basic+Enhd p-value
Mean forControl ’
(1) (2) (3) (4)Average Number of P4-P6 Classroom Obsevations (5 min) by HT (HT) 0.266 -0.629 0.015 3.299
(0.492) (0.421)
Pupils test scores are used to inform promotion (HT) 0.253∗∗∗ 0.232∗∗ 0.820 4.286(0.098) (0.091)
How often P4-P6 teachers use lesson plans (HT) 0.029 0.125 0.146 3.829(0.097) (0.083)
Number CS classroom observations (HT) 1.785∗∗∗ 2.796∗∗∗ 0.051 2.171(0.424) (0.432)
Teachers pay attention to indvidual student needs (HT) 0.128 0.031 0.250 4.114(0.110) (0.114)
HT Classroom Observations (5 min) (T) 0.596 0.064 0.121 3.284(0.390) (0.317)
CS Classroom Observations (5 min) (T) 0.616∗∗∗ 0.712∗∗∗ 0.449 0.779(0.111) (0.128)
HT Classroom Observation Feedback (T) 0.174∗∗∗ 0.215∗∗∗ 0.218 0.591(0.037) (0.036)
CS Classroom Observation Feedback (T) 0.280∗∗∗ 0.318∗∗∗ 0.328 0.305(0.036) (0.036)
Average Number of P4-P6 Classroom Obsevations (30 min) by HT (HT) 0.950∗∗∗ 0.806∗∗∗ 0.470 0.849(0.192) (0.203)
How often does HT observe teaching in school (HT) 0.160 0.264∗∗ 0.408 3.371(0.133) (0.128)
HT Classroom Observations (30 min) (T) 0.709∗∗∗ 0.899∗∗∗ 0.212 0.725(0.142) (0.124)
CS Classroom Observations (30 min) (T) 0.459∗∗∗ 0.671∗∗∗ 0.019 0.206(0.074) (0.083)
Number of CS Classroom Obsevations (5 min) in study schools (CS) -0.003 1.038∗∗∗ 0.000 2.412(0.180) (0.222)
Number of CS Classroom Obsevations (30 min) in study schools (CS) -0.014 1.966∗∗∗ 0.000 3.539(0.329) (0.422)
CS Classroom Obsevations Frequency (5 min) (CS) 0.007 0.268∗ 0.060 2.985(0.132) (0.139)
CS Classroom Obsevations (30 min) Frequency (CS) 0.005 0.075 0.620 2.909(0.124) (0.141)
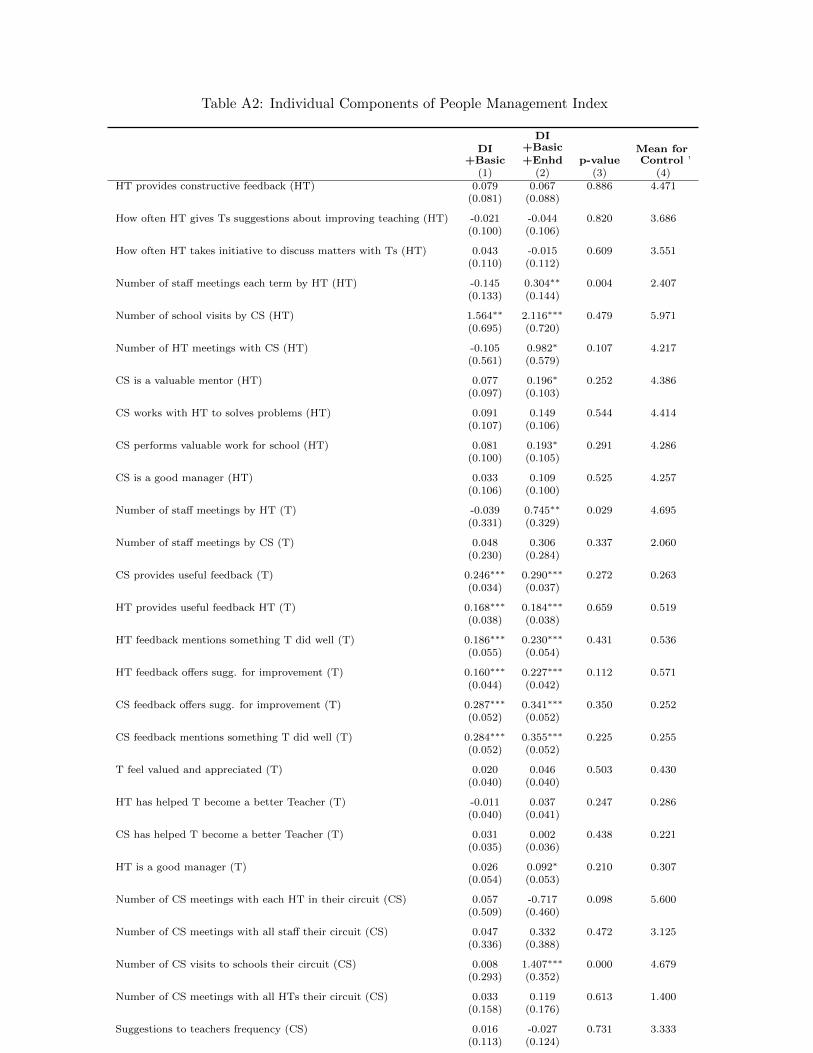
Table A2: Individual Components of People Management Index
DI+Basic
DI+Basic+Enhd p-value
Mean forControl ’
(1) (2) (3) (4)HT provides constructive feedback (HT) 0.079 0.067 0.886 4.471
(0.081) (0.088)
How often HT gives Ts suggestions about improving teaching (HT) -0.021 -0.044 0.820 3.686(0.100) (0.106)
How often HT takes initiative to discuss matters with Ts (HT) 0.043 -0.015 0.609 3.551(0.110) (0.112)
Number of staff meetings each term by HT (HT) -0.145 0.304∗∗ 0.004 2.407(0.133) (0.144)
Number of school visits by CS (HT) 1.564∗∗ 2.116∗∗∗ 0.479 5.971(0.695) (0.720)
Number of HT meetings with CS (HT) -0.105 0.982∗ 0.107 4.217(0.561) (0.579)
CS is a valuable mentor (HT) 0.077 0.196∗ 0.252 4.386(0.097) (0.103)
CS works with HT to solves problems (HT) 0.091 0.149 0.544 4.414(0.107) (0.106)
CS performs valuable work for school (HT) 0.081 0.193∗ 0.291 4.286(0.100) (0.105)
CS is a good manager (HT) 0.033 0.109 0.525 4.257(0.106) (0.100)
Number of staff meetings by HT (T) -0.039 0.745∗∗ 0.029 4.695(0.331) (0.329)
Number of staff meetings by CS (T) 0.048 0.306 0.337 2.060(0.230) (0.284)
CS provides useful feedback (T) 0.246∗∗∗ 0.290∗∗∗ 0.272 0.263(0.034) (0.037)
HT provides useful feedback HT (T) 0.168∗∗∗ 0.184∗∗∗ 0.659 0.519(0.038) (0.038)
HT feedback mentions something T did well (T) 0.186∗∗∗ 0.230∗∗∗ 0.431 0.536(0.055) (0.054)
HT feedback offers sugg. for improvement (T) 0.160∗∗∗ 0.227∗∗∗ 0.112 0.571(0.044) (0.042)
CS feedback offers sugg. for improvement (T) 0.287∗∗∗ 0.341∗∗∗ 0.350 0.252(0.052) (0.052)
CS feedback mentions something T did well (T) 0.284∗∗∗ 0.355∗∗∗ 0.225 0.255(0.052) (0.052)
T feel valued and appreciated (T) 0.020 0.046 0.503 0.430(0.040) (0.040)
HT has helped T become a better Teacher (T) -0.011 0.037 0.247 0.286(0.040) (0.041)
CS has helped T become a better Teacher (T) 0.031 0.002 0.438 0.221(0.035) (0.036)
HT is a good manager (T) 0.026 0.092∗ 0.210 0.307(0.054) (0.053)
Number of CS meetings with each HT in their circuit (CS) 0.057 -0.717 0.098 5.600(0.509) (0.460)
Number of CS meetings with all staff their circuit (CS) 0.047 0.332 0.472 3.125(0.336) (0.388)
Number of CS visits to schools their circuit (CS) 0.008 1.407∗∗∗ 0.000 4.679(0.293) (0.352)
Number of CS meetings with all HTs their circuit (CS) 0.033 0.119 0.613 1.400(0.158) (0.176)
Suggestions to teachers frequency (CS) 0.016 -0.027 0.731 3.333(0.113) (0.124)
Strongly agree CS valuable mentor for teachers (CS) 0.001 0.091∗∗ 0.039 0.692(0.043) (0.042)
Strongly agree CS valuable mentor for headteachers (CS) 0.001 0.054 0.232 0.715(0.044) (0.044)
Strongly agree CS provides constructive feedback to teachers (CS) -0.002 0.095∗∗ 0.036 0.672(0.047) (0.046)
Strongly agree CS perform valuable work for school (CS) 0.000 0.084 0.156 0.608(0.061) (0.059)
CS provides suggestions to HT (CS) -0.003 0.105 0.190 4.697(0.072) (0.083)

Table A3: Individual Components of All Other Management Index
DI+Basic
DI+Basic+Enhd p-value
Mean forControl ’
(1) (2) (3) (4)An important part of HT job is to ensure teaching skills are improving (HT) 0.113 0.131∗ 0.811 4.557
(0.081) (0.079)
An important part of HT job is to ensure teachers are held accountable (HT) 0.257∗∗∗ 0.214∗∗ 0.624 4.343(0.091) (0.095)
HT encourages teachers to try new practices (HT) 0.151∗ 0.118 0.694 4.314(0.079) (0.083)
HT scheduled meetings with parents (HT) -0.053 0.073∗ 0.003 0.836(0.041) (0.037)
Teachers receive rewards for good performance (HT) -0.090 0.040 0.099 0.700(0.079) (0.080)
School had student atendance records (HT) 0.033 -0.012 0.361 0.900(0.048) (0.051)
School had teacher atendance records (HT) 0.042 0.042 0.998 0.943(0.031) (0.032)
Schools uses teacher feedback to guide goals (HT) 0.086 0.154∗ 0.460 4.243(0.083) (0.083)
Teachers share new pratices with other teachers (HT) 0.360∗∗∗ 0.148 0.026 4.029(0.087) (0.097)
Teachers encourage students to approach them for supplemental help (HT) 0.211∗∗ 0.092 0.220 4.029(0.102) (0.111)
The school uses student scores to establish teachers’ effectiveness (HT) 0.085 0.148 0.565 4.100(0.107) (0.090)
HT presence at spot checks (Spotcheck) 0.107 0.154∗∗ 0.486 0.421(0.067) (0.068)
An important part of CS job is to ensure teaching skills are improving (CS) -0.001 0.026 0.695 4.742(0.073) (0.071)
An important part of CS job is to ensure teachers are held accountable (CS) -0.002 0.023 0.734 4.667(0.072) (0.075)
Schools have goals/school development plan (CS) 0.002 0.215∗∗ 0.027 4.258(0.098) (0.095)
CS tried out new ideas in school (CS) 0.018 0.124 0.294 4.197(0.090) (0.101)
Schools use student scores to guide school goals (CS) -0.015 0.234∗∗ 0.016 4.152(0.105) (0.104)

Table A4: Management Outcomes Indices By Respondent Type
Index: Instructional Management People ManagementReported by: Subordinate Self Subordinate Self
(1) (2) (3) (4)DI + Basic Mgmt 0.598∗∗∗ 0.225 0.331∗∗ 0.018
(0.133) (0.148) (0.161) (0.137)
DI + Basic + Enhanced Mgmt 0.578∗∗∗ 0.340∗∗ 0.678∗∗∗ 0.339∗∗
(0.124) (0.135) (0.150) (0.149)
Observations 210 210 210 210R2 0.34 0.17 0.28 0.36Mean Dep., Control 0.00 0.00 0.00 0.00P-Value Same Effect 0.87 0.30 0.04 0.03
Notes: The outcome variable in all regressions are standardized weighted indices of management outcomes.All regressions include baseline management index and district fixed effects. Standard errors are clusteredat the school level. ∗p < 0.10, ∗∗p < 0.05, ∗∗∗p < 0.01

Table A5: Classroom Activities Conditional on Teacher Presence
Any TLM Use
Engaged
Teacher
Engaged
Student
ActiveLearning
Index(1) (2) (3) (4)
DI + Basic Mgmt 0.123∗∗∗ 0.148∗∗∗ 0.105∗∗∗ 0.370∗∗∗
(0.026) (0.025) (0.025) (0.055)
DI + Basic + Enhanced Mgmt 0.054∗∗ 0.114∗∗∗ 0.107∗∗∗ 0.251∗∗∗
(0.026) (0.025) (0.023) (0.051)
Observations 1,876 1,876 1,876 1,876R2 0.15 0.10 0.06 0.11Mean Dep., Control 0.71 0.64 0.70 0.00P-Value Same Effect 0.00 0.16 0.91 0.02
Notes: All regressions include controls for whether the observation is from the firstor second spot check, whether the observation is from the first or second classroomobservation at each spot check, the average percent of teachers present during thebaseline survey, and strata (district) fixed effects. Sample: teacher was presentduring the classroom observation. Standard errors in parentheses, clustered at theschool level. ∗p < 0.10, ∗∗p < 0.05, ∗∗∗p < 0.01

Table A6: Classroom Activities by Period
Teacher inClassroom
Any TLM
Use
Engaged
Teacher
Engaged
Student
Active Learning
Index(1) (2) (3) (4) (5)
Panel A: First PeriodDI + Basic Mgmt 0.144∗∗∗ 0.200∗∗∗ 0.201∗∗∗ 0.180∗∗∗ 0.473∗∗∗
(0.035) (0.036) (0.037) (0.038) (0.078)
DI + Basic + Enhanced Mgmt 0.130∗∗∗ 0.152∗∗∗ 0.193∗∗∗ 0.173∗∗∗ 0.413∗∗∗
(0.040) (0.040) (0.038) (0.040) (0.082)
Observations 1,231 1,231 1,231 1,231 1,231R2 0.105 0.118 0.143 0.093 0.136Mean Dep., Control 0.66 0.48 0.49 0.50 0.04P-Value Same Effect 0.69 0.22 0.82 0.87 0.46
Panel B: Second PeriodDI + Basic Mgmt 0.117∗∗∗ 0.185∗∗∗ 0.210∗∗∗ 0.180∗∗∗ 0.466∗∗∗
(0.038) (0.040) (0.038) (0.039) (0.080)
DI + Basic + Enhanced Mgmt 0.093∗∗ 0.100∗∗ 0.152∗∗∗ 0.153∗∗∗ 0.311∗∗∗
(0.037) (0.040) (0.038) (0.038) (0.076)
Observations 1,231 1,231 1,231 1,231 1,231R2 0.075 0.076 0.095 0.085 0.090Mean Dep., Control 0.70 0.47 0.43 0.45 -0.04P-Value Same Effect 0.48 0.02 0.14 0.44 0.05
Notes: All
regressions include controls for whether the observation is from the first or second spot check, the average percent ofteachers present during the baseline survey, and strata (district) fixed effects. Panel A is the first period observation
and Panel B is the second period observation. Standard errors in parentheses, clustered at the school level.∗p < 0.10, ∗∗p < 0.05, ∗∗∗p < 0.01

Table A7: Norms of Acceptable Behavior
Teacher’sOpinions
of Students
Teacher’sOpinions
of HTs
Teacher’sOpinions
of CS
HTOpinions
of Students
HTOpinions
of HTs
HTOpinions
of CS(1) (2) (3) (4) (5) (6)
DI + Basic Mgmt -0.141 -0.254∗∗ -0.203∗ -0.201 -0.055 0.113(0.119) (0.108) (0.111) (0.159) (0.166) (0.157)
DI + Basic + Enhanced Mgmt -0.242∗ -0.301∗∗∗ -0.208 -0.197 -0.185 -0.037(0.132) (0.115) (0.131) (0.146) (0.152) (0.157)
Observations 461 461 461 209 209 209R2 0.18 0.21 0.15 0.17 0.25 0.21Mean Dep., Control 0.00 0.00 0.00 0.00 0.00 0.00P-Value Same Effect 0.43 0.61 0.97 0.98 0.44 0.33
Notes: See Table 6. Column 1: reports of hypothetical students by teachers. Column 2: reports of hypotheticalhead teachers by teachers. Column 3: reports of hypothetical circuit supervisors by teachers. Column 4: reports ofhypothetical students by head teachers. Column 5: reports of hypothetical head teachers by head teachers. Column6: reports of hypothetical circuit supervisors by by head teachers.∗p < 0.10, ∗∗p < 0.05, ∗∗∗p < 0.01

Table A8: Work Stress and Burnout
Teacher StressIndex
HT StressIndex
(1) (2)DI+Basic Mgmt 0.039 0.043
(0.081) (0.118)
DI+Basic+Enhanced Mgmt 0.164∗ -0.000(0.083) (0.116)
Observations 1,850 621R2 0.09 0.19Mean Dep., Control 0.01 -0.00P-Value Same Effect 0.17 0.70
Notes: All regressions include age, gender, experience, agesquared, experience squared, and district and round fixedeffects. Standard errors are clustered at the school level.∗p < 0.10, ∗∗p < 0.05, ∗∗∗p < 0.01

Table A9: Additional Test Score Specifications
CombinedScore
MathScore
English
Score(1) (2) (3)
Panel A: Limited CovariatesDI + Basic Mgmt 0.106∗∗∗ 0.134∗∗∗ 0.067∗∗
(0.033) (0.036) (0.033)
DI + Basic + Enhanced Mgmt 0.081∗∗ 0.109∗∗∗ 0.050(0.037) (0.039) (0.037)
Panel B: Foundational Skills OnlyDI + Basic Mgmt 0.139∗∗∗ 0.183∗∗∗ 0.071∗∗∗
(0.027) (0.034) (0.022)
DI + Basic + Enhanced Mgmt 0.169∗∗∗ 0.203∗∗∗ 0.104∗∗∗
(0.029) (0.035) (0.027)
Panel C: Upper-Level Items OnlyDI + Basic Mgmt 0.075∗∗∗ 0.086∗∗∗ 0.045∗
(0.023) (0.027) (0.026)
DI + Basic + Enhanced Mgmt 0.054∗∗ 0.067∗∗ 0.033(0.026) (0.030) (0.027)
Panel D: Subset Asked of All StudentsDI + Basic Mgmt 0.118∗∗∗ 0.131∗∗∗ 0.075∗∗
(0.034) (0.036) (0.030)
DI + Basic + Enhanced Mgmt 0.114∗∗∗ 0.133∗∗∗ 0.064∗
(0.037) (0.039) (0.034)
Observations 5,608 5,608 5,608
Notes: Sample: all students available for the followup assessments. Outcomes: standardized latent ability of eachstudent for combined, math, and English questions. All regressions include baseline controls for student age, age-squared, grade at baseline, baseline assessment scores, female, and strata (district) fixed effects. Standard errors inparentheses, clustered at the school level. Notes: Panel A: includes only baseline test score and strata as covariates.Panel B and C: Test questions are mutually exclusive and completely exhaustive. Panel B: Outcome is the score onthe ASER-like items only. Panel C: Outcome is the score on upper level questions only. Panel D: Outcome is thescore on questions asked of all students.∗p < 0.10, ∗∗p < 0.05, ∗∗∗p < 0.01

Table A10: Tested At Endline
Student in EL Student in EL(1) (2)
DI + Basic Mgmt -0.003 -0.003(0.006) (0.006)
DI + Basic + Enhanced Mgmt -0.015** -0.015**(0.007) (0.007)
DI+Basic Mgmt X Baseline Test Score 0.006(0.007)
DI+Basic+Enhanced Mgmt X Baseline Test Score -0.002(0.008)
Baseline Test Score 0.006 0.004(0.003) (0.005)
Observations 5,893 5,893R2 0.018 0.019
The sample is all baseline students. All regressions include baseline controls for studentgrade, baseline ability on combined math and English, student age, age-squared, female,and strata (district) fixed effects. Standard errors in parentheses, clustered at the schoollevel. * p<0.10, ** p<0.05, *** p<0.01

Table A11: Lee Bounds for Student Test Scores
Combined Score Math Score English ScoreLower Upper Lower Upper Lower Upper
(1) (2) (3) (4) (5) (6)
DI + Basic Mgmt 0.105*** 0.106*** 0.140*** 0.138*** 0.062*** 0.064***(0.021) (0.021) (0.026) (0.026) (0.022) (0.022)
DI + Basic + Enhanced Mgmt 0.101*** 0.102*** 0.124*** 0.128*** 0.072*** 0.073***(0.024) (0.024) (0.030) (0.029) (0.024) (0.024)
Observations 5,546 5,546 5,546 5,546 5,546 5,546R2 0.737 0.735 0.625 0.616 0.700 0.702
Notes: Lee (2009) bounding method applied to sample in Table 7. See additional notes in Table 7.

Table A12: Student Test Scores: Heterogeneous Treatment Effects
(1) (2) (3) (4) (5)
DI + Basic Mgmt 0.106*** 0.098*** 0.098*** 0.117*** 0.106***(0.021) (0.027) (0.030) (0.029) (0.031)
DI + Basic + Enhanced Mgmt 0.106*** 0.091*** 0.096*** 0.121*** 0.129***(0.024) (0.029) (0.028) (0.034) (0.035)
DI+Basic Mgmt X Baseline Test Score 0.011(0.022)
DI+Basic+Enhanced Mgmt X Baseline Test Score 0.002(0.022)
DI+Basic Mgmt X Female Student 0.023(0.036)
DI+Basic+Enhanced Mgmt X Female Student 0.034(0.035)
DI+Basic Mgmt X P4 Pupil at Baseline 0.020(0.042)
DI+Basic+Enhanced Mgmt X P4 Pupil at Baseline 0.023(0.032)
DI+Basic Mgmt X Either Parent Literate -0.004(0.034)
DI+Basic+Enhanced Mgmt X Either Parent Literate -0.030(0.035)
DI+Basic Mgmt X Above Median Amenities 0.002(0.043)
DI+Basic+Enhanced Mgmt X Above Median Amenities -0.036(0.046)
Observations 5,608 5,608 5,608 5,396 5,608R2 0.746 0.743 0.743 0.743 0.746
Notes: See Table 7. Column 5: Amenity index calculated at the school level.

Table A13: Student Attendance
Student AbsentFrom School(Spot Checks)
School Reports
Student Not Enrolled(Any Spot Check)
StudentSelf-Reported
Dropout
(Endline)(1) (2) (3)
DI + Basic Mgmt 0.031∗∗ 0.028∗∗∗ 0.001(0.014) (0.009) (0.004)
DI + Basic + Enhanced Mgmt -0.000 0.019∗∗ 0.004(0.013) (0.009) (0.005)
Observations 11,569 5,893 5,608R2 0.03 0.02 0.02Mean Dep., Control 0.17 0.06 0.01P-Value Same Effect 0.02 0.38 0.40
Notes: All regressions include baseline test score, age, age-squared, and gender, district andround fixed effects. Standard errors clustered at the school level. Column 1: Whether thestudent was present the day of the unannounced spot check. The data could not be collectedif classes were not in session. Column 2: Students present coded as enrolled. Teacher andhead teacher reports of whether absent students were still enrolled. One observation perstudent. Column 3: Whether the student self-reported that they were no longer attendingschool at the endline survey. ∗p < 0.10, ∗∗p < 0.05, ∗∗∗p < 0.01

Table A14: Student Opinions About School
Fave subject is
Math or Eng
Like Mathor English
Very MuchWant to Attend
SHS(1) (2) (3)
DI + Basic Mgmt 0.012 0.046*** -0.002(0.017) (0.014) (0.007)
DI + Basic + Enhanced Mgmt -0.028 0.019 0.000(0.018) (0.015) (0.006)
Observations 5,608 5,608 5,550R2 0.060 0.053 0.035Mean Dep., Control 0.788 0.793 0.966P-Value Same Effect 0.019 0.055 0.719
The sample is all student available for the endline assessments. Column 1: The outcome variable iswhether or not the child reported their favorite subject was math or English. Column 2: The outcomevariable is whether or not the child reported liking math or English Column 3: Whether the childaspired to attend senior high school. Standard errors in parentheses, clustered at the school level. *p<0.10, ** p<0.05, *** p<0.01