improving global and regional projections of climate impacts …€¦ · · 2014-05-16improving...
TRANSCRIPT

Improving Global and Regional Projections of Climate Impacts on Agriculture and Food Security
Cynthia Rosenzweig1, Jim Jones2, Jerry Hatfield3, Alex Ruane1, and Sonali McDermid1
1NASA GISS, 2University of Florida, 3USDA-Ames
AAAS February 15, 2013

Why AgMIP?
• Agricultural risks growing, including climate change – Climate extremes affecting major agricultural regions – Regional and world food crises driven by multiple environmental and economic stresses – Decision-makers demanding improved information for risk management
• Consistent approach needed to enable agricultural sector analysis across relevant scales and disciplines
– Difficult to compare climate impact studies across regions and models – Lack of a transdisciplinary community connecting climate scientists, crop modelers, economists, and IT specialists – Need for improved climate assessment based on multi-model capabilities and better defined uncertainties
• Long-term process lacking for rigorous agricultural model testing, improvement, and assessment
– Agricultural model evaluation and assessment lagging behind climate model intercomparisons and projections – Need to make better use of available data and methods – There is a need for a continuing process i.e., AgMIP 1 à AgMIP2 . . .
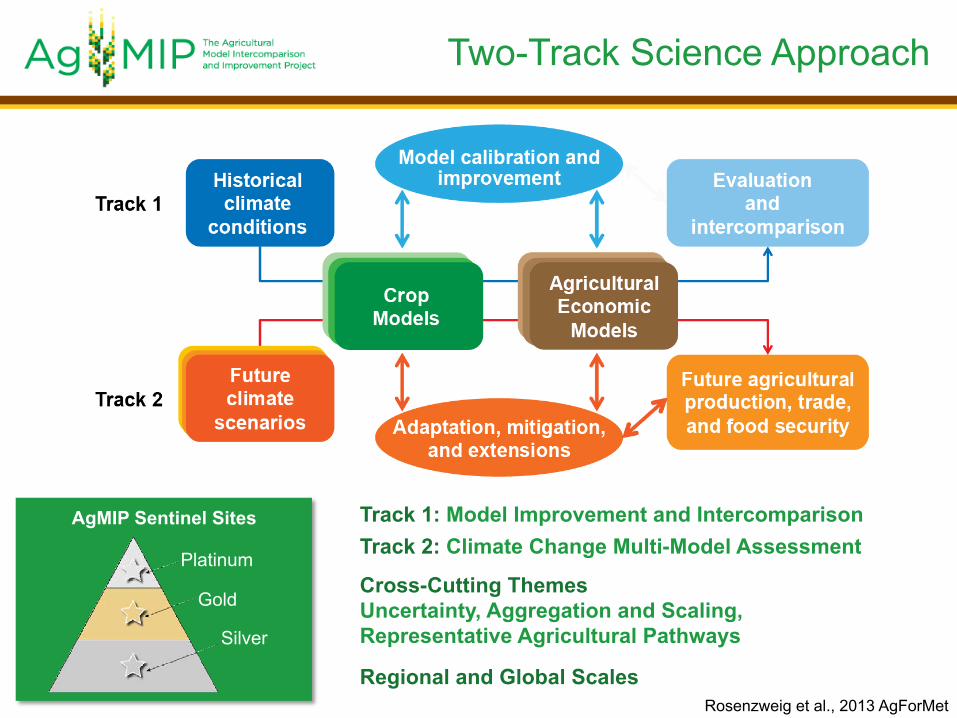
Track 1: Model Improvement and Intercomparison Track 2: Climate Change Multi-Model Assessment Cross-Cutting Themes Uncertainty, Aggregation and Scaling, Representative Agricultural Pathways Regional and Global Scales
AgMIP Sentinel Sites
Silver
Gold
Platinum
Two-Track Science Approach
Rosenzweig et al., 2013 AgForMet

Worldwide Learning Community
1st Global Oct 2010
South America
2nd Global Oct 2011
Rice
Wheat
Sub-Saharan Africa South Asia
3rd Global Oct 2012
~500 listserve members
Maize

Capacity Building and Decision Making • Regional vulnerability • Adaptation strategies • Trade policy instruments • Technology exchange
Climate Team
Crop Modeling Team
Economics Team
Information Technology
Team
Improvements and Intercomparisons
• Crop models • Agricultural economic models • Scenario construction • Aggregation methodologies
Cross-Cutting Themes
• Uncertainty
• Aggregation and Scaling
• Representative Agricultural Pathways
Assessments • Regional • Global • Crop-specific
Work Groups
• Soils
• Water Resources
• Livestock and Grasslands
• Pests and Diseases
Teams, Linkages and Outcomes
Rosenzweig et al., 2013

New Methods for Regional Integrated Assessment
(ω)
0
Map of a heterogeneous region
Distribution of gains and losses (e.g., due to CC or adaptation) = v1 – v2 = losses from CC v1 = present income v2 = future income
Losses > 0
Gains < 0
= losses
Antle et al., 2013

Regional Integrated Assessments
AgMIP Handbook on Regional Integrated Assessment
Interdisciplinary teams link climate scenarios, crop modeling, and economic modeling in distributional approach

Representative Agricultural Pathways RCPs, SSPs, RAPs
Physical & economic heterogeneity
Land allocation
Farm & household size
Non-farm income Crop, fertilizer and fuel prices
Crop & livestock productivity
Mitigation policy
Infrastructure SSP
RAP
RCP
Global GDP
Population
Trade policy
Antle, 2011; Arnell and Kram, 2011
Representa)ve Agricultural Pathways • RAPs needed for crop and economic
modeling scenarios • Similar scenarios may be useful for
other impacts sectors
John Antle, Oregon State University
Crosscutting theme

Benefits include - Improved capacity for climate, crop and economic modeling to identify and prioritize adaptation strategies - Consistent protocols, scenarios and data access - Improved regional assessments of climate impacts - Facilitated transdisciplinary collaboration and active partnerships - Contributions to National Adaptation Plans
= Wheat
= Maize
= Rice
0˚
0˚ 90˚ -90˚
45˚
-45˚ = Sugarcane
Ames
Morogoro
Wongan Hills
Delhi
Ludhiana
Ayr
Los Baños
Piracicaba
Shizukuishi
Rio Verde
La Mercy
Haarweg
Lusignan
Balcarce
Nanjing
AgMIP Sentinel Sites
Regions and Crop Model Pilots
North America
South America
Sub-Saharan Africa
Europe
South Asia
Asia*
Australia*
*In Development
Rosenzweig et al., 2013

Maize Crop Pilot Preliminary Results
Model Behavior Maize Crop Pilot Sensitivity Analysis
Low input information
Response to Temperature (6 models)
0
0,2
0,4
0,6
0,8
1
1,2
1,4
1,6
1,8
-‐5 0 5 10
yield ratio
Temperature increase (°C)
Morogoro (Tanzania)
00,20,40,60,81
1,21,41,61,8
-‐5 0 5 10
Yield ratio
T increase
Ames (Us)Ames (US)

Wheat Pilot
Uncertainties in simulating wheat yields under climate change In Review: Nature Climate Change
S. Asseng, F. Ewert, C. Rosenzweig, J.W. Jones, J.L. Hatfield, A. Ruane, K.J. Boote, P. Thorburn, R.P. Rötter, D. Cammarano, N. Brisson#, B. Basso, P. Martre, P.K. Aggarwal, C. Angulo, P. Bertuzzi, C. Biernath, A.J. Challinor, J. Doltra, S. Gayler, R. Goldberg, R. Grant, L. Heng, J. Hooker, L.A. Hunt, J. Ingwersen, R.C. Izaurralde, K.C. Kersebaum, C. Müller, S. Naresh Kumar, C. Nendel, G. O’Leary, J.E. Olesen, T. M. Osborne, T. Palosuo, E. Priesack, D. Ripoche, M.A. Semenov, I. Shcherbak, P. Steduto, C. Stöckle, P. Stratonovitch, T. Streck, I. Supit, F. Tao, M. Travasso, K. Waha, D. Wallach, J.W. White, J.R. Williams and J. Wolf 51 authors, 4 sites, 27 wheat models
27 wheat models

Crop Model Improvement
• Maize Model Improvement Work Group – Leaders M.Tollenaar, S. Kumudini, K. Boote, J. Jones
• Experimentalists and modelers interacting to use data on CO2, temperature, water, and nitrogen responses
– Leaders J. Hatfield, K. Boote First workshop held in Ames, Iowa - US, Sep 2012
• AgMIP Crop Experiment (ACE) database and interfaces for multiple crop models (DSSAT, APSIM, STICS completed)
– Led by C. Porter, S. Janssen, C. Villalobos
• AgMIP Crop Model Output (ACMO) database for input to economic models and analysis/visualization
– Led by C. Porter, S. Janssen, C. Villalobos

Global Scale Assessment
Potential Sources of Uncertainty
• Data collection and analysis • Scenarios
• Model ensembles • Unresolved processes
• Model interactions • Methodological choices
Climate Models
Crop and Livestock Models
Aggregation and Scaling
Global Economic Models
Aggregate Outputs Equilibrium Prices
RAPs
Regional Economic Models
RCPs
Regional and Global Model
Intercomparisons
SSPs
Rosenzweig et al., 2013
Daniel Wallach (INRA) Mike Rivington
(James Hutton Institute, Scotland) and Linda Mearns (NCAR)
Uncertainty Crosscutting Theme

Global Gridded Crop Models
Assessing agricultural risks of climate change in the 21st century in a global gridded crop model intercomparison
Submitted to: Proceedings of the National Academy of Science Cynthia Rosenzweig, Joshua Elliott, Delphine Deryng, Alex C. Ruane, Almut Arneth, Kenneth J. Boote, Christian Folberth, Michael Glotter, Christoph Müller, Kathleen Neumann, Franziska Piontek, Thomas Pugh, Erwin Schmid,
Elke Stehfest, and James W. Jones
7 GGCMs 5 GCMs 4 RCPs
w and w/o CO2 effects w and w/o irrigation
Site-based – field scale
dynamics and management
Ecosystem – C and N dynamics at global scale
6 PNAS papers, ~135 authors part of ISI-MIP

Economics Team - Global
The effects of climate change on agricultural prices (S3-S6 results in 2050 relative to S1 results in 2050)
Source: AgMIP model runs, December 2012.
Nelson, Gerald C., Dominique van der Mensbrugghe, Tomoko Hasegawa, Kiyoshi Takahashi, Ronald D. Sands, Page Kyle, Katherine Calvin, et al. 2013 submitted. “Agriculture and Climate Change in Global Scenarios: Why Don’t the Models Agree.” Agricultural Economics.
9 global economic
models

Launch of Coordinated Climate-Crop Modeling Project
C3MP
To mobilize the international community of crop modelers for a coordinated investigation of climate vulnerability and climate change impacts for AgMIP. Crop modelers are invited to run a set of common climate experiments at sites where their models are already-calibrated and then submit results to enable coordinated analysis and data products.
Limits of CTW Space Sensitivity tests in CTW Space

C3MP Results Emulator
From Ruane et al., forthcoming
[CO2] T
P T
[CO2] P
= baseline
Figure 1: Cross Sections of Hypercube Emulator for relative changes in 30-year mean Peanut yield (kg/ha)
Submitted results are used to fit emulators to estimate impacts response surfaces
The response surfaces help to efficiently assess
crop responses to CMIP5 climate scenarios probabilistically
Change in Temperature [-1 to +8]
Figure 2: 20 CMIP5 GCM Projections over Henry County, FL
%C
hang
e in
Pre
cipi
tatio
n [-5
0% to
50%
]
For more information, please contact Alex Ruane, Sonali McDermid, and Cynthia
Rosenzweig at [email protected]

18
What have we learned so far
• Tremendous interest in agricultural research community in interdisciplinary multi-model research and assessment.
• Exciting methodological advances being made.
• Global and regional scales need to be linked and trajectories of population, growth, technology, etc. need to be taken into account.
• Crop model uncertainty is large and generally greater than climate model uncertainty; model geneaology matters.
• Crop responses to CO2 and temperature are key sources of uncertainty.
• Economic model uncertainties are also large.
• Intercomparisons must lead to model improvement. Serious investment in agricultural models and data needed.
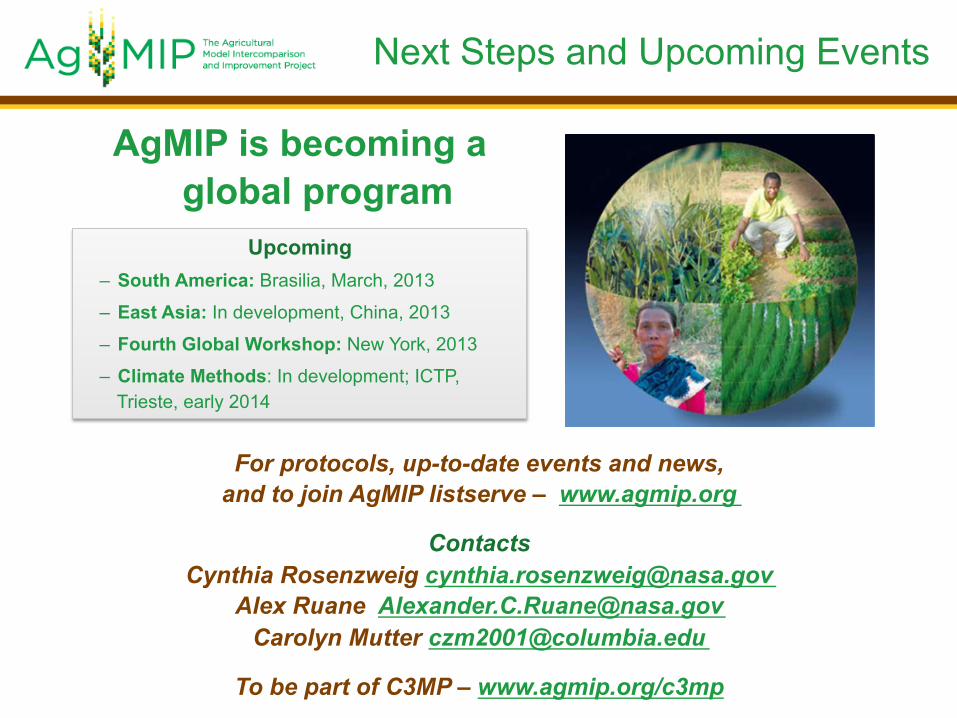
AgMIP is becoming a global program
Upcoming – South America: Brasilia, March, 2013
– East Asia: In development, China, 2013
– Fourth Global Workshop: New York, 2013
– Climate Methods: In development; ICTP, Trieste, early 2014
Next Steps and Upcoming Events
For protocols, up-to-date events and news, and to join AgMIP listserve – www.agmip.org
Contacts
Cynthia Rosenzweig [email protected] Alex Ruane [email protected]
Carolyn Mutter [email protected]
To be part of C3MP – www.agmip.org/c3mp