outline global climate change projections local climate change observations 1998 flood at nasa arc...
TRANSCRIPT
Outline
• Global Climate Change Projections• Local Climate Change Observations• 1998 Flood at NASA ARC• Anticipated Impacts of Climate Change• Suggested Adaptation Strategies

Global Climate Predictions• Global Mean Sea Level Rise
o SRES A1B = 2.1 – 6.0 mm / yro SRES B1 = 1.5 – 3.9 mm / yro SRES A2 = 3.0 – 8.5 mm / yr
• Global Annual Temperature Increaseo SRES A1B = 1.7 – 4.4 °Co SRES B1 = 1.1 -2.9 °Co SRES A2 = 2.0 -5.4 °C
• Precipitation Pattern Changeso Varies based on locationo Western US
More winter and less summer precipitation Overall drying through out the year
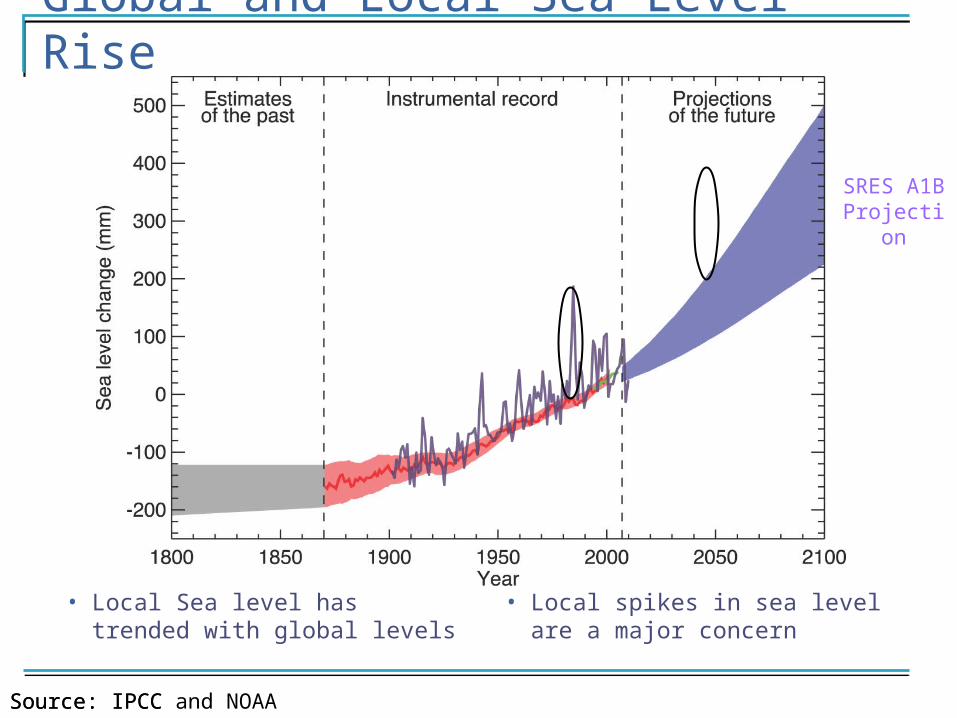
Global Sea Level RiseGlobal and Local Sea Level Rise
• Local spikes in sea level are a major concern
Source: IPCCSource: IPCC and NOAA
• Local Sea level has trended with global levels
SRES A1B Projection
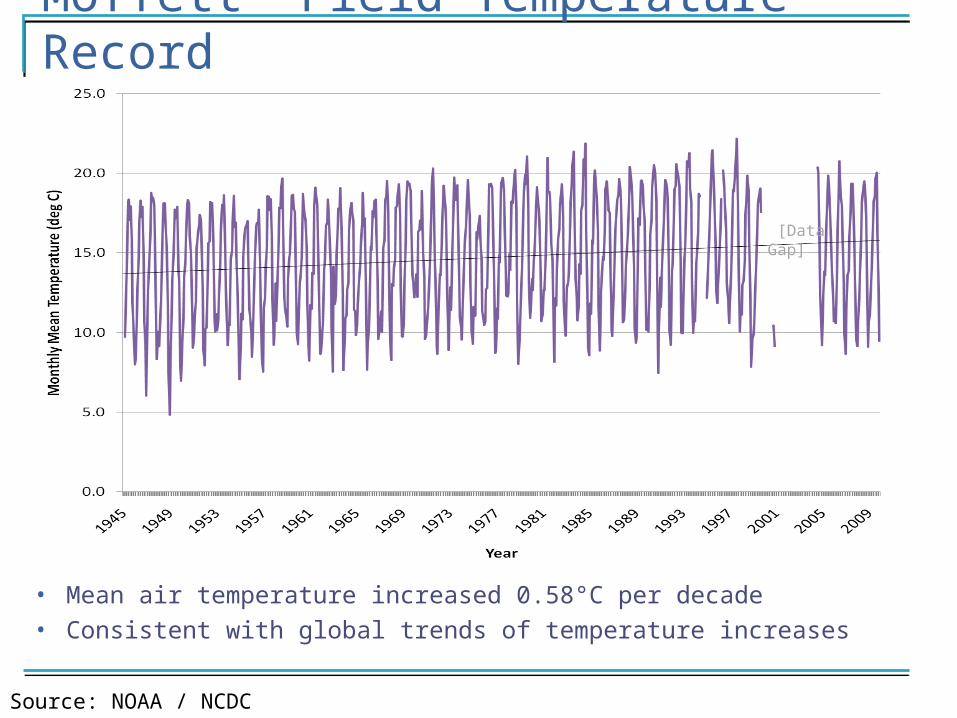
Moffett Field Temperature Record
• Mean air temperature increased 0.58°C per decade• Consistent with global trends of temperature increases
Source: NOAA / NCDC
[Data Gap]
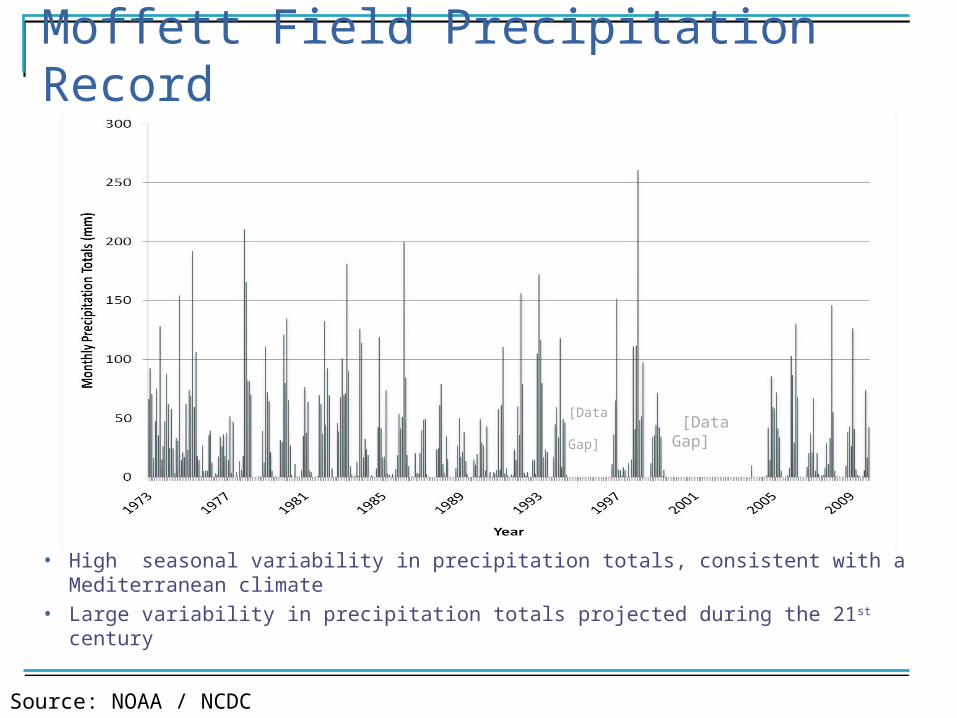
Moffett Field Precipitation Record
• High seasonal variability in precipitation totals, consistent with a Mediterranean climate
• Large variability in precipitation totals projected during the 21st century
[Data Gap][Data Gap]
Source: NOAA / NCDC
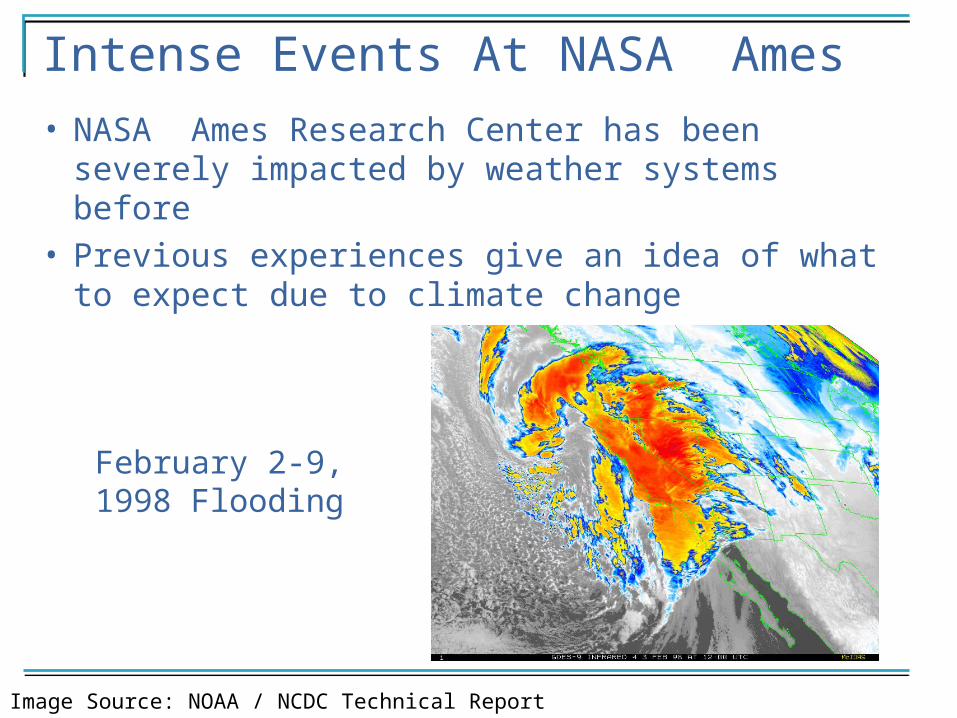
Intense Events At NASA Ames
February 2-9, 1998 Flooding
• NASA Ames Research Center has been severely impacted by weather systems before
• Previous experiences give an idea of what to expect due to climate change
Image Source: NOAA / NCDC Technical Report no. 98-02
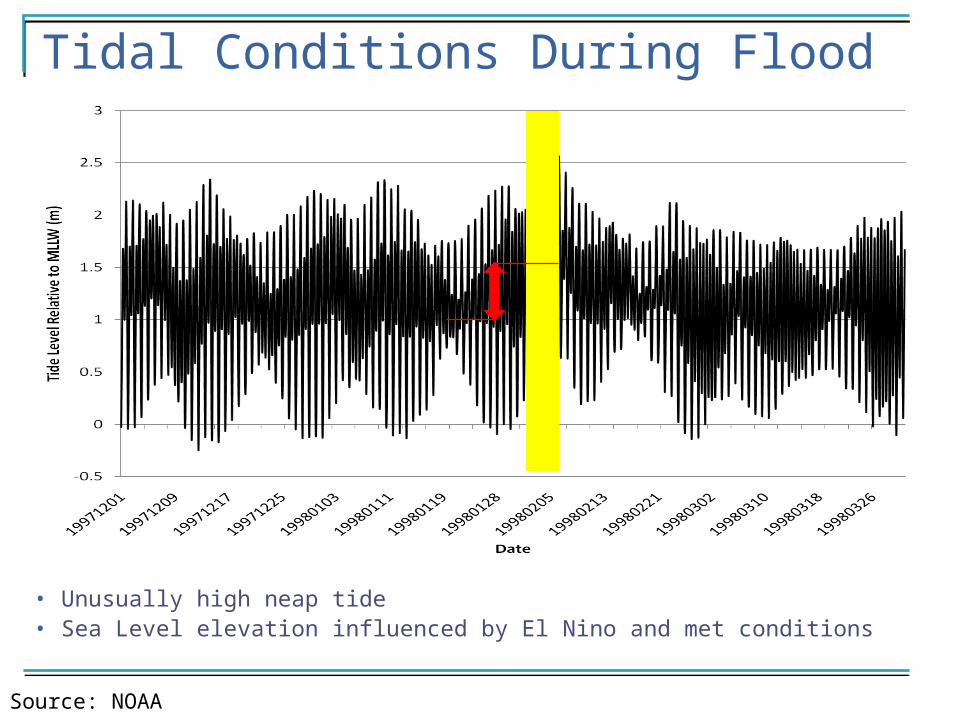
Tidal Conditions During Flood
• Unusually high neap tide• Sea Level elevation influenced by El Nino and met conditions
Source: NOAA
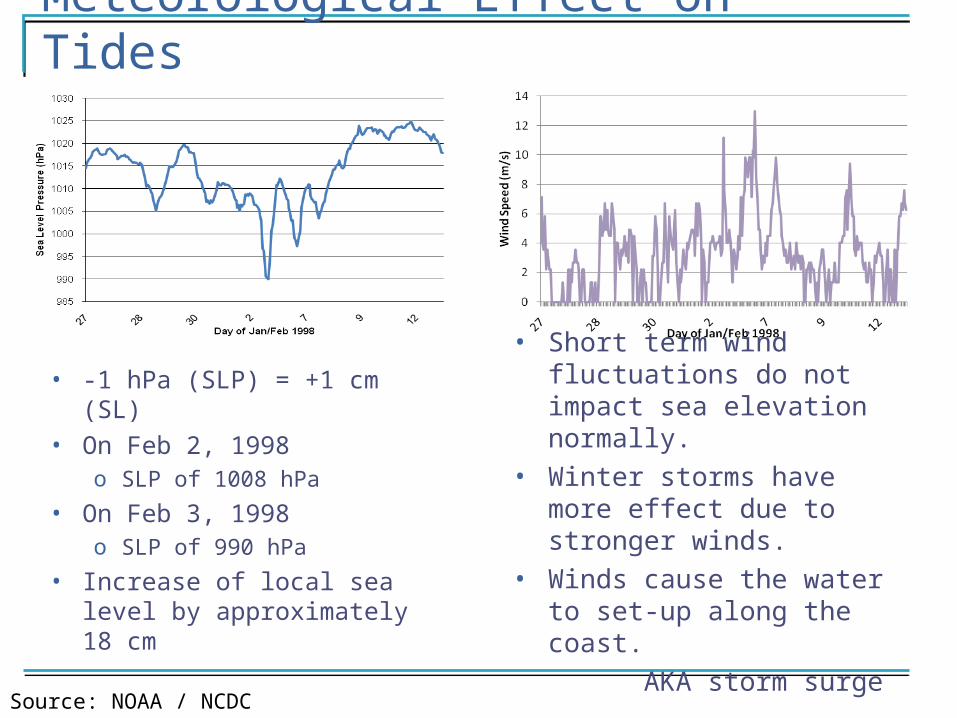
Meteorological Effect on Tides
• -1 hPa (SLP) = +1 cm (SL)• On Feb 2, 1998
o SLP of 1008 hPa
• On Feb 3, 1998o SLP of 990 hPa
• Increase of local sea level by approximately 18 cm
• Short term wind fluctuations do not impact sea elevation normally.
• Winter storms have more effect due to stronger winds.
• Winds cause the water to set-up along the coast.
AKA storm surge
Source: NOAA / NCDC

Precipitation During Flood
7 of 8 previous days had measurable rainfall totals
• Over 88 mm of rainfall on February 3, 1998
• Corresponds with largest spike in 6-hr precipitation rates
6 hr rates spiked on Feb 3rd at nearly 40mm/ 6 hrs
Source: NOAA / NCDC
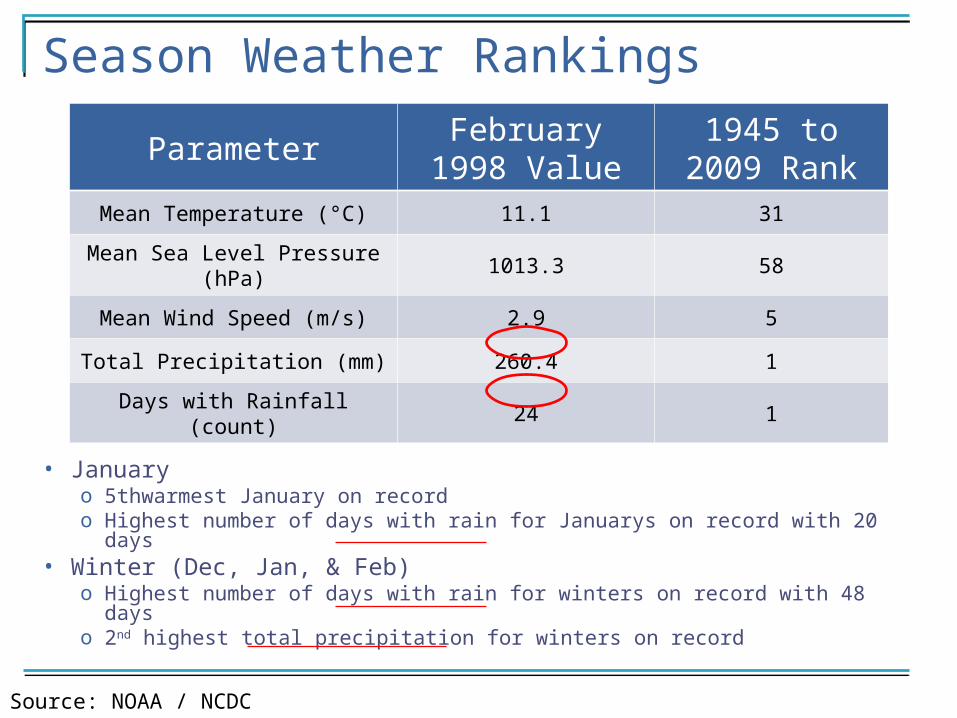
Season Weather Rankings
• January o 5thwarmest January on recordo Highest number of days with rain for Januarys on record with 20 days
• Winter (Dec, Jan, & Feb)o Highest number of days with rain for winters on record with 48 dayso 2nd highest total precipitation for winters on record
ParameterFebruary 1998
Value1945 to 2009
RankMean Temperature (°C) 11.1 31
Mean Sea Level Pressure (hPa) 1013.3 58
Mean Wind Speed (m/s) 2.9 5
Total Precipitation (mm) 260.4 1
Days with Rainfall (count) 24 1
Source: NOAA / NCDC
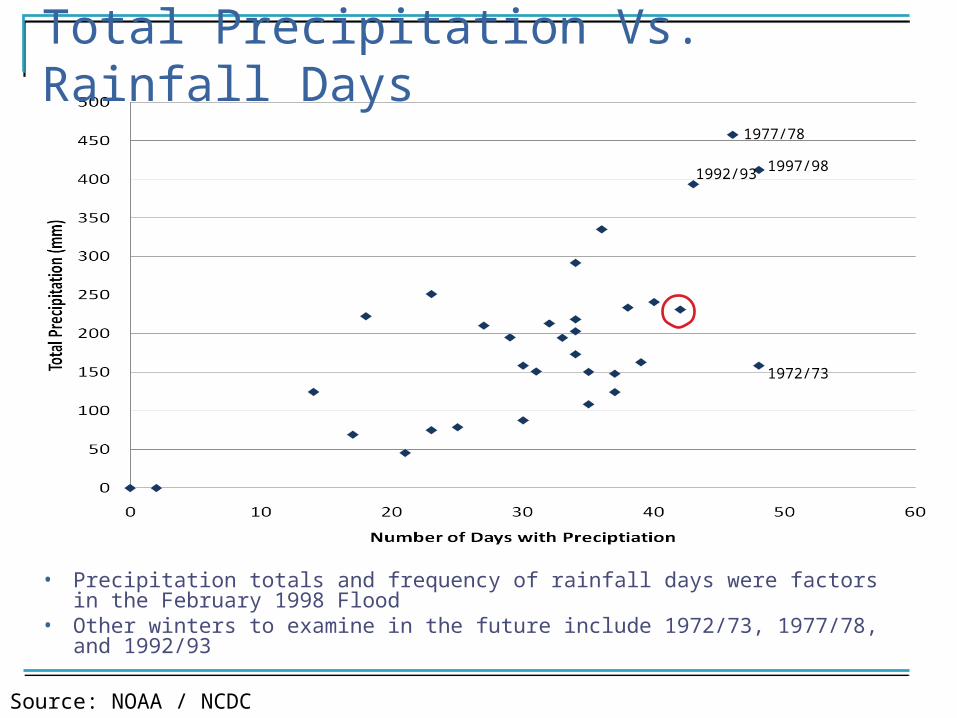
Total Precipitation Vs. Rainfall Days
• Precipitation totals and frequency of rainfall days were factors in the February 1998 Flood
• Other winters to examine in the future include 1972/73, 1977/78, and 1992/93
1972/73
1992/93
1977/78
1997/98
Source: NOAA / NCDC
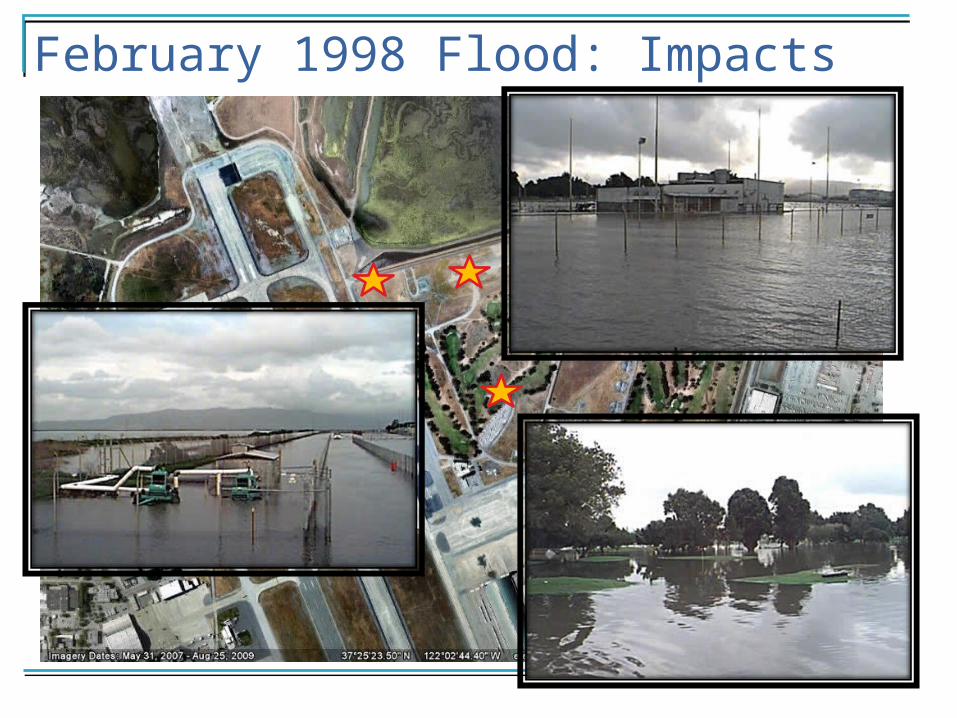
February 1998 Flood: Impacts
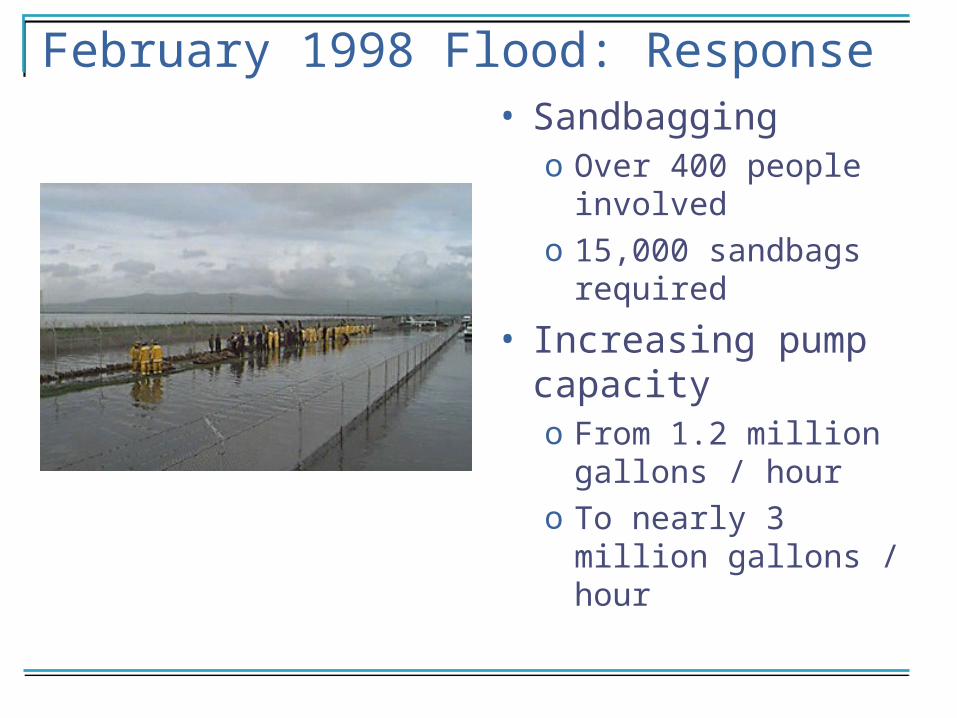
February 1998 Flood: Response• Sandbagging
o Over 400 people involved
o 15,000 sandbags required
• Increasing pump capacityo From 1.2 million
gallons / houro To nearly 3 million
gallons / hour

February 1998 Flood: Improvements• Improved Drainage
o Increased pump capacityo Dredged channels protecting NASA ARCo Storm water retention and evaporation ponds
increased
• Severe Weather Procedure Improvementso Preparing pumps and sandbags prior to stormso Monitoring of water pump rate during storms
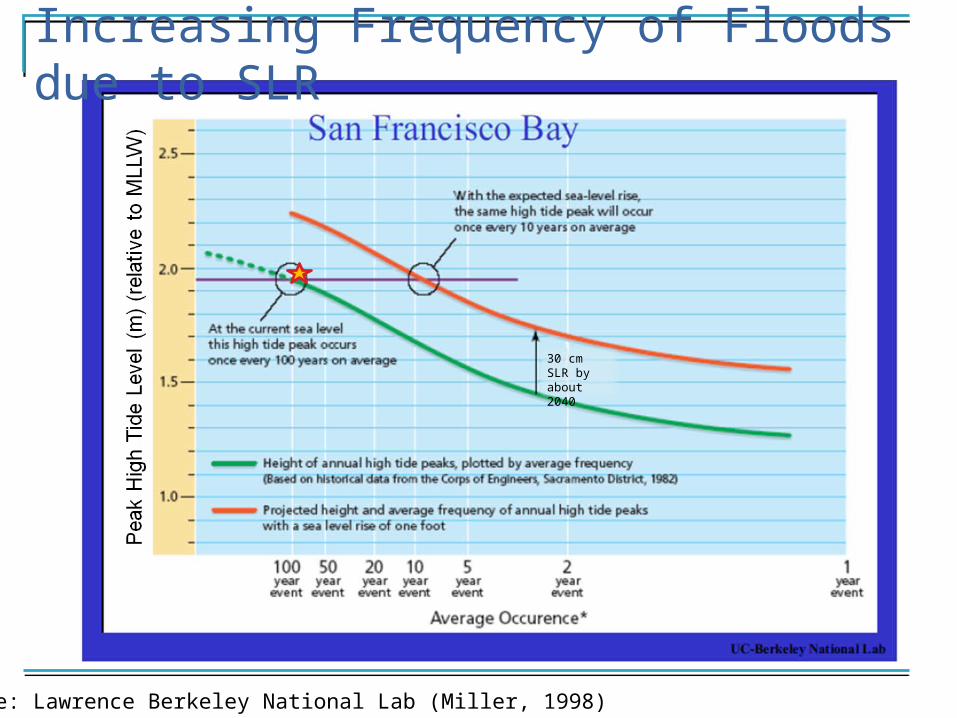
Increasing Frequency of Floods due to SLR
Source: Lawrence Berkeley National Lab (Miller, 1998)
30 cm SLR by about 2040

Anticipated Impacts of Climate Change
Source: BCDC and Army Corps of Engineers
By 2100 SLR will have nearly as much of an impact as a 500-year flood event
40 cm SLR2050
500-year flood-plain
140 cm SLR2100

Anticipated Impacts of Climate Change• Drainage Issues
o Loss of current drainage holding ponds (wetlands and salt marshes)
o Increased difficulty and cost to pump water to the bay due to increased sea level
• Groundwater Flow Changeso Contaminated ground water plumes shift and spreado More water intrusion into basements
• Othero Increased occurrence of droughto Power/ water availability and cost increaseso Loss of wildlife habitat
Suggested Adaptation Strategies• Shoreline protections
• Identification of structures vulnerable to inundation or flooding and those affected by the 1998 flood
• Storm water runoff and drainage studies
• Groundwater flow studies
• Studies into San Francisco Bay hydrodynamics
• Increase flood management
• Reassess the risk posed by SLR at regular intervals
• Collect and archive relevant datao Topographic datao Moffett Field Tide Gauge
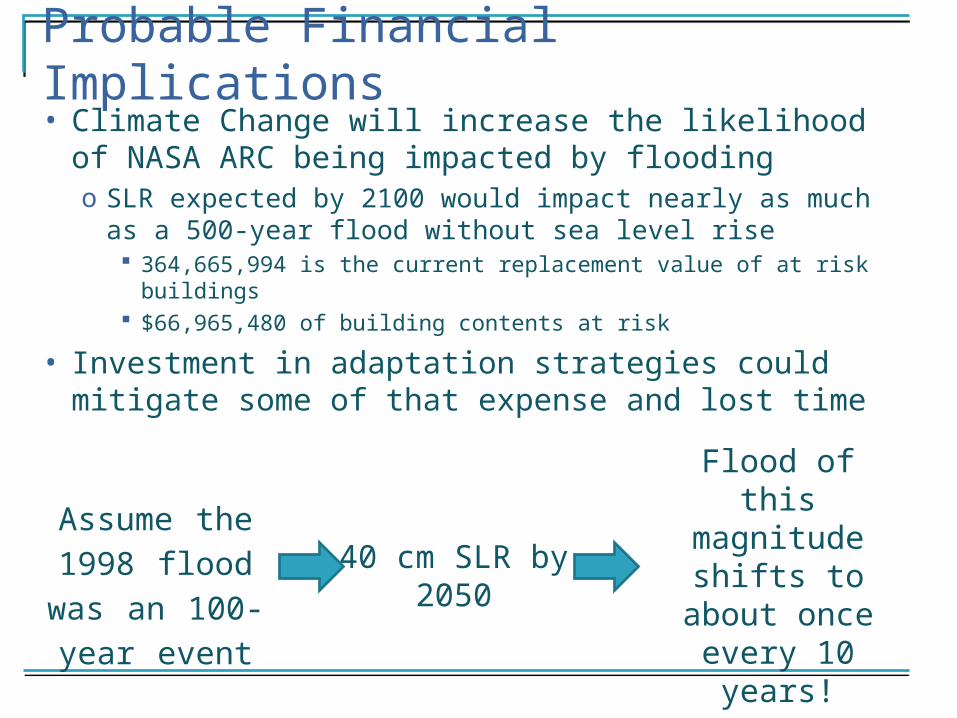
Probable Financial Implications• Climate Change will increase the likelihood of
NASA ARC being impacted by floodingo SLR expected by 2100 would impact nearly as much
as a 500-year flood without sea level rise 364,665,994 is the current replacement value of at risk
buildings $66,965,480 of building contents at risk
• Investment in adaptation strategies could mitigate some of that expense and lost time
Assume the 1998 flood was
an 100-year event
40 cm SLR by 2050
Flood of this magnitude shifts
to about once every 10 years!

Suggested Future Work• Collection and analysis of satellite sea level
measurements of San Francisco Bay
• Increase use of climate model downscaling
• Evaluation of snow water equivalent / snow pack changes to identify power/ water availability changes
• Examine other winter precipitation events such as 1972/1973, 1977/78 and 1992/93
• Continued with other agencies such as the Army Corps of Engineers in adapting to climate change
Acknowledgements• Assistance Throughout Research
o Laura Iracio Emma Yateso Max Loewenstein
• Funding and Supporto NASA’s Undergraduate Student Research Programo Maria Lopez
• Contributorso Ann Clarkeo Don Chucko T. Mark Hightowero Cristina Milesio Phil Snydero John Westo Ken Steinitz


San Francisco Bay Tide Gauge Record
Source: NOAA

El Niño/ Southern Oscillation’s (ENSO) Impact
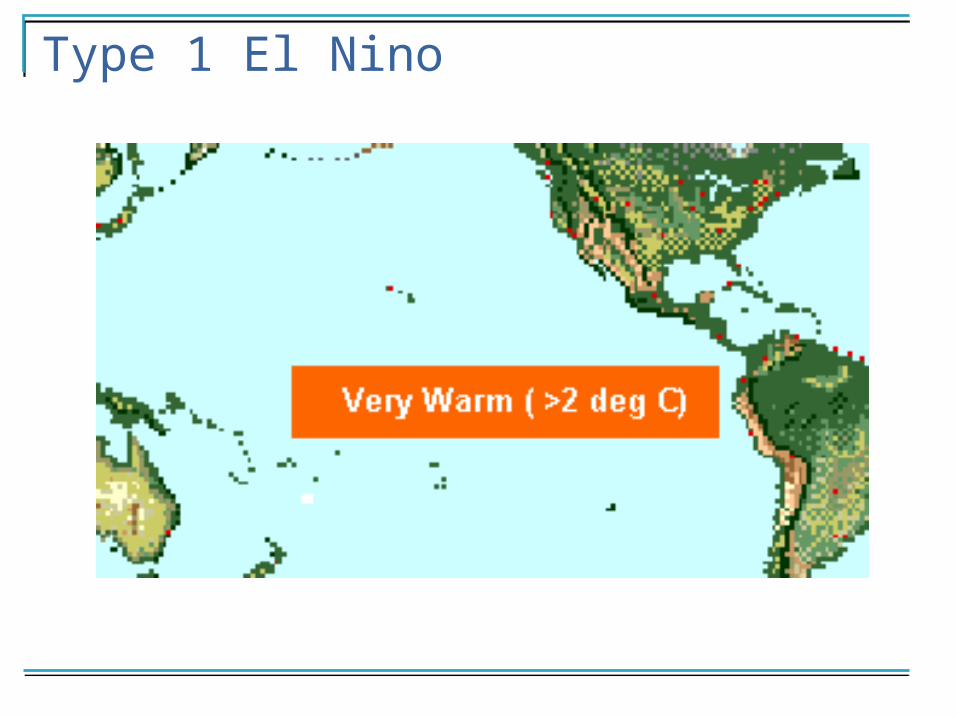
Type 1 El Nino
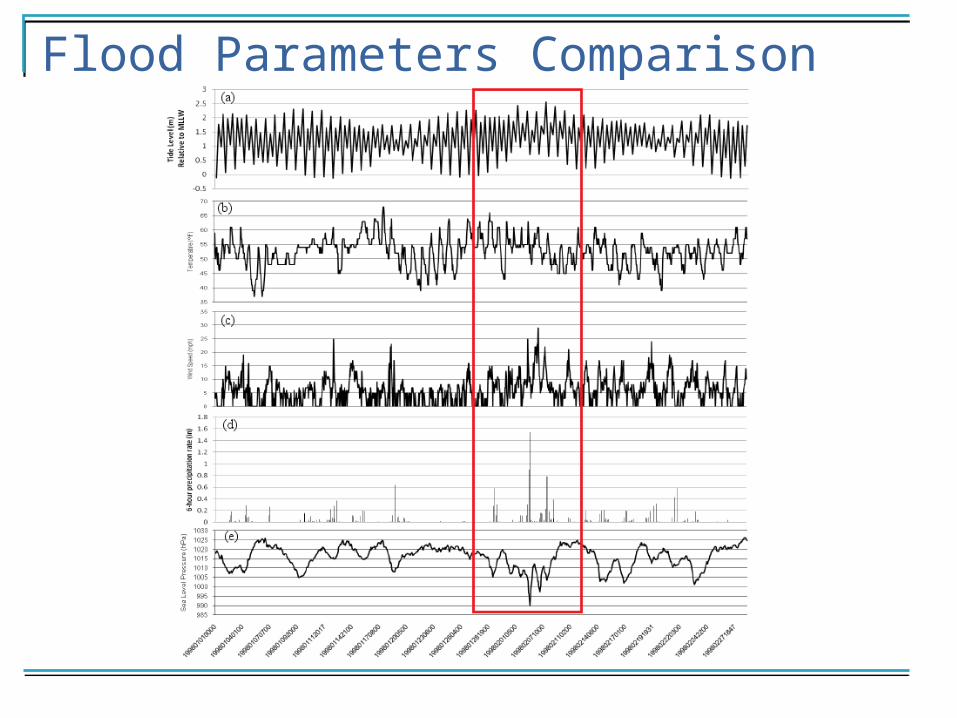
Flood Parameters Comparison
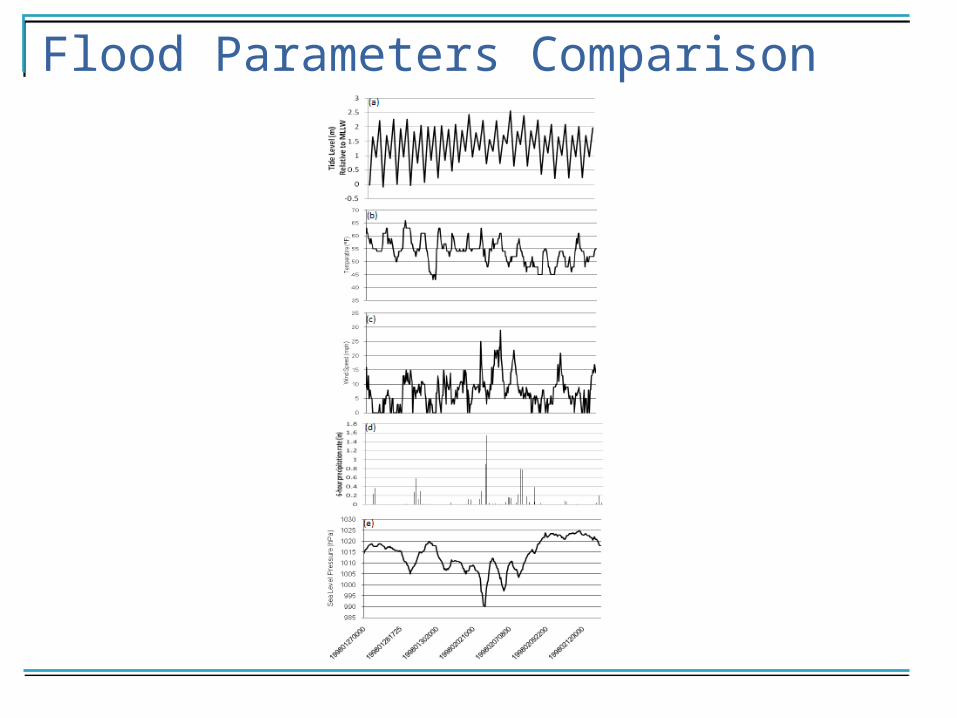
Flood Parameters Comparison
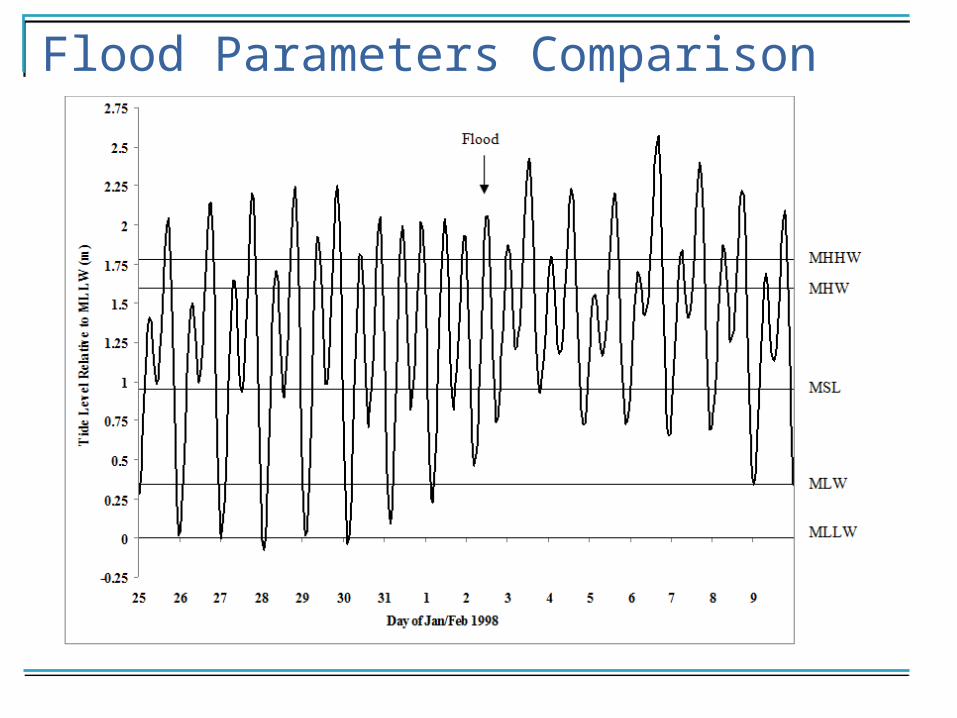
Flood Parameters Comparison
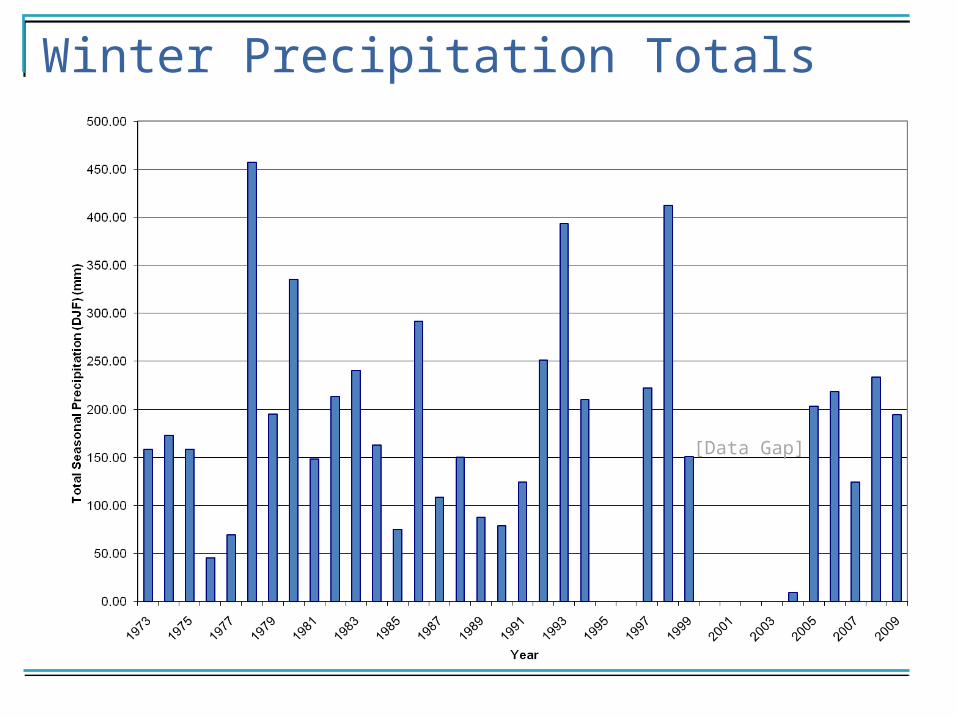
Winter Precipitation Totals
[Data Gap]