implementation of gasb statement no. 68 and 71...
TRANSCRIPT

M A Y 1 8 , 2 0 1 5
A S S O C I A T I O N O F S C H O O L B U S I N E S S O F F I C I A L S M A R Y L A N D * D I S T R I C T O F C O L U M B I A
P R E S E N T E D B Y : G R A Y L I N ( G R A Y ) S M I T H
P A R T N E R , S B & C O M P A N Y , L L C
Implementation of GASB Statement No. 68 and 71
For Maryland Boards of Education
Agenda for Discussion
Why did GASB issue Statement 68?
Background information on 68 and 71
Single Employer Plan Discussion
Multiple Employer Plan Discussion
Special Funding Situations
Future OPEB accounting
2

Why Did GASB Issue Statement No. 68?
Conceptually: – The government is responsible for the net obligation
for pension benefits, and it should be reported as a liability on the government wide FS
– Moved from a funding model to a cost model
3

Funding shortfall versus economic status of plan-
4
Fiscal Years Annual Required Actual Annual Cumulative PercentageEnded June 30, Contributions Contributions Shortfall Shortfall* Contributed
2004 710,632$ 632,462$ 78,170$ 78,170$ 89 %2005 805,564 668,618 136,946 215,116 83 2006 874,079 716,745 157,334 372,450 82 2007 1,025,972 831,037 194,935 567,385 81 2008 1,183,765 1,053,551 130,214 697,599 89 2009 1,313,560 1,109,564 203,996 901,595 84 2010 1,519,980 1,308,920 211,060 1,112,655 86 2011 2,035,401 1,512,473 522,928 1,635,583 74 2012 2,146,624 1,521,761 624,863 2,260,446 77 2013 2,149,985 1,643,101 506,884 2,767,330 76
* Cumulative shortfall beginning fiscal year ended 2004.
Schedule of Contributions from Employers and Other Contributing Entity(Expressed in Thousands)
Why Did GASB Issue Statement No. 68? (cont.)
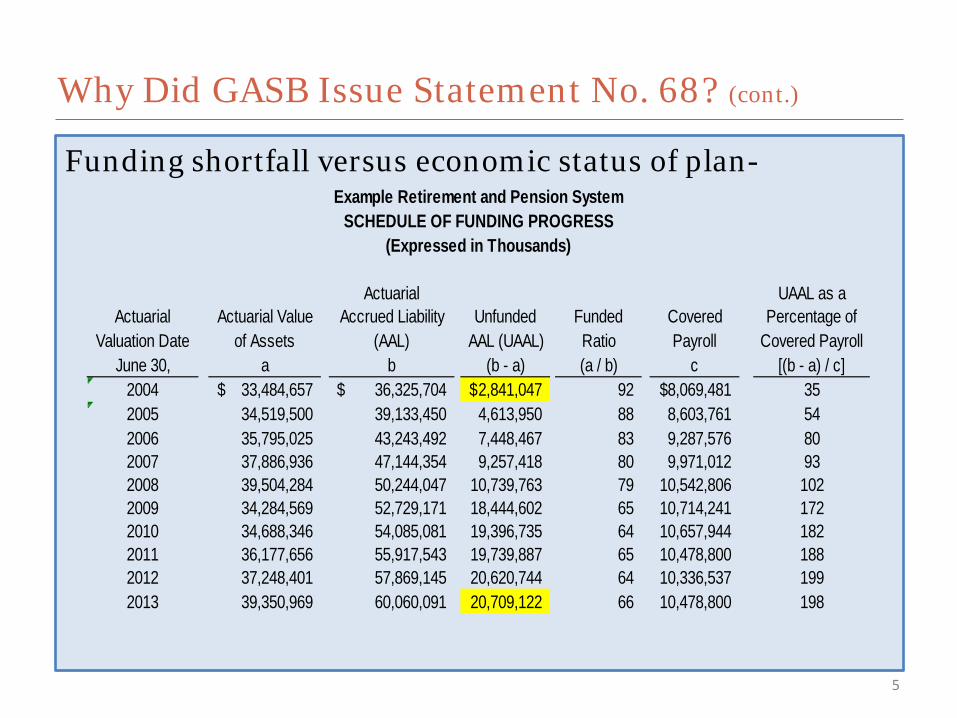
Funding shortfall versus economic status of plan-
5
Why Did GASB Issue Statement No. 68? (cont.)
Actuarial UAAL as aActuarial Actuarial Value Accrued Liability Unfunded Funded Covered Percentage of
Valuation Date of Assets (AAL) AAL (UAAL) Ratio Payroll Covered PayrollJune 30, a b (b - a) (a / b) c [(b - a) / c]
2004 33,484,657$ 36,325,704$ 2,841,047$ 92 8,069,481$ 352005 34,519,500 39,133,450 4,613,950 88 8,603,761 542006 35,795,025 43,243,492 7,448,467 83 9,287,576 802007 37,886,936 47,144,354 9,257,418 80 9,971,012 932008 39,504,284 50,244,047 10,739,763 79 10,542,806 1022009 34,284,569 52,729,171 18,444,602 65 10,714,241 1722010 34,688,346 54,085,081 19,396,735 64 10,657,944 1822011 36,177,656 55,917,543 19,739,887 65 10,478,800 1882012 37,248,401 57,869,145 20,620,744 64 10,336,537 1992013 39,350,969 60,060,091 20,709,122 66 10,478,800 198
Example Retirement and Pension SystemSCHEDULE OF FUNDING PROGRESS
(Expressed in Thousands)

Major Changes & Highlights
Conceptual shift from a “funding” approach to an “earnings” approach:
– Old way – expense your pension when you make the required payment
– New way – fund your pension as the employees “earn” their pension
– Pension expense no longer will equal pension contribution
6
Requires consistent assumptions within actuarial valuations
Immediate recognition of most expenses related to changes, as compared to amortization
No phase in – restate beginning balances
7
Major Changes & Highlights (cont.)

Governments participating in a cost sharing plan report a proportionate share of NPL on their FS.
Expanded footnote and RSI disclosure to 10 years (!)
Incorporate other financial reporting concepts brought about by other standards – deferred inflows and outflows (!!)
Changes relate to accounting and financial reporting – NOT FUNDING
8
Major Changes & Highlights (cont.)

Why are there two statements, GASB 67 and 68? Aren’t we talking about one thing – pensions???
• 67 – reporting for pension plans
o Examples: the State Retirement System, or if a government issues a stand alone report for its pension plan
• 68 – accounting and reporting for pensions
o Examples: Cities, Towns, Counties, Boards of Education, etc. that administer plans, and include as part of their financial statements
9
The Big Question….

2014 will be GASB 67 • Pension Plans
2015 will be GASB 68 • Governments
10
Timing for Implementation

For the calculation of the total pension liability, an actuarial valuation should be performed at least biennially
Must be measured as of the employer’s year-end
11
Timing and Frequency

Measurement of total pension liability can be from:
• An actuarial valuation as of employer’s year-end (unlikely)
• Update procedures rolling-forward amounts from an actuarial valuation as of a date no more than 30 months and one day earlier (extremely likely)
12
Timing/Measurement

Current standards
• Pension assets reported at FMV in fiduciary fund
• Actuarially accrued liability for pension disclosed in the footnotes
New Standards
• Actuarially accrued liability exceeds fair value of assets = net pension liability reported on Statement of Net Position
13
Recognition of a Net Pension Liability

The “Old Way”
14
July 1, 2011 Valuation Annual required contribution 2,000,000$ Interest on NPO (14,000) Adjustment to ARC 21,000 Annual Pension Cost 2,007,000 Contribution made 2,050,000 Change in NPO (43,000) Beginning of the year NPO (453,000) End of the year NPO (496,000)$

GASB 68
15
July 1, 2014 Valuation (GASB based)
Fair Value of Assets 30,500,000$
Actuarial Accrued Liability 39,000,000
Net Pension Liability (8,500,000)
Funded Ratio 78.2%

Current Statement of Net Position (old way)
16
AssetsCash 12,000,000$ Accounts Receivable 6,100,000 Net Pension Asset 500,000 Total assets 18,600,000
LiabilitiesA/P 3,000,000 Accrued Payroll 1,000,000 Bonds Payable 4,000,000 Total liabilities 8,000,000
Total net position 10,600,000$

New Statement of Net Position
17
AssetsCash 12,000,000$ Accounts Receivable 6,100,000 Total assets 18,100,000
Deferred Outflows xxx,xxx
LiabilitiesA/P 3,000,000 Accrued Payroll 1,000,000 Bonds Payable 4,000,000 Net Pension liability 8,500,000 Total liabilities 16,500,000
Total net position 1,600,000$

Current standard – pension cost expensed when paid (fund level) or when set by actuary (entity-wide)
New standard – pension cost expensed as service provided by employee
Difference between actual contribution and cost = part of change in Net Pension Liability
18
Pension Expense

Effect of changes in assumption and the difference between assumptions and actual experience must be recognized initially as deferred inflows or outflows and amortized into the expense.
19
Measuring Annual Pension Cost

Actual vs. expected return on investments
• The difference recognized as a deferred inflow/outflow, spread over the next 5 years.
Example
• Projected investment income: $400,000/year
• Actual investment income: between $900k & ($200k)
• Gains and losses above/below projected income are amortized over the next five years
20
Measuring Annual Pension Cost (cont.)

Early Investment Smoothing
21
Actual return
2018 400,000 600,000 200,000 2019 400,000 200,000 (200,000) 2020 400,000 (200,000) (600,000) 2021 400,000 100,000 (300,000) 2022 400,000 900,000 500,000
Excess/deficinvestment
earnings 2018 2019 2020 2021 20222018 200,000 40,000 40,000 40,000 40,000 40,000 2019 (200,000) xx,xxx (40,000) (40,000) (40,000) (40,000) 2020 (600,000) xx,xxx xx,xxx (120,000) (120,000) (120,000) 2021 (300,000) xx,xxx xx,xxx xx,xxx (60,000) (60,000) 2022 500,000 xx,xxx xx,xxx xx,xxx xx,xxx 100,000
(80,000)
DifferenceProjected
return
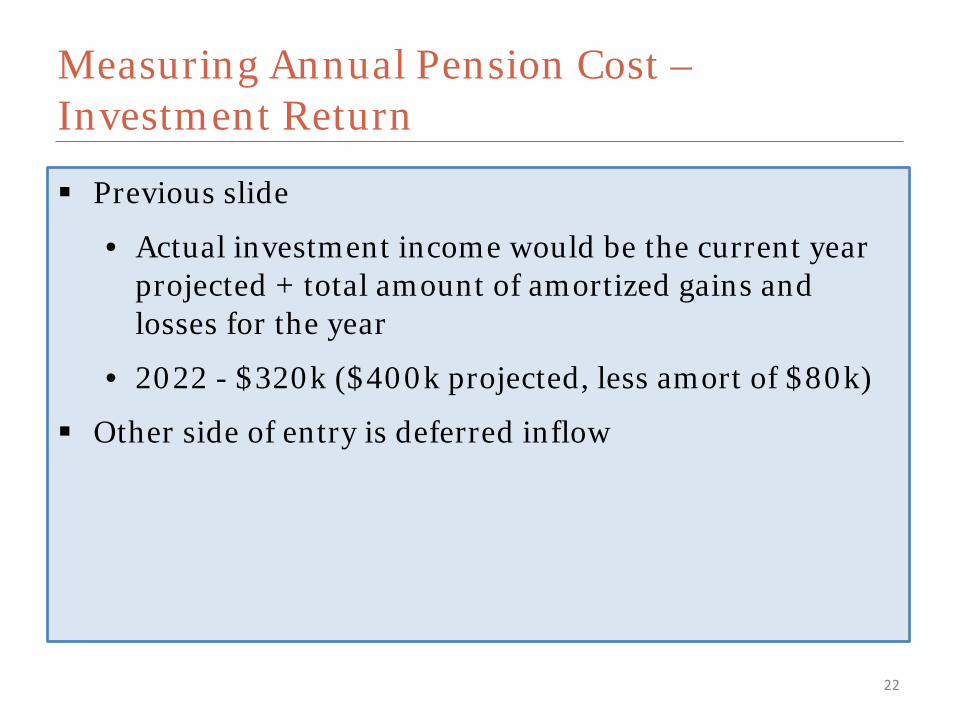
Previous slide
• Actual investment income would be the current year projected + total amount of amortized gains and losses for the year
• 2022 - $320k ($400k projected, less amort of $80k)
Other side of entry is deferred inflow
22
Measuring Annual Pension Cost – Investment Return

Total Pension liability is:
• The present value of projected benefit payments for current and former employees, based on members past service, allocated to past and future years
23
Total Pension Liability

24
25 40 62 80
1) Project Benefit Payments
2) Discount Future Payments
Present Value of Payments
13 3) Attribute to Service Periods
Measurement Approach

Based on then-existing benefit terms and legal agreements
Includes projected salary increases, service credits, and COLAs
No significant change from prior practice
25
Projection of Benefit Payments

Future benefit payments discounted to their PV
Use a single rate that reflects a combination of
• A long-term expected rate of return on plan investment, if the plan there is a projected “surplus”, or
• An index rate for 20 year municipal binds
oWill result in an increased liability
26
Discount Rate

Single rate based on whether the plan will exhaust assets and thus funding would come directly from the sponsoring government
Determine if plan will exhaust assets based on:
• Current funding of the plan
• History of payment to project to expected future payments
27
Discount Rate (cont.)
Previously all actuarial information was included in the plan’s financial statements
Individual governments were only required to disclose basic footnote information
New standards
• A proportionate liability and expense is recorded by the government
• Full footnote disclosure, consistent with single and multi-employer plans
28
Cost Sharing Plans

Non-Employer is legally responsible for making contributions directly to a pension plan
Cannot be dependent upon one or more events or circumstances unrelated to the pensions
The non-employer entity is the only entity with a legal obligation to make contributions directly to a pension plan
Special funding situations do not include circumstances in which resources are provided to the employer, regardless of the purpose for which those resources are provided
29
Special Funding Situations

Allows to allocate a portion of net pension liability to a non-employer
Amount can range from a little to 100% of the liability
Allows for a wide divergence of accounting in cost sharing plans-
Dependent on the legislation that is passed and the underlying intent of the legislation
Factors to consider:
• Who is ultimately responsible for payment of the net pension liability?
• On-behalf payments versus contributions
• Guarantees versus obligation to fund
• Setting of actuarial assumptions and setting of funding amounts
30
Special Funding Situations

31
Special Maryland BOE Situation
• For certain positions the State is required to pay the prior service cost and any actuarial changes to the plan
• For those employees the State will record the related liability
• Many BOE’s do have employees in the Plan that they must pay the contribution
• Cost Sharing Provisions of GASB 68 applies for those employees

32
Allocation Example
2015 Actual Employer Employer Allocation
Employer Contributions Percentage
State $ 54,000,000 3.86%Muncipality 1 - example 1 2,700,000 0.19%Municipality 2 827,430 0.06%Municipality 3 293,058 0.02%Municipality 4 620,563 0.04%Municipality 5 882,001 0.06%Municipality 6 2,084,937 0.15%Municipality 7 104,883 0.01%Municipality 8 183,910 0.01%Municipality 9- example 2 733,092 0.05%all other 1,337,570,126 95.54% Total 1,400,000,000$ 100.00%
December 31, 2015Projected net pension liability 8,000,000,000 Pro rata portion of total liability 0.19%Estimated NPL 15,428,571
Projected net pension liability 8,000,000,000 Pro rata portion of total liability 0.05%Estimated NPL 4,189,097
Example Cost Sharing Plan

33
OLD NEWGovernmental Governmental
Assets Activities Activities
Current assets $ 42,805,138 $ 42,805,138 Non current assets 135,314,185 135,314,185 Total Assets 178,119,323 178,119,323
LiabilitiesCurrent liabilities 13,658,635 13,658,635 Non current liabilities: Net pension liability - 15,428,571 Due within one year 9,979,535 9,979,535 Due in more than one year 141,691,073 141,691,073 Total Liabilities 165,329,243 180,757,814
Net PositionNet investment in capital assets 11,532,488 11,532,488 Unrestricted 1,257,592 (14,170,979)
Total Net Position $ 12,790,080 $ (2,638,491)
STATEMENT OF NET POSITION30-Jun-15
Local Gov
Example – Local Govt. F/S

• Include type of benefits and who is covered
• Investment policies, concentration over 5%, and rate of return on plan investments
34
Notes to the Financial Statements

Single and Cost Sharing employers also disclose:
• Total and net pension liability
• Amount of plan net position
35
Notes to the Financial Statements (cont.)

Single and Cost Sharing employers also disclose:
• Significant assumptions/projections
o Salary increases
o Inflation
o Mortality
o COLAs
o Discount rate
36
Notes to the Financial Statements (cont.)

Discount Rate assumption disclosures
• Contributions and other projected cash flows
• Projection period the rate was applied to
• Sensitivity of the net pension liability to the discount rate assumption
37
Notes to the Financial Statements (cont.)

10 year history
Changes in net pension liability, including components of the NPL and related ratios
Actuarially calculated items
Rate of return, net of investment expenses
Any changes in benefit provisions, or the size or composition of the population, or assumptions
38
Required Supplementary Information

Then record current year expense:
• Amortization deferred inflows
• Amortization deferred outflows
• Change in NPL, net of cy deferrals
• Contributions already recorded
• Consideration of GASB 71- deferred outflows for contributions made after the measurement date but before the reporting date
39
Statement of Activities

Rollforward form the beginning of the period to the end for total and net pension liability, and the plan’s fiduciary net position
Include the effects, if any of the following:
• Service cost, interest on pension liability, changes in benefit terms, difference between expected and actual experience in measurement of the TPL, changes in assumptions or other inputs, contributions of employer, contributions form non-employer entities, contribution from employees, plan admin expense, and other changes.
40
Notes: Rollforward of TPL

41
TPLPlan Fid Net
Position NPLBeginning Balance 18,800,000$ 10,000,000$ 8,800,000$
Changes for the year: Service Cost 500,000 - 500,000 Interest 900,000 - 900,000 Difference between expected and actual experience 100,000 (100,000) Contributions- employer 650,000 (650,000) Contributions- employee 50,000 (50,000) Net investment income 410,000 (410,000) Benefit payments (1,200,000) (1,200,000) - Admin expense and other 10,000 (10,000)
19,000,000$ 10,020,000$ 8,980,000$
Sample Footnote: Rollforward of TPL, Fiduciary Net Position and NPL

Deferred Outflows/Inflows schedule:
• Net amount of the employer’s balances that will be recognized in pension expense for each of the next 5 years and thereafter
• If the employer does not have a special funding situation, the amount that will reduce NPL
• In a special funding situation, amount of deferred that will reduce the collective net pension liability
42
Notes: DI and DO Schedule

Liability is required if contributions include amortization of unfunded liability
Liability is not required if contributions do not include amortization of unfunded liability
43
Special Funding Situations

Effectively the same as pension accounting
Issue- many OPEB plans do not have funding history and may have a discount rate issue
44
Future OPEB Accounting

Graylin (Gray) Smith Managing Partner
SB & Company, LLC
410-584-1401
SB & Company, LLC
200 International Circle
Suite 5500
Hunt Valley, MD 21030
45