gasb 68 employer examples and explanations -...
TRANSCRIPT


GASB 68 Employer Examples and Explanations XYZ City Statement of Net Position June, 30 Prior Year (Last Year) Before . ASSETS Cash 87,000 Investments 5,550,000 Capital assets 1,000,000 Net pension asset . Total Assets 6,637,000 . Differed outflows of recourses Difference between actual and expected liability experience NA City's contributions subsequent to the measurement NA . Total deferred outflows of resources 0 . LIABILITIES Accounts payable 20,000 Other liabilities 5,000 Net pension liability . Total Liabilities 25,000 . Differed inflows of recourses Difference between actual and expected liability experience NA Difference between actual and expected investments NA . Total deferred inflows of resources 0 . NET POSITION Net investment in capital assets 1,000,000 Unrestricted 5,612,000 . Total net position 6,612,000 .

GASB 68 Employer Examples and Explanations XYZ City Statement of Net Position June, 30 Prior Year (Last Year) Pension Before Entry . ASSETS Cash 87,000 Investments 5,550,000 Capital assets 1,000,000 Net pension asset 41,714 . Total Assets 6,637,000 41,714 . Differed outflows of recourses Difference between actual and expected liability experience NA City's contributions subsequent to the measurement NA . Total deferred outflows of resources 0 . LIABILITIES Accounts payable 20,000 Other liabilities 5,000 Net pension liability 5,864,622. Total Liabilities 25,000 5,864,622. Differed inflows of recourses Difference between actual and expected liability experience NA Difference between actual and expected investments NA . Total deferred inflows of resources 0 . NET POSITION Net investment in capital assets 1,000,000 Unrestricted 5,612,000 (5,822,908) . Total net position 6,612,000 (5,822,908) .

GASB 68 Examples and Explanations
Journal Entries DR CR Fund Balance / Net Position 5,864,622 Net Pension Liability 5,864,622 DR CR Net Pension Asset 41,714 Fund Balance / Net Position 41,714

GASB 68 Employer Examples and Explanations XYZ City Statement of Net Position Restated June, 30 Prior Year Prior Year (Last Year) Pension (Last Year) Before Entry Entry After . ASSETS Cash 87,000 87,000 Investments 5,550,000 5,550,000 Capital assets 1,000,000 1,000,000 Net pension asset 41,714 41,714 . Total Assets 6,637,000 41,714 6,678,714 . Differed outflows of recourses Difference between actual and expected liability experience NA 0 City's contributions subsequent to the measurement NA 0 . Total deferred outflows of resource s 0 0 . LIABILITIES Accounts payable 20,000 20,000 Other liabilities 5,000 5,000 Net pension liability 5,864,622 5,864,622 . Total Liabilities 25,000 5,864,622 5,889,622 . Differed inflows of recourses Difference between actual and expected liability experience NA 0 0 Difference between actual and expected investments NA 0 0 . Total deferred inflows of resources 0 0 0 . NET POSITION Net investment in capital assets 1,000,000 0 1,000,000 Unrestricted 5,612,000 (5,822,908) (252,622) . Total net position 6,612,000 (5,822,908) 747,378 .

GASB 68 Employer Examples and Explanations XYZ City Statement of Net Position Restated June, 30 Prior Year Prior Year First Year (Last Year) Pension (Last Year) (Current Year) Pension Before Entry Entry After Before Entry Entry . ASSETS Cash 87,000 87,000 87,000 Investments 5,550,000 5,550,000 5,550,000 Capital assets 1,000,000 1,000,000 1,000,000 Net pension asset 41,714 41,714 41,714 . Total Assets 6,637,000 41,714 6,678,714 6,678,714 . Differed outflows of recourses Difference between actual and expected (1) liability experience NA 0 NA 3,248 City's contributions subsequent to the measurement NA 0 NA . Total deferred outflows of resources 0 0 0 . LIABILITIES Accounts payable 20,000 20,000 20,000 Other liabilities 5,000 5,000 5,000 (1) Net pension liability 5,864,622 5,864,622 5 ,864,622 3,248 . Total Liabilities 25,000 5,864,622 5,889,622 5,889,622 . Differed inflows of recourses Difference between actual and expected liability experience NA 0 0 Difference between actual and expected investments NA 0 0 . Total deferred inflows of resources 0 0 0 . NET POSITION Net investment in capital assets 1,000,000 0 1,000,000 1,000,000 Unrestricted 5,612,000 (5,822,908) (252,622) (252,622) . Total net position 6,612,000 (5,822,908) 747,378 747,378 .

GASB 68 Examples and Explanations
Journal Entries Def outflows liab experience DR CR (1) Def outflows liab. experience 3,248 Net Pension Liab. (1) Def outflows liab. experience 3,248

GASB 68 Employer Examples and Explanations XYZ City Statement of Net Position Restated June, 30 Prior Year Prior Year First Year (Last Year) Pension (Last Year) (Current Year) Pension Before Entry Entry After Before Entry Entry . ASSETS Cash 87,000 87,000 87,000 Investments 5,550,000 5,550,000 5,550,000 Capital assets 1,000,000 1,000,000 1,000,000 Net pension asset 41,714 41,714 41,714 . Total Assets 6,637,000 41,714 6,678,714 6,678,714 . Differed outflows of recourses Difference between actual and expected liability experience NA 0 NA City's contributions subsequent to the measurement NA 0 NA . Total deferred outflows of resources 0 0 0 . LIABILITIES Accounts payable 20,000 20,000 20,000 Other liabilities 5,000 5,000 5,000 (2) Net pension liability 5,864,622 5,864,622 5 ,864,622 (212,567) . Total Liabilities 25,000 5,864,622 5,889,622 5,889,622 . Differed inflows of recourses Difference between actual and expected (2) liability experience NA 0 0 NA 212,567 Difference between actual and expected investments NA 0 0 NA . Total deferred inflows of resources 0 0 0 0 . NET POSITION Net investment in capital assets 1,000,000 0 1,000,000 1,000,000 Unrestricted 5,612,000 (5,822,908) (252,622) (252,622) . Total net position 6,612,000 (5,822,908) 747,378 747,378 .

GASB 68 Examples and Explanations
Journal Entries Net Pension Liab. DR CR (2) Def inflows liab. experience 212,567 Def inflows liab. experience DR CR (2) Def inflows liab. Experience 212,567

GASB 68 Employer Examples and Explanations XYZ City Statement of Net Position Restated June, 30 Prior Year Prior Year First Year (Last Year) Pension (Last Year) (Current Year) Pension Before Entry Entry After Before Entry Entry . ASSETS Cash 87,000 87,000 87,000 Investments 5,550,000 5,550,000 5,550,000 Capital assets 1,000,000 1,000,000 1,000,000 Net pension asset 41,714 41,714 41,714 . Total Assets 6,637,000 41,714 6,678,714 6,678,714 . Differed outflows of recourses Difference between actual and expected liability experience NA 0 NA City's contributions subsequent to the measurement NA 0 NA . Total deferred outflows of resources 0 0 0 . LIABILITIES Accounts payable 20,000 20,000 20,000 Other liabilities 5,000 5,000 5,000 (3) Net pension liability 5,864,622 5,864,622 5 ,864,622 (1,288,542) . Total Liabilities 25,000 5,864,622 5,889,622 5,889,622 . Differed inflows of recourses Difference between actual and expected liability experience NA 0 0 NA Difference between actual and expected (3) investments NA 0 0 NA 1,288,542 . Total deferred inflows of resources 0 0 0 0 . NET POSITION Net investment in capital assets 1,000,000 0 1,000,000 1,000,000 Unrestricted 5,612,000 (5,822,908) (252,622) (252,622) . Total net position 6,612,000 (5,822,908) 747,378 747,378 .

GASB 68 Examples and Explanations
Journal Entries Net Pension Liab. DR CR (3) Def inflows invest experience 1,288,542 Def inflows invest experience DR CR (3) Def inflows invest experience 1,288,542

GASB 68 Examples and Explanations
XYZ City Statement of Changes in Net Position June, 30 Prior Year Prior Year Firs Year Firs Year (Last Year) Pension (Last Year) (Current Year) Pension (Current Year) Before Entry Entry After Before Entry Entry After Entry . Expense: (4) Pension Expense NA NA NA 902,264 (291,273) 610,991
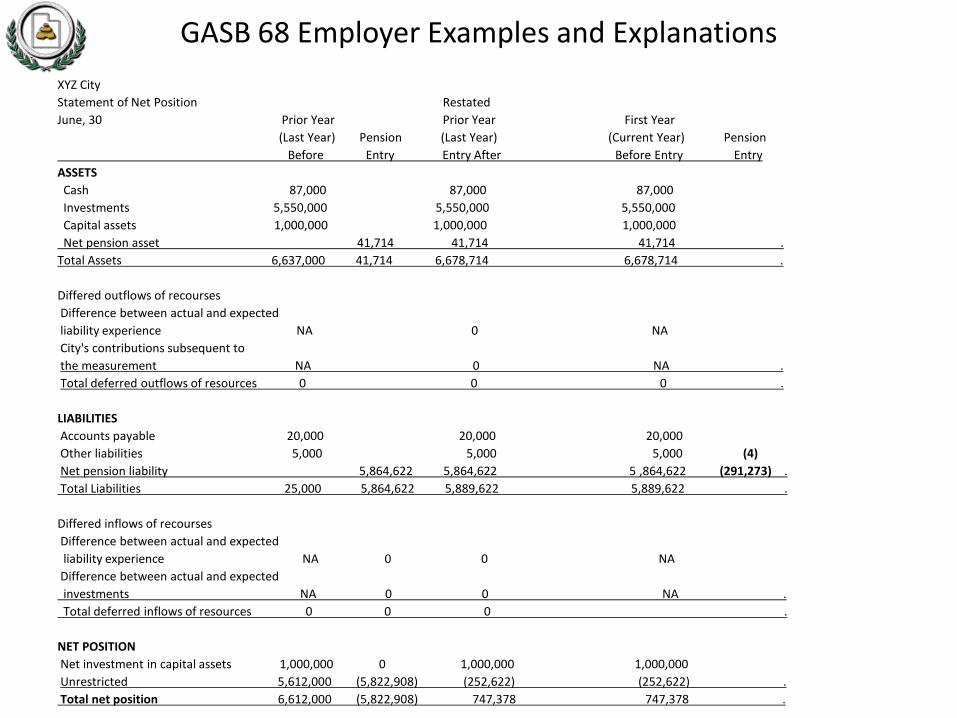
GASB 68 Employer Examples and Explanations XYZ City Statement of Net Position Restated June, 30 Prior Year Prior Year First Year (Last Year) Pension (Last Year) (Current Year) Pension Before Entry Entry After Before Entry Entry ASSETS Cash 87,000 87,000 87,000 Investments 5,550,000 5,550,000 5,550,000 Capital assets 1,000,000 1,000,000 1,000,000 Net pension asset 41,714 41,714 41,714 . Total Assets 6,637,000 41,714 6,678,714 6,678,714 . Differed outflows of recourses Difference between actual and expected liability experience NA 0 NA City's contributions subsequent to the measurement NA 0 NA . Total deferred outflows of resources 0 0 0 . LIABILITIES Accounts payable 20,000 20,000 20,000 Other liabilities 5,000 5,000 5,000 (4) Net pension liability 5,864,622 5,864,622 5 ,864,622 (291,273) . Total Liabilities 25,000 5,864,622 5,889,622 5,889,622 . Differed inflows of recourses Difference between actual and expected liability experience NA 0 0 NA Difference between actual and expected investments NA 0 0 NA . Total deferred inflows of resources 0 0 0 . NET POSITION Net investment in capital assets 1,000,000 0 1,000,000 1,000,000 Unrestricted 5,612,000 (5,822,908) (252,622) (252,622) . Total net position 6,612,000 (5,822,908) 747,378 747,378 .

GASB 68 Examples and Explanations
Journal Entries STATEMENT OF NET POSITION Net Pension Liab. DR CR (4) Pension exp 291,273 . INCOME STATEMENT ENTRY Pension exp / Retirement contributions DR CR Cont sent to retirement office (the amount budgeted) 902,264 Adj. entry 291,273 Total Pension Exp for Financial statements 610,991

GASB 68 Employer Examples and Explanations XYZ City Statement of Net Position June, 30 Prior Year Prior Year Firs Year Firs Year (Last Year) Pension (Last Year) (Current Year) Pension (Current Year) Before Entry Entry After Before Entry Entry After Entries . ASSETS Cash 87,000 87,000 87,000 87,000 Investments 5,550,000 5,550,000 5,550,000 5,550,000 Capital assets 1,000,000 1,000,000 1,000,000 1,000,000 Net pension asset 41,714 41,714 41,714 41,714 . Total Assets 6,637,000 41,714 6,678,714 6,678,714 6,678,714 . Differed outflows of recourses Difference between actual and expected (1) liability experience NA 0 NA 3,248 3,248 City's contributions subsequent to the measurement NA 0 NA 0 . Total deferred outflows of resources 0 0 0 3,248 . LIABILITIES Accounts payable 20,000 20,000 20,000 20,000 Other liabilities 5,000 5,000 5,000 (1,2,3,&4) 5,000 Net pension liability 5,864,622 5,864,622 5 ,864,622 (1,789,133) 4,075,489 . Total Liabilities 25,000 5,864,622 5,889,622 5,889,622 (1,789,133) 4,100,489 . Differed inflows of recourses Difference between actual and expected (2) liability experience NA 0 NA 212,567 212,567 Difference between actual and expected (3) investments NA 0 NA 1,288,542 1,288,542 . Total deferred inflows of resources 0 0 0 1,501,109 1,501,109 . NET POSITION Net investment in capital assets 1,000,000 1,000,000 1,000,000 1,000,000 Unrestricted 5,612,000 (5,822,908) (252,622) (252,622) 291,273 38,651 . Total net position 6,612,000 (5,822,908) 747,378 747,378 291,273 1,038,651 .

GASB 68 Examples and Explanations . XYZ City STATEMENT OF CHANGES IN NET POSITION (INCOME STATEMENT) Year ended June 30, Firs Year First Year (Current Year) (Current Year) Before Pension After Entry Entry Entry . Pension exp / Retirement contributions Cont sent to retirement office (4) (amount budgeted) 902,264 (291,273) 610,991 `

GASB 68 Examples and Explanations
Journal Entries STATEMENT OF NET POSITION Beginning Balance DR CR Ending Balance Net Pension Liability (5,864,622) (1) Def outflows liability experience 3,248 (2) Def inflows liability experience 212,567 (3) Def inflows investment experience 1,288,542 (4) Pension exp expense 291,273 . NPL ending balance (4,075,489) Deferred outflows liability experience 0 (1) Deferred outflows liability experience 3,248 . Deferred outflows liability experience ending balance 3,248 Deferred inflows liability experience 0 (2) Deferred inflows liability experience 212,567 . Deferred inflows liability experience ending balance (212,567) Deferred inflows investment experience 0 (3) Def inflows investment experience 1,288,542 . Def inflows investment experience ending balance (1,288,542). INCOME STATEMENT ENTRY Balance DR CR Ending Balance Pension exp / Retirement contributions Contributions sent to retirement office (amount budgeted) 902,264 (4) Actuarial calculated pension adjusting entry 291,273 . Total Pension Expense 610,991

GASB 68 Examples and Explanations
Utah Retirement System Schedule of Changes In the Employers' Net Pension Liability Total Plan Net Pension Fiduciary Pension Change in the Net Pension Liability Liability Net Position Liability - Beginning 28,015,221 22,150,599 5,864,622 Changes for year: Service Cost 599,735 599,735 Interest 2,056,480 2,056,480 Benefit Changes 23,718 23,718 Difference between actual and expected experience (276,487) (276,487) Assumption Changes 0 0 Benefit Payments (1,242,156) (1,242,156) 0 Refunds (4,949) (4,949) 0 Administrative Expense (10,401) 10,401 Contributions - Member 40,168 (40,168) Contributions - Employer 889,481 (889,481) Court Fees and Fire Insurance Tax 12,783 (12,783) Net Investment Income 3,260,548 (3,260,548) Net Change 1,156,341 2,945,474 (1,789,133) Ending 29,171,562 25,096,073 4,075,489
GASB 68 Examples and Explanations
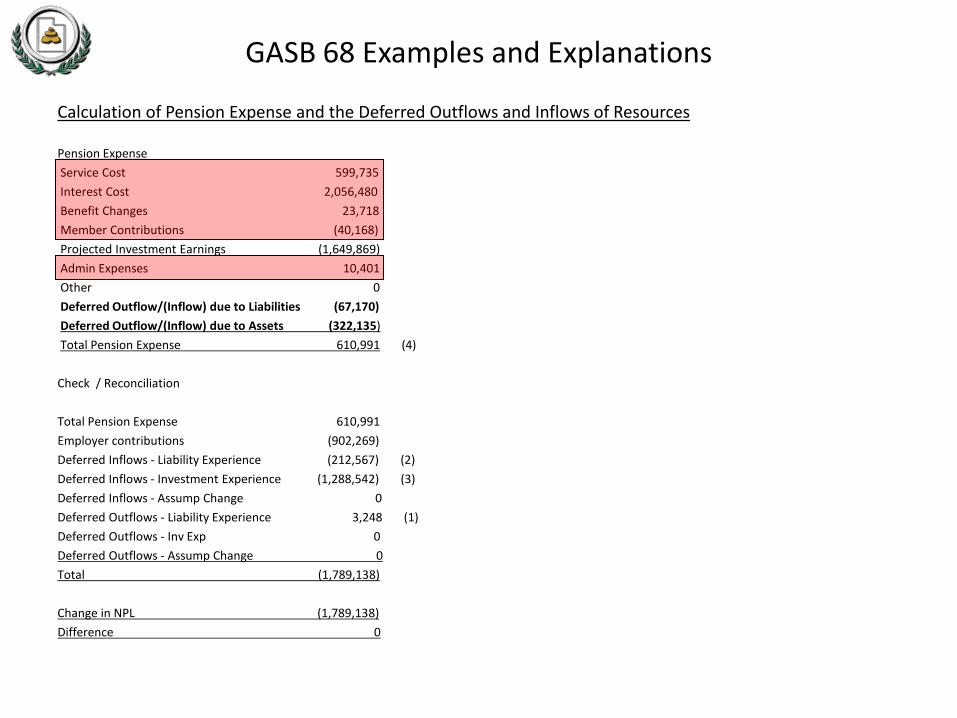
Calculation of Pension Expense and the Deferred Outflows and Inflows of Resources Pension Expense Service Cost 599,735 Interest Cost 2,056,480 Benefit Changes 23,718 Member Contributions (40,168) Projected Investment Earnings (1,649,869) Admin Expenses 10,401 Other 0 Deferred Outflow/(Inflow) due to Liabilities (67,170) Deferred Outflow/(Inflow) due to Assets (322,135) Total Pension Expense 610,991 (4) Check / Reconciliation Total Pension Expense 610,991 Employer contributions (902,269) Deferred Inflows - Liability Experience (212,567) (2) Deferred Inflows - Investment Experience (1,288,542) (3) Deferred Inflows - Assump Change 0 Deferred Outflows - Liability Experience 3,248 (1) Deferred Outflows - Inv Exp 0 Deferred Outflows - Assump Change 0 Total (1,789,138) Change in NPL (1,789,138) Difference 0

Page 1 Utah Retirement Systems Pension footnote disclosure
XYZ City
Notes to the Financial Statements
for the fiscal year-ended June 30, 2014
Summary of Significant Accounting Policies
Pensions: For purposes of measuring the net pension liability, deferred outflows of resources and deferred inflows of resources
related to pensions, and pension expense, information about the fiduciary net position of the Utah Retirement Systems Pension
Plan (URS) and additions to/deductions from URS's fiduciary net position have been determined on the same basis as they are
reported by URS. For this purpose, benefit payments (including refunds of employee contributions) are recognized when due and
payable in accordance with the benefit terms. Investments are reported at fair value.
Note X
General Information about the Pension Plan
Plan description: Eligible plan participants are provided with pensions through the Utah Retirement Systems. The Utah Retirement
Systems are comprised of the following pension trust funds:
• The Public Employees Noncontributory Retirement System (Noncontributory System); Public Employees ContributoryRetirement System (Contributory System); Firefighters Retirement System (Firefighters System); are multiple employer,cost-sharing, public employee retirement systems.
• The Public Safety Retirement System (Public Safety System) is a mixed agent and cost-sharing, multiple-employerretirement system;
• Tier 2 Public Employees Contributory Retirement System (Tier 2 Public Employees System);and the Tier 2 Public Safety andFirefighter Contributory Retirement System (Tier 2 Public Safety and Firefighters System)are multiple employer, cost-sharing, public employee retirement systems.
The Tier 2 Public Employees System became effective July 1, 2011. All eligible employees beginning on or after July 1, 2011, who have no previous service credit with any of the Utah Retirement Systems, are members of the Tier 2 Retirement System.

Page 2 Utah Retirement Systems Pension footnote disclosure
Benefits provided: URS provides retirement, disability, and death benefits. Retirement benefits are as follows:
Summary of Benefits by System
System Final Average Salary Years of service required and/or age eligible for benefit
Benefit percent per year of service
Noncontributory System Highest 3 years 30 years any age 25 years any age* 20 years age 60* 10 years age 62*
4 years age 65
2.0% per year all years
Contributory System Highest 5 years 30 years any age 20 years age 60* 10 years age 62*
4 years age 65
1.25% per year to June 1975; 2.00% per year July 1975 to
present
Public Safety System Highest 3 years 20 years any age 10 years age 60 4 years age 65
2.5% per year up to 20 years; 2.0% per year over 20 years
Firefighters System Highest 3 years 20 years any age 10 years age 60 4 years age 65
2.5% per year up to 20 years; 2.0% per year over 20 years
Governors and Legislators Retirement Plan
N/A N/A As of 12-31-13 Legislators $28.40 per year of service;
Governors $1,300 per term
Judges System Highest 2 years 25 years any age 20 years age 55* 10 years age 62 6 years age 70
5.0% first 10 years; 2.25% second 10 years;
1.0% over 20 years
Tier 2 Public Employees System Highest 5 years 35 years any age 20 years any age 60*
10 years age 62* 4 years age 65
1.5% per year all years
Tier 2 Public Safety and Firefighter System
Highest 5 years 25 years any age 20 years any age 60*
10 years age 62* 4 years age 65
1.5% per year all years
* with actuarial deductions

Page 3 Utah Retirement Systems Pension footnote disclosure
Contributions: As a condition of participation in the Systems, employers and/or employees are required to contribute certain
percentages of salary and wages as authorized by statute and specified by the URS Board. Contributions are actuarially determined
as an amount that, when combined with employee contributions (where applicable) is expected to finance the costs of benefits
earned by employees during the year, with an additional amount to finance any unfunded actuarial accrued liability. Contribution
rates are as follows:
Utah Retirement SystemsEmployee
Paid
Paid by Employer
for Employee
Employer Contribution
Rates
Contributory System
11 - Local Governmental Division Tier 1 N/A 6.000 % 13.280 %
111 - Local Governmental Division Tier 2 N/A N/A 13.900 %
Noncontributory System
15 - Local Governmental Division Tier 1 N/A N/A 17.290 %
Public Safety Retirement System
43 - Other Division A Noncontributory Tier 1 N/A N/A 32.140 %
122 - Other Division A Contributory Tier 2 N/A N/A 20.850 %
Firefighters System
31 - Division A Tier 1 N/A 15.050 % 2.960 %
132 - Division B Tier 2 N/A N/A 11.020 %
Pension Liabilities, Pension Expense, and Deferred Outflows of Resources and Deferred Inflows of Resources Related to Pensions
At December 31, 2013, reported a net pension asset of $12,199 and a net pension liability of $12,010,104
Proportionate Share
Net Pension
Asset
Net Pension Liability
Noncontributory System 1.4017031 % $0 $7,564,315Contributory System 1.2468304 % $0 $390,903Public Safety System 2.3638604 % $0 $3,870,544Firefighters System 12.2386754 % $0 $182,977Tier 2 Public Employees System 0.2269313 % $0 $1,365Tier 2 Public Safety and Firefighter System 2.0658147 % $12,199 $0
$12,199 $12,010,104Total Net Pension Asset / Liability
The net pension asset and liability was measured as of December 31, 2013, and the total pension liability used to calculate the net
pension asset and liability was determined by an actuarial valuation as of January 1, 2014 and rolled-forward using generally
accepted actuarial procedures. The proportion of the net pension asset and liability was based on a projection of the long-term
share of contributions to the pension plan relative to the projected contributions of all participating employers.
For the year ended December 31, 2013, recognized pension expense of $2,476,679. At December 31, 2013, the reported deferred
outflows of resources and deferred inflows of resources related to pensions from the following sources:

Page 4 Utah Retirement Systems Pension footnote disclosure
Deferred Outflows of
Resources
Deferred Inflows of Resources
Differences between expected and actual experience $2,066 $1,174,282
Changes in assumptions $0 $0
Net difference between projected and actual earnings on pension plan investments $0 $5,254,848
Changes in proportion and differences between contributions and proportionate share of contributions $0 $0
Contributions subsequent to the measurement date $1,782,154 $0$1,784,220 $6,429,130Total
$1,782,154 reported as deferred outflows of resources related to pensions resulting from contributions subsequent to the
measurement date will be recognized as a reduction of the net pension liability in the year ended December 31, 2013. Other
amounts reported as deferred outflows of resources and deferred inflows of resources related to pensions will be recognized in
pension expense as follows:
Deferred Outflows (inflows) of Resources
Year Ended December 31
2014 ($1,628,508)2015 ($1,599,754)2016 ($1,585,591)2017 ($1,516,812)2018 ($96,402)
Thereafter $0
Actuarial assumptions: The total pension liability in the December 31, 2013, actuarial valuation was determined using the following
actuarial assumptions, applied to all periods included in the measurement:
Inflation 2.75 Percent
Salary increases 3.50 - 10.50 percent, average, including inflation
Investment rate of return 7.50 percent, net of pension plan investment expense, including inflation
Active member mortality rates are a function of the member's gender, occupation, and age and are developed based upon plan
experience. Retiree mortality assumptions are highlighted in the table below.
Page 5 Utah Retirement Systems Pension footnote disclosure
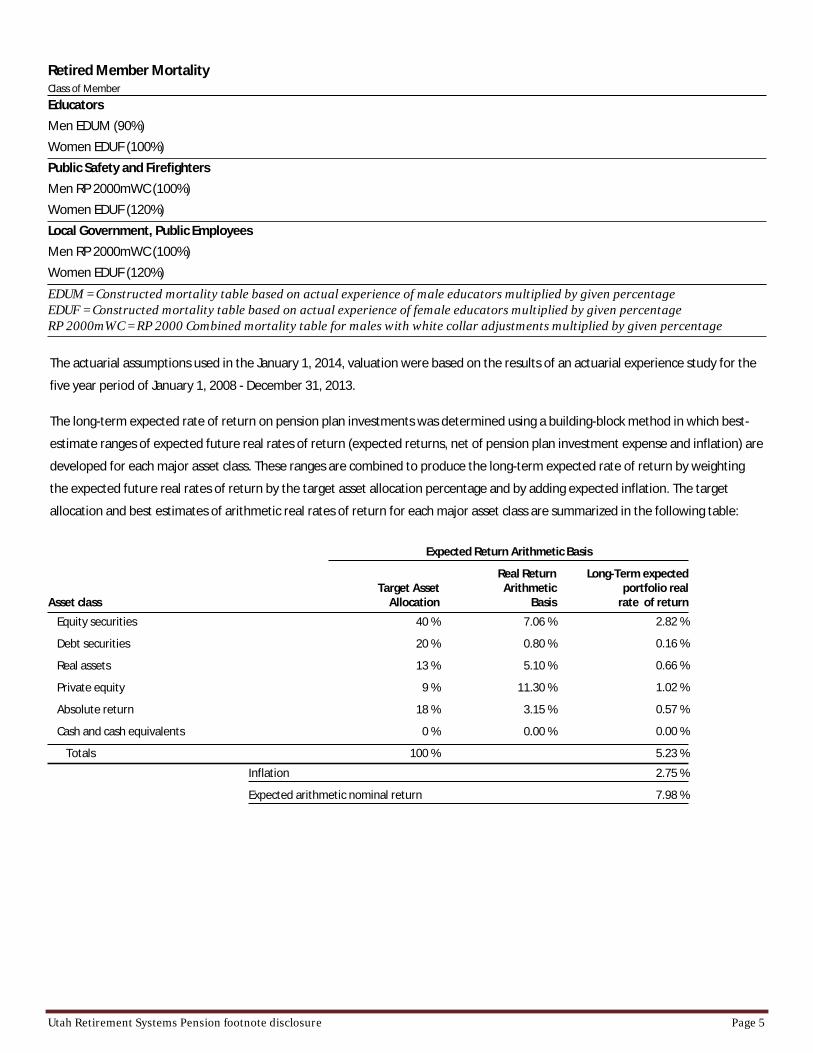
Retired Member MortalityClass of Member
EducatorsMen EDUM (90%)Women EDUF (100%)Public Safety and FirefightersMen RP 2000mWC (100%)Women EDUF (120%)Local Government, Public EmployeesMen RP 2000mWC (100%)Women EDUF (120%)
EDUM = Constructed mortality table based on actual experience of male educators multiplied by given percentage EDUF = Constructed mortality table based on actual experience of female educators multiplied by given percentage RP 2000mWC = RP 2000 Combined mortality table for males with white collar adjustments multiplied by given percentage
The actuarial assumptions used in the January 1, 2014, valuation were based on the results of an actuarial experience study for the
five year period of January 1, 2008 - December 31, 2013.
The long-term expected rate of return on pension plan investments was determined using a building-block method in which best-
estimate ranges of expected future real rates of return (expected returns, net of pension plan investment expense and inflation) are
developed for each major asset class. These ranges are combined to produce the long-term expected rate of return by weighting
the expected future real rates of return by the target asset allocation percentage and by adding expected inflation. The target
allocation and best estimates of arithmetic real rates of return for each major asset class are summarized in the following table:
Expected Return Arithmetic Basis
Real Return Arithmetic
BasisAsset classTarget Asset
Allocation
Long-Term expected portfolio real
rate of return
40 % 7.06 % 2.82 %Equity securities
20 % 0.80 % 0.16 %Debt securities
13 % 5.10 % 0.66 %Real assets
9 % 11.30 % 1.02 %Private equity
18 % 3.15 % 0.57 %Absolute return
0 % 0.00 % 0.00 %Cash and cash equivalents
Totals 100 % 5.23 %
2.75 %Inflation
7.98 %Expected arithmetic nominal return

Page 6 Utah Retirement Systems Pension footnote disclosure
The 7.50% assumed investment rate of return is comprised of an inflation rate of 2.75%, a real return of 4.75% that is net of
investment expense.
Discount rate: The discount rate used to measure the total pension liability was 7.50 percent. The projection of cash flows used to
determine the discount rate assumed that employee contributions will be made at the current contribution rate and that
contributions from all participating employers will be made at contractually required rates that are actuarially determined and
certified by the URS Board. Based on those assumptions, the pension plan's fiduciary net position was projected to be available to
make all projected future benefit payments of current active and inactive employees. Therefore, the long-term expected rate of
return on pension plan investments was applied to all periods of projected benefit payments to determine the total pension
liability.
Sensitivity of the proportionate share of the net pension asset and liability to changes in the discount rate: The following presents
the proportionate share of the net pension liability calculated using the discount rate of 7.50 percent, as well as what the
proportionate share of the net pension liability would be if it were calculated using a discount rate that is 1-percentage-point lower
(6.50 percent) or 1-percentage-point higher (8.50 percent) than the current rate:
$28,336,861 $11,997,905 ($1,441,212)
1% Decrease
(6.50%)
Discount Rate
(7.50%)
1% Increase (8.50%)
Proportionate share of Net pension (asset) / liability
Pension plan fiduciary net position: Detailed information about the pension plan's fiduciary net position is available in the
separately issued URS financial report.
Payables to the pension plan
[If reported payables to the defined benefit pension plan, it should disclose information required by paragraph 122 of GASB 68.]

Page 7 Utah Retirement Systems Pension footnote disclosure
Schedule of Required Supplementary Information SCHEDULE OF THE PROPORTIONATE SHARE OF THE NET PENSION LIABILITY XYZ City Utah Retirement Systems 31-Dec-13 Last 10 Fiscal Years *
Proportion of the net pension liability (asset)
Proportionate share of the net pension liability (asset)
Covered employee payroll
Proportionate share of the net pension liability (asset) as a percentage of its covered-employee payroll
Plan fiduciary net position as a percentage of the total pension liability
Noncontributory System
1.4017031 %
$7,564,315
$12,087,970
62.58 %
87.3 %
Contributory Retirement
System
1.2468304 %
$390,903
$679,682
57.51 %
93.4 %
Public Safety System
2.3638604 %
$3,870,544
$3,716,218
104.15 %
87.3 %
Firefighters System
12.2386754 %
$182,977
$3,310,498
5.53 %
99.0 %
Tier 2 Public Employees
System
0.2269313 %
$1,365
$788,529
0.17 %
98.8 %
Tier 2 Public Safety and
Firefighter System
2.0658147 %
($12,199)
$507,607
-2.40 %
117.6 %
* In accordance with paragraph 81.a of GASB 68, employers will need to disclose a 10-year history of their proportionate share of the Net Pension Liability (Asset) in their RSI.
The 10-year schedule will need to be built prospectively. The schedule above is only for the current year. Prior year numbers are available from your prior year note disclosure
confirmation.

Page 8 Utah Retirement Systems Pension footnote disclosure
Schedule of Required Supplementary Information SCHEDULE OF THE PROPORTIONATE SHARE OF THE NET PENSION LIABILITY XYZ City Utah Retirement Systems 31-Dec-13 Last 10 Fiscal Years *
Contractually required contribution
Contributions in relation to the contractually required contribution
Contribution deficiency (excess)
Covered employee payroll
Contributions as a percentage of covered-employee payroll **
Noncontributory System
$2,045,998
($2,045,998)
-
$12,087,970
16.93 %
Contributory Retirement System
$86,090
($86,090)
-
$679,682
12.67 %
Public Safety System
$1,094,367
($1,094,367)
-
$3,716,218
29.45 %
Firefighters System
$91,284
($91,284)
-
$3,310,498
2.76 %
Tier 2 Public Employees System
$67,229
($67,229)
-
$788,529
8.53 %
Tier 2 Public Safety and Firefighter
System
$56,137
($56,137)
-
$507,607
11.06 %
* Amounts presented were determined as of calendar year January 1 - December 31. Employers will be required to prospectively develop this table in future years to show 10-years of information. The schedule above is only for the current year. Prior year numbers are available from your prior year note disclosure confirmation.
** Contributions as a percentage of covered-employee payroll may be different than the Board certified rate due to rounding or other administrative issues.

Page 9 Utah Retirement Systems Pension footnote disclosure
Notes to Required Supplementary Information
For Year Ended December 31, 2013
Changes of Assumptions
If there were any changes to actuarial assumptions, they would be reported in this area.
Other information that is not required as part of RSI
This information below is not required as part of GASB 68 but is provided for informational purposes. The schedule below is a
summary of the Defined Contribution Savings Plans for pay periods January 1 - December 31.
Defined Contribution System
31-Dec-13
Employee Paid
Contributions
Employer Paid
Contributions
401(k) Plan $443,437 $766,942457 Plan $216,370 $0Roth IRA Plan $0 $0Traditional IRA Plan $0 $0HRA Plan $0 $0
* The employer paid 401(k) contributions include the totals paid for employees enrolled in the Tier 2 DefinedContribution 401(k) Plan.

Any questions regarding this information please contact:
Kim Kellersberger, CGFM Finance Director Phone: 801‐366‐7457 Email: [email protected]
Rob Dolphin, CPA, CGMA Finance Manager Phone: 801‐366‐7429 Email: [email protected]
Thank you,