gasb statement no. 68 report for the connecticut …
TRANSCRIPT

GASB STATEMENT NO. 68 REPORT
FOR THE
CONNECTICUT STATE TEACHERS’ RETIREMENT SYSTEM
PREPARED AS OF JUNE 30, 2016

March 6, 2017
Board of Directors
Connecticut State Teachers’ Retirement System
765 Asylum Avenue
Hartford, CT 06105
Members of the Board:
Presented in this report is information to assist the Connecticut State Teachers’ Retirement System
in meeting the requirements of the Governmental Accounting Standards Board (GASB) Statement
No. 68 and to identify the information to be provided by the actuary, Cavanaugh Macdonald
Consulting (CMC). The information is presented for the period ending June 30, 2016 (the
Measurement Date).
GASB Statement Number 68 establishes accounting and financial reporting requirements for
governmental employers that provide pension benefits to their employees through a trust.
The annual actuarial valuation used as a basis for much of the information presented in this report,
including the Net Pension Liability, was performed as of June 30, 2016. The valuation was based
upon data, furnished by the Retirement System staff, for active, inactive and retired members along
with pertinent financial information. The schedules contained within this report for participating
employers are based on the expected contribution effort as measured June 30, 2016, the date of the
latest biennial valuation.
The actuarial calculations were performed by qualified actuaries according to generally accepted
actuarial procedures and methods. The calculations are based on the current provisions of the
System, and on actuarial assumptions that are internally consistent and individually reasonable
based on the actual experience of the System. In addition, the calculations were completed in
compliance with the laws governing the System and, in our opinion, meet the requirements of
GASB 68. The undersigned are members of the American Academy of Actuaries and meet the
Qualification Standards of the American Academy of Actuaries to render the actuarial opinion
contained herein.
Off
Cavanaugh Macdonald CC OO NN SS UU LL TT II NN GG,, LL LL CC
The experience and dedication you deserve
3550 Busbee Pkwy, Suite 250, Kennesaw, GA 30144 Phone (678) 388-1700 • Fax (678) 388-1730
www.CavMacConsulting.com Offices in Englewood, CO • Kennesaw, GA • Bellevue, NE

Board of Directors
March 6, 2017
Page 2
These results are only for financial reporting and may not be appropriate for funding purposes or
other types of analysis. Calculations for purposes other than satisfying the requirements of GASB
67 and GASB 68 may produce significantly different results. Future actuarial results may differ
significantly from the current results presented in this report due to such factors as changes in plan
experience or changes in economic or demographic assumptions.
Sincerely yours,
John J. Garrett ASA, FCA, MAAA Cathy Turcot
Principal and Consulting Actuary Principal and Managing Director
Jonathan Craven ASA, EA, FCA, MAAA Ben Mobley ASA, ACA, MAAA
Consulting Actuary Actuary

TABLE OF CONTENTS
Section Item Page No.
I Introduction 1
II Summary of Collective Amounts 3
III Notes to Financial Statements 4
IV Collective Pension Expense 9
V Required Supplementary Information 11
Schedule
A Schedule of Employer Allocations 12
B Schedule of Pension Amounts by Employer 18
C Summary of Benefit Provisions Evaluated 24
D Statement of Actuarial Assumptions and Methods 27

Page 1
REPORT OF THE ANNUAL GASB STATEMENT NO. 68
REQUIRED INFORMATION FOR THE
EMPLOYERS PARTCIPATING IN THE
CONNECTICUT STATE TEACHERS’ RETIREMENT SYSTEM
PREPARED AS OF JUNE 30, 2016
SECTION I – INTRODUCTION
The Governmental Accounting Standards Board issued Statement No. 68 (GASB 68),
“Accounting and Financial Reporting For Pensions” in June 2012. GASB 68’s effective date is
for an employer’s fiscal year beginning after June 15, 2014. The Connecticut State Teachers’
Retirement System (System) is a cost-sharing multiple employer defined benefit pension plan with
a special funding situation.
This report, prepared as of June 30, 2016 (the Measurement Date), presents information to assist
the employers participating in System in meeting the requirements of GASB 68 for the fiscal year
ending June 30, 2017 (Reporting Date). Much of the material provided in this report is based on
the data, assumptions and results of the annual actuarial valuation of the System as of
June 30, 2016. The results of that valuation were detailed in a report dated November 2, 2016.
The Net Pension Liability (NPL) shown in the GASB Statement No. 67 Report for the Connecticut
State Teachers’ Retirement System prepared as of June 30, 2016 and submitted
March 7, 2017 is the collective NPL used for purposes of GASB 68. Please refer to that report for
the derivation of the collective NPL.
Pension Expense (PE) includes amounts for service cost (the normal cost under the Entry Age
Normal actuarial cost method for the year), interest on the Total Pension Liability (TPL), changes
in benefit structure, amortization of increases/decreases in liability due to actuarial experience and
actuarial assumption changes, and amortization of investment gains/losses. The actuarial
experience and assumption change impacts are amortized over the average expected remaining
service life of the Plan membership as of the Measurement Date, and investment gains/losses are
amortized over five years. The development of the collective PE is shown in Section IV.
The unamortized portions of each year’s experience, assumption changes and investment
gains/losses are used to develop deferred inflows and outflows, which also must be included in the
employer’s and non-employer contributing entities’ financial statements. The development of the
collective deferred inflows and outflows is shown in Section III.

Page 2
The State makes all contributions to the System on behalf of employees of the participating
districts. Therefore, participating employers are considered to be in a special funding situation as
defined by GASB 68 and the State is treated as a non-employer contributing entity in the System.
Since the districts do not contribute directly to the System, there is no NPL or deferred inflows or
outflows to report in the financial statements of the districts. However, the notes to the financial
statements must disclose the portion of the non-employer contributing entities’ total proportionate
share of the collective NPL that is associated with the employer. In addition, each district must
recognize the total PE associated with the district as well as revenue in an amount equal to the non-
employer contributing entities’ total proportionate share of the collective PE associated with the
district. The State, as a non-employer contributing entity, would report the entire collective
amounts of the NPL, Deferred Inflows and Outflows and PE.
Schedule A of this report shows the total amount of employer contributions from the State as
support provided to the districts for the year ending June 30, 2016. Schedule A also shows the
proportionate share percentages that have been determined based on these contributions.
Based on these percentages we have determined the proportionate share amounts of the NPL
associated with each participating employer and the employer PE and revenue for State support
for each participating employer. These amounts are shown in Schedule B.
Section II of this report is a summary of the principal results of the collective amounts under GASB
68. Section III provides the results of all the necessary calculations, presented in the order laid out
in GASB 68 for note disclosure and Section V shows the Required Supplementary Information
(RSI).

Page 3
SECTION II - SUMMARY OF COLLECTIVE AMOUNTS
($ IN THOUSANDS)
Valuation Date (VD): June 30, 2016
Measurement Date (MD): June 30, 2016
Reporting Date (RD): June 30, 2017
Single Equivalent Interest Rate (SEIR):
Long-Term Expected Rate of Return 8.00%
Municipal Bond Index Rate at Measurement Date 3.01%
Fiscal Year in which Plan’s Fiduciary Net Position is
projected to be depleted from future benefit payments for
current members
N/A
Single Equivalent Interest Rate 8.00%
Collective Net Pension Liability:
Total Pension Liability (TPL) $ 29,839,923
Fiduciary Net Position (FNP) 15,594,872
Net Pension Liability (NPL = TPL – FNP) $ 14,245,051
FNP as a percentage of TPL 52.26%
Collective Pension Expense (PE): $1,553,474
Collective Deferred Outflows of Resources: $3,094,621
Collective Deferred Inflows of Resources: $320,621

Page 4
SECTION III –NOTES TO FINANCIAL STATEMENTS
The material presented herein will follow the order presented in GASB 68. Paragraph numbers
are provided for ease of reference. Amounts are shown in aggregate. Please refer to Schedule B
of this report for the proportionate share of certain pension amounts as required by GASB 68.
Paragraphs 77 and 78(a)-(f): These paragraphs require information to be disclosed regarding
the actuarial assumptions used to measure the TPL. The actuarial assumptions used in the
June 30, 2016 valuation were based on the results of an actuarial experience study for the period
July 1, 2010 – June 30, 2015. The complete set of actuarial assumptions utilized in developing
the TPL are outlined in Schedule D. The TPL was determined by an actuarial valuation as of
June 30, 2014, using the following key actuarial assumptions:
Inflation 2.75 percent
Salary increases, including inflation 3.25 – 6.50
Long-Term Investment Rate of Return, net of
pension plan investment expense, including
inflation
8.00 percent
Mortality rates were based on the RPH-2014 White Collar table with employee and annuitant rates
blended from ages 50 to 80, projected to the year 2020 using the BB improvement scale, and
further adjusted to grade in increases (5% for females and 8% for males) to rates over age 80 for
the period after service retirement and for dependent beneficiaries as well as for active members.
The RPH-2014 Disabled Mortality Table projected to 2017 with Scale BB is used for the period
after disability retirement.
The long-term expected rate of return on pension plan investments was determined using a log-
normal distribution analysis in which best-estimate ranges of expected future real rates of return
(expected returns, net of pension plan investment expense and inflation) are developed for each
major asset class. These ranges are combined to produce the long-term expected rate of return by
weighting the expected future real rates of return by the target asset allocation percentage and by
adding expected inflation. The target asset allocation and best estimates of arithmetic real rates of
return for each major asset class are summarized in the following table:

Page 5
Asset Class Target
Allocation
Long-Term Expected
Real Rate of Return
Large Cap U.S. Equities 25.0% 5.8%
Developed Non-U.S. Equities 20.0 6.6
Emerging Markets (Non-U.S.) 9.0 8.3
Real Estate 5.0 5.1
Private Equity 10.0 7.6
Alternative Investment 8.0 4.1
Fixed Income (Core) 13.0 1.3
High Yield Bonds 2.0 3.9
Emerging Market Bond 4.0 3.7
Inflation Linked Bonds 6.0 1.0
Cash 6.0 0.4
Discount rate. The discount rate used to measure the total pension liability was 8.00 percent. The
projection of cash flows used to determine the discount rate assumed that plan member
contributions will be made at the current contribution rate and that State contributions will be made
at the actuarially determined rates in future years. Based on those assumptions, the pension plan’s
fiduciary net position was projected to be available to make all projected future benefit payments
of current plan members. Therefore, the long-term expected rate of return on pension plan
investments was applied to all periods of projected benefit payments to determine the total pension
liability.
Paragraph 78 (g): This paragraph requires disclosure of the sensitivity of the net pension liability
to changes in the discount rate. The following presents the net pension liability of the System,
calculated using the discount rate of 8.00 percent, as well as what the System’s net pension liability
would be if it were calculated using a discount rate that is 1-percentage-point lower (7.00 percent)
or 1-percentage-point higher (9.00 percent) than the current rate ($ thousands):
1%
Decrease
(7.00%)
Current
Discount
Rate (8.00%)
1%
Increase
(9.00%)
Collective net pension liability $17,574,399
$14,245,051 $11,430,611

Page 6
Paragraph 80(a): This paragraph requires disclosure of the employer’s proportionate share of the
collective NPL and if an employer has a special funding situation the portion of the non-employer
contributing entities’ proportional share of the collective NPL that is associated with the employer.
These amounts are shown in Schedule B.
Paragraph 80(b): This paragraph requires disclosure of the employer’s proportion (percentage)
of the collective NPL and the changes in proportion since the prior measurement date. 100% of
the collective NPL is allocated to the State.
Paragraph 80(c): June 30, 2016 is the actuarial valuation date upon which the TPL is based.
Paragraph 80(d) and (e): Since the prior measurement date rates of withdrawal, disability,
retirement, mortality, and assumed rates of salary increase were adjusted to more closely reflect
actual and anticipated experience. These assumptions were recommended as part of the Experience
Study for the System for the five year period ended June 30, 2015. There were no changes in
benefits that affected the measurement of the TPL since the prior measurement date.
Paragraph 80(f): Not applicable.
Paragraph 80(g): Please see Section IV of this report for the development of the collective
pension expense. The PE for each employer is shown in Schedule B.
Paragraph 80(h): Since certain expense items are amortized over closed periods each year, the
deferred portions of these items must be tracked annually. If the amounts serve to reduce collective
pension expense they are labeled deferred inflows. If they will increase collective pension expense
they are labeled deferred outflows. The amortization of these amounts is accomplished on a level
dollar basis, with no interest included in the deferred amounts. Experience gains/losses and the
impact of changes in actuarial assumptions, if any, are amortized over the average expected
remaining service life of the active and inactive Plan members at the beginning of the fiscal year.
Investment gains and losses are amortized over a fixed five year period.

Page 7
The table below provides a summary in the difference between projected and actual earnings on
plan investments.
Investment Earnings (Gain)/Loss as of June 30, 2016
($ thousands)
a Expected asset return rate 8.50%
b Beginning of year market value assets (BOY) $16,120,053
c End of year market value assets (EOY) 15,594,872
d Expected return on BOY for plan year ( a x b) 1,370,205
External Cash Flow
Contributions - employer 975,578
Contributions - member 293,493
Refunds of contributions 0
Benefits paid (1,738,131)
Admin expenses 0
Other changes (37,648)
e Net cash flow (506,708)
f Expected return on net cash flow (a x 0.5 x e) (21,535)
g Projected earnings for plan year (d + f) 1,348,670
h Net investment income (c - b - e) (18,473)
Investment earnings (gain)/loss (g -h) 1,367,143
*Other changes are comprised of participating employer contributions for Early Retirement
Incentive Plans, service purchases, etc.
The table below provides a summary of the determination of the average expected remaining
service life for the entire Plan membership determined at the beginning of the year.
Category Number
Average Years of
Working Lifetime
(1) (2)
a. Active Members 51,433 13.08
b. Inactive Members 47,321 0.00
c. Total 98,754
Weighted Average Years of Working Lifetime
[(a1 * a2) + (b1 * b2)]/c1 6.81

Page 8
The table below provides a summary of the collective deferred inflows and outflows as of the
Measurement Date. 100% of these amounts are allocated to the State.
Deferred Outflows
of Resources
Deferred Inflows of
Resources
Differences between expected and actual
experience
$0 $320,621
Changes of assumptions 1,888,199 0
Net difference between projected and actual
earnings on plan investments
1,206,422 0
Employer contributions subsequent to the
Measurement Date
0 0
Total $3,094,621 $320,621
Paragraph 80(i): Collective amounts reported as deferred outflows of resources and deferred
inflows of resources related to pensions will be recognized in the collective pension expense as
follows. 100% of these amounts are allocated to the State.
Deferred Amounts to be Recognized in Fiscal Years
Following the Reporting Date:
Year 1 $509,415
Year 2 509,417
Year 3 723,584
Year 4 543,234
Year 5 269,807
Year 6 218,543
Year 7 0
Thereafter 0
Paragraph 80(j): The amount of revenue recognized for the support provided by non-employer
contributing entities for the participating employers is provided in Schedule B.

Page 9
SECTION IV – COLLECTIVE PENSION EXPENSE
As noted earlier, the collective Pension Expense (PE) consists of a number of different items.
GASB 68 refers to the first as Service Cost which is the Normal Cost using the Entry Age Normal
actuarial funding method. The second item is interest on the beginning Total Pension Liability
(TPL) and the cash flow during the year at the 8.50% rate of return in effect as of the previous
measurement date. The next three items refer to any changes that occurred in the TPL due to:
benefit changes, or
actual versus expected experience, or
changes in actuarial assumptions.
Benefit changes, which are reflected immediately in PE, can be positive, if there is a benefit
improvement for existing Plan members, or negative if there is a benefit reduction. For the year
ended June 30, 2016, there were no benefit changes to be recognized.
The next item to be recognized is the portion of current year changes in TPL due to actual versus
expected Plan experience for the year. The portion to recognize in the current year is determined
by spreading the total change over the average expected remaining service life of the entire Plan
membership determined at the beginning of the year. The average expected remaining service life
of active members is the average number of years the active members are expected to remain
active. For the year ended June 30, 2014 this number of years for the active members is 13.08.
The average expected remaining service life of the inactive members is, of course, zero. Therefore,
the number of years to use for the amortization is the weighted average for all active and inactive
members, or 6.81 years.
The last item under changes in TPL are changes in actuarial assumptions. Since the prior
measurement date rates of withdrawal, disability, retirement, mortality, and assumed rates of salary
increase were adjusted to more closely reflect actual and anticipated experience. These
assumptions were recommended as part of the Experience Study for the System for the five year
period ended June 30, 2015. The change in TPL due to changes in actuarial assumptions will be
spread over the average expected remaining service life of the plan membership.
Member contributions for the year and projected earnings on the Fiduciary Net Position (FNP),
again at the discount rate used to calculate the liabilities, are subtracted from the amount
determined thus far. One-fifth of current period differences between projected and actual
investment earnings on the FNP are recognized in the pension expense.

Page 10
The current year portions of previously determined experience, assumption and earnings amounts,
recognized as deferred outflows and inflows (see Section III) are included also. Deferred outflows
are added to the PE while deferred inflows are subtracted from the PE. Finally, administrative
expenses and other miscellaneous items are included.
The calculation of the Collective Pension Expense determined as of the measurement date is shown
in the following table:
Collective Pension Expense
Determined as of the Measurement Date
($ thousands)
Service Cost at end of year $419,616
Interest on the TPL and net cash flow 2,228,958
Current-period benefit changes 0
Expensed portion of current-period difference between expected
and actual experience in the total pension liability (55,184)
Expensed portion of current-period changes of assumptions 324,991
Member contributions (293,493)
Projected earnings on plan investments (1,348,670)
Expensed portion of current-period differences between projected
and actual earnings on plan investments 273,429
Administrative expense 0
Other 37,648
Recognition of beginning deferred outflows of resources as
pension expense 0
Recognition of beginning deferred inflows of resources as
pension expense
(33,821)
Collective Pension Expense $1,553,474

Page 11
SECTION V – REQUIRED SUPPLEMENTARY INFORMATION
Paragraphs 81(a)-(b): CMC was not required to supply this information.
Paragraph 82:
Changes of assumptions. In 2016, rates of withdrawal, disability, retirement,
mortality and assumed rates of salary increase were adjusted to more closely
reflect actual and anticipated experience. These assumptions were
recommended as part of the Experience Study for the System for the five year
period ended June 30, 2015.
Method and assumptions used in calculations of actuarially determined
contributions. The actuarially determined contributions in the schedule of
employer contributions are calculated as of June 30 each biennium for the fiscal
years ending two and three years after the valuation date. The following
actuarial methods and assumptions were used to determine the most recent
contributions reported in that schedule:
Actuarial cost method Entry age
Amortization method Level percent of pay, closed
Single equivalent amortization
period
20.4 years
Asset valuation method 4-year smoothed market
Inflation 3.00 percent
Salary increase 3.75-7.00 percent, including inflation
Investment rate of return 8.50 percent, net of investment related
expense

Page 12
SCHEDULE A
CONNECTICUT STATE TEACHERS’ RETIREMENT SYSTEM
Schedule of Employer Allocations as of June 30, 2016
Employers
2016 Expected Employer
Contribution Effort for
Allocation Purposes
Employer
Allocation
Percentage
Andover $ 512,383 0.052521%
Ansonia 3,151,871 0.323077%
Ashford 747,642 0.076636%
Avon 6,555,089 0.671918%
Barkhamsted 399,492 0.040949%
Berlin 5,476,492 0.561359%
Bethany 804,534 0.082467%
Bethel 5,347,015 0.548087%
Highville Chtr 375,105 0.038450%
Bloomfield 4,307,502 0.441533%
Bolton 1,648,401 0.168967%
Bozrah 416,592 0.042702%
Branford 6,253,739 0.641029%
Bridgeport 29,691,588 3.043487%
Bristol 13,798,311 1.414373%
Brookfield 4,610,822 0.472625%
Brooklyn 74,900 0.007678%
Cldrn Ctr Com Prog 88,429 0.009064%
Canaan 205,950 0.021111%
Canterbury 837,981 0.085896%
Canton 2,708,577 0.277638%
Chaplin 411,998 0.042231%
Cheshire 7,955,971 0.815514%
Chester 304,986 0.031262%
Clinton 3,919,055 0.401716%
Colchester 4,555,794 0.466984%
Amistad Acd 806,342 0.082653%
Colebrook 216,446 0.022186%
Columbia 985,289 0.100995%
Cornwall 261,812 0.026837%
Coventry 2,974,563 0.304903%
Cromwell 3,319,427 0.340252%
Danbury 17,632,263 1.807366%
Darien 10,403,863 1.066431%
Deep River 407,213 0.041741%
Derby 2,150,772 0.220461%
Eastford 342,680 0.035126%
East Granby 1,907,852 0.195561%

Page 13
Employers
2016 Expected Employer
Contribution Effort for
Allocation Purposes
Employer
Allocation
Percentage
East Haddam $ 2,246,368 0.230260%
East Hampton 3,526,709 0.361499%
East Hartford 12,898,444 1.322134%
East Haven 5,347,006 0.548086%
East Lyme 5,044,737 0.517102%
Easton 1,627,187 0.166792%
East Windsor 2,477,028 0.253904%
Ellington 4,316,658 0.442472%
Enfield 9,173,808 0.940346%
Essex 549,939 0.056371%
Fairfield 20,584,027 2.109931%
Farmington 7,693,202 0.788579%
Franklin 324,222 0.033234%
Glastonbury 11,672,294 1.196449%
Granby 3,434,543 0.352052%
Greenwich 22,728,847 2.329783%
Griswold 2,978,205 0.305276%
Groton 9,102,337 0.933020%
Guilford 6,457,730 0.661939%
Hamden 10,974,201 1.124892%
Hampton 213,622 0.021897%
Hartford 38,219,419 3.917618%
Hartland 389,870 0.039963%
Hebron 1,336,168 0.136962%
Kent 468,100 0.047982%
Killingly 3,761,808 0.385598%
Lebanon 1,668,126 0.170988%
Ledyard 4,464,227 0.457598%
Lisbon 770,448 0.078973%
Litchfield 2,100,676 0.215326%
Madison 5,908,216 0.605612%
Manchester 12,587,374 1.290248%
Mansfield 2,709,887 0.277772%
Marlborough 978,678 0.100318%
Meriden 13,218,326 1.354922%
Middletown 8,512,446 0.872554%
Milford 12,384,692 1.269472%
Monroe 6,826,831 0.699773%
Montville 4,557,269 0.467135%
Naugatuck 6,410,149 0.657062%
New Britain 17,356,036 1.779052%
New Canaan 9,507,009 0.974500%
New Fairfield 4,754,424 0.487344%

Page 14
Employers
2016 Expected Employer
Contribution Effort for
Allocation Purposes
Employer
Allocation
Percentage
New Hartford $ 832,064 0.085289%
New Haven 36,338,131 3.724780%
Newington 7,735,505 0.792915%
New London 5,091,356 0.521881%
New Milford 5,740,996 0.588471%
Newtown 8,404,317 0.861471%
Norfolk 202,701 0.020778%
North Branford 3,281,814 0.336397%
North Canaan 451,878 0.046319%
North Haven 5,896,367 0.604397%
No.Stonington 1,518,928 0.155695%
Norwalk 21,671,319 2.221382%
Norwich 5,522,316 0.566056%
NFA 3,749,924 0.384380%
Old Saybrook 2,884,413 0.295662%
Orange 2,283,913 0.234109%
Oxford 3,002,723 0.307789%
Plainfield 3,563,820 0.365303%
Plainville 4,204,726 0.430998%
Plymouth 2,595,577 0.266055%
Pomfret 678,756 0.069575%
Portland 2,193,157 0.224806%
Preston 865,249 0.088691%
Putnam 150,430 0.015420%
Redding 2,324,256 0.238244%
RSD 1 1,686,448 0.172867%
RSD 4 1,630,754 0.167158%
RSD 5 4,624,027 0.473978%
RSD 6 1,698,458 0.174098%
RSD 7 1,916,304 0.196428%
RSD 8 2,846,366 0.291762%
Ridgefield 10,224,627 1.048058%
Rocky Hill 4,798,188 0.491830%
Salem 719,638 0.073765%
Salisbury 581,797 0.059636%
Scotland 252,852 0.025918%
Seymour 3,825,072 0.392083%
Sharon 430,838 0.044162%
Shelton 8,539,339 0.875311%
Sherman 723,370 0.074148%
Simsbury 8,051,440 0.825299%
Somers 2,567,375 0.263164%
Southington 10,378,055 1.063785%

Page 15
Employers
2016 Expected Employer
Contribution Effort for
Allocation Purposes
Employer
Allocation
Percentage
S. Windsor $ 8,115,891 0.831906%
Sprague 499,815 0.051233%
Stafford 2,807,338 0.287761%
Stamford 32,453,440 3.326586%
SDE 8,719,756 0.893804%
DCF Recq Home 439,679 0.045069%
Sterling 607,305 0.062251%
Stonington 4,049,572 0.415095%
Stratford 12,265,259 1.257230%
Suffield 4,339,550 0.444818%
Thomaston 1,532,464 0.157083%
Thompson 1,721,478 0.176457%
Tolland 4,281,441 0.438862%
Torrington 7,350,052 0.753405%
Trumbull 12,868,785 1.319093%
Union 136,336 0.013975%
Vernon 6,030,310 0.618127%
Voluntown 543,627 0.055724%
Wallingford 12,005,909 1.230646%
Waterbury 28,496,777 2.921015%
Waterford 5,439,493 0.557566%
Watertown 4,277,670 0.438475%
Westbrook 1,860,930 0.190752%
W.Hartford 17,996,592 1.844711%
West Haven 10,279,322 1.053665%
Weston 5,325,128 0.545843%
Westport 13,032,118 1.335836%
Wethersfield 6,344,699 0.650353%
Willington 883,072 0.090518%
Wilton 9,222,619 0.945349%
Winchester 1,066,710 0.109341%
Windham 5,637,765 0.577890%
Windsor 7,278,368 0.746057%
Windsor Locks 3,704,703 0.379744%
Winsted/Gilbert 1,019,995 0.104553%
Wolcott 3,956,505 0.405555%
Woodbridge 1,530,832 0.156915%
Woodstock 1,214,123 0.124452%
Woodstock Ad 1,681,810 0.172391%
UCONN 340,798 0.034933%
RSD 9 2,218,473 0.227401%
CCI Somers 15,212 0.001559%
RSD 10 4,154,990 0.425900%

Page 16
Employers
2016 Expected Employer
Contribution Effort for
Allocation Purposes
Employer
Allocation
Percentage
Supervison District $ 797,331 0.081729%
NWCTC 78,017 0.007997%
MCTC 57,861 0.005931%
Norwalk CTC 59,439 0.006093%
WCSU 136,854 0.014028%
CCSU 310,441 0.031821%
ESCU 79,817 0.008181%
SCSU 362,270 0.037134%
RSD 11 573,779 0.058814%
CCTC 27,632 0.002832%
Hou CTC 38,449 0.003941%
Naug CTC 108,784 0.011151%
MCTC 80,716 0.008274%
Ed Connection 550,624 0.056441%
RSD 12 2,031,998 0.208287%
Gateway CTC 268,794 0.027552%
RSD 13 3,712,800 0.380574%
RSD 14 3,449,908 0.353627%
CCI Cheshire 37,468 0.003841%
Shared Svcs 354,846 0.036373%
CREC 18,862,234 1.933442%
RSD 15 6,946,124 0.712001%
RSD 16 3,603,561 0.369377%
TRCC (Mohegan) 29,578 0.003032%
Tunxis CTC 69,060 0.007079%
QVCC - 0.000000%
Odyssey 439,748 0.045076%
CES 2,765,542 0.283477%
ACES 5,544,297 0.568309%
Project Learn 3,767,519 0.386183%
RSD 17 3,875,061 0.397207%
Asnun CTC 58,117 0.005957%
Project O 65,572 0.006721%
RSD 18 2,968,187 0.304249%
DCF Mental Health 27,666 0.002836%
EASTCONN 1,629,008 0.166979%
BSBE 238,905 0.024489%
RSD 19 2,388,609 0.244840%
UCONN Health 181,211 0.018575%
CCI Suffield - 0.000000%
CCI Niantic 16,071 0.001647%
Children's CTR 230,094 0.023585%
Bridges Academy 298,356 0.030583%

Page 17
Employers
2016 Expected Employer
Contribution Effort for
Allocation Purposes
Employer
Allocation
Percentage
Common Ground $ 294,247 0.030161%
Explorations 197,202 0.020214%
Intergrated Day 460,127 0.047165%
Isaac 440,552 0.045158%
Jumoke Academy 703,657 0.072127%
Side by Side 347,538 0.035624%
Trailblazers Academy 198,218 0.020318%
New Beginnings - 0.000000%
Elm City CP 372,007 0.038132%
Stamford Academy 152,412 0.015623%
Park City 325,906 0.033406%
AF Bridgeport Academy 267,965 0.027467%
SERC 50,095 0.005135%
AF Hartford Acad 894,795 0.091720%
Brass City 199,093 0.020408%
Path Academy 102,045 0.010460%
Booker T. Washington(BTW) 193,467 0.019831%
Total $ 975,578,000 100.000000%
.

Page 18
SCHEDULE B
CONNECTICUT STATE TEACHERS’ RETIREMENT SYSTEM
Schedule of Pension Amounts by Employer as of June 30, 2016
Employers
State’s Proportionate Share
Of the Net Pension Liability
Associated with the District
Pension
Expense and Revenue
For State Support
Andover $ 7,481,645 $ 815,900
Ansonia 46,022,526 5,018,922
Ashford 10,916,812 1,190,518
Avon 95,715,132 10,438,079
Barkhamsted 5,833,239 636,136
Berlin 79,965,829 8,720,561
Bethany 11,747,532 1,281,111
Bethel 78,075,252 8,514,387
Highville Chtr 5,477,159 597,304
Bloomfield 62,896,649 6,859,106
Bolton 24,069,374 2,624,852
Bozrah 6,082,935 663,366
Branford 91,314,924 9,958,221
Bridgeport 433,546,254 47,279,777
Bristol 201,478,144 21,971,916
Brookfield 67,325,617 7,342,100
Brooklyn 1,093,665 119,268
Cldrn Ctr Com Prog 1,291,207 140,811
Canaan 3,007,213 327,947
Canterbury 12,235,904 1,334,369
Canton 39,549,707 4,313,038
Chaplin 6,015,846 656,050
Cheshire 116,170,324 12,668,791
Chester 4,453,297 485,648
Clinton 57,224,684 6,240,557
Colchester 66,522,123 7,254,477
Amistad Acd 11,773,919 1,283,988
Colebrook 3,160,468 344,660
Columbia 14,386,846 1,568,937
Cornwall 3,822,885 416,899
Coventry 43,433,532 4,736,583
Cromwell 48,469,113 5,285,731
Danbury 257,460,172 28,076,957
Darien 151,913,587 16,566,723
Deep River 5,945,978 648,430
Derby 31,404,825 3,424,809
Eastford 5,003,694 545,671
East Granby 27,857,789 3,037,992

Page 19
Employers
State’s Proportionate Share
Of the Net Pension Liability
Associated with the District
Pension
Expense and Revenue
For State Support
East Haddam $ 32,800,687 $ 3,577,033
East Hampton 51,495,781 5,615,800
East Hartford 188,338,593 20,539,000
East Haven 78,075,123 8,514,373
East Lyme 73,661,494 8,033,051
Easton 23,759,618 2,591,072
East Windsor 36,168,696 3,944,326
Ellington 63,030,340 6,873,685
Enfield 133,952,756 14,608,029
Essex 8,030,014 875,702
Fairfield 300,560,809 32,777,236
Farmington 112,333,460 12,250,367
Franklin 4,734,177 516,279
Glastonbury 170,434,778 18,586,525
Granby 50,149,997 5,469,037
Greenwich 331,878,731 36,192,568
Griswold 43,486,721 4,742,383
Groton 132,909,163 14,494,222
Guilford 94,293,524 10,283,048
Hamden 160,241,474 17,474,909
Hampton 3,119,234 340,164
Hartford 558,066,682 60,859,177
Hartland 5,692,739 620,814
Hebron 19,510,263 2,127,664
Kent 6,835,035 745,385
Killingly 54,928,619 5,990,163
Lebanon 24,357,391 2,656,261
Ledyard 65,185,087 7,108,668
Lisbon 11,249,813 1,226,833
Litchfield 30,673,339 3,345,038
Madison 86,269,713 9,408,022
Manchester 183,796,456 20,043,664
Mansfield 39,568,826 4,315,123
Marlborough 14,290,313 1,558,410
Meriden 193,009,397 21,048,368
Middletown 124,295,783 13,554,902
Milford 180,836,970 19,720,921
Monroe 99,683,015 10,870,791
Montville 66,543,656 7,256,825
Naugatuck 93,598,763 10,207,281
New Britain 253,426,801 27,637,103
New Canaan 138,818,045 15,138,607
New Fairfield 69,422,450 7,570,768

Page 20
Employers
State’s Proportionate Share
Of the Net Pension Liability
Associated with the District
Pension
Expense and Revenue
For State Support
New Hartford $ 12,149,511 $ 1,324,948
New Haven 530,596,757 57,863,483
Newington 112,951,155 12,317,729
New London 74,342,205 8,107,285
New Milford 83,828,035 9,141,748
Newtown 122,716,922 13,382,721
Norfolk 2,959,766 322,773
North Branford 47,919,906 5,225,838
North Canaan 6,598,173 719,554
North Haven 86,096,709 9,389,156
No.Stonington 22,178,866 2,418,685
Norwalk 316,437,065 34,508,599
Norwich 80,634,937 8,793,530
NFA 54,755,082 5,971,238
Old Saybrook 42,117,198 4,593,032
Orange 33,348,904 3,636,818
Oxford 43,844,723 4,781,425
Plainfield 52,037,656 5,674,893
Plainville 61,395,946 6,695,448
Plymouth 37,899,711 4,133,100
Pomfret 9,910,958 1,080,826
Portland 32,023,723 3,492,302
Preston 12,634,071 1,377,791
Putnam 2,196,534 239,540
Redding 33,937,982 3,701,059
RSD 1 24,624,923 2,685,436
RSD 4 23,811,705 2,596,752
RSD 5 67,518,434 7,363,128
RSD 6 24,800,297 2,704,562
RSD 7 27,981,202 3,051,451
RSD 8 41,561,649 4,532,447
Ridgefield 149,296,449 16,281,314
Rocky Hill 70,061,472 7,640,455
Salem 10,507,911 1,145,925
Salisbury 8,495,197 926,432
Scotland 3,692,060 402,632
Seymour 55,852,374 6,090,902
Sharon 6,290,948 686,050
Shelton 124,688,459 13,597,724
Sherman 10,562,396 1,151,867
Simsbury 117,564,334 12,820,813
Somers 37,487,912 4,088,192
Southington 151,536,753 16,525,627

Page 21
Employers
State’s Proportionate Share
Of the Net Pension Liability
Associated with the District
Pension
Expense and Revenue
For State Support
S. Windsor $ 118,505,418 $ 12,923,442
Sprague 7,298,118 795,886
Stafford 40,991,768 4,470,300
Stamford 473,873,849 51,677,646
SDE 127,322,852 13,885,015
DCF Recq Home 6,420,037 700,128
Sterling 8,867,652 967,049
Stonington 59,130,448 6,448,388
Stratford 179,093,051 19,530,741
Suffield 63,364,596 6,910,137
Thomaston 22,376,509 2,440,239
Thompson 25,136,424 2,741,217
Tolland 62,516,115 6,817,607
Torrington 107,322,905 11,703,948
Trumbull 187,905,525 20,491,773
Union 1,990,724 217,096
Vernon 88,052,492 9,602,441
Voluntown 7,937,848 865,651
Wallingford 175,306,117 19,117,762
Waterbury 416,100,038 45,377,204
Waterford 79,425,593 8,661,646
Watertown 62,461,044 6,811,601
Westbrook 27,172,657 2,963,276
W.Hartford 262,779,990 28,657,102
West Haven 150,095,086 16,368,408
Weston 77,755,663 8,479,534
Westport 190,290,456 20,751,858
Wethersfield 92,643,094 10,103,062
Willington 12,894,306 1,406,170
Wilton 134,665,484 14,685,755
Winchester 15,575,729 1,698,589
Windham 82,320,688 8,977,367
Windsor 106,276,198 11,589,801
Windsor Locks 54,094,788 5,899,231
Winsted/Gilbert 14,893,613 1,624,202
Wolcott 57,771,512 6,300,191
Woodbridge 22,352,681 2,437,640
Woodstock 17,728,204 1,933,324
Woodstock Ad 24,557,211 2,678,052
UCONN 4,976,214 542,674
RSD 9 32,393,372 3,532,614
CCI Somers 222,126 24,224
RSD 10 60,669,721 6,616,251

Page 22
Employers
State’s Proportionate Share
Of the Net Pension Liability
Associated with the District
Pension
Expense and Revenue
For State Support
Supervison District $ 11,642,347 $ 1,269,640
NWCTC 1,139,173 124,231
MCTC 844,871 92,136
Norwalk CTC 867,905 94,648
WCSU 1,998,298 217,922
CCSU 4,532,954 494,335
ESCU 1,165,458 127,097
SCSU 5,289,737 576,865
RSD 11 8,378,128 913,665
CCTC 403,480 44,001
Hou CTC 561,423 61,225
Naug CTC 1,588,426 173,224
MCTC 1,178,586 128,529
Ed Connection 8,040,020 876,793
RSD 12 29,670,533 3,235,678
Gateway CTC 3,924,838 428,018
RSD 13 54,213,015 5,912,124
RSD 14 50,374,354 5,493,504
CCI Cheshire 547,089 59,662
Shared Svcs 5,181,337 565,043
CREC 275,419,794 30,035,518
RSD 15 101,424,888 11,060,749
RSD 16 52,617,940 5,738,175
TRCC (Mohegan) 431,891 47,099
Tunxis CTC 1,008,392 109,969
QVCC - -
Odyssey 6,421,050 700,239
CES 40,381,480 4,403,746
ACES 80,955,905 8,828,532
Project Learn 55,012,001 5,999,256
RSD 17 56,582,297 6,170,503
Asnun CTC 848,608 92,544
Project O 957,465 104,415
RSD 18 43,340,432 4,726,430
DCF Mental Health 403,976 44,055
EASTCONN 23,786,211 2,593,972
BSBE 3,488,411 380,424
RSD 19 34,877,636 3,803,532
UCONN Health 2,645,973 288,553
CCI Suffield - -
CCI Niantic 234,658 25,590
Children's CTR 3,359,746 366,392
Bridges Academy 4,356,494 475,091

Page 23
Employers
State’s Proportionate Share
Of the Net Pension Liability
Associated with the District
Pension
Expense and Revenue
For State Support
Common Ground $ 4,296,489 $ 468,548
Explorations 2,879,469 314,016
Intergrated Day 6,718,608 732,688
Isaac 6,432,791 701,519
Jumoke Academy 10,274,555 1,120,477
Side by Side 5,074,633 553,407
Trailblazers Academy 2,894,316 315,636
New Beginnings - -
Elm City CP 5,431,920 592,370
Stamford Academy 2,225,470 242,696
Park City 4,758,766 518,960
AF Bridgeport Academy 3,912,725 426,697
SERC 731,476 79,770
AF Hartford Acad 13,065,491 1,424,839
Brass City 2,907,084 317,028
Path Academy 1,490,032 162,493
Booker T. Washington(BTW) 2,824,942 308,070
Total $ 14,245,051,000 $ 1,553,474,000

Page 24
SCHEDULE C
SUMMARY OF BENEFIT PROVISIONS EVALUATED
Covered Employees
Any teacher, principal, superintendent or supervisor engaged in service of public schools, plus
professional employees at State schools of higher education if they choose to be covered.
Annual Salary
Annual Salary rate for service as a Connecticut teacher during a school year excluding amounts paid for extra
duty assignments, coaching, unused sick time, unused vacation or terminal pay.
Average Annual Salary
Average of Annual Salary received during three years of highest salary.
Credited Service
One month for each month of service as a teacher in Connecticut public schools, maximum 10 months for each
school year. Ten months of credited service constitutes one year of Credited Service. Certain other types of
teaching service, State employment, or war-time military service may be purchased prior to retirement, if the
Member pays one-half the cost.
Normal Retirement
Eligibility - Age 60 with 20 years of Credited Service in Connecticut, or 35 years of Credited Service including
at least 25 years of service in Connecticut.
Benefit - 2% of Average Annual Salary times years of Credited Service (maximum benefit is 75% of Average
Annual Salary)
In addition, amounts derived from the accumulation of 6% contributions made prior to
July 1, 1989 and voluntary contributions by the teacher are payable.
Minimum Benefit: Effective January 1, 1999, Public Act 98-251 provides a minimum monthly retirement
benefit of $1,200 to teachers who retire under the Normal Retirement provisions and who have completed at
least 25 years of full time Connecticut service at retirement.
Early Retirement
Eligibility - 25 years of Credited Service including 20 years of Connecticut service, or age 55 with 20 years of
Credited Service including 15 years of Connecticut service.
Benefit - Reduced normal retirement benefit. The early retirement factors currently in effect are 6% per year
for the first five years by which early retirement precedes the minimum normal retirement age and 4% per year
for the next five years by which early retirement precedes the minimum normal retirement age. Effective
July 1, 1999, the reduction for individuals with 30 or more years of service is 3% for each year by which early
retirement precedes the minimum retirement age.

Page 25
Proratable Retirement
Eligibility - Age 60 with 10 years of Credited Service.
Benefit - 2% less 0.1% for each year less than 20 years of Average Annual Salary times years of Credited
Service in Connecticut, plus 1% of Average Annual Salary times years of additional Credited Service time.
Disability Retirement
Eligibility - 5 years of Credited Service in Connecticut if not incurred in the performance of duty and no service
requirement if incurred in the performance of duty.
Benefit - 2% of Average Annual Salary times Credited Service to date of disability, but not less than 15% of
Average Annual Salary, nor more than 50% of Average Annual Salary. In addition, disability benefit under this
plan (without regard to any cost-of-living adjustments) plus any initial award of Social Security benefits and
workers’ compensation cannot exceed Average Annual Salary.
Termination of Employment
Less than 5 years of Credited Service - Return 6% contributions with interest.
5 or more years of Credited Service - Return 6% contributions with interest and 1% contributions made prior
to July 1, 1989 without interest.
10 or more years of Credited Service - Member is 100% vested in the accrued benefit based on Credited Service
and Average Annual Salary as of the date of termination of covered employment. Benefits are payable at age
60 and early retirement reductions are based on the number of years of service the member would have had if
they had continued to work until age 60.
Member may elect return of all contributions plus interest on 6% contributions in lieu of vested benefit.
Pre-Retirement Death Benefits
A lump sum plus one of the following: survivor’s benefit, return of all contributions with interest, or surviving
spouse’s benefit.
Lump Sum: $1,000 for the first 5 years of Connecticut service plus $200 per year thereafter. Maximum
benefit: $2,000.
Survivor’s Benefit: For active teachers who die while in service, the family maximum benefit payable
to survivors is $1,500 per month. Each minor child is entitled to $300 per month. The surviving spouse’s
benefit is $300 per month if the member has 12 or less years of service. For each additional year of
service, the surviving spouse’s monthly benefit is increased $25, up to a maximum of $600.
Accumulated contributions with interest plus dependent children’s benefits as described in the
“Survivor’s Benefit” paragraph.
Surviving Spouse’s Benefit: An active member who is eligible for immediate retirement and who has
named his or her spouse as primary beneficiary will be covered by a 100% Plan D co-participant option
in the event of his or her death prior to retirement.

Page 26
Benefit Options
Normal form: Partial Refund Option – 75% of total benefit is paid as a life annuity. If 25% of the benefits paid
prior to death do not exceed the Member’s 6% contributions plus interest frozen at the date of the benefit
commencement, the difference is paid to the Member’s beneficiary.
Optional Forms: 5-, 10-, 20-, or 25-year certain and life and 33-1/3%, 50%, 66-2/3%, 75%, or 100% co-
participant annuity (if co-participant dies first, benefit reverts to unreduced amount).
Amounts payable under the optional forms are determined on an actuarially equivalent basis. Actuarial
equivalence is determined using mortality as described in Section F of the report, 8.5% interest, and 2%
compound COLA. A unisex mortality blend of 60% male was used for certain benefit forms, and a blend of
80% male was used for co-participant annuity forms.
Cost-of-Living Allowance
For teachers who retired prior to September 1, 1992, pension benefit adjustments are made in accordance with
increases in the Consumer Price Index, with a minimum of 3% and a maximum of 5% per annum.
For teachers who were members of the Teachers’ Retirement System before July 1, 2007, and retire on or after
September 1, 1992, pension benefit adjustments are made that are consistent with those provided for Social
Security benefits on January 1 of the year granted, with a maximum of 6% per annum. If the return on assets
in the previous year was less than 8.5%, the maximum increase is 1.5%.
For teachers who were members of the Teachers’ Retirement System after July 1, 2007, pension benefit
adjustments are made that are consistent with those provided for Social Security benefits on January 1 of the
year granted, with a maximum of 5% per annum. If the return on assets in the previous year was less than
11.5%, the maximum increase is 3%, and if the return on the assets in the previous year was less than 8.5%, the
maximum increase is 1.0%
Teachers’ Required Contribution
Effective July 1, 1992, each teacher is required to contribute 6% of annual salary for the pension benefit.
State Contribution
The State’s contribution requirement is determined in accordance with Section 10-183z (which reflects Public
Act 79-436 as amended).
Early Retirement Incentive
A local or regional board of education may establish a retirement incentive plan. The plan shall provide for
purchase of additional credited service by a board of education and a member of the system who chooses to
participate in the plan, of additional credited service for such member and for payment by the board of education
of not less than fifty per cent of the entire cost of such total cost. Any such plan shall specify a maximum
number of years to be purchased, not to exceed five. Members must have attained age 50 and be eligible for
retirement with the additional purchased service. The amount of service purchased cannot exceed the lesser of
five years and one-fifth of the member’s credited service.

Page 27
SCHEDULE D
STATEMENT OF ACTUARIAL ASSUMPTIONS AND METHODS
Investment Rate of Return
Assumed annual rate of 8.00% net of investment expenses.
Rates of Annual Salary Increase
Rates of Annual Salary Increase
Assumption
Years of Service
0 6.50%
1 6.50
2 6.25
3 6.25
4 6.25
5 6.25
6 6.25
7 6.25
8 6.25
9 6.25
10 5.50
11 5.50
12 5.00
13 5.00
14 5.00
15 4.75
16 4.50
17 4.25
18 4.00
19 3.75
20 3.50
21+ 3.25

Page 28
Active Member Decrement Rates
a. Table below provides a summary of the assumed rates of service retirement.
Annual Rates of Retirement
Age Unreduced Proratable Reduced
Male Female Male Female Male Female
50 27.5% 27.5% 1.00% 1.00%
55 38.5% 27.5% 4.00% 4.75%
60 22.0% 27.5% 6.0% 5.5%
65 36.3% 32.5% 13.0% 12.5%
70 100.0% 32.5% 30.0% 14.5%
75 100.0% 32.5% 30.0% 18.0%
80 100.0% 100.0% 100.0% 100.0%
b. Table below provides a summary of the assumed rates of mortality while actively employed and disability.
Annual Rates of Death and Disability
Age Pre-Retirement Mortality Disability
Male Female Male Female
20 0.0377% 0.0147% 0.0341% 0.0500%
25 0.0412% 0.0162% 0.0341% 0.0500%
30 0.0404% 0.0205% 0.0341% 0.0410%
35 0.0448% 0.0272% 0.0341% 0.0410%
40 0.0539% 0.0375% 0.0536% 0.0720%
45 0.0818% 0.0622% 0.1219% 0.1200%
50 0.1476% 0.1116% 0.2438% 0.2630%
55 0.2800% 0.1927% 0.5363% 0.4380%
60 0.4557% 0.2914% 0.9604% 0.5000%
64 0.6572% 0.4272%
Page 29
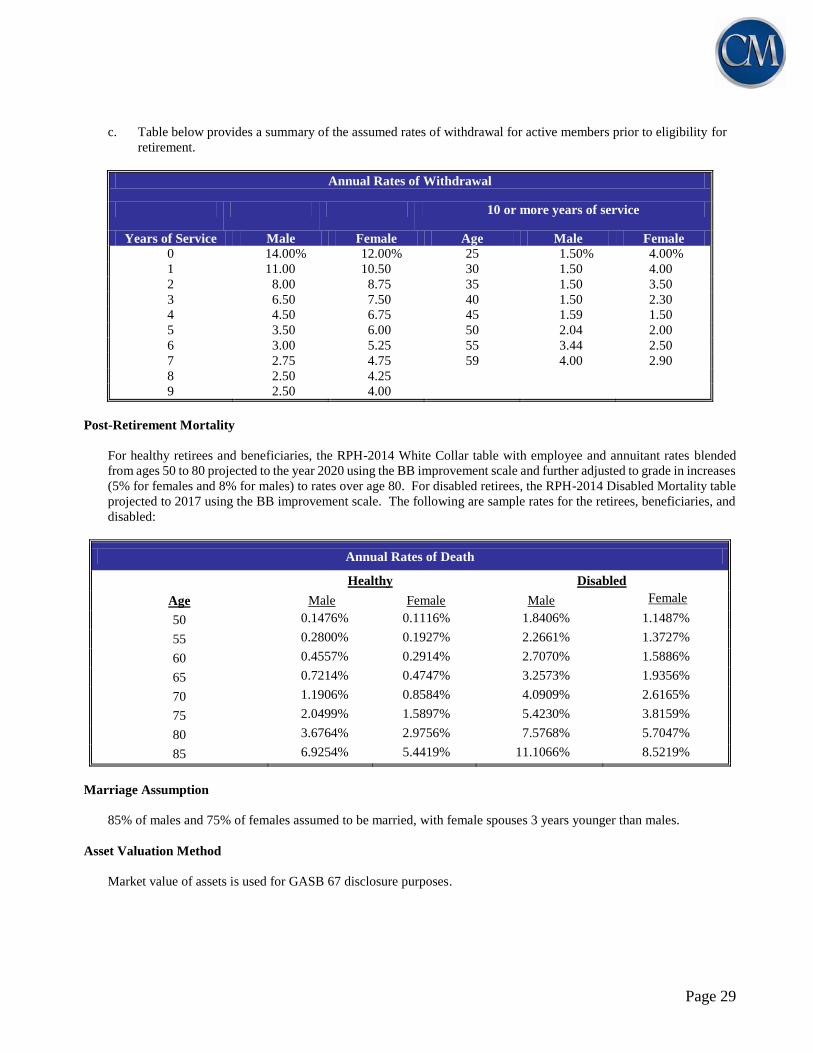
c. Table below provides a summary of the assumed rates of withdrawal for active members prior to eligibility for
retirement.
Annual Rates of Withdrawal
10 or more years of service
Years of Service Male Female Age Male Female
0 14.00% 12.00% 25 1.50% 4.00%
1 11.00 10.50 30 1.50 4.00
2 8.00 8.75 35 1.50 3.50
3 6.50 7.50 40 1.50 2.30
4 4.50 6.75 45 1.59 1.50
5 3.50 6.00 50 2.04 2.00
6 3.00 5.25 55 3.44 2.50
7 2.75 4.75 59 4.00 2.90
8 2.50 4.25
9 2.50 4.00
Post-Retirement Mortality
For healthy retirees and beneficiaries, the RPH-2014 White Collar table with employee and annuitant rates blended
from ages 50 to 80 projected to the year 2020 using the BB improvement scale and further adjusted to grade in increases
(5% for females and 8% for males) to rates over age 80. For disabled retirees, the RPH-2014 Disabled Mortality table
projected to 2017 using the BB improvement scale. The following are sample rates for the retirees, beneficiaries, and
disabled:
Annual Rates of Death
Healthy Disabled
Age Male Female Male Female
50 0.1476% 0.1116% 1.8406% 1.1487%
55 0.2800% 0.1927% 2.2661% 1.3727%
60 0.4557% 0.2914% 2.7070% 1.5886%
65 0.7214% 0.4747% 3.2573% 1.9356%
70 1.1906% 0.8584% 4.0909% 2.6165%
75 2.0499% 1.5897% 5.4230% 3.8159%
80 3.6764% 2.9756% 7.5768% 5.7047%
85 6.9254% 5.4419% 11.1066% 8.5219%
Marriage Assumption
85% of males and 75% of females assumed to be married, with female spouses 3 years younger than males.
Asset Valuation Method
Market value of assets is used for GASB 67 disclosure purposes.

Page 30
Actuarial Cost Method
The Entry Age Normal actuarial cost method allocates the plan’s actuarial present value of future benefits to various
periods based upon service. The portion of the present value of future benefits allocated to years of service prior to the
valuation date is the actuarial accrued liability, and the portion allocated to years following the valuation date is the
present value of future normal costs. The normal cost is determined for each active member as the level percent of
payroll necessary to fully fund the expected benefits to be earned over the career of each individual active member.
The normal cost is partially funded with active member contributions with the remainder funded by employer
contributions.
The unfunded accrued liability is determined by subtracting the actuarial value of assets from the actuarial accrued
liability.
Future Cost-of-living Increases
Members who retired prior to September 1, 1992 are assumed to receive an annual Cost-of-Living Adjustment
(COLA) of 3.0%. Members who retired on or after September 1, 1992 and were hired prior to July 1, 2007 are
assumed to receive an annual Cost-of-Living Adjustment (COLA) of 2.0%. Members who retired on or after
September 1, 1992 and were hired on or after July 1, 2007 are assumed to receive an annual Cost-of-Living
Adjustment (COLA) of 1.75%.
Administrative and Investment Expenses
The investment return assumption represents the expected return net of all administrative and investment expenses.
Payroll Growth Rate
The total annual payroll of active members is assumed to increase at an annual rate of 3.25%. This rate does not
anticipate increases in the number of members.
Changes from Prior Valuation
Since the prior valuation, the Board adopted new assumptions based on the 2015 Experience Study. The changes in
assumptions are summarized below:
Economic Assumptions
1. Reduce the inflation assumption from 3.00% to 2.75%.
2. Reduce the real rate of return assumption from 5.50% to 5.25% which, when combined with the inflation
assumption change results in a decrease in the investment rate of return assumption from 8.50% to 8.00%.
3. Reduce the annual rate of wage increase assumption from 0.75% to 0.50%.
4. Slightly modify the merit portion of the salary scale.
5. Reduce the payroll growth assumption from 3.75% to 3.25%.
Demographic Assumptions
6. Update mortality tables to projected versions of the RPH-2014 mortality tables.
7. Increase normal retirement rates for females at most ages and proratable retirement rates for males at most ages.
Decrease early retirement rates for both males and females.
8. Increase rates of withdrawal.
9. Decrease rates of disability for males.