impact in the voluntary sector - full report
DESCRIPTION
While the value added by voluntary organisations is widely accepted by government and other funders, there has been increased pressure for the voluntary sector to measure the difference they make to individual’s lives and wider society. This report will aim to provide a brief overview of the impact measurement trend and its methods. This report summarises the findings of a 10 week research project undertaken by Nataly Noguer Blue as Summer Scholar at Victoria University of Wellington in partnership with Volunteering New Zealand. The project was supervised by Dr Carolyn Cordery and Dr Karen Smith of Victoria Business School and supported by Claire Teal of Volunteering New Zealand.TRANSCRIPT
1 of 32
Impact in the Voluntary SectorLITERATURE REVIEW
By NATALY NOGUER BLUE

2 of 32
TABLE OF CONTENTS
Introduction
Section A
1.0 What is Impact Measurement?
2.0 Why Measure Impact?
3.0 Challenges in Impact Measurement
3.1 Impact Measurement for Complex Interventions
4.0 Summary of Findings
Section B
1.0 Expected Return Methods
1.1 Benefit-Cost Analysis
1.2 Social Return on Investment
1.3 Monetising Benefits – Valuation Techniques
2.0 Theory-Based Evaluation
2.1 The Logical Framework
2.2 Theory of Change Approaches
2.3 Testing your Programme Theory – Experimental Methods
3.0 Strategy Approaches
3.1 Balanced Scorecard
3.2 Public Value Scorecard
4.0 Outcome Mapping
5.0 Most Significant Change Technique
6.0 Life Story Approach
Conclusion
Bibliography
Glossary
3
4
5
6
7
9
10
12
16
17
20
21
22
23
24
25
26
27
30
3 of 32
INTRODUCTION
Organisations in the voluntary sector are incredibly diverse in size, roles, and mission. As a whole, the sector claims to not only improve the well-being of the marginalised and vulnerable, but also build social capital and strengthen democracy by engaging and empowering communities to
influence government (Arvidson, 2009). While these benefits are widely accepted by government and other funders, there has been increased pressure for the voluntary sector in western democracies to measure their social impact and communicate the difference they make to individuals’ lives and wider society. Drawing on international academic and practitioner literature, this paper will discuss impact measurement, why it has been increasingly used, and the challenges of its application in the voluntary sector. In the context of this discussion, an overview of the current and emerging methods of impact measurement in the voluntary sector will follow. An explanation and example, as well as a discussion of the strengths and limitations for each method will be provided. A glossary of key terminology is provided at the end of the Report.
METHODOLOGY
This literature review is the result of a 10 week research project undertaken by Nataly Noguer Blue as Summer Scholar at Victoria University of Wellington in partnership with Volunteering New Zealand. The project was supervised by Drs Carolyn Cordery and Karen Smith of Victoria Business
School and supported by Claire Teal of Volunteering New Zealand. Database searches were conducted in an iterative manner between November 2012 and February 2013 to find academic articles related to impact measurement. Initially, key search terms were ‘social impact measurement’ and ‘voluntary sector,’ but later the word search included other related terms such as ‘outcomes’, ‘performance’, ‘evaluation’, and ‘assessment.’ Snowballing techniques were used to find relevant literature and uncover a wide-range of methods. Over 70 articles were retrieved from diverse fields of study including: strategic management, public management, evaluation, economics, social accounting, development studies, among others. Furthermore, practitioner and consultant literature including guides, examples and case studies were retrieved using targeted internet searches for each method. A table was used to synthesize information for each method including headings such as strengths, limitations, examples, and useful resources.
MARCH 2013
Impact in the Voluntary SectorLITERATURE REVIEW
By NATALY NOGUER BLUE

4 of 32
Section A: Impact Measurement
1.0 WHAT IS IMPACT MEASUREMENT?
The measurement of performance in organisations can take
place at any of the following stages of the ‘impact chain’
shown in figure 1.
Figure 1: Impact Chain
Adapted from: Arvidson (2009)
In the literature, ‘impact measurement,’ ‘outcome
measurement,’ ‘impact evaluation,’ ‘impact assessment’
and ‘outcome evaluation’ are often used interchangeably.
What these terms all have in common is that they measure or
evaluate programmes beyond the traditional measurement of
efficiency at the output level. While the distinction between
outcome and impact measurement is often blurred, figure
2 offers a useful clarification (Fowler, 1997). As Figure
2 below shows, measuring outcomes involves evaluating
the effectiveness of a programme in producing benefits
for programme participants. These changes can be effects
on participants’ awareness, knowledge, attitudes, skills,
behaviour, and level of functioning (W.K. Kellogg Foundation,
1998). Measuring impact involves assessing the broader, more
long-term fundamental changes in individuals, communities,
and/or society as a result of the intervention.
2.0 WHY MEASURE IMPACT?
Barman (2007) argues that this current shift toward
outcome measurement in the voluntary sector is nothing
new, but that it has been shaped by “specific social,
political, and professional interests and context, both internal
and external to the sector itself” (p. 105). The following
discussion will show that outcome measurement in the
voluntary sector is driven in part by external accountability
requirements, but also the internal stakeholder’s strategic
choices and need for organisational learning.
EXTERNAL FACTORS The trend towards outcome measurement has been influenced
by the greater accountability requirements from government.
The dismantling of the welfare state in the 1980’s and
1990’s in many western economies led to a “mixed economy
of welfare” that transferred the provision of some social
services to the voluntary and private sectors (Barman, 2007,
p. 111). The considerable growth in public sector funding for
the voluntary sector as governments partner in the provision
Point of measurement
Outputs
Outcomes
Impact
Type of measurement
Monitoring
Evaluation
Impact Assessment
What is measured?
Efficiency
Effectiveness
Change
Indicators
Implementation of activities
Use of outputs and sustained
production of benefits
Difference from
original situation
Figure 2: Difference between measuring outputs, outcomes and impact
Source: Fowler (1997) cited in Hailey, James, & Wrigley (2005, p. 7)
INPUTS
OUTPUTS
IMPACTS
ACTIVITIES
OUTCOMES
• The resources that contribute to a programme
or activity, including income, staff, volunteers
and equipment.
• What an organisation does with its inputs
in order to achieve its mission. This could
be training, counselling advice, or material
provision of some sort.
• Countable units that are the direct products
of a programme or organisation’s activities.
They could be classes taught, training courses
delivered, people attending workshops,
qualifications awarded, jobs placed. In
themselves they are not the ultimate objectives
of the organisation.
• The benefits or changes for intended
beneficiaries. They tend to be less tangible
and therefore less countable than outputs.
Outcomes are usually planned and are therefore
set out in an organisation’s objectives.
• All changes resulting from an activity, project
or organisation. It includes intended as well as
unintended effects, negative as well as positive,
and long-term as well as short-term.

5 of 32
of public goods, has meant that professional organisational
practices aimed at achieving mission are increasingly
important for securing government contracts and grants
(Suarez, 2010). For example, the Performance and Results Act
1993 in the United States stated that organisations funded
by the federal government, including voluntary organisations,
have to set programme outcome goals and report on the
extent that these are met (Buckmaster, 2005). Thus, the
size and relationship of the voluntary sector as a government
partner has increased accountability demands for impact
measurement.
The trend towards impact measurement has also been
influenced by increased involvement and demands for
accountability from philanthropic foundations. Philanthropic
foundations are applying business practices and measurement
techniques to be more strategic and maximise the impact
of their investments (Moody, 2008; Suarez, 2010). This
trend is also known as ‘high engagement’ or ‘high-impact’
philanthropy, as donors not only provide financial assistance,
but also seek greater control over results by funding capacity
building and offering consultancy advice for business planning,
strategy, and performance measurement systems (John, 2006;
Ostrander, 2007). In the United States, the Roberts Enterprise
Development Fund (REDF) developed and popularised the
social return on investment methodology for social enterprises
that it funds to use, while the W.K Kellogg Foundation also
encourages attention to outcomes in its evaluation handbook
(Curnan, LaCava, Sharpstee, Lelle, & Reece, 1998; Gair,
2005) . This trend is has also been present in Europe, with
New Philanthropy Capital emerging as a research and advisory
consultancy promoting impact measurement, and a growth
in philanthropic foundations referring to themselves as
‘venture philanthropists’ (John, 2006). Thus, the increased
use of outcome measurement can in part be attributed to the
changing accountability requirements of funders.
INTERNAL FACTORSWhile many scholars deterministically attribute the rise of
outcome measurement to the above external factors, it is
important to remember that voluntary organisation managers
are agents that can respond to their environment with strategic
manoeuvrability. Due to the diversity of approaches and
significant amount of discretion and judgement involved in
outcome measurement, Lyon and Arvidson (2009) in the
United Kingdom have found it to be a ‘socially entrepreneurial
process’ through which voluntary organisations can inverse
power relations, create opportunities to influence others
and secure scarce funding. In the United States, MacIndoe
& Barman (2012) found that while funders are the main
determinants for resource allocation for impact measurement,
voluntary organisations only substantively implement outcome
measurement when internal stakeholders including staff and
the board of directors support its use. Outcome measurement
has gained the support of internal stakeholders as a strategic
management tool to clarify outcomes and collect meaningful
information to foster organisational learning and motivate
staff to work towards a unified mission (Carman & Fredericks,
2008; Ellis, 2009).1 Thus, the trend towards increased
outcome measurement is not only driven by external pressures
for accountability, but by internal stakeholders who see its
great potential as a tool to improve their performance and gain
confidence in an increasingly competitive and donor-controlled
environment.
3.0 CHALLENGES IN IMPACT MEASUREMENT
While there has been an increase in the use of outcome
measurement, it has sparked some resistance
by staff who perceive it to be an inappropriate
imposition from funders and donors. Many studies in the
United Kingdom and United States find the leading reason
for measuring outcomes is to satisfy donor requirements
(Lyon & Arvidson, 2009; Ógáin, Lumley, & Pritchard, 2012;
United Way of America, 2000 cited in Ebrahim, 2005). In
the United Kingdom, donor-driven evaluation was found to
be perceived as “meaningless and uninteresting at best, or
inappropriate and damaging at worst” (Arvidson, 2009, 12).
In United States, the data collection, analysis and reporting
of outcomes to donors for the sole purpose of proving value
to others is seen as an unnecessary, bureaucratic drain
on resources and a distraction to already busy and hard-
working staff and volunteers (Carman & Fredericks, 2008).
Furthermore, outcome measurement has been seen as part of
the trend towards increased formalisation and ‘scientification’
of voluntary sector organisational practices (Hwang & Powell,
2009). This has been deemed by some as incompatible with
the innovative, personal and flexible approach of a mission-
driven and intrinsically motivated workforce (Arvidson, 2009;
Cnaan & Kang, 2010; Hwang & Powell, 2009). Thus, outcome
measurement has faced resistance from staff who see it as an
unnecessary and harmful practice.
Measuring impact and effectiveness in the voluntary sector
is also problematic due to its distinctive characteristics.
Unlike the private sector’s clearly defined and measureable
goal of maximising shareholder return, profitability in the
voluntary sector is only a means to a more multidimensional,
amorphous and intangible mission (Forbes, 1998; Rogers,
2008; Speckbacher, 2003). Since the services and benefits
produced by the voluntary sector are not driven by a market
logic, the value added to individuals, communities and broader
society are more difficult to quantify in dollar terms (Cnaan
& Kang, 2010). Furthermore, voluntary organisations have
no single, clearly defined, and homogeneous primary interest
group, and instead aim to please multiple stakeholders with
heterogeneous interests, including government, funders, staff,
volunteers, and clients (Cnaan & Kang, 2010; MacIndoe &
Barman, 2012; Mistry, 2007). Thus, as a sector working
towards the public good outside a market mechanism,
measuring impact and assessing effectiveness is particularly
challenging.
1 For example, the New Zealand Community Law Centre commissioned a report from NZIER to evaluate its social impact, using it primarily as a promotional tool to secure funding in uncertain economic times (New Zealand Institute of Economic Research., 2012)

6 of 32
3.1 IMPACT MEASUREMENT FOR COMPLEX INTERVENTIONS
ISSUE OF ATTRIBUTION Measuring and attributing impact of a voluntary organisation’s
intervention is particularly problematic for complex
interventions working in open systems. Ebrahim and
Rangan (2010) argue that while attribution of outcomes to
organisational outputs may be possible for simple, discrete
interventions like an immunisation programme, it is less
appropriate for interventions working towards more complex
goals such as economic development or institutional change.
In complex interventions of this nature, the success or failure
of a voluntary organisation’s intervention cannot be isolated
from other influences beyond its control (Earl, Carden, &
Smutylo, 2001). As Figure 3 shows, while an organisation
has high relative influence over the inputs, processes and
outputs of an intervention, successful outcomes and impacts
are more dependent upon other actors and environmental
factors creating enabling conditions for intended beneficiaries
(Earl et al., 2001). Thus, impact measurement is particularly
problematic for complex interventions due to the inherent need
to isolate and measure an intervention’s impact while ignoring
other influences.
Figure 3: Relative Influence along Impact Chain
Adapted from: Earl et al. (2001)
RESOURCES NEEDEDOne of the barriers to impact measurement is the amount
of resources required to reliably collect and analyse data
to provide meaningful information. Both quantitative and
qualitative data collection and analysis in complex situations
not only require expertise, but time and money beyond the
capacity of many voluntary organisations (Cnaan & Kang,
2010; Ógáin et al., 2012). Thus, it is important that funding
for outcome measurement be provided by donors if it is a
requirement, or that internal stakeholders are allowed to
choose methods appropriate for their skill-level and resource
availability (Ebrahim, 2005; Pidd, 2005)
NEED FOR BALANCING ACCOUNTABILITY AND LEARNING Different types of evaluation methods are more accountability-
oriented while others are more conducive to learning. Power
(1997) broadly categorises these methods into accountability-
oriented Style A and learning-oriented Style B (see figure 4).
Figure 4: Types of Evaluation
Source: Power( 1997) cited in Gasper (2000, p. 20)
Power (1997) argues that there has been an ‘audit explosion’
of Style A. However, the use of impact measurement for
the narrow purpose of proving results is suitable for simple
interventions, but it can obstruct learning and long-term
mission achievement in complex interventions (Ebrahim,
2005; Pidd, 2005). Performance measurement systems are
based on the model of single-loop learning and cybernetic
control as shown in figure 5 (Pidd, 2005). Management
receives feedback from the outputs and outcome performance
indicators, and then if necessary, implements corrective action
at the input and process level to achieve output and outcome
targets (Buckmaster, 2005).
Figure 5: Cybernetic Model of Control
Source: Pidd (2005, p. 488)
The cybernetic model of control assumes that the end
objective is unambiguous, that outputs and outputs can
be usefully quantified and measured, that the effects of an
interventions is fully known, and that activities are repetitive,
so that single- loop learning will occur (Pidd, 2005). Applying
this model of control in complex development situations where
these assumptions do not hold can hinder learning and mission
achievement by diverting focus towards achieving quantitative,
INPUTS
HIGH
LOW
ORGANISATIONAL INFLUENCE
OUTPUTS IMPACTSACTIVITIES OUTCOMES
Style A
Quantitative
Single Measure
External Agencies
Long Distance Methods
Low Trust
Discipline
Ex Post Control
Private Exports
Style B
Qualitative
Multiple Measures
Internal Agencies
Local Methods
High Trust
Autonomy
Real Time Control
Public Dialogue
Management
Transformation
process
Feedback
Inputs (resources)
Outputs & outcomes
7 of 32
short-term outcome indicators, instead of the qualitative,
more ambiguous long-term objectives (Pidd, 2005). Thus,
outcome measurement used for upwards accountability and
top-down control can have perverse unintended consequences
that hinder learning when applied to complex situations in the
voluntary sector.
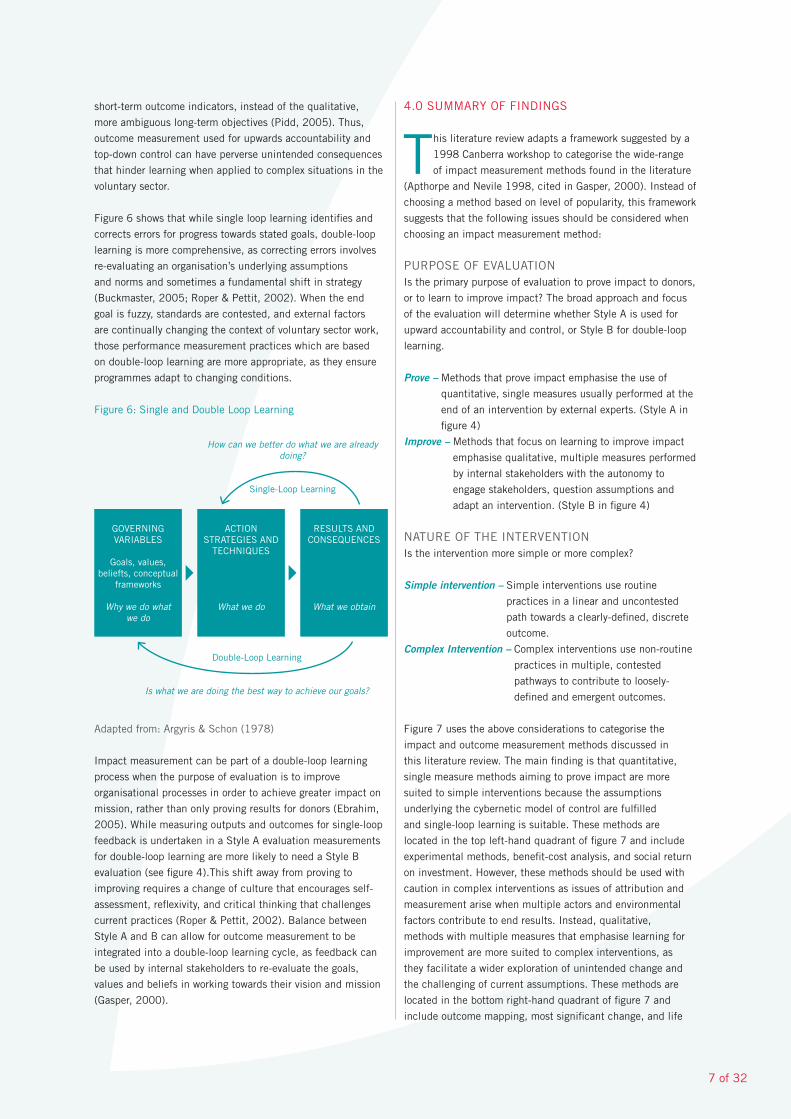
Figure 6 shows that while single loop learning identifies and
corrects errors for progress towards stated goals, double-loop
learning is more comprehensive, as correcting errors involves
re-evaluating an organisation’s underlying assumptions
and norms and sometimes a fundamental shift in strategy
(Buckmaster, 2005; Roper & Pettit, 2002). When the end
goal is fuzzy, standards are contested, and external factors
are continually changing the context of voluntary sector work,
those performance measurement practices which are based
on double-loop learning are more appropriate, as they ensure
programmes adapt to changing conditions.
Figure 6: Single and Double Loop Learning
Adapted from: Argyris & Schon (1978)
Impact measurement can be part of a double-loop learning
process when the purpose of evaluation is to improve
organisational processes in order to achieve greater impact on
mission, rather than only proving results for donors (Ebrahim,
2005). While measuring outputs and outcomes for single-loop
feedback is undertaken in a Style A evaluation measurements
for double-loop learning are more likely to need a Style B
evaluation (see figure 4).This shift away from proving to
improving requires a change of culture that encourages self-
assessment, reflexivity, and critical thinking that challenges
current practices (Roper & Pettit, 2002). Balance between
Style A and B can allow for outcome measurement to be
integrated into a double-loop learning cycle, as feedback can
be used by internal stakeholders to re-evaluate the goals,
values and beliefs in working towards their vision and mission
(Gasper, 2000).
4.0 SUMMARY OF FINDINGS
This literature review adapts a framework suggested by a
1998 Canberra workshop to categorise the wide-range
of impact measurement methods found in the literature
(Apthorpe and Nevile 1998, cited in Gasper, 2000). Instead of
choosing a method based on level of popularity, this framework
suggests that the following issues should be considered when
choosing an impact measurement method:
PURPOSE OF EVALUATIONIs the primary purpose of evaluation to prove impact to donors,
or to learn to improve impact? The broad approach and focus
of the evaluation will determine whether Style A is used for
upward accountability and control, or Style B for double-loop
learning.
Prove – Methods that prove impact emphasise the use of
quantitative, single measures usually performed at the
end of an intervention by external experts. (Style A in
figure 4)
Improve – Methods that focus on learning to improve impact
emphasise qualitative, multiple measures performed
by internal stakeholders with the autonomy to
engage stakeholders, question assumptions and
adapt an intervention. (Style B in figure 4)
NATURE OF THE INTERVENTIONIs the intervention more simple or more complex?
Simple intervention – Simple interventions use routine
practices in a linear and uncontested
path towards a clearly-defined, discrete
outcome.
Complex Intervention – Complex interventions use non-routine
practices in multiple, contested
pathways to contribute to loosely-
defined and emergent outcomes.
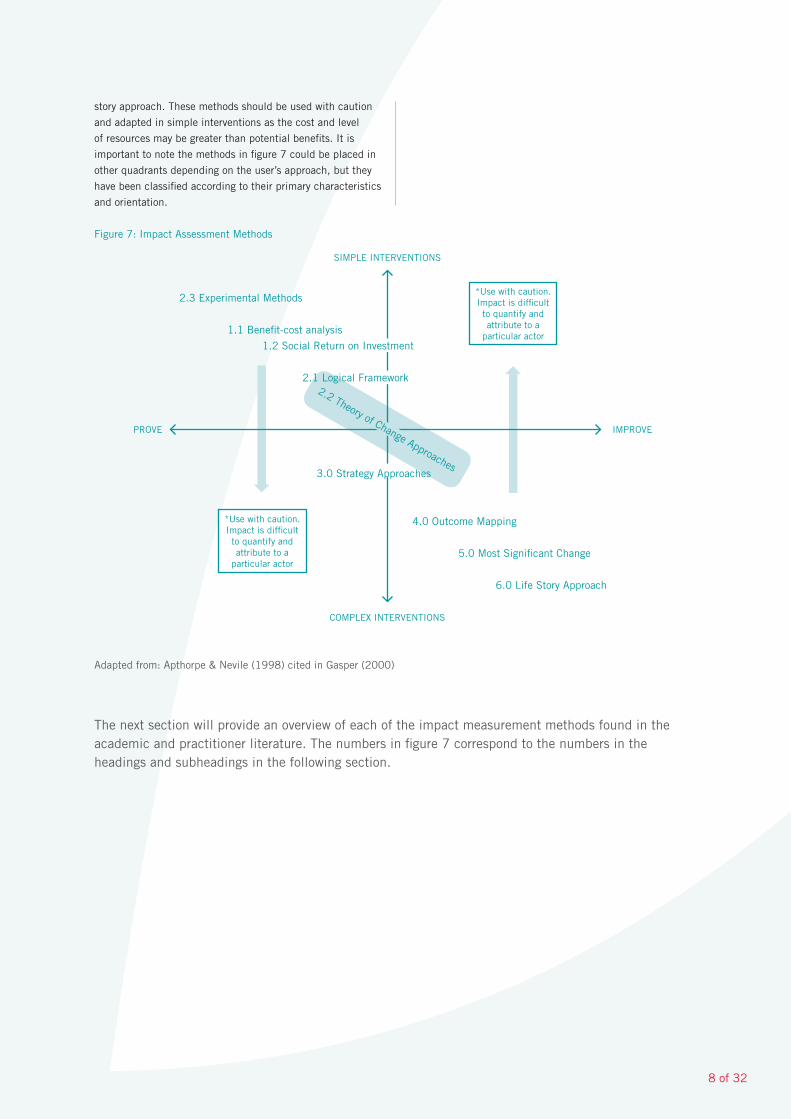
Figure 7 uses the above considerations to categorise the
impact and outcome measurement methods discussed in
this literature review. The main finding is that quantitative,
single measure methods aiming to prove impact are more
suited to simple interventions because the assumptions
underlying the cybernetic model of control are fulfilled
and single-loop learning is suitable. These methods are
located in the top left-hand quadrant of figure 7 and include
experimental methods, benefit-cost analysis, and social return
on investment. However, these methods should be used with
caution in complex interventions as issues of attribution and
measurement arise when multiple actors and environmental
factors contribute to end results. Instead, qualitative,
methods with multiple measures that emphasise learning for
improvement are more suited to complex interventions, as
they facilitate a wider exploration of unintended change and
the challenging of current assumptions. These methods are
located in the bottom right-hand quadrant of figure 7 and
include outcome mapping, most significant change, and life
RESULTS AND CONSEQUENCES
What we obtain
ACTION STRATEGIES AND
TECHNIQUES
What we do
GOVERNING VARIABLES
Goals, values, beliefts, conceptual
frameworks
Why we do what we do
How can we better do what we are already doing?
Single-Loop Learning
Double-Loop Learning
Is what we are doing the best way to achieve our goals?
8 of 32
2.2 Theory of Change Approaches
story approach. These methods should be used with caution
and adapted in simple interventions as the cost and level
of resources may be greater than potential benefits. It is
important to note the methods in figure 7 could be placed in
other quadrants depending on the user’s approach, but they
have been classified according to their primary characteristics
and orientation.
Figure 7: Impact Assessment Methods
The next section will provide an overview of each of the impact measurement methods found in the academic and practitioner literature. The numbers in figure 7 correspond to the numbers in the headings and subheadings in the following section.
Adapted from: Apthorpe & Nevile (1998) cited in Gasper (2000)
*Use with caution. Impact is difficult to quantify and attribute to a
particular actor
*Use with caution. Impact is difficult to quantify and attribute to a
particular actor
2.3 Experimental Methods
1.1 Benefit-cost analysis
SIMPLE INTERVENTIONS
COMPLEX INTERVENTIONS
PROVE IMPROVE
2.2 Theory of Change Approaches
2.1 Logical Framework
3.0 Strategy Approaches
4.0 Outcome Mapping
5.0 Most Significant Change
6.0 Life Story Approach
1.2 Social Return on Investment

9 of 32
Section B: Impact Measurement Methods
1.0 EXPECTED RETURN METHODS
Expected return methods are quantitative, single measure
methods that compare the impact of a voluntary
organisation to the costs or investments involved in
delivering that impact. Expected return methods measure
impact in monetary form, and are influenced by concepts
of the business world, particularly accounting, finance and
economics.
1.1 BENEFIT-COST ANALYSIS
Economists and government commonly analyse costs and
outcomes of alternative interventions to aid decision-
making. Figure 8 below shows the main types of cost and
outcome analysis from least to most comprehensive in terms
of the outcome of the analysis and the information required
(Karoly, 2008).
Type of Analysis
Cost
Cost-effectiveness
Cost-savings
Benefit-cost
Outcome of Analysis
Cost of Program
Measure of cost per unit change in a specific
outcome, value for one impact at a time
Measure of net savings to government,
inclusive of all impacts1
Measure ration of government savings to costs
Measure of internal rate of return to government
Measure of net benefit to society,
inclusive of all impacts1
Measure of ratio of benefits to costs
Measure of rate of return to society
Information Requirement
Comprehensive measure of program costs
Comprehensive measure of program costs
Measures of program impacts in natural units
Comprehensive measure of program costs,
specific to government sector
Measures of program impacts at each
point in time in natural units
“Shadow prices” to value all outcomes in
dollars, specific to government sector
Comprehensive measure of program costs
at each point in time, in aggregate and
specific to various stakeholders
Measures of program impacts at each
point in time in natural units
“Shadow prices” to value all outcomes
in dollars, in aggregate and specific
to various stakeholders
1 When costs and/or benefits accrue over multiple time periods, the dollare streams are discounted to reflect the time value of money. Thus, the relevant outcome is net present-value savings or benefit.
Source: Karoly (2008)
Figure 8: Types of Cost and Outcome Analysis

10 of 32
The Benefit-Cost Analysis (BCA) is the most comprehensive
economic technique in terms of outcome and information
requirements, as it involves quantifying all the costs and
benefits associated with a given intervention to determine
the net benefit to society (Arvidson, Lyon, McKay, & Moro,
2010; Tuan, 2008). A BCA requires all benefits and costs
to be expressed in monetary form, and uses financial proxies
to estimate the value of nonmarket, intangible goods whose
price is not determined by the market (Karoly, 2008; Tuan,
2008). It is usually performed to justify the existence of an
intervention, or to aid decision-making by allowing comparison
between alternatives (Tuan, 2008). The end result of a BCA
can be the net present value (benefit minus cost) or a benefit-
cost ratio (net present value of benefit/net present value of
cost). For example, a $3.30:1 benefit-cost ratio means that for
every $1 of costs, an organisation yields $3.30 of benefits to
society. If the ratio is over 1, it means that benefits are greater
than costs.
EXAMPLE: COST-BENEFIT ANALYSIS FOR THE NEW ZEALAND COMMUNITY LAW CENTRES O AOTEAROA
The New Zealand Community Law Centres o Aotearoa
(NZCLC) commissioned a report from The New Zealand
Institute of Economic Research (NZIER) to measure its
social impact in economic terms, using the report primarily
as a promotional tool to secure funding in uncertain
economic times (New Zealand Institute of Economic
Research, 2012). Figure 9 shows the benefits and costs
that were considered, and how they were analysed. Due
to the difficulties involved in quantifying the benefits of
information, education and law reform services provided
by community law centres, the report only monetised the
benefits of the casework function and the costs of total
public funding.
Figure 9: NZIER Cost-Benefit Framework
Source: New Zealand Institute of Economic Research (2012)
NZIER valued the benefits of the casework based on the cost
avoided to government to supply a comparable low cost service
for community law centres clients, which they deemed to be
75% of the average cost of a PCI criminal case1 using the
Public Defender Service (legal aid). Using the calculation
below, they conservatively estimated that for every $1 of public
funding, community law centres delivered $3.30 of benefits.
The calculations were as follows:
While a BCA is meant to be comprehensive in its analysis
of benefits and costs, the complexity of valuing intangible
outcomes limits is potential in voluntary sector valuation.
Due to the fact that NZIER only valued the casework function
of community law centres in terms of the avoided cost to
government, the end ratio reflects more a cost-savings analysis
than a benefits-cost analysis.
1.2 SOCIAL RETURN ON INVESTMENT
Social Return on Investment (SROI) is a methodology that
draws from social accounting and benefit-cost analysis
to measure social impact. It was originally invented by
the Roberts Enterprise Development Foundation (REDF) to
assess the return on its social enterprise investments (Gair,
2005). It received a lot of attention and sparked much debate
for its quite complex six-step methodology that systematically
blends both the economic and social values of an organisation
(Arvidson et al., 2010; Gair, 2005; Polonsky & Grau, 2011).
The REDF Social Return on Investment methodology consists
of six steps.
1. Enterprise Value: Discounted cash flow analysis to derive
the economic value
2. Social Purpose Value: Discounted cash flow analysis of
socio economic results. Savings to the taxpayer + new tax
revenues – social costs = social value
3. Blended Value: Enterprise Value + Social Purpose Value -
long-term debt
4. Enterprise Index of Return: Enterprise Value ÷financial
investment in the organisation to date.
5. Social Purpose Index of Return: Social Purpose Value ÷
financial investment in the organisation to date.
6. Blended Index of Return: Blended Value ÷ financial invest-
ment to date. (Mook, Quarter, & Richmond, 2007)
1 PCI Criminal case is the least costly criminal case involving a District or High Court proceeding (other than a jury trial or preliminary hearing of an offence). It is less costly than a PCII Criminal case that involve jury trials, and a maximum penalty of more than 10 years imprisonment.
Cost/Benefit
BenefitsCasework
Information
Education
Law reform
CostsTotal public funding
Analysis Type
Quantitative
Qualitative
Qualitative
Qualitative
Quantitative
Benefits
Costs
$36.23m
$10.97m= $3.3
Avoided cost = 49,243 clients x 75% of PDS PCI criminal case average cost ($736)
Government Funding ($6.57m) + Special Fund ($4.4m)=
=
11 of 32
The REDF methodology has been modified by the SROI
Network and it has gained momentum in the UK. The SROI
Network has made impact measurement more accessible for
voluntary organisations because it developed a complete, step-
by-step guide that includes stakeholder and programme theory
analysis as part of the SROI process (see see theory-based
evaluation in section 2). They advocate the below 6 stages for
the implementation of SROI.
1. Establishing scope and identifying key stakeholders. It is important to have clear boundaries about what your
SROI analysis will cover, who will be involved in the process
and how.
2. Mapping outcomes. Through engaging with your
stakeholders you will develop an impact map, or theory
of change, which shows the relationship between inputs,
outputs and outcomes.
3. Evidencing outcomes and giving them a value. This stage
involves finding data to show whether outcomes have
happened and then valuing them.
4. Establishing impact. Having collected evidence on
outcomes and monetised them, those aspects of change
that would have happened anyway or are a result of other
factors are eliminated from consideration. These include
deadweight, displacement, attribution and drop-off.
5. Calculating the SROI. This stage involves dividing the net
present value of the impact divided by total investment.
This is also where the sensitivity of the results can be tested
by changing assumptions.
6. Reporting, using and embedding. Easily forgotten, this vital
last step involves sharing findings with stakeholders and
responding to them, embedding good outcomes processes
and verification of the report.
(Nicholls, Lawlor, Neitzert, & Goodspeed, 2012).
EXAMPLE: THE CRAFT CAFE: CREATIVE SOLUTIONS TO ISOLATION AND LONELINESSThe Craft Cafe in Scotland is a programme that aims to
provide aging seniors the opportunity to learn new skills,
renew social networks and reconnect with communities
through artistic expression. Their SROI report is
comprehensive, including narrative about the programme’s
purpose and how they aim to achieve it, as well as a fully
worked through Impact Map that results in an overall
£8.27: £1 benefit-cost ratio. The Social Value Lab2,
evaluated the Craft Cafe’s impact, reflecting how the SROI
methodology is often used by contracted third-parties with
social science expertise. The full SROI Report can be found
in following url:
www.socialimpactscotland.org.uk/media/3215/Craft%20
Cafe%20SROI%20FINAL%20REVISED%20v2.pdf
2 The Social Value Lab is UK independant ’think-do’ tank that provides social research services, social enterprise strategy, social sector evaluation and social impact assessment.
COMPARING BCA AND SROI According to Arvidson et al. (2010), BCA and SROI differ more
in style than in true substance. They both involve monetising
and comparing all costs and benefits to deliver a simple, easy
to understand ratio. The differences in approach are due to the
fact that BCA is well-established tool often used by economists
and government for decision-making, which SROI is more
recent approach that focuses on voluntary organisations
(Arvidson et al., 2010). Given the focus on the voluntary
sector, SROI emphasises the integration of stakeholders into
the analysis, and the use of results for learning (Arvidson et
al., 2010). While BCAs are traditionally made by external
agents for comparison and aiding decision-making, an SROI’s
results are not comparable and should be used for internal
organisational learning (Arvidson et al., 2010). However,
Arvidson et al. (2010) explain that these differences are not
inherent in the methods and thus, the following strengths and
limitations apply to both.
STRENGTHS■ The end ratio expressed in dollars is simple to understand
and communicate to a wide range of audiences, with
great potential to influence policy or further funding from
government or donors (Arvidson et al., 2010).■ Multiple stakeholders are integrated into the assessment
of social impact in order to account for the full picture of
impact across the most significant stakeholders (Polonsky,
Michael, and Grau, 2011)■ Involves a full sophisticated economic analysis that
considers many of the issues involved with crediting impact
to a complex intervention, including deadweight, attribution
and drop-off. ■ There are many established valuation techniques that can be
used for creating financial proxies (Arvidson et al., 2010) ■ Goes beyond a short-term evaluation of efficiency and looks
at the more long-term picture of impact (Polonsky & Grau,
2011).
LIMITATIONS: ■ Focus on proving impact at the expense of understanding
process for learning. Much of the emphasis and effort in the
SROI process is finding an overall SROI ratio (Arvidson et al.,
2010). The ratio prioritises quantifiable results over useful
qualitative information for learning such as what worked,
what didn’t, what to replicate or what to do better (Ellis,
n.d.). It has the potential to divert attention away from less
quantifiable goal and overall mission. (Ellis, n.d.). ■ SROI underestimates the social impact of organisations
because it values the benefits not by their intrinsic value
to society, but by the cost savings to the public sector
(Arvidson et al., 2010; Gair, 2005; Polonsky & Grau, 2011).
Assessing the monetary value of intangible of outcomes such
as increased life expectancy, or increased self-confidence
engenders the “most difficulty and controversy” (Arvidson
et al., 2010a, p. 5). Karoly (2008) notes from the literature
that even if valuation techniques are well-established,
application is inconsistent and the more intangible outcomes
are usually not monetised.
12 of 32
■ The high level of resources, staff time, technical ability, and
sophistication of data collection and analysis information
systems that are required for a full-fledged BCA or SROI for
complex interventions is often beyond the reach of smaller
NGOS (Arvidson et al., 2010; Gair, 2005). While the
process can be simplified and adapted for use by internal
staff members, it can lead to questionable results and it is
unclear how it is better than methods that do not attempt to
monetise (Ellis, n.d.-a, p. 3). ■ The quantitative nature of the method can potentially mask
the high amount of judgement and discretion involved in calculating the end ratio. A BCA or SROI ratio including
intangible outcomes must be interpreted as a potentially
biased, socially constructed figure with very limited
comparability (Arvidson et al., 2010). While stakeholder
engagement in SROI tries to eliminate this risk, what is
included/excluded in the analysis is shaped by asymmetries
of power, different assumptions and preferences, as well as
resource and data availability (Arvidson et al., 2010).
1.3 MONETISING BENEFITS – VALUATION TECHNIQUES
Valuation as an economic field of study has a wide
range of techniques that have been used to assess the
monetary value of nonmarket cultural and environmental
goods and their externalities (Birol, Karousakis, & Koundouri,
2006; Throsby, 2003). While price is often used as a proxy
for value in markets, social services and their outcomes are
also beyond the reach of the market (Cnaan & Kang, 2010).
Cnaan and Kang (2010) argue that these valuation techniques
could potentially be used to assess the monetary value of
social services and their outcomes for their inclusion in a SROI
or benefit-cost analysis. These valuation techniques can be
categorised into stated preference and revealed preference
methods, which find the value of nonmarket goods by either
creating a hypothetical market for the nonmarket good, or
using a proxy market in which the nonmarket good is implicitly
traded.
STATED PREFERENCE METHODSStated preference methods find the value of nonmarket
goods by surveying individual preferences and creating a
hypothetical market for the good (Birol et al., 2006; Cnaan
& Kang, 2010). A strength of this type of method is that it
can measure the total economic value of a good, meaning it
includes the value people place it on its use, as well as the
value people place on its existence for future use (bequest
value), or the use of others (altruistic value) (Venkatachalam,
2004). Furthermore, unlike revealed preference methods,
they allow for measurement of value without the need for
observable behaviour or data (CGER, 1997). However, stated
preference methods are considered less reliable than revealed
preference methods as there are many methodological issues
that can skew results, including characteristics and size of
sample used, wording of questions, information provided, and
how the survey is conducted, among other sources of errors
(Cnaan & Kang, 2010; Venkatachalam, 2004). Furthermore,
the expertise and resources needed for rigorous survey
development and testing to ensure reliable results is beyond
the capacity of most voluntary organisations (Cnaan & Kang,
2010; Venkatachalam, 2004; Navrud, 2000).
CONTINGENT VALUATION METHODThe Contingent Valuation Method (CVM) is a survey-based,
stated preference valuation technique that aims to determine
the total value of a nonmarket good by asking individuals for
their valuations in monetary terms (Klose, 1999). A contingent
valuation typically describes a policy or programme and its
likely outcomes, and then asks respondents how much they
would be willing to accept funds for a negative outcome,
or their willingness to pay for a positive outcome (Karoly,
2008, p. 10). The collected responses effectively create a
hypothetical market, and the average results can be used to
determine the value of the nonmarket good (Cnaan & Kang,
2010). Socioeconomic characteristics of the respondents
(age, race, sex, income, education, marital status) as well as
information about their attitudes toward the nonmarket good
in question are also collected to find possibly explanatory
variables (Cowling, 2006). Cnaan and Kang (2010) found
that contingent valuations have been used to value mental
health services as well as preschool education for handicapped
children. They argue that organisations could poll clients to
find the value they place on their services and outcomes.
The contingent valuation method is subject to the strengths
and limitations of stated preference methods. For further
discussion of the methodological issues specific to contingent
valuation and recent developments that address these issues
please see Carson (2000) and Venkatachalam (2004).
CHOICE EXPERIMENT METHODThe Choice Experiment Method (CEM) is based on Lancaster’s
characteristics theory of value, which states that a good’s
value reflects its characteristics and their respective levels
(Birol et al., 2006). Like CVM, the Choice Experiment Method
is a valuation technique based on stated preferences and
hypothetical scenarios. However, CEM is a structured data
generation method where respondents are asked in multiple
questions to choose between alternative sets of characteristics
(one of which is price), allowing for the value of characteristics
to be inferred from the tradeoffs made throughout the survey
(Cnaan & Kang, 2010; Hanley, Wright, & Adamowicz, 1998).
CEM is used frequently in marketing to ascertain consumers’
preferences for certain goods over others and the prices they
are prepared to pay for those goods. While Cnaan and Kang
(2010) did not find an example of its application in social
services, they argue that its feasibility is clear. For example,
national voluntary associations could commission choice
experiments that study the value people place on outcomes
such as social inclusion and gender equality, among others
(Cnaan & Kang, 2010). Furthermore, Cnaan and Kang (2010)
argue that social service organisations could carry out smaller
experiments to find the value that clients place on different
sets of service options.
13 of 32
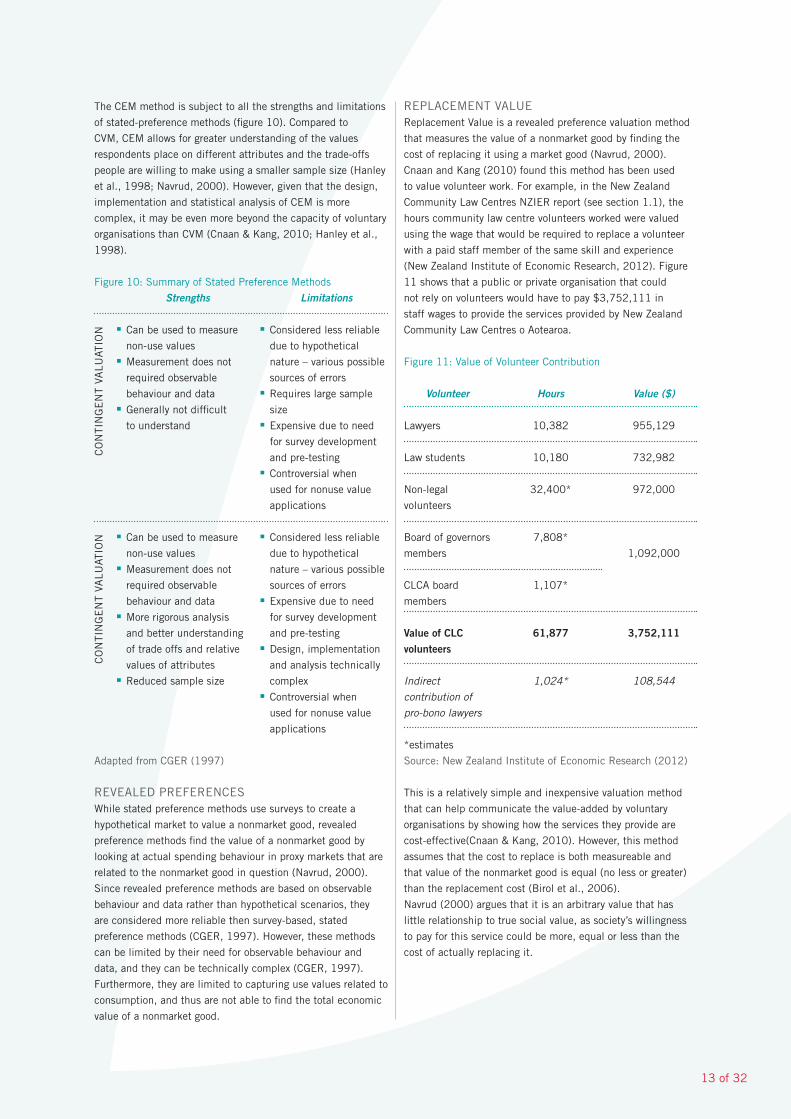
The CEM method is subject to all the strengths and limitations
of stated-preference methods (figure 10). Compared to
CVM, CEM allows for greater understanding of the values
respondents place on different attributes and the trade-offs
people are willing to make using a smaller sample size (Hanley
et al., 1998; Navrud, 2000). However, given that the design,
implementation and statistical analysis of CEM is more
complex, it may be even more beyond the capacity of voluntary
organisations than CVM (Cnaan & Kang, 2010; Hanley et al.,
1998).
Figure 10: Summary of Stated Preference Methods
Adapted from CGER (1997)
REVEALED PREFERENCESWhile stated preference methods use surveys to create a
hypothetical market to value a nonmarket good, revealed
preference methods find the value of a nonmarket good by
looking at actual spending behaviour in proxy markets that are
related to the nonmarket good in question (Navrud, 2000).
Since revealed preference methods are based on observable
behaviour and data rather than hypothetical scenarios, they
are considered more reliable then survey-based, stated
preference methods (CGER, 1997). However, these methods
can be limited by their need for observable behaviour and
data, and they can be technically complex (CGER, 1997).
Furthermore, they are limited to capturing use values related to
consumption, and thus are not able to find the total economic
value of a nonmarket good.
REPLACEMENT VALUEReplacement Value is a revealed preference valuation method
that measures the value of a nonmarket good by finding the
cost of replacing it using a market good (Navrud, 2000).
Cnaan and Kang (2010) found this method has been used
to value volunteer work. For example, in the New Zealand
Community Law Centres NZIER report (see section 1.1), the
hours community law centre volunteers worked were valued
using the wage that would be required to replace a volunteer
with a paid staff member of the same skill and experience
(New Zealand Institute of Economic Research, 2012). Figure
11 shows that a public or private organisation that could
not rely on volunteers would have to pay $3,752,111 in
staff wages to provide the services provided by New Zealand
Community Law Centres o Aotearoa.
Figure 11: Value of Volunteer Contribution
*estimates
Source: New Zealand Institute of Economic Research (2012)
This is a relatively simple and inexpensive valuation method
that can help communicate the value-added by voluntary
organisations by showing how the services they provide are
cost-effective(Cnaan & Kang, 2010). However, this method
assumes that the cost to replace is both measureable and
that value of the nonmarket good is equal (no less or greater)
than the replacement cost (Birol et al., 2006).
Navrud (2000) argues that it is an arbitrary value that has
little relationship to true social value, as society’s willingness
to pay for this service could be more, equal or less than the
cost of actually replacing it.
■ Can be used to measure
non-use values ■ Measurement does not
required observable
behaviour and data■ Generally not difficult
to understand
■ Considered less reliable
due to hypothetical
nature – various possible
sources of errors■ Requires large sample
size■ Expensive due to need
for survey development
and pre-testing■ Controversial when
used for nonuse value
applications
■ Can be used to measure
non-use values■ Measurement does not
required observable
behaviour and data ■ More rigorous analysis
and better understanding
of trade offs and relative
values of attributes■ Reduced sample size
■ Considered less reliable
due to hypothetical
nature – various possible
sources of errors■ Expensive due to need
for survey development
and pre-testing ■ Design, implementation
and analysis technically
complex■ Controversial when
used for nonuse value
applications
CO
NTI
NG
EN
T VA
LUAT
ION
CO
NTI
NG
EN
T VA
LUAT
ION
Strengths Limitations
Volunteer
Lawyers
Law students
Non-legal
volunteers
Board of governors
members
CLCA board
members
Value of CLC volunteers
Indirect
contribution of
pro-bono lawyers
Hours
10,382
10,180
32,400*
7,808*
1,107*
61,877
1,024*
Value ($)
955,129
732,982
972,000
1,092,000
3,752,111
108,544
14 of 32
HEDONIC PRICING METHOD The hedonic pricing method is a stated preference valuation
method that is based on Lancaster’s characteristics theory
of value, which states that a good’s value reflects its
characteristics and their respective levels (Birol et al., 2006).
This method compares market transactions for market goods
or services where a nonmarket good is implicitly traded as one
of its attributes (Navrud, 2000). By observing the tradeoffs
in price and the levels of the nonmarket good in the market
transactions, economist can infer the value of the nonmarket
good (Ready, Berger, & Blomquist, 1997). This technique has
been used to find the value of environmental nonmarket goods
using the differences in the value of house prices in areas
with differing levels of environmental quality (Navrud, 2000).
However, this technique could potentially be applied to value
outcomes and impact in the voluntary sector (Cnaan & Kang,
2010a). For example, the value of the outcome of a reduction
in crime could be calculated by comparing the price difference
of similar houses in neighbourhoods with different crime rates.
While Hedonic Pricing often uses readily available housing
market data, it assumes that the crime rate, or any other
characteristic in question, is factored into the decision-
making processes of those buying and selling the market
good (Tyrvbinen, 1997). Proponents of the Efficient Market
Hypothesis would suggest that market prices do include all
such characteristics, nevertheless behavioural economists
would argue that information overload and consumers’ non-
monetary preferences contribute to less than efficient markets.
Another limitation is that there is potential for bias and error
because deriving a function that estimates the portion of price
attributable to a characteristic is technically complex when
there are so many potential influencing variables (CGER,
1997).
TRAVEL COST Travel cost method derives the value of a nonmarket
programme or service by equalling the time and travel costs
that people incur as the minimum amount they are willing
to pay (Birol et al., 2006). This has been most used to value
outdoor recreational activities where significant travel and
time are necessary to receive the benefits. Complex models
include information such as visitor attributes and information
about substitute sites to derive a measure for the use value
of the recreational activity (Navrud, 2000, p. 19). Cnaan and
Kang (2010) note that while they found no example of use of
this method in the voluntary sector, the feasibility is clear for
services that require travel.
Compared to other revealed preference methods, this method
is relatively inexpensive (Navrud, 2000). However, it is only
a lower bound estimate of value, and potential misestimating
can occur due to biased sample selection (CGER, 1997).
AVERTING COST METHODThe averting cost method measures the value of a public good
by finding the expenses and opportunity costs people incur
to avoid the consequences of not having access to the public
good (Cnaan & Kang, 2010a; Navrud, 2000). These avertive
costs can be incurred from buying durable goods, non-durable
goods or changing behaviours to prevent a loss in utility (Birol
et al., 2006). For example, if water was polluted, the value of
clean water could be derived by finding the costs consumers
incur in boiling water, filtering water, or buying bottled water
(Cnaan & Kang, 2010). This method could be used to value
the impact of a social programme that is dealing with a social
problem by finding the avertive costs it saves households,
individuals, and society (Cnaan & Kang, 2010). Cnaan and
Kang (2010) cite a study that measured the avertive costs that
people incurred in caring for disabled family members, which
could potentially be used to value a service that saves these
costs by providing formal care.
Relative to other revealed preference methods, the averting
cost method is relatively inexpensive. However, the value of
averting costs only represents a lower bound estimate of true
cost, as it does not capture the direct costs incurred from
the consequences or losses in utility (Birol et al., 2006).
Furthermore, averting costs can be difficult to measure, as
people react in diverse ways, and these may be difficult to
observe (Birol et al., 2006). Another potential issue with using
averting costs for valuation is that sample selection can skew
results as costs incurred are limited by the consumer’s income
and circumstances (Cnaan & Kang, 2010). It can also be
inaccurate as costs incurred to buy avertive inputs may have
other benefits, potentially causing one to overestimate costs
(CGER, 1997).
COST OF ILLNESS In the health sector, this method is used to value the direct
costs resulting from an illness (Birol et al., 2006; Cnaan &
Kang, 2010). This can be done by either looking at national
data and statistics, or looking at the consumption of resources
for a sample of patients and projecting the average cost on
a national scale (Cnaan & Kang, 2010). This method can be
used to define the magnitude of an illness, assist in planning
and justifying interventions, and providing an economic
framework for programme evaluation (Rice, 2000). Cnaan
and Kang (2010) argue that this method could be used in the
voluntary sector to find the direct costs of a social problem and
use the potential savings as a way to value the outcomes of a
service aimed at reducing the social problem. For example, the
outcomes of an organisation that supports people who want
to quit smoking could be valued by finding the average cost
of smoking-related health problems, and thus, the potential
savings.
The reliability of this method heavily depends on the scope
and recency of the study, the methodology used, and
the sources of the data (Rice, 2000). Furthermore, this
method underestimates costs, as it overlooks the averting
costs incurred by households in minimising the negative
15 of 32
consequences of the illness, as well as the inherent disutility
of those who are ill (Birol et al., 2006).
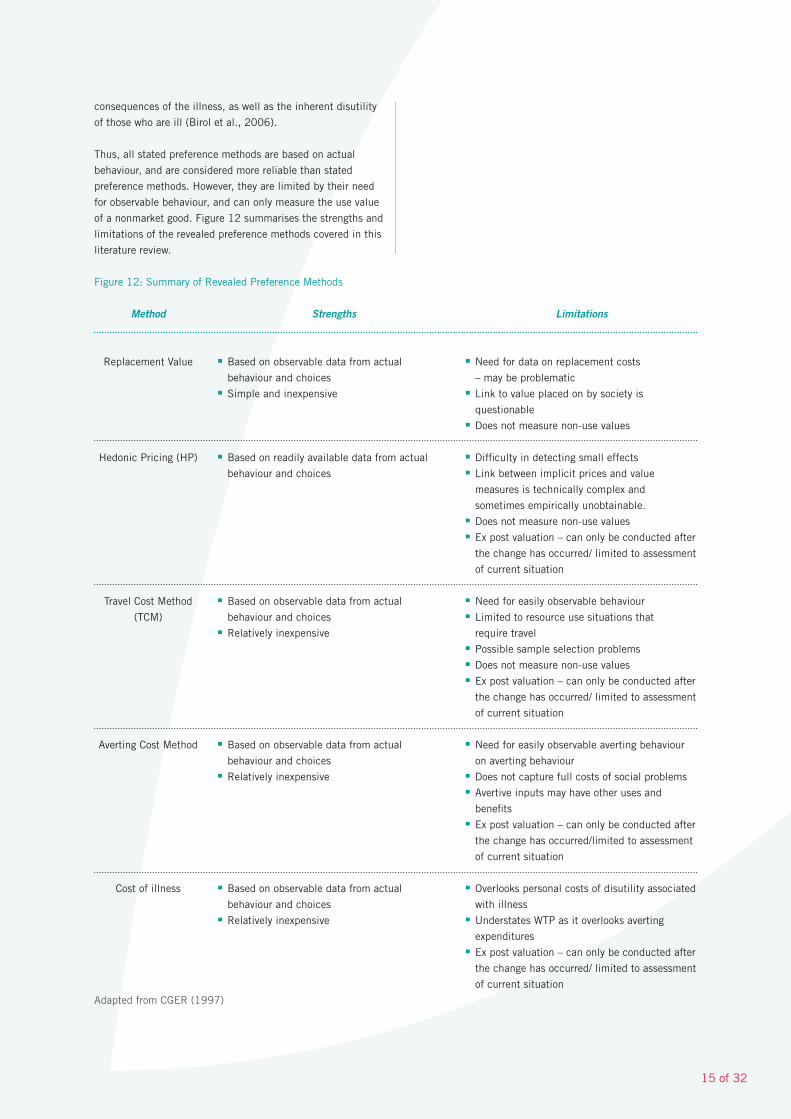
Thus, all stated preference methods are based on actual
behaviour, and are considered more reliable than stated
preference methods. However, they are limited by their need
for observable behaviour, and can only measure the use value
of a nonmarket good. Figure 12 summarises the strengths and
limitations of the revealed preference methods covered in this
literature review.
Figure 12: Summary of Revealed Preference Methods
Method
Replacement Value
Hedonic Pricing (HP)
Travel Cost Method
(TCM)
Averting Cost Method
Cost of illness
Strengths
■ Based on observable data from actual
behaviour and choices ■ Simple and inexpensive
■ Based on readily available data from actual
behaviour and choices
■ Based on observable data from actual
behaviour and choices ■ Relatively inexpensive
■ Based on observable data from actual
behaviour and choices■ Relatively inexpensive
■ Based on observable data from actual
behaviour and choices■ Relatively inexpensive
Limitations
■ Need for data on replacement costs
– may be problematic■ Link to value placed on by society is
questionable■ Does not measure non-use values
■ Difficulty in detecting small effects■ Link between implicit prices and value
measures is technically complex and
sometimes empirically unobtainable.■ Does not measure non-use values■ Ex post valuation – can only be conducted after
the change has occurred/ limited to assessment
of current situation
■ Need for easily observable behaviour■ Limited to resource use situations that
require travel■ Possible sample selection problems■ Does not measure non-use values■ Ex post valuation – can only be conducted after
the change has occurred/ limited to assessment
of current situation
■ Need for easily observable averting behaviour
on averting behaviour ■ Does not capture full costs of social problems■ Avertive inputs may have other uses and
benefits■ Ex post valuation – can only be conducted after
the change has occurred/limited to assessment
of current situation
■ Overlooks personal costs of disutility associated
with illness■ Understates WTP as it overlooks averting
expenditures■ Ex post valuation – can only be conducted after
the change has occurred/ limited to assessment
of current situation
Adapted from CGER (1997)
16 of 32
2.0 THEORY-BASED EVALUATION
Theory-based evaluation involves the development of a
programme theory model to guide evaluation (Weiss,
1997). A programme theory is a summary of how an
intervention works, causally linking programme inputs and
activities to a chain of outputs, outcomes and impacts.
Programme theory is also referred to as intervention logic,
programme logic, theory of change, and theory of action,
among other terms.
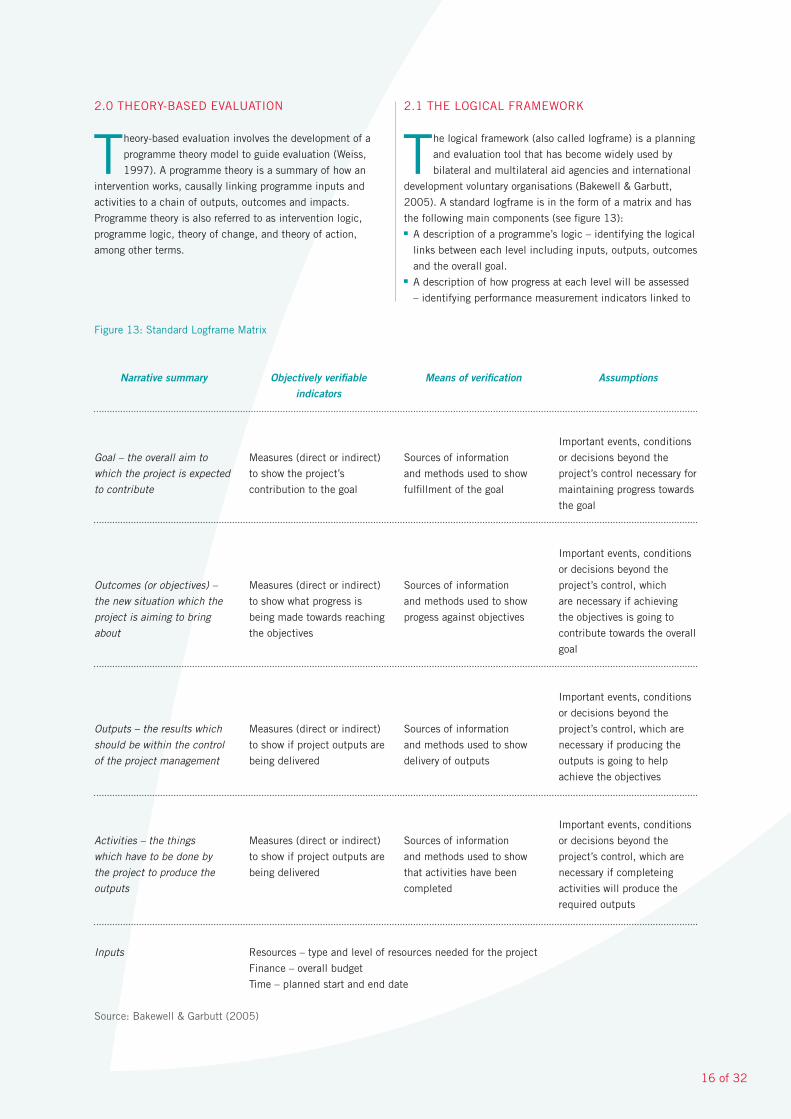
2.1 THE LOGICAL FRAMEWORK
The logical framework (also called logframe) is a planning
and evaluation tool that has become widely used by
bilateral and multilateral aid agencies and international
development voluntary organisations (Bakewell & Garbutt,
2005). A standard logframe is in the form of a matrix and has
the following main components (see figure 13): ■ A description of a programme’s logic – identifying the logical
links between each level including inputs, outputs, outcomes
and the overall goal. ■ A description of how progress at each level will be assessed
– identifying performance measurement indicators linked to
Narrative summary
Goal – the overall aim to
which the project is expected
to contribute
Outcomes (or objectives) –
the new situation which the
project is aiming to bring
about
Outputs – the results which
should be within the control
of the project management
Activities – the things
which have to be done by
the project to produce the
outputs
Inputs
Objectively verifiable indicators
Measures (direct or indirect)
to show the project’s
contribution to the goal
Measures (direct or indirect)
to show what progress is
being made towards reaching
the objectives
Measures (direct or indirect)
to show if project outputs are
being delivered
Measures (direct or indirect)
to show if project outputs are
being delivered
Means of verification
Sources of information
and methods used to show
fulfillment of the goal
Sources of information
and methods used to show
progess against objectives
Sources of information
and methods used to show
delivery of outputs
Sources of information
and methods used to show
that activities have been
completed
Assumptions
Important events, conditions
or decisions beyond the
project’s control necessary for
maintaining progress towards
the goal
Important events, conditions
or decisions beyond the
project’s control, which
are necessary if achieving
the objectives is going to
contribute towards the overall
goal
Important events, conditions
or decisions beyond the
project’s control, which are
necessary if producing the
outputs is going to help
achieve the objectives
Important events, conditions
or decisions beyond the
project’s control, which are
necessary if completeing
activities will produce the
required outputs
Figure 13: Standard Logframe Matrix
Source: Bakewell & Garbutt (2005)
Resources – type and level of resources needed for the project
Finance – overall budget
Time – planned start and end date
17 of 32
More evaluation-informed
Programme theory/logic
Outcomes chain
Intervention theory
Casual pathway
Impact pathway
Logic model
Casual model
Single programme logic
Macro/sector theory of change
Assumptions about change
Complexity-informed
Pathways mapping
“What would it take…?” approaches
Multiple outcome pathways
“Tipping points”
Emergent, non-linear, recursive
Systems thinking about change
More social change-informed
Models of Change
Dimensions of Change
How history happens
Change hypotheses
Open enquiry and dialogue
Reflective theory of change practice
Rich picture
Future timeline
Feedback loops
Road-map
Beliefs about change
objectives, as well as the methods and information used to
measure them.■ A description of the assumptions, or external conditions that
need to be fulfilled for programme objectives to occur as
planned.
STRENGTHS A logframe is ideally created at the start of an intervention
to clarify design, and can then be used to guide evaluation
(Gasper, 2000). While it may be a time-intensive process,
a logframe provides a simple, logical, easy to understand
framework for stakeholders to build consensus on what
programme success looks like and how it will be assessed
(Julian, Jones, & Deyo, 1995; McLaughlin & Jordan, 1999).
Logframes can focus the efforts of impact evaluation by
more closely linking evaluation tools to the goals of the
programme, allowing for baseline data to be collected at
the start, and improving the usefulness of data collected
throughout implementation (McLaughlin & Jordan, 1999)3. It
can also be used for programme improvement by allowing the
hypothesised causal links between objectives to be tested and
revised (McLaughlin & Jordan, 1999). This can be done by
either comparing ex post evaluation data to baseline data of
participants, or by comparing them to control or comparison
groups with similar characteristics (McLaughlin & Jordan,
1999). (See Experimental Methods, section 2.3)
LIMITATIONS While the logframe is a tool with much potential, Gasper
(2000) has noted that it is inherently easy to misuse. He
argues that the logical framework is an accountability-oriented
evaluation tool suited to evaluate simple interventions at the
project level, but that it is often misused for the evaluation
of complex interventions that require more learning-oriented
evaluations. One limitation is its fixed matrix format that has
become a mandatory requirement for results-based contracts.
3 Helitzer et al. (2010) integrated logic model with factor analysis to develop and revise a survey as part of an effective evaluation of abstinence education programmes in the United States.
This has led to the development of logic-less, over-simplified,
and rigid logframes that emphasise the horizontal logic over
the vertical logic of the matrix (Gasper, 2000; Vogel, 2012).
The linear and cause-and-effect thinking underlying a logframe
matrix assumes order and control is possible in dynamic,
emergent and transformative processes of social change
(Eguren, 2011; Miller, 2010). Furthermore, a logframe’s
narrow focus on testing whether pre-determined objectives
have occurred does not allow for a wider exploration of impact
required for adaptive learning and creative thinking in complex
situations (Gasper, 2000). However, Gasper (2000) argues
many of the pitfalls can be avoided if its limitations are
acknowledged and it is used as one tool amongst many to aid
analysis.
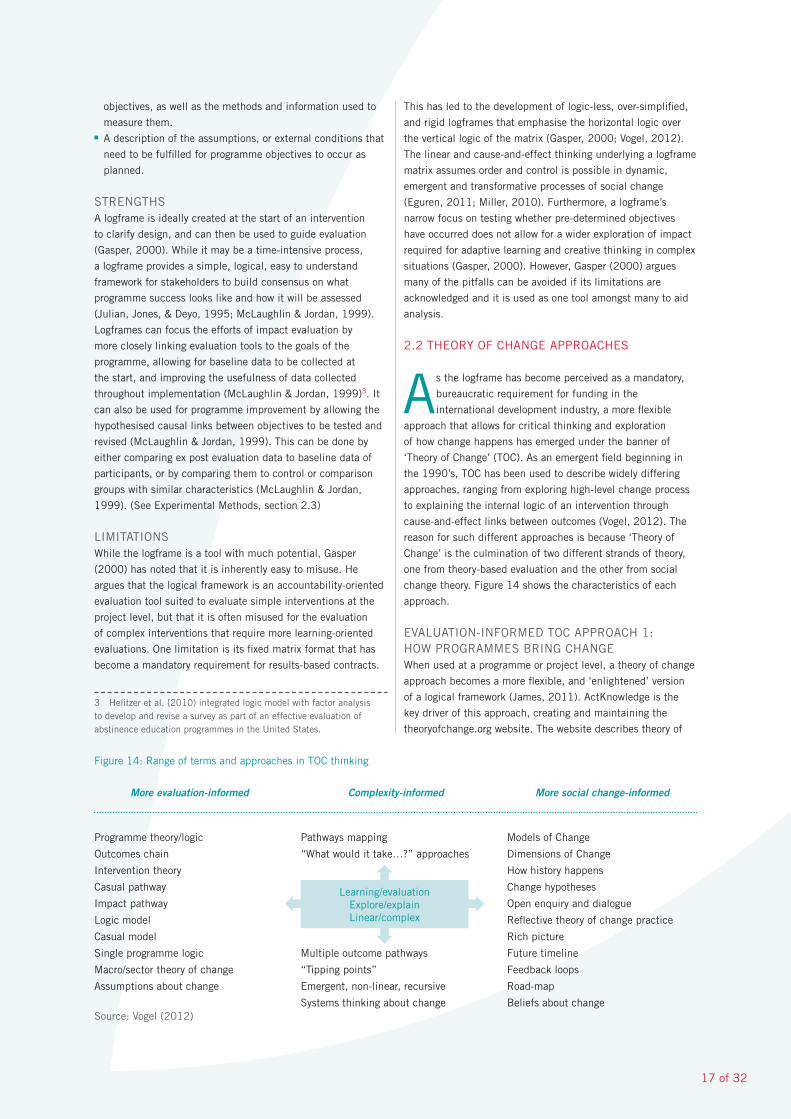
2.2 THEORY OF CHANGE APPROACHES
As the logframe has become perceived as a mandatory,
bureaucratic requirement for funding in the
international development industry, a more flexible
approach that allows for critical thinking and exploration
of how change happens has emerged under the banner of
‘Theory of Change’ (TOC). As an emergent field beginning in
the 1990’s, TOC has been used to describe widely differing
approaches, ranging from exploring high-level change process
to explaining the internal logic of an intervention through
cause-and-effect links between outcomes (Vogel, 2012). The
reason for such different approaches is because ‘Theory of
Change’ is the culmination of two different strands of theory,
one from theory-based evaluation and the other from social
change theory. Figure 14 shows the characteristics of each
approach.
EVALUATION-INFORMED TOC APPROACH 1: HOW PROGRAMMES BRING CHANGE When used at a programme or project level, a theory of change
approach becomes a more flexible, and ‘enlightened’ version
of a logical framework (James, 2011). ActKnowledge is the
key driver of this approach, creating and maintaining the
theoryofchange.org website. The website describes theory of
Source: Vogel (2012)
Figure 14: Range of terms and approaches in TOC thinking
Learning/evaluationExplore/explainLinear/complex

18 of 32
change as an “outcomes-based, participatory method that has
evolved from its early days into a rigorous tool for planning,
evaluation, and organisational capacity-building.”
The process they advocate involves the following:
■ Identifying goals and assumptions ■ Backwards mapping and connecting outcomes
(pre-conditions) at a minimum of three levels■ Developing indicators – who or what needs to change, how
much and over how long■ Identifying interventions that are linked to outcomes ■ Writing a narrative to support the diagram
ActKnowledge (2003) released a guided example of Project
Superwoman, a programme that aims to help create long-
term, liveable wage employment opportunities for women who
had been victims of domestic violence. Figure 15 shows a
worked example of an outcome map that links a chain of short,
medium and long term outcomes that need to occur at each
level for the main aim to be achieved. It also plots assumptions
and interventions on to the map. See ActKnowledge (2003)
for the full example. More worked examples of this kind can
be found in Ellis, Parkinson, & Wadia (2011) and Reisman &
Gienapp (2004).
Given that both a logframe and evaluation-informed theories
of change describe an organisation’s theory at programme or
project level, many find it hard to see substantive difference
between the approaches. The difference is mostly in focus
and approach. The focus on mapping and making explicit
connections between the pre-conditions or intermediate
outcomes necessary for impact allows a theory of change
approach to more thoroughly question assumptions and
explore alternative pathways for achieving impact (Reisman
& Gienapp, 2004). While the logframe should do the same
in theory, its input-to-impact chain running vertically in the
matrix can be too easily completed by simply listing and
describing programme components without really exploring
how the programme achieves change (Vogel, 2012). Vogel
(2012) found that many practitioners think that a “theory of
change” approach at a programme or project level should be
used as a voluntary tool to explore, question, and adjust how
a programme can achieve change, and then use the results to
develop a more complete, relevant, and robust logframe for
accountability purposes.
Figure 15: Project Superwoman
Long-term employment at
a livable wage for domestic
violence survivors
Survivors experience and enact appropriate workplace behaviour
Survivors have marketable skills in nontraditional areas
Women attend training in nontraditional skills
Women hear about the program
Women enroll in program
Women have new support system
Women attain regular child care
Survivors attend peer-to-peer counselling
Women attend training about expectations in
the workpace
Social service agency, training program, and nonprofit shelter provider for survivors of domestic violence
collaborate to develop an employment program geared to the particular issues for survivors of domestic abuse.
Intervention
Domino Effect (no intervention needed)
Assumptions
Related interventions
Women are ready to commit and attend program
Employers are educated as to how
to use interns
Survivors know how to get help and deal with their issues
Women serve internships
Survivors attain coping skills
Source: ActKnowledge (2003) cited in James (2011)
4
9
2
G
F
E
1
10
13
14
123
D
B
A
1
A
C
7
8
19 of 32
The stigma associated with and
discrimination against GLBT
populations in Ecuador has lessened
Reduction in cases of infringement of
the GLBT population’s human rights
Improve the quality of life of
GLBTs in Ecuador by 2020
SOCIAL CHANGE INFORMED APPROACH 2: EXPLORING HOW CHANGE HAPPENS Social-change informed approaches explore more broadly
how change happens in a particular context, to then enable
organisations to identify opportunities to contribute to change
(James, 2011). These approaches emphasise TOC as an
ongoing process that integrates evaluative thinking through
experiential learning and reflection (Eguren, 2011; Vogel,
2012). The TOC product, or diagram, should be seen as a
living document that is constantly reviewed and contested,
which can serve as an organising framework for the evaluation
of an organisation’s contribution to impact in complex social
change process (Vogel, 2012).
The Dutch NGO HIVOs encourages this approach with its
partners in developing countries (Eguren, 2011). Their
Theory of Change approach encourages the use of the
following processes in an iterative way for planning and
evaluating impact.
■ Developing a rich picture of the desired change. This process
includes a full exploratory analysis of the context of change,
the dimensions and levels of change, and the institutions
that need changing to achieve the vision.
■ Analysing the Agents of Change involved in achieving or
blocking the desired change, considering their points of view,
interests and the nature and extent of their influence. ■ Considering and re-considering the assumptions underlying
all the TOC elements. ■ Developing a Pathway of Change that illustrates the
strategies, and the necessary conditions of the desired
change to occur. It shows the relationships between
outcomes, while also connecting them to actions and
interventions. ■ Developing change indicators that help understand the
extent and way that change is occurring as well as our
contribution to the change. ■ Develop learning, monitoring and accountability systems
that allow for experiential learning and reflection, as well as
meeting stakeholder accountability needs.
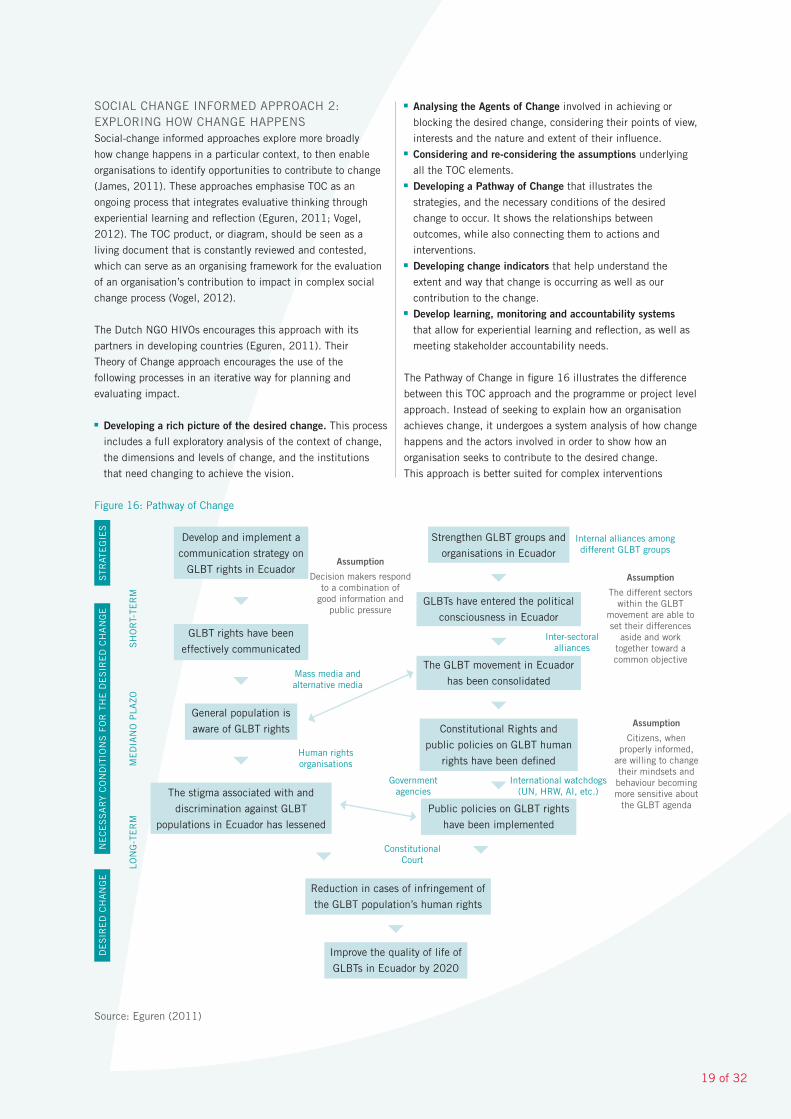
The Pathway of Change in figure 16 illustrates the difference
between this TOC approach and the programme or project level
approach. Instead of seeking to explain how an organisation
achieves change, it undergoes a system analysis of how change
happens and the actors involved in order to show how an
organisation seeks to contribute to the desired change.
This approach is better suited for complex interventions
Figure 16: Pathway of Change
Source: Eguren (2011)
STR
ATE
GIE
SD
ES
IRE
D C
HA
NG
EN
EC
ES
SA
RY
CO
ND
ITIO
NS
FO
R T
HE
DE
SIR
ED
CH
AN
GE
SH
OR
T-TE
RM
ME
DIA
NO
PLA
ZOLO
NG
-TE
RM
Develop and implement a
communication strategy on
GLBT rights in Ecuador
GLBT rights have been
effectively communicated
General population is
aware of GLBT rights
GLBTs have entered the political
consciousness in Ecuador
The GLBT movement in Ecuador
has been consolidated
Constitutional Rights and
public policies on GLBT human
rights have been defined
Public policies on GLBT rights
have been implemented
Strengthen GLBT groups and
organisations in Ecuador
Constitutional Court
Government agencies
International watchdogs (UN, HRW, AI, etc.)
Human rights organisations
Mass media and alternative media
Assumption
Decision makers respond to a combination of
good information and public pressure
Assumption
The different sectors within the GLBT
movement are able to set their differences
aside and work together toward a common objective
Assumption
Citizens, when properly informed,
are willing to change their mindsets and behaviour becoming more sensitive about
the GLBT agenda
Inter-sectoral alliances
Internal alliances among different GLBT groups
20 of 32
such as advocacy and network organisations, where impact
is not easily measured and isolated from other influences.
It facilitates improvement through a process of adaptive
learning and challenging of assumptions. By exploring how an
organisation seeks to contribute to change, and it can serve
as a guide for developing systems for accountability. However,
these methods are emerging, flexible and it is difficult to pin
point how they measure organisational performance.
2.3 TESTING YOUR PROGRAMME THEORY – EXPERIMENTAL METHODS
Experimental methodsExperimental methods involve applying principles of the
scientific method and the medical community to impact
evaluation. Experimental methods can be used to test the
hypothesised links between outputs, outcomes and impact of
a programme’s theory (Weiss, 1997)They measure the impact
of a programme by finding the counterfactual, meaning they
find what would have happened to beneficiaries if they had
not participated in the intervention (Baker, 2000). They find
the counterfactual by comparing baseline and outcome data
of those who received treatment and the control group who
didn’t. The control and treatment groups are selected randomly
at the beginning of the project from the same population of
eligible beneficiaries, and thus it is appropriate to compare
them given as they are statistically equivalent to each other
and there is no selection bias (Baker, 2000).
Baker (2000) has found many examples of the use
of experimental design in international development
interventions. For example, the Uganda Nutrition and Early
Childhood Development Project is a project that seeks to
enhance the ability of parents and communities to care for
children by enhancing their knowledge on better childcare
practices as well as opportunities to increase income. They
randomly selected a control group that would not receive
‘treatment’ at the start, and generated baseline and follow
up survey data for both the control and treatment group. This
allowed for the programme to compare data and rigorously
measure their impact.
Quasi-experimental methods Quasi-experimental methods can be used when randomisation
cannot be or was not built into programme from the beginning.
The counterfactual is instead measured by comparing the
treatment group with a comparison group that resembles the
treatment group as closely as possible. This group is generated
using available data and econometric methodologies (Baker,
2000). The only observable characteristic that should be
different between a good comparison group and treatment
group should be programme participation (Baker, 2000).
An example of quasi-experimental design is TRABAJAR, a
programme providing employment at low wages in small social
and economic infrastructure subprojects in Argentina (Baker,
2000). They engaged in a quasi-experimental evaluation to
find out whether participant wages were greater than they
would be without the programme. As no control group or
baseline survey was conducted, they instead used readily
available household data to construct a comparison group
(Baker, 2000, 71). They matched programme participants
to nonparticipants over a set of variables such as schooling,
gender, housing, etc. They used wage data from this household
survey to compare against the results of a survey conducted on
participants.
STRENGTHSExperimental methods are considered the “gold standard” for
impact measurement, as it is the most rigorous methodology
that investigates the difference a programme makes in a
scientifically robust way (Baker, 2000; Ebrahim & Rangan,
2010; Rogers, 2008). By randomly selecting a control group
from potential participants at the beginning of the intervention,
these designs allow for programmes to prove their impact by
comparing the data from two groups that are equal to each
other in every way other than programme participation (Baker,
2000). Proponents of this approach argue that this rigorous
and scientific approach is necessary to better understand what
works and what doesn’t in the voluntary sector (Ebrahim &
Rangan, 2010).
LIMITATIONS Rogers (2009) argues that using experimental methods to test
pre-determined objectives as the ‘gold standard’ for impact
evaluation can undermine innovation and self-reflection as it
does not allow for the exploration of unintended consequences.
Furthermore, while experimental designs are considered
reliable and rigorous, they are best suited and limited to
simple interventions delivering discrete and homogenous
outputs, so that it is straightforward to isolate the impact
(Rogers, 2008). Ebrahim and Rangan (2010) note that
experimental designs may be appropriate for programmes
involving immunisation, conditional cash transfers and
distribution of new seeds to farmers, rather than policy reform
and advocacy, as it difficult to isolate those who received
benefits and those who didn’t.
Quasi-experimental designs are considered less reliable
than experimental methods as there may be unobserved
variables that cause the differences between comparison and
treatment groups, other than programme participation (Baker,
2000). However, compared to experimental designs, quasi-
experimental methods are quicker and cheaper given that they
draw on readily available existing data sources (Baker, 2000).

21 of 32
3.0 STRATEGY APPROACHES
Strategy approaches link key performance measurement
and management control to strategy. A widely used
private sector tool to measure strategy achievement is
the Balanced Scorecard. However, Moore (2003) has sought
to adapt this idea to a strategic concept more relevant to the
voluntary sector.
3.1 BALANCED SCORECARD
The Balanced Scorecard is a private sector performance
measurement system developed by Kaplan and Norton
(1992) that aims to more explicitly link performance
measurement to strategy. Instead of only measuring financial
efficiency, the Balanced Scorecard measures performance in
four financial and non-financial areas that are linked to the
creation of value and long-term performance (Kaplan & Norton,
1992). Figure 17 explains the four perspectives of a Balanced
Scorecard that has been adapted for the voluntary sector.
The Balanced Scorecard is a tool that can help track progress
for the performance indicators, targets and initiatives for the
objectives from each perspective (Kaplan & Norton, 1992).
It has been adapted for the public and voluntary sector by
privileging customers and placing mission at the top, while
the private sector Balanced Scorecard places the financial
perspective as the end goal.
Figure 17: Voluntary Sector Balanced Scorecard
Adapted from: Kaplan and Norton (1993) and Niven (2008)
Kaplan and Norton (2004) advocate developing strategy maps
to identify how objectives and indicators are linked to the
organisation’s overall strategy. Creating a visual framework
that depicts the logical, causal relationships between different
objectives for each perspective can help identify any measures
that are not quite aligned with the overall strategy (Quezada,
Cordova, Palominos, Godoy, & Ross, 2009). Furthermore,
mapping these objectives and showing how these measures are
linked allows for these hypothesised links to be monitored and
tested for improvement (Niven, 2008). Figure 18 shows an
example of a strategy map for a performing arts organisation,
showing the causal links between the objectives of the four
perspectives to be then monitored using a Balanced Scorecard.
Figure 18: Strategy Map for a Performing Arts Organisation
Source: Niven (2008)
STRENGTHSKaplan and Norton (2001) argue that the Balanced Scorecard
provides a multidimensional framework for measuring and
managing a voluntary organisation’s effectiveness. The strength
of the Balanced Scorecard is that it is a tool that can be
used to meet the short-term financial accountability needs of
donors, while also allowing for a broader exploration of multiple
perspectives critical for long-term impact and performance.
By creating a strategy map and linking objectives to the
financial and nonfinancial measures monitored on a Balanced
Scorecard, voluntary organisations can systematically plan,
implement and monitor strategy for improving performance
towards mission (Kaplan & Norton, 1992). By focusing only on
the most critical measures, a Balanced Scorecard can improve
the coherence of performance measurement and prevent
information overload (Kaplan & Norton, 1992).
LIMITATIONSWhile the private sector Balanced Scorecard has been adapted
for the voluntary sector by privileging mission and customers
over the financial perspective, Moore (2003) argues that
this model is still problematic for the voluntary sector. First
of all, this model is not compatible with the understanding
that financial goals in the voluntary sector are a means to an
end, rather than an end in itself (Moore, 2003). Furthermore,
it does not adequately modify the model to fit the multiple
‘customers’ voluntary organisations receive funding from and
are accountable to, including government, donors, clients, and
wider communities (Moore, 2003). Moore (2003) also argues
that this model is not compatible with the voluntary sector’s
need for partnerships and collaboration to achieve greater
impact, as it instead provides incentives for organisations to
plan strategically for comparative advantage and to maximise
market share.
Present diverse artistic offerings
Develop and promote diverse offerings
Attract, develop, and
retain the best talent
Increase revenue
Mission
CustomerHow do we create impact
for our customers?
Learning and GrowthHow do we improve our ability
to support our strategy?
FinancialHow do we effectively
manage and allocate
resources to maximise
our impact?
Internal ProcessesTo maximise impact, at
what business processes
must we excel?
Strategy
Customer
Internal Processes
Employee Learning and Growth
Financial

22 of 32
3.2 PUBLIC VALUE SCORECARD:
As an alternative to the Balanced Scorecard, Moore
(2003) suggests the idea of a Public Value Scorecard.
Like a Balanced Scorecard, it emphasises alignment
of measurement with strategy, uses financial and non-
financial measures, and includes both process and outcome
measures (Moore, 2003). However, Moore (2003) offers a
strategic triangle of public value creation that a performance
measurement system in the voluntary sector should focus on
(see figure 19).
Figure 19: Public Value Strategy Triangle
Source: Moore (2000)
The three areas of the strategic triangle include:■ Value – Identifying and evaluating how an organisation
achieves its social mission and creates value for the public. ■ Legitimacy and support – Evaluating the process through
which an organisation expands support and authorization
from key stakeholders to operate and achieve goals. The
process itself also creates value by facilitating networks that
build the ‘stock of civic and social capital in society’
(Moore, 2000). ■ Operational capacity – Identifying and evaluating the ability
of an organisation to reach its goals. Operational capacity not
only includes not the ability to leverage internal resources,
but also partnerships for impact (Moore, 2003). The ‘impact
chain’ can be seen as a blown up version of the link between
operational capacity and social mission.
Figure 20 shows the types of indicators that would be included
in a Public Value Scorecard in order to capture the full array of
value being created by a voluntary organisation.
STRENGTHSMoore (2003) argues that a Public Value Scorecard is more
appropriate for the voluntary sector than an adapted Balanced
Scorecard. One reason is because it includes the financial
perspective within a wider context of operational capacity,
rather than an end in itself (Moore, 2003). It is also more
aligned with the idea of collaborating to achieve greater impact
on mission, rather than a competitive strategy that aims to
capture value for itself (Moore, 2003). Furthermore, it better
captures the value created by voluntary organisations, as
it looks at other ways it creates value other than delivering
services and achieving mission (Moore, 2003). For example,
people who donate voluntary contributions of time, money or
materials are not only seen as sources of fund or support to
enable mission, but their satisfaction is an end in itself, and
their experience is part of their value added (Moore, 2000).
LIMITATIONSMoore (2003) argues for comprehensive measurement across
all levels of the impact chain and strategic triangle, rather than
tracking a few key outcome indicators. While he argues this
is necessary to capture the multidimensional value created by
voluntary organisations, it could become too cumbersome and
time-consuming for small voluntary organisations
Figure 20: Public Value Framework for Performance
Management
Adapted from: Moore (2003)
Creating Public Value
■ Organisational vision,
mission and values■ Strategic goals■ Measures of
effectiveness■ Range of outcomes■ Activities and outputs
that create outcomes
Legitimacy and
Support Value
Operational Capacity
Expanding Support and Authorisation
■ Funder relations
and diversification■ Volunteer roles
and relations■ Visibility, legitimacy
with general public■ Relations with
goverment regulators■ Reputation with media■ Credibility with civil
society actors
Building Operational Capacity
■ Organisational outputs■ Measures of productivity
and efficiency at input,
activities and output
levels■ Financial integrity■ Staff morale, capacity,
development■ Partner morale, capacity,
development■ Organisational learning
and innovation
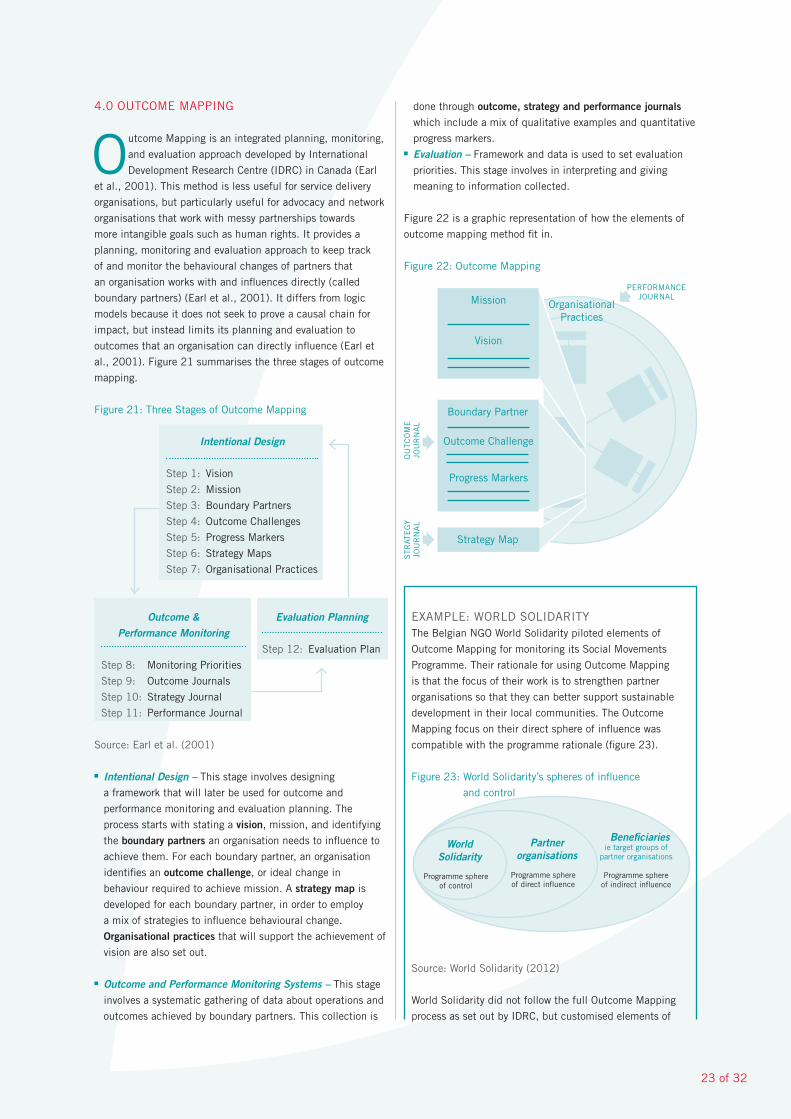
23 of 32
4.0 OUTCOME MAPPING
Outcome Mapping is an integrated planning, monitoring,
and evaluation approach developed by International
Development Research Centre (IDRC) in Canada (Earl
et al., 2001). This method is less useful for service delivery
organisations, but particularly useful for advocacy and network
organisations that work with messy partnerships towards
more intangible goals such as human rights. It provides a
planning, monitoring and evaluation approach to keep track
of and monitor the behavioural changes of partners that
an organisation works with and influences directly (called
boundary partners) (Earl et al., 2001). It differs from logic
models because it does not seek to prove a causal chain for
impact, but instead limits its planning and evaluation to
outcomes that an organisation can directly influence (Earl et
al., 2001). Figure 21 summarises the three stages of outcome
mapping.
Figure 21: Three Stages of Outcome Mapping
Source: Earl et al. (2001)
■ Intentional Design – This stage involves designing
a framework that will later be used for outcome and
performance monitoring and evaluation planning. The
process starts with stating a vision, mission, and identifying
the boundary partners an organisation needs to influence to
achieve them. For each boundary partner, an organisation
identifies an outcome challenge, or ideal change in
behaviour required to achieve mission. A strategy map is
developed for each boundary partner, in order to employ
a mix of strategies to influence behavioural change.
Organisational practices that will support the achievement of
vision are also set out.
■ Outcome and Performance Monitoring Systems – This stage
involves a systematic gathering of data about operations and
outcomes achieved by boundary partners. This collection is
done through outcome, strategy and performance journals which include a mix of qualitative examples and quantitative
progress markers. ■ Evaluation – Framework and data is used to set evaluation
priorities. This stage involves in interpreting and giving
meaning to information collected.
Figure 22 is a graphic representation of how the elements of
outcome mapping method fit in.
Figure 22: Outcome Mapping
EXAMPLE: WORLD SOLIDARITY The Belgian NGO World Solidarity piloted elements of
Outcome Mapping for monitoring its Social Movements
Programme. Their rationale for using Outcome Mapping
is that the focus of their work is to strengthen partner
organisations so that they can better support sustainable
development in their local communities. The Outcome
Mapping focus on their direct sphere of influence was
compatible with the programme rationale (figure 23).
Figure 23: World Solidarity’s spheres of influence
and control
Source: World Solidarity (2012)
World Solidarity did not follow the full Outcome Mapping
process as set out by IDRC, but customised elements of
STR
ATE
GY
JOU
RN
AL
OU
TCO
ME
JO
UR
NA
L
PERFORMANCE JOURNAL
Intentional Design
Step 1: Vision
Step 2: Mission
Step 3: Boundary Partners
Step 4: Outcome Challenges
Step 5: Progress Markers
Step 6: Strategy Maps
Step 7: Organisational Practices
Outcome & Performance Monitoring
Step 8: Monitoring Priorities
Step 9: Outcome Journals
Step 10: Strategy Journal
Step 11: Performance Journal
Evaluation Planning
Step 12: Evaluation Plan
Boundary Partner
Outcome Challenge
Progress Markers
Vision
Mission Organisational Practices
Strategy Map
Partner organisations
Programme sphere of direct influence
Beneficiariesie target groups of
partner organisations
Programme sphere of indirect influence
World Solidarity
Programme sphere of control

24 of 32
Outcome Mapping to develop an actor-focused monitoring
system that promotes learning and builds relationships
among programme partners. They found that the Outcome
Journal for each boundary partner was the most helpful tool
(see figure 24). They noted that the while a logframe plans
and monitors activities and pre-determined objectives,
Outcome Mapping brings partners to the centre of the
analysis to ensure the sustainability of the programme
results. They found it more useful to track these changes
in boundary partners, than to seek attribution of impact on
end beneficiaries.
STRENGTHSThe strength of this method is its actor-centred understanding
of social change, and its emphasis on participatory and
continuous learning and nonlinear thinking (Jones & Hearn,
2009). Given its focus on outcomes involving behavioural
change, it is most suited to complex programmes engaging
in social change processes such as influencing policy or
building capacity for sustainable development (Jones & Hearn,
2009). Furthermore, it is a flexible tool that can be used to
complement other methods, as all elements in the Outcome
Mapping process can be used independently (Earl et al.,
LIMITATIONSWhile this method can help guide planning and evaluation
for impact, it does not replace the traditional accountability
methods required by donors (Earl et al., 2001). Given that
this method involves significant staff time and effort in setting
up systems, regular meetings, and completing data collection
journals, it may be too complex and time-consuming as an
add-on to existing accountability systems. Furthermore,
outcome mapping does not explain how and why change
comes about – but it can effectively be combined with theory
of change analysis at the intentional design stage
(James, 2011).
Figure 24: Outcome Journal
5.0 MOST SIGNIFICANT CHANGE TECHNIQUE
The Most Significant Change (MSC) technique is a
participatory, relationship-based technique that can be
used primarily for programme improvement, but also
to complement ex post evaluation. This technique involves
collecting stories about the most significant changes from
the field and categorising them into broad domains of change
(Dart & Davies, 2003). Contextual information about the
story is also collected, as well as why the story-teller believes
it is significant (Dart & Davies, 2003). The collection of
change stories deemed ‘most significant’ by the participants
themselves allows them to play an influential role in the
evaluation of the programme’s impact, while also creating
feedback loops for unexpected outcomes (Dart & Davies,
2003). Figure 25 shows an example of a questionnaire used
when piloting the MSC to evaluate an Australian agricultural
extension programme.
Figure 25: Types of information requested in the story
collection form
Source: Dart & Davies (2003)
Once stories are collected, the most significant changes are
systematically filtered up through the organisational hierarchy
through a process of values inquiry (Dart & Davies, 2003).
At each level, selection committees must document their
discussions and include the selection criteria and the reasons
why stories were chosen as the most significant (Dart &
Davies, 2003). When the most significant stories have been
selected at the highest levels, a document containing the most
significant stories from each of the domains of change is sent
to funders. They are then asked to select the stories that best
represent the outcomes they wish to fund and why (Dart &
Davies, 2003, p. 140). The selection process reveals values
placed by stakeholders on certain outcomes and can contribute
to programme improvement by “facilitating an ongoing,
organisation-wide conversation that guides the direction of
work towards explicitly valued directions” (Dart & Davies,
2003). Figure 26 shows the how the stories and feedback flow
through the organisation using MSC.
Progress markers monitoring tool■ Date:■ Name of the partner:■ Domain of capacity development:■ Our dream:
■ Story title:■ Domain – changes in decision-making skills
– changes in on-farm practice
– changes in profitability/productivity
– other significant changes■ Name of person recording story:■ Region:■ Date of narration:■ Where did this happen?■ When did it happen?
■ What happened?■ Why do you think this is a significant change?■ What difference has it made already/will it make in
the future?
■ Unanticipated changes:■ Which support strategies from WSM were particularly helpful
or which ones need revision?■ Contributing or limiting factors and actors towards
achievement of progress markets:■ Summary of lesson learned/recommendations/action points?
Progress
markers
1.
2.
3.
4.
Observed
changes
Points of attention/
followup
Low/Medium/High
Source: World Solidarity (2012)
2001).

25 of 32
Figure 26: Flow of stories and feedback in MSC
Source: Dart & Davies (2003)
This method has the potential to complement and inform
other more traditional, quantitative evaluation techniques such
as the logical framework by capturing significant unplanned
change (Willetts & Crawford, 2007). Instead of looking at
only pre-determined objectives, this method can allow an
organisation to gain insights through negative stories about
real or potential problems. For example, at the time of piloting
MSC in Target 10, an Australian collaborative dairy extension
programme, they used MSC to complement their theory-based
evaluation approach (Dart & Davies, 2003).
STRENGTHSGiven the exploratory and qualitative nature of this technique,
MSC is particularly suited for complex interventions with
a participatory nature and emergent and diverse outcomes
(Davies & Dart, 2005). Collecting information of significant
unexpected outcomes facilitates reflection and learning
in order to better understand and improve programme
performance (Willetts & Crawford, 2007). Furthermore, the
dynamic dialogue that emerges through the selection of stories
allows the values of different stakeholders to be revealed in
order to improve the programme and guide evaluation (Davies
& Dart, 2005; Willetts & Crawford, 2007). The documentation
of the criteria, discussion, and context for the collection and
selection of stories allows for a more transparent process than
many other evaluation techniques (Davies & Dart, 2005).
LIMITATIONS While MSC can be a very powerful tool, this technique is
limited in judging overall programme performance as it
looks at the most exceptional circumstances rather than the
average results (Dart & Davies, 2003). However, Dart & Davies
(2003) argue that one can learn much from extreme positive
or negative stories, as they can help an organisation build an
evidence base for best and worst practices. While Dart and
Davies (2003) acknowledge that the method is biased towards
eliciting positive outcomes rather bad news, they argue that
this can be minimised by asking other questions such as most
significant ‘lessons learned’.
Willetts & Crawford (2007) found from research in Laos
that many methodological issues can affect validity and
authenticity of responses, including data collection methods,
level of interviewer training, who chooses to participate,
translation issues, the use of leading questions, the lack of
trust between interviewer and respondent, among many others.
Furthermore, conducting story collection for MSC can be
time and resource intensive depending on the circumstances,
sometimes requiring one-on-one interviews, focus groups,
survey development, translators, transcribers, as well as
filming/recording equipment (Davies & Dart, 2005). While the
method is suited for large organisations with the resources to
invest in such data collection, Davies & Dart (2005) argue that
smaller organisations can extract elements of this method and
adapt it to fit their resource constraints.
6.0 LIFE STORY APPROACH
A life-story approach evaluates impact by collecting
stories from volunteers, staff members, or clients about
their experience with the programme, and situating
these stories in the context of detailed and nuanced accounts
of personal life stories (Miller, 2010). This approach attempts
to turn the conventional relationship between the programme
and individual in traditional evaluations upside down.
Instead of ‘reading’ the lives of individuals in the context of a
programme’s story and objectives, a life story approach uses
personal life stories to read the significance and meaning of a
programme (Kushner, 2000). This approach problematises the
“simplistic causal explanations and linear accounts of personal
change” found in objectives-based impact assessment
methods like the logical framework, and can be used to
uncover the multidimensional, dynamic and contextual nature
of personal change over time (Miller, 2010, p. 6).
EXAMPLE: PATHWAYS THROUGH PARTICIPATION Pathways through Participation was a 2.5 year project
in the United Kingdom led by the National Council for
Voluntary Organisations in partnership with the Institute for
Volunteering Research and Involve. This project involved
more than 100 in-depth interviews based on a life-story
approach in order to better understand what creates and
sustains active citizenship and participation (Miller, 2010).
They used timelines and interviews to create a picture
of what is happening around people’s experiences of
participation (Miller, 2010). They have found that the life
stories approach has enabled them to better understand the
quality and nature of the impact of participation than the
static accounts elicited from cross-sectional, quantitative
surveys would have allowed (Miller, 2010).
Funder meeting
State meetings
Region 1 Region 3
Storytellers
Region 2 Region 4
FLO
W O
F S
TOR
IES
FEE
DB
AC
K
26 of 32
STRENGTHSA life story approach is best suited for evaluating the
multidimensional impact across stakeholders in complex
interventions with diverse and loosely-defined outcomes. As
an open-ended and participant-focused approach, a life-story
approach allows for a fuller understanding as interpreted by
participants themselves rather than the pre-determined causal
theories and objectives. The narrative explanations are more
comprehensive, flexible and can create a more diverse and
nuanced understanding of impact than causal explanations
derived from quantitative survey analysis (Miller, 2010). The
nuanced and comprehensive nature of findings can allow a life
story approach to improve a programme’s understanding of how
it affects participants, and it can trigger double loop learning
by challenging a programme’s assumptions of how change
happens.
LIMITATIONSThe data collection can be resource and time intensive, as
interviewers need to gain a full understanding a person’s life
story, and depending on circumstances multiple interviews,
focus groups, translators, transcribers, filming/recording
equipment may be required. Furthermore, the analysis of
narrative requires social science expertise, and findings are
difficult to generalise as they are so dependent on context
(Miller, 2010). However, using this narrative-driven qualitative
research can strengthen and complement other more
traditional, quantitative methods for impact measurement
(Elliot, 2009).
CONCLUSION
Measurement of impact in the voluntary sector is problematic given the distinctive characteristics of the sector. However, this does not mean that it is impossible, nor that it is not a worthy exercise. Measuring impact has many potential benefits for organisations, including proving
their impact to donors, securing additional funding, as well as facilitating organisational learning for improvement. However, caution should be exercised when using methods to prove impact in complex interventions, or to improve in organisations in simple interventions. Thus, voluntary organisations should consider the purpose of impact measurement as well as the nature of their interventions to determine which method to use, or to mix and match elements of different methods to strike a balance that meets their overall accountability and learning needs.

27 of 32
BIBLIOGRAPHY
■ ActKnowledge. (2003). Guided Example: Project Superwoman.■ Apthorpe, R., & Nevile, A. (1998). Managing Emergency and Humanitarian Aid Evaluation - Evaluation no. 12. Austalian
Agency for International Development.■ Arvidson, M. (2009). Impact and evaluation in the UK third sector : reviewing literature and exploring ideas.■ Arvidson, M., Lyon, F., McKay, S., & Moro, D. (2010). The Amibtions and Challenges of SROI.■ Baker, J. L. (2000). Evaluating the Impact of Development Projects on Poverty A Handbook for Practitioners. Washington, D.C.■ Bakewell, O., & Garbutt, A. (2005). The Use and Abuse of the Logical Framework Approach: A Review of International
Development NGOs ’ Experiences (pp. 1–27).■ Barman, E. (2007). What is the Bottom Line for Nonprofit Organizations? A History of Measurement in the British
Voluntary Sector. Voluntas: International Journal of Voluntary and Nonprofit Organisations, 18(2), 101–115. doi:10.1007/
s11266-007-9039-3■ Birol, E., Karousakis, K., & Koundouri, P. (2006). Using economic valuation techniques to inform water resources management:
a survey and critical appraisal of available techniques and an application. The Science of the Total Environment, 365, 105–22.
doi:10.1016/j.scitotenv.2006.02.032■ Buckmaster, N. (2005). Associations between outcome measurement , accountability and learning for non-profit organisations.
International Journal of Public Sector Management, 12(2), 186–197.■ Carman, J. G., & Fredericks, K. A. (2008). Nonprofits and Evaluation: Empirical Evidence From the Field. In J. G. Carman & K.
A. Fredericks (Eds.), Nonprofits and Evaluation: New Directions for Evaluation (pp. 51–71). doi:10.1002/ev■ Carson, R. T. (2000). Contingent Valuation: A User’s Guide. Environmental Science & Technology, 34(8), 1413–1418.
doi:10.1021/es990728j■ Cnaan, R. a., & Kang, C. (2010). Toward Valuation in Social Work and Social Services. Research on Social Work Practice,
21(4), 388–396. doi:10.1177/1049731510387306■ Cowling, M. (2006). Measuring public value : The economic theory (pp. 1– 37).■ Curnan, S., LaCava, L., Sharpstee, D., Lelle, M., & Reece, M. (1998). WK Kellogg Foundation evaluation handbook. … . org/
pubs/Tools/Evaluation/ …. Retrieved from http://scholar.google.com/scholar?hl=en&btnG=Search&q=intitle:W.K.+Kellogg+Found
ation+Evaluation+Handbook#0■ Dart, J., & Davies, R. (2003). A Dialogical, Story-Based Evaluation Tool: The Most Significant Change Technique. American
Journal of Evaluation, 24(2), 137–155. doi:10.1177/109821400302400202■ Davies, R., & Dart, J. (2005). The “ Most Significant Change” (MSC) Technique: A guide to its use (pp. 1–104).■ Earl, S., Carden, F., & Smutylo, T. (2001). Outcome mapping: Building Learning and Reflection Into Development Programs.
Ottawa: International Development Research Centre. Retrieved from http://www.idrc.ca/EN/Resources/Publications/Pages/
IDRCBookDetails.aspx?PublicationID=121■ Ebrahim, A. (2005). Accountability Myopia: Losing Sight of Organizational Learning. Nonprofit and Voluntary Sector Quarterly,
34(1), 56–87. doi:10.1177/0899764004269430■ Ebrahim, A., & Rangan, V. K. (2010). The Limits of Nonprofit Impact : A Contingency Framework for Measuring Social
Performance.■ Eguren, I. R. (2011). Theory of Change: A thinking and action approach to navigate in the complexity of social change
processes (pp. 1–79). The Hague.■ Ellis, J. (n.d.). Measuring social value : avoiding a methodological straightjacket (pp. 1–5). London.■ Ellis, J. (2009). The case for an outcomes focus, (September).■ Ellis, J., Parkinson, D., & Wadia, A. (2011). Making Connections (p. 45). London, UK.■ Forbes, D. P. (1998). Measuring the Unmeasurable: Empirical Studies of Nonprofit Organization Effectiveness from 1977 to
1997. Nonprofit and Voluntary Sector Quarterly, 27(2), 183–202. doi:10.1177/0899764098272005■ Gair, C. (2005). A report from the good ship SROI. San Francisco: The Roberts Foundation, 1–15. Retrieved from http://www.
redf.org/system/files/%282%29+A+Report+from+the+Good+Ship+SROI.pdf■ Gasper, D. E. S. (2000). Evaluating the “Logical Framework Approach” Towards Learning-Oriented Development Evaluation.
Public Administration and Development, 20, 17–28.■ Hailey, J., James, R., & Wrigley, R. (2005). Rising to the Challenges : Assessing the Impacts of Organisational Capacity
Building.■ Hanley, N., Wright, R. E., & Adamowicz, V. I. C. (1998). Using Choice Experiments to Value the Environment. Environmental
and Resource Economics, 11(3-4), 413–428.■ Helitzer, D., Hollis, C., De Hernandez, B. U., Sanders, M., Roybal, S., & Van Deusen, I. (2010). Evaluation for community-
based programs: the integration of logic models and factor analysis. Evaluation and program planning, 33(3), 223–33.
doi:10.1016/j.evalprogplan.2009.08.005■ Hwang, H., & Powell, W. W. (2009). The Rationalization of Charity: The Influences of Professionalism in the Nonprofit Sector.
Administrative Science Quarterly, 54(2), 268–298. doi:10.2189/asqu.2009.54.2.268

28 of 32
■ James, C. (2011). Theory of Change Review: A report commissioned by Comic Relief (pp. 1–39).■ John, R. (2006). Venture Philanthropy: The Evolution of High Engagement Philanthropy in Europe.■ Jones, B. H., & Hearn, S. (2009). Outcome Mapping: a realistic alternative for planning, monitoring and evaluation (pp. 1–4).■ Julian, D. A., Jones, A. N. N., & Deyo, D. (1995). Open Systems Evalusation and the Logic Model: Program Planning and
Evaluation Tools. Evaluation and Program Planning, 18(4), 333–341.■ Kaplan, R. S., & Norton, D. P. (1992). The Balanced Scorecard – Measures that Drive Performance The Balanced Scorecard —
Measures. Harvard Business Review, 70(1), 71–79.■ Karoly, L. A. (2008). Valuing Benefits in Benefit-Cost Studies of Social Programs. RAND Corporation.■ Klose, T. (1999). The contingent valuation method in health care. Health policy (Amsterdam, Netherlands), 47(2), 97–123.
Retrieved from http://www.ncbi.nlm.nih.gov/pubmed/10538292■ Lyon, F., & Arvidson, M. (2009). Social impact measurement as an entrepreneurial process.■ MacIndoe, H., & Barman, E. (2012). How Organizational Stakeholders Shape Performance Measurement in Nonprofits:
Exploring a Multidimensional Measure. Nonprofit and Voluntary Sector Quarterly. doi:10.1177/0899764012444351■ McLaughlin, J. a., & Jordan, G. B. (1999). Logic models: a tool for telling your programs performance story. Evaluation and
Program Planning, 22(1), 65–72. doi:10.1016/S0149-7189(98)00042-1■ Miller, S. (2010). Understanding impact in social and personal context : making a case for life stories in volunteering research
NCVO/VSSN. Paper Presented at the NCVO/VSSN Researching the Voluntary Sector Conference at Leeds University (pp. 1–7).■ Mistry, S. (2007). How does one voluntary organisation engage with multiple stakeholder views of effectiveness ?■ Moody, M. (2008). “Building a Culture”: The Construction and Evolution of Venture Philanthropy as a New Organizational
Field. Nonprofit and Voluntary Sector Quarterly, 37(2), 324–352. doi:10.1177/0899764007310419■ Moore, M. H. (2000). Managing for Value: Organizational Strategy in for-Profit, Nonprofit, and Governmental Organizations.
Nonprofit and Voluntary Sector Quarterly, 29(1), 183–204. doi:10.1177/089976400773746391■ Moore, M. H. (2003). The Public Value Scorecard: A Rejoinder and an Alternative to “Strategic Performance Measurement and
Management in Non-Profit Organizations” by Robert Kaplan.■ New Zealand Institute of Economic Research. (2012). Benefits of Community Law: Indicative CBA of CLCs (p. 31). Wellington,
New Zealand.■ Nicholls, J., Lawlor, E., Neitzert, E., & Goodspeed, T. (2012). A guide to Social Return on Investment. http://www.
thesroinetwork.org/publications/doc_details/241-a-guide-to-social-return-on-investment-2012 (2nd ed.). London: Cabinet
Office. Retrieved from http://www.thesroinetwork.org/publications/doc_details/241-a-guide-to-social-return-on-investment-2012■ Ostrander, S. a. (2007). The Growth of Donor Control: Revisiting the Social Relations of Philanthropy. Nonprofit and Voluntary
Sector Quarterly, 36(2), 356–372. doi:10.1177/0899764007300386■ Pidd, M. (2005). Perversity in public service performance measurement. International Journal of Productivity and Performance
Management, 54(5/6), 482–493.■ Polonsky, M., & Grau, S. L. (2011). Assessing the social impact of charitable organizations — four alternative approaches.
International Journal of Nonprofit and Voluntary Sector Marketing, 211(May), 195–211. doi:10.1002/nvsm■ Power, M. (1997). The Audit Explosion. In G. Mulgan (Ed.), Life after politics (pp. 286–293). London: Fontana.■ Quezada, L. E., Cordova, F. M., Palominos, P., Godoy, K., & Ross, J. (2009). Method for identifying strategic objectives in
strategy maps. International Journal of Production Economics, 122(1), 492–500. doi:10.1016/j.ijpe.2009.06.019■ Ready, R. C., Berger, M. C., & Blomquist, G. C. (1997). Measuring Amenity Benefits from Farmland : Hedonic Pricing vs .
Contingent Valuation. Growth and Change, 28(June), 438–458.■ Reisman, J., & Gienapp, A. (2004). Theory of Change : A Practical Tool For Action , Results and Learning.■ Rice, D. P. (2000). Cost of illness studies: what is good about them? Injury Prevention, 6(3), 177–179. doi:10.1136/
ip.6.3.177■ Rogers, P. J. (2008). Using Programme Theory to Evaluate Complicated and Complex Aspects of Interventions. Evaluation,
14(1), 29–48. doi:10.1177/1356389007084674■ Roper, L., & Pettit, J. (2002). Development and the Learning Organisation : An introduction. Development in Practice, 12(2-3),
258–271.■ Speckbacher, G. (2003). The Economics of Performance Management. Nonprofit Management and Leadership, 13(3),
267–281.■ Suarez, D. F. (2010). Collaboration and Professionalization : The Contours of Public Sector Funding for Nonprofit Organizations.
Journal of Public Administration Research and Theory, 21, 307–326. doi:10.1093/jopart/muq049■ Throsby, D. (2003). Determining the value of cultural goods: How much (or how little) does contingent valuation tell us?
Journal of Cultural Economics, 27, 275–285. Retrieved from http://www.springerlink.com/index/W830487216772346.pdf■ Tuan, M. (2008). Measuring and/or estimating social value creation: Insights into eight integrated cost approaches. Final
Paper. Bill and Melinda Gates Foundation. …. Retrieved from http://www.gatesfoundation.org/learning/Documents/WWL-report-
measuring-estimating-social-value-creation.pdf■ Tyrvbinen, L. (1997). The amenity value of the urban forest : an application of the hedonic pricing method. Landscape and
Urban Planning, 37, 211–222.

29 of 32
■ Venkatachalam, L. (2004). The contingent valuation method: a review. Environmental Impact Assessment Review, 24(1),
89–124. doi:10.1016/S0195-9255(03)00138-0■ Vogel, I. (2012). Review of the use of “ Theory of Change ” in international development (pp. 1–83).■ W.K. Kellogg Foundation. (1998). Logic Model Development Guide.■ Weiss, C. H. (1997). How Can Theory-Based Evaluation Make Greater Headway? Evaluation Review, 21(4), 501–524.
doi:10.1177/0193841X9702100405■ Willetts, J., & Crawford, P. (2007). The most significant lessons about the Most Significant Change technique. Development in
Practice, 17(3), 367–379. doi:10.1080/09614520701336907■ Ógáin, E. N., Lumley, T., & Pritchard, D. (2012). Making an Impact: Impact measurement among charities and social
enterprises (p. 73). London, UK.
30 of 32
GLOSSARY
Activities – What an organisation does with its inputs in order to achieve its mission. It could be training, counselling advice, or
material provision of some sort.
Attribution – An assessment of how much of an outcome was caused by an organisation.
Averting Cost Method – A revealed preference valuation technique that measures the value of a nonmarket good by looking at
preventative expenditures incurred to mitigate the negative effects of a decrease in its quality or the lack of access to it.
Balanced Scorecard – A private sector performance management tool that tracks measures from four financial and nonfinancial
perspectives that are linked to an organisation’s strategy. The four perspectives are financial, customer, internal process and
learning and growth perspectives.
Benefit-Cost Analysis – An economic framework that involves quantifying all the costs and benefits associated with a given
intervention to determine its net benefit to society. A benefit-cost ratio is equal to the net present value of benefit/net present
value of cost.
Boundary Partner – An individual, group or organisations with whom a programme interacts directly and with whom the
programme can anticipate opportunities for influence. This concept is specific to Outcome Mapping, which specifically tracks
behavioural changes of boundary partners.
Choice Experiments – A survey-based nonmarket valuation technique where respondents sequentially choose between alternative
sets of choices. The value of a nonmarket good is inferred by observing the tradeoffs made between the levels of the attributes in
the different alternatives.
Contingent Valuation – A survey-based valuation technique that find the value of a nonmarket good or service by directly asking
respondents to estimate their personal willingness to pay for nonmarket goods or service.
Cost of Illness – A revealed preference valuation technique usually used in the health sector to measure the direct costs of a
health problem. This cost can be used to justify interventions or value outcomes of programmes working toward preventing or
treating the illness.
Deadweight – A measure of the amount of outcome that would have happened even if the activity had not taken place.
Displacement – An assessment of how much of the outcome has displaced other outcomes.
Drop-off – The deterioration of an outcome over time.
Experimental Methods – Measures the impact of a programme by finding the difference in outcomes between a randomly
selected control group and programme participants. It is considered the gold standard’ of impact measurement, as it finds the
counterfactual.
Financial Proxy – An approximation of value where an exact measure is impossible to obtain.
Hedonic Pricing – Arevealed preference valuation method compares market transactions for goods or services whose price differs
primarily because of the influence of the nonmarket good or service that is of interest. It is mostly used to estimate value of
environmental goods using housing prices.
Impact – All changes resulting from an activity, project or organisation. It includes intended as well as unintended effects,
negative as well as positive, and long-term as well as short-term.
Impact Map – A table that captures how an activity makes a difference: that is, how it uses its resources to provide activities that
then lead to particular outcomes for different stakeholders.
Inputs – The resources that contribute to a programme or activity, including income, staff, volunteers and equipment.

31 of 32
Life Story Approach – A qualitative research method that explores the impact of a programme by privileging participant’s personal
narratives and life stories in order to better understand the multidimensional and dynamic nature of personal change.
Logical Framework – A planning and evaluation tool using in international development usually presenting in matrix format. It
contains a description of a programme’s logic, how progress at each level will be assess, and the external conditions that need to
be fulfilled for objectives to be achieved as planned.
Market good – A good that is bought and sold directly in a market situation, and thus their value can be directly observed.
Mission – Defines the fundamental purpose of an organisation, succinctly describing why it exists and what it does to achieve
its vision.
Most Significant Change – A qualitative, participatory evaluation technique that involves collecting stories about most significant
change from the field, and then using the organisational hierarchy to filter and select the most successful stories.
Nonmarket good – A good that does not have an observable monetary value as it is not bought and sold directly in a
market situation.
Non-use value – Refers to the value people assign to a good even if they do not intend to use it directly. Value may be placed on
having others use it, maintaining it for the use of future generations, or simply the value placed on its existence.
Outcomes – The benefits or changes for intended beneficiaries. They tend to be less tangible and therefore less countable than
outputs. Outcomes are usually planned and are therefore set out in an organisation’s objectives.
Outcome Mapping – Outcome Mapping is an integrated planning, monitoring, and evaluation approach developed by the IDRC
that focuses on tracking and monitoring the behavioural changes of partners that an organisation works with and influences
directly. However, an outcome map is also simple a map that demonstrates links between outcomes.
Outputs – The countable units that are the direct products of a programme or organisation’s activities. They could be classes
taught, training courses delivered or people attending workshops, qualifications awarded, jobs placed. In themselves they are not
the ultimate objectives of the organisation.
Payback period – Time in months or years for the value of the impact to exceed the investment.
Public Value Scorecard – A performance management tool inspired by the Balanced Scorecard, but embodying Mark Moore’s
concept of public value strategy. It tracks measures related to a ‘strategic triangle’ of public value creation including mission,
building operational capacity and expanding authorisation and support for mission.
Quasi-Experimental Methods – Measures the impact of a programme by finding the difference in outcomes between a comparison
group and programme participants. It is considered less reliable than experimental methods because here may be selection bias
in the construction of a comparison group.
Replacement Value – A revealed preference valuation technique that measures the value of a nonmarket good by finding the cost
of replacing it using a market good.
Social Return on Investment – A framework for measuring the financial value of an organisation’s impact relative to the
resources invested.
Scope – The activities, timescale, boundaries and type of an analysis.
Sensitivity Analysis – Process by which the sensitivity of an SROI model to changes in different variables is assessed.
Stakeholders – Individuals, organisations or entities that experience change,whether positive or negative, as a result of the activity
that is being analysed.
Strategy Map – A visual framework depicting the logical, causal relationships between different objectives for each perspective of
a Balanced Scorecard. This tool can be use to help identify any measures that are not quite aligned with the overall strategy.
32 of 32
Theory of Change – A wide range of outcome-based, participatory approaches for impact planning, evaluation, and organisational
capacity-building influenced by theory-based evaluation and social change fields of study. It is a flexible tool that explores and
assesses how an organisation or project achieves change, or how change happens more broadly to identify how an organisation
can contribute to change. These approaches usually assess impact by mapping outcomes, developing indicators, identifying
interventions, and identifying assumptions of how change happens.
Travel Cost Method – Travel cost method derives the value of a nonmarket programme or service by finding the time and travel
costs that people incur to use it. It is mostly used to value outdoor recreational activities.
Total economic value – The sum of use and non- use value of a good
Use value – Value people derive from direct use of a good.
Valuation – The process of determining the economic value of a good.
Venture philanthropy – The application of concepts and techniques from venture capital finance for the achievement of
philanthropic goals.
Vision – Outlines what the organisation wants to be, or how it wants the world in which it operates to be. It is a long-term view
and concentrates on the future.