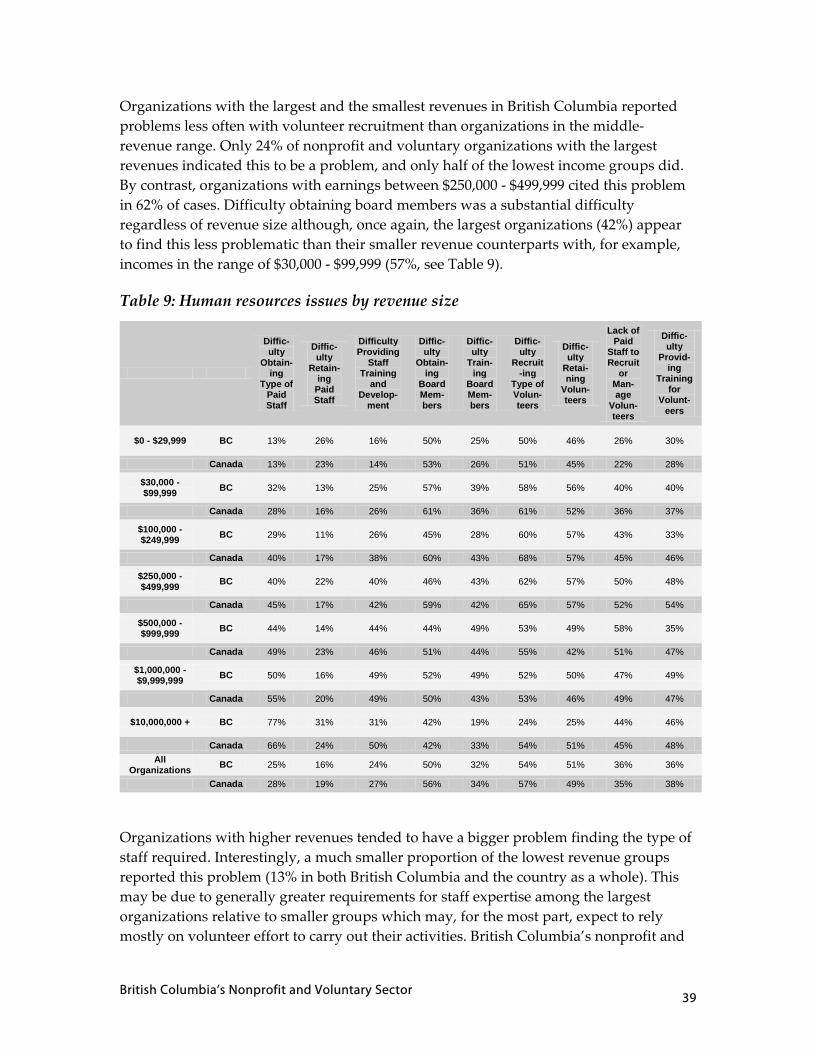
the nonprofit and voluntary sector in british columbia · the nonprofit and voluntary sector in ......
TRANSCRIPT
Regional Highlights of the National Survey of Nonprofit and Voluntary Organizations
The Nonprofit and Voluntary
Sector in British Columbia
Author:
Vic Murray
© Imagine Canada, 2006 Copyright for The Nonprofit and Voluntary Sector in British Columbia: Regional Highlights from the National Survey of Nonprofit and Voluntary Organizations is waived for charitable and nonprofit organizations for non‐commercial use. All charitable and nonprofit organizations are encouraged to copy and distribute this document, with proper acknowledgement to the author and Imagine Canada. For more information about Imagine Canada’s Research Program, please visit www.imaginecanada.ca. Imagine Canada 425 University Avenue, Suite 900 Toronto, Ontario Canada M5G 1T6 Tell: 416.597.2293 / 1.800.263.1178 Fax: 416.597.2294 [email protected] ISBN: 1-55401-186-8 This research was supported by funding from the Voluntary Sector Initiative (VSI) through the Social Development Partnerships Program of Social Development Canada (SDC). The views expressed in this publication do not necessarily reflect those of the Government of Canada.
The Nonprofit and Voluntary Sector in British Columbia Regional Highlights from the National Survey of Nonprofit and Voluntary Organizations By Vic Murray School of Public Administration, University of Victoria
British Columbia’s Nonprofit and Voluntary Sector i
Table of Contents Table of Contents............................................................................................................. i
List of Figures ..................................................................................................................ii
List of Tables...................................................................................................................iv
Executive Summary ........................................................................................................ v
Introduction ..................................................................................................................... 1
Methodology.................................................................................................................... 2
Key Characteristics of the Sector ................................................................................. 3
How many nonprofit and voluntary organizations are there? ............................. 3 What do organizations do?......................................................................................... 3 Who do British Columbia’s organizations serve? ................................................... 5 Who benefits most?...................................................................................................... 6
Financial Resources ........................................................................................................ 8
The distribution of revenues ...................................................................................... 9 How do organizations generate revenue?.............................................................. 11 Revenue patterns by sub‐sector ............................................................................... 13 Revenue sources by organization size .................................................................... 16 Donations of goods and services ............................................................................. 17 Revenue transfers....................................................................................................... 17 Have revenues changed over time? ........................................................................ 18 Which sources of revenue changed most? ............................................................. 19
Human Resources ......................................................................................................... 20
Volunteers ................................................................................................................... 21 Paid Staff ..................................................................................................................... 23 Have volunteering and staffing levels changed? .................................................. 26
Organizational Capacity Challenges......................................................................... 33
External funding problems....................................................................................... 34 Human Resources and Structural Capacity Problems ......................................... 38 Capacity problems and revenue size ...................................................................... 38 Organizational capacity and source of revenue dependence.............................. 40 Human resource capacity challenges and activity area ....................................... 41 Structural capacity problems and area of activity................................................. 43
Conclusions.................................................................................................................... 45
British Columbia’s Nonprofit and Voluntary Sector ii
List of Figures Figure 1: Percentage of organizations and number of organizations per 100,000
population by region ................................................................................................ 3 Figure 2: Percentage of organizations by primary activity area ............................... 4 Figure 3: Main geographic areas served....................................................................... 5 Figure 4: Population served............................................................................................ 6 Figure 5: Membership composition............................................................................... 7 Figure 6: Primary beneficiaries of services or products ............................................. 7 Figure 7: Percentage of organizations and percentage of total revenues by
primary activity area................................................................................................. 9 Figure 8: Percentage of organizations and percentage of total revenues by
revenue size, excluding Hospitals, Universities and Colleges ......................... 10 Figure 9: Revenue dependency by region .................................................................. 13 Figure 10: Percentage of total number of organizations and percentage of total
donation value by primary activity area.............................................................. 14 Figure 11: Sources of revenue by primary activity area........................................... 15 Figure 12: Sources of government revenue by revenue size, excluding Hospitals,
Universities and Colleges....................................................................................... 16 Figure 13: Reported change in revenues over the past three years by region ...... 19 Figure 14: Reported change in revenues over the past three years by revenue
dependency .............................................................................................................. 20 Figure 15: Percentage of organizations, percentage of volunteers, and percentage
of paid staff by region............................................................................................. 21 Figure 16: Percentage of organizations by number of volunteers .......................... 22 Figure 17: Percentage of organizations and percentage of volunteers by primary
activity area .............................................................................................................. 23 Figure 18: Percentage of organizations and paid staff by revenue size ................. 25 Figure 19: Percentage of organizations and paid staff by primary activity area.. 26 Figure 20: Reported change in volunteers over the past three years by region.... 27 Figure 21: Reported change in volunteers over the past three years by number of
volunteers ................................................................................................................. 28 Figure 22: Reported change in volunteers over the past three years by reported
change in revenues.................................................................................................. 29 Figure 23: Reported change in paid staff over the past three years by region...... 30 Figure 24: Reported change in paid staff over the past three years by number of
paid staff ................................................................................................................... 31 Figure 25: Reported change in paid staff over the past three years by reported
change in revenues.................................................................................................. 32
British Columbia’s Nonprofit and Voluntary Sector iii
Figure 26: Reported change in volunteers over the past three years by reported change in paid staff ................................................................................................. 32
British Columbia’s Nonprofit and Voluntary Sector iv
List of Tables Table 1: Detailed sources of revenue, excluding Hospitals, Universities and
Colleges..................................................................................................................... 12 Table 2: Approximate value of in‐kind donations received by organizations...... 17 Table 3: Percentage of organizations that transferred or disbursed funds............ 18 Table 4: Value of amounts transferred or disbursed ................................................ 18 Table 5: Number of paid staff....................................................................................... 24 Table 6: External funding issues by primary activity area....................................... 35 Table 7: Financial issues by primary activity area .................................................... 37 Table 8: External funding issues by revenue size...................................................... 38 Table 9: Human resources issues by revenue size .................................................... 39 Table 10: External funding issues by revenue dependency..................................... 40 Table 11: Human resources issues by revenue dependency ................................... 41 Table 12: Human resources issues by primary activity area ................................... 42 Table 13: Structural issues by primary activity area ................................................. 44
British Columbia’s Nonprofit and Voluntary Sector v
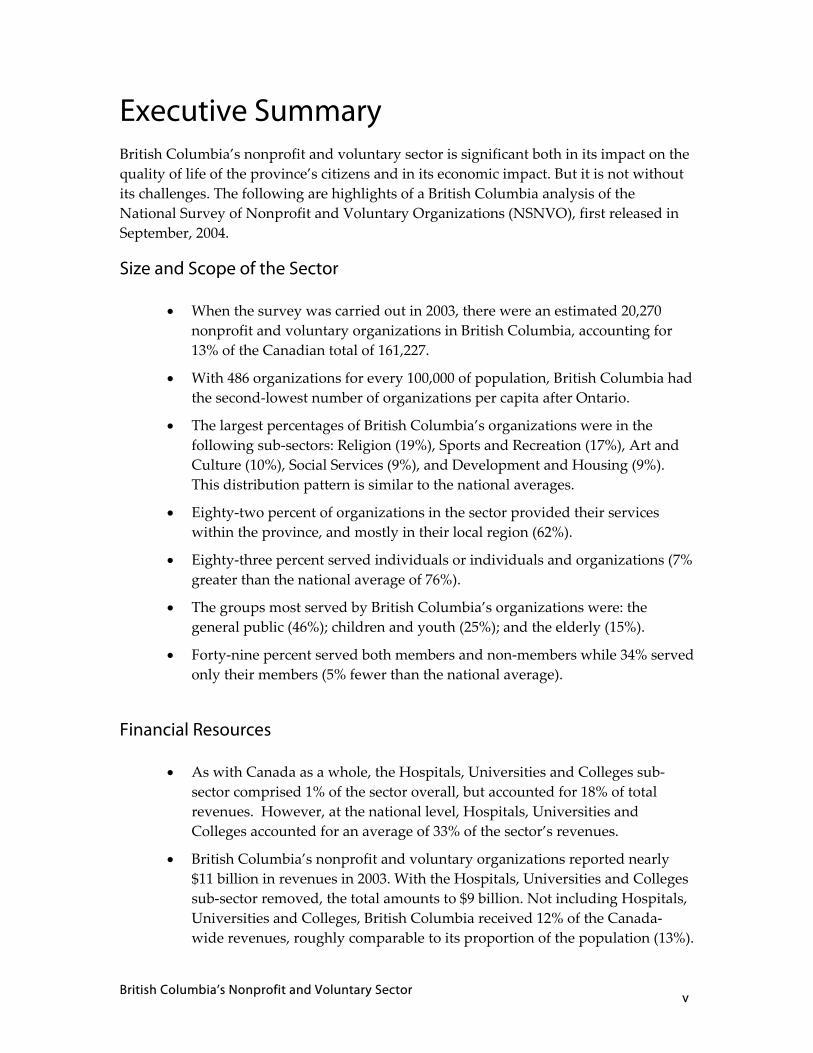
Executive Summary British Columbia’s nonprofit and voluntary sector is significant both in its impact on the quality of life of the province’s citizens and in its economic impact. But it is not without its challenges. The following are highlights of a British Columbia analysis of the National Survey of Nonprofit and Voluntary Organizations (NSNVO), first released in September, 2004.
Size and Scope of the Sector
• When the survey was carried out in 2003, there were an estimated 20,270 nonprofit and voluntary organizations in British Columbia, accounting for 13% of the Canadian total of 161,227.
• With 486 organizations for every 100,000 of population, British Columbia had the second‐lowest number of organizations per capita after Ontario.
• The largest percentages of British Columbia’s organizations were in the following sub‐sectors: Religion (19%), Sports and Recreation (17%), Art and Culture (10%), Social Services (9%), and Development and Housing (9%). This distribution pattern is similar to the national averages.
• Eighty‐two percent of organizations in the sector provided their services within the province, and mostly in their local region (62%).
• Eighty‐three percent served individuals or individuals and organizations (7% greater than the national average of 76%).
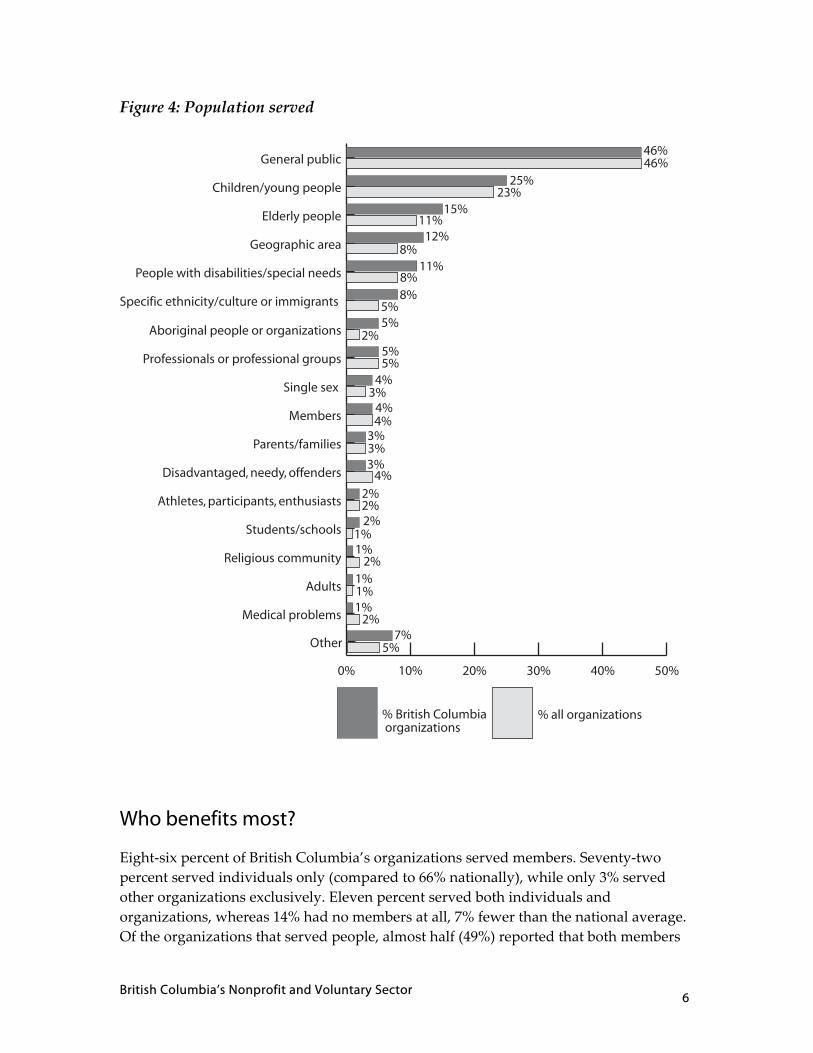
• The groups most served by British Columbia’s organizations were: the general public (46%); children and youth (25%); and the elderly (15%).
• Forty‐nine percent served both members and non‐members while 34% served only their members (5% fewer than the national average).
Financial Resources
• As with Canada as a whole, the Hospitals, Universities and Colleges sub‐sector comprised 1% of the sector overall, but accounted for 18% of total revenues. However, at the national level, Hospitals, Universities and Colleges accounted for an average of 33% of the sector’s revenues.
• British Columbia’s nonprofit and voluntary organizations reported nearly $11 billion in revenues in 2003. With the Hospitals, Universities and Colleges sub‐sector removed, the total amounts to $9 billion. Not including Hospitals, Universities and Colleges, British Columbia received 12% of the Canada‐wide revenues, roughly comparable to its proportion of the population (13%).
British Columbia’s Nonprofit and Voluntary Sector vi
This is similar to Ontario which received 39% of revenues and contained 39% of the population.
• Besides Hospitals, Universities and Colleges, several other sub‐sectors received large revenue shares: Health organizations representing 4% of the total received 24% of the revenues and Research and Education, comprising 7%, received 14% of the revenues. Conversely, the Religion sub‐sector, accounting for 19% of organizations, received 8% of the revenues while Sports and Recreation, with 17% of organizations, receiving 4% of revenues.
• British Columbia’s nonprofit and voluntary organizations received revenues from government sources, earned income, and grants and donations in proportions that were very similar to the national averages.
• Of the organizations that received 50% or more of their revenues from a single source, only 12% of organizations in British Columbia were primarily dependent on government, less than the national average of 17%, and similar to Alberta and Ontario. The majority (51%) were primarily dependent on earned income (Figure 9).
• The sub‐sectors most dependent on government were Health (77%), Education and Research (66%), and Social Services (59%).
• The sub‐sectors most dependent on donations and grants were Religion (67% of its income came from this source), International Aid (61%), and Environment (44%). Conversely, Business or Professional Associations and Unions received only 1% of their revenues from donations and grants (Figure 11).
• Thirty‐five percent of British Columbia’s nonprofit and voluntary organizations reported increases in their revenues, while 29% reported a decrease between 2000 and 2003. Nationally, 22% of organizations reported a decline (see Figure 13).
British Columbia’s Nonprofit and Voluntary Sector vii
Human Resources
• British Columbia, with 13% of the nonprofit and voluntary organizations in Canada, had only 8% of the volunteers and 7% of the paid staff (compared, for example, to Ontario with 28% of the organizations but 40% of the volunteers and 47% of the paid staff). This is probably due to the fact that Ontario has larger‐sized organizations and more head offices serving a much larger population.
• Nearly 60% of British Columbia’s nonprofit and voluntary organizations are served by fewer than 25 volunteers.
• British Columbia’s nonprofit and voluntary organizations reported 1.5 million volunteers (includes some who volunteer for more than one organization). These volunteers contributed 114.3 million hours of work in the previous year.
• The biggest engagers of volunteers were smaller organizations and those in the Environment, Religion, and Sports and Recreation groups. Environment organizations, for example, comprised 4% of the sector in British Columbia but, attracted 19% of the volunteers. This discrepancy is far larger than any observed in other parts of Canada.
• In close agreement with the national averages, more than half (52%) reported no change in volunteer numbers over the previous three years, while 29% reported increases, and 19% reported decreases. Smaller organizations in British Columbia appeared to have more difficulty augmenting their existing numbers of volunteers than did larger ones.
• British Columbia’s nonprofit and voluntary organizations employed 147,000 people and, even though 23% of them worked in the Hospitals, Universities and Colleges sub‐sector, the remainder still made up a workforce larger than the total employment in the forestry, fishing, and mining, oil and gas extraction industries combined.1 However, 42% of that workforce was part‐time and 36% worked in temporary positions. Levels of paid staff remained the same between 2001 and 2003 for 63% of British Columbia’s organizations; 30% reported an increase and 7% reported a decrease. These percentage distributions were quite similar to the national numbers.
1 Statistics Canada (http://www40.statcan.ca/l01/cst01/labor21c.htm). It should be noted that the employment figures in this survey and those from Statistics Canada may not be strictly comparable because of differences in data collection methods. As well, the Statistics Canada numbers take no account of differences between employees working full‐time and part‐time.
British Columbia’s Nonprofit and Voluntary Sector viii
Capacity Challenges Facing British Columbia’s Nonprofit and Voluntary Organizations
• Among British Columbia’s nonprofit and voluntary organizations that received government funding, 66% reported problems with reduced funding from this source. The twin problems of funders being willing only to fund projects (55%), and unwilling to fund core operations (62%) were also conspicuous. This was the same pattern observed for the country as a whole and, indeed for most of the other regions of the country.
• The most frequently cited problem among all organizations in British Columbia was “having difficulty of planning for the future” (55% versus 58% nationally).
• The remaining problems cited by at least 50% of British Columbia’s organizations concerned volunteering. Fifty‐four percent reported having difficulty recruiting the type of volunteers needed (compared to 57% nationally); 51% reported difficulties in retaining volunteers (versus 49% nationally); and 50% cited difficulty in obtaining board members (versus 56% nationally).
• Broadly speaking, financial problems were more numerous for organizations with larger revenues, especially among those that received government funding.
• Funding concerns also tended to predominate in such sectors as Arts and Culture, Health, and Social Services while concerns involving obtaining and retaining the right volunteers were more prominent in the Sports and Recreation, Religion, and Law, Advocacy and Politics areas.
While it is clear that British Columbia’s nonprofit and voluntary sector compares favourably in most respects with Canada as a whole, it cannot be left untended. To remain strong and meet tomorrow’s challenges, the sector itself must work toward developing a stronger voice to articulate its common concerns. It is also important that those who benefit from the sector—and this includes all the province’s institutions and individuals—must become more aware of its contributions and needs. It is hoped that this report will be just the first of a continuing series that will help to accomplish this goal.
British Columbia’s Nonprofit and Voluntary Sector 1
Introduction With the publication in September 2004 of Cornerstones of Community: Highlights of the National Survey of Nonprofit and Voluntary Organizations, Canada obtained the first clear picture of the size, scope, and impact of this important sector of society. That report included some comparative glimpses of similarities and differences between the various regions of the country but did not present a detailed picture of individual regions in Canada.
This report highlights the sector in British Columbia, beginning with an overall description of its size, major activities, and populations served. The second part of this report examines the financial resources, how they are distributed, where they come from, and how they changed over the three years between 2000 and 2003. Following this, we examine the equally critical role of human resources—numbers and distributions of volunteers and paid staff and, again, how they have changed over time. Finally, this report summarizes the capacity issues that British Columbia’s nonprofit and voluntary sector organizations perceive as critical to their ability to sustain and develop their future contributions to the quality of life in British Columbia.
British Columbia’s Nonprofit and Voluntary Sector 2
Methodology NSNVO data were collected by Statistics Canada via personal interviews with 13,000 individuals representing incorporated nonprofit organizations and registered charities2 in 2003. The NSNVO defines nonprofit and voluntary organizations as:
• non‐governmental (i.e., are institutionally separate from government);
• non‐profit distributing (i.e., do not return any profits generated to their owners or directors);
• self‐governing (i.e., are independent and able to regulate their own activities);
• voluntary (i.e., they benefit to some degree from voluntary contributions of time or money); and
• formally incorporated or registered under specific legislation3 with provincial, territorial, or federal governments.
Symbols:
The following symbols have been used in this publication:
* Suppressed to meet the confidentiality requirements of the Statistics Act.
E Use with caution.
2 Registered charities are organizations that have obtained registered charitable status from the Government of Canada. 3 The NSNVO excluded grass‐roots organizations or citizens’ groups that are not formally incorporated or registered with provincial, territorial, or federal governments. It also excluded some registered charities that are considered to be public sector agencies (e.g., school boards, public libraries, and public schools)
British Columbia’s Nonprofit and Voluntary Sector 3
Key Characteristics of the Sector
How many nonprofit and voluntary organizations are there?
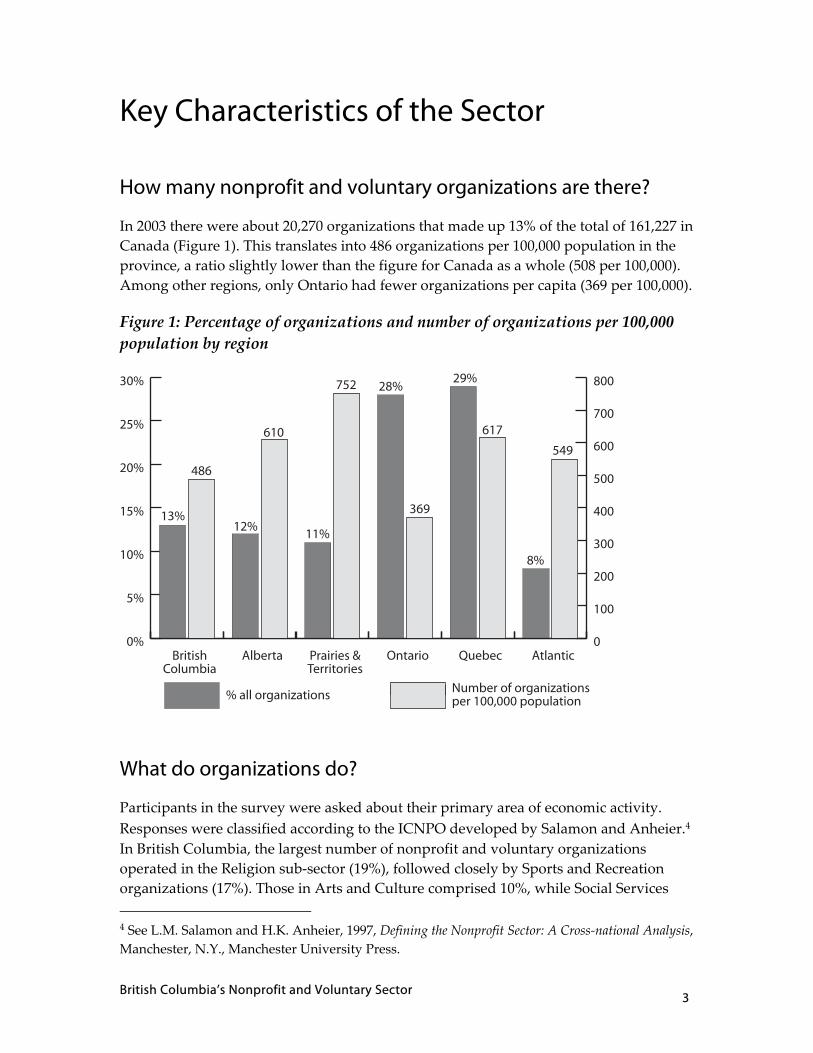
In 2003 there were about 20,270 organizations that made up 13% of the total of 161,227 in Canada (Figure 1). This translates into 486 organizations per 100,000 population in the province, a ratio slightly lower than the figure for Canada as a whole (508 per 100,000). Among other regions, only Ontario had fewer organizations per capita (369 per 100,000).
Figure 1: Percentage of organizations and number of organizations per 100,000 population by region
What do organizations do?
Participants in the survey were asked about their primary area of economic activity. Responses were classified according to the ICNPO developed by Salamon and Anheier.4 In British Columbia, the largest number of nonprofit and voluntary organizations operated in the Religion sub‐sector (19%), followed closely by Sports and Recreation organizations (17%). Those in Arts and Culture comprised 10%, while Social Services 4 See L.M. Salamon and H.K. Anheier, 1997, Defining the Nonprofit Sector: A Cross‐national Analysis, Manchester, N.Y., Manchester University Press.
0%
5%
10%
15%
20%
25%
30%
% all organizations
AtlanticQuebecOntarioPrairies &Territories
AlbertaBritishColumbia
0
100
200
300
400
500
600
700
800
Number of organizations per 100,000 population
486
610
752
369
549
617
13%12%
11%
28%29%
8%
British Columbia’s Nonprofit and Voluntary Sector 4
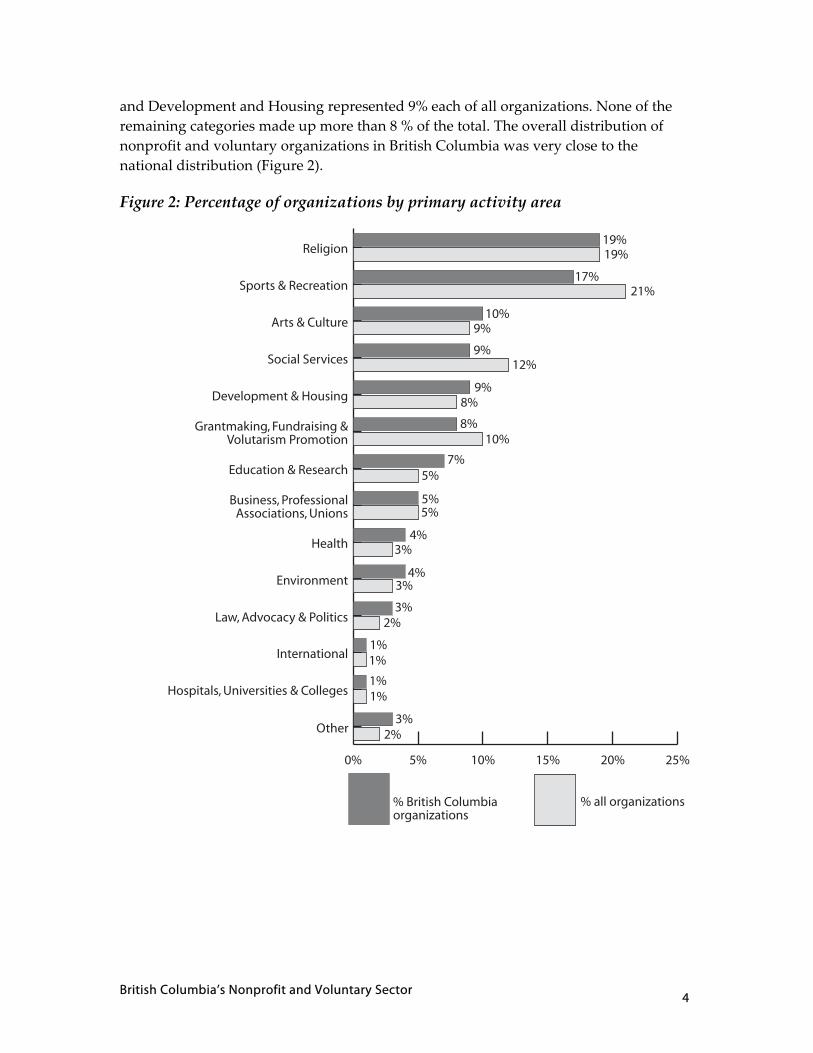
and Development and Housing represented 9% each of all organizations. None of the remaining categories made up more than 8 % of the total. The overall distribution of nonprofit and voluntary organizations in British Columbia was very close to the national distribution (Figure 2).
Figure 2: Percentage of organizations by primary activity area
0% 5% 10% 15% 20% 25%
% all organizations% British Columbiaorganizations
Hospitals, Universities & Colleges
International
Other
Law, Advocacy & Politics
Environment
Health
Business, Professional Associations, Unions
Education & Research
Grantmaking, Fundraising & Volutarism Promotion
Development & Housing
Social Services
Arts & Culture
Sports & Recreation
Religion19%19%
17%21%
10%9%
9%12%
9%8%
8%10%
7%5%
5%5%
4%3%
4%3%
3%2%
3%2%
1%1%
1%1%
British Columbia’s Nonprofit and Voluntary Sector 5
Who do British Columbia’s organizations serve?
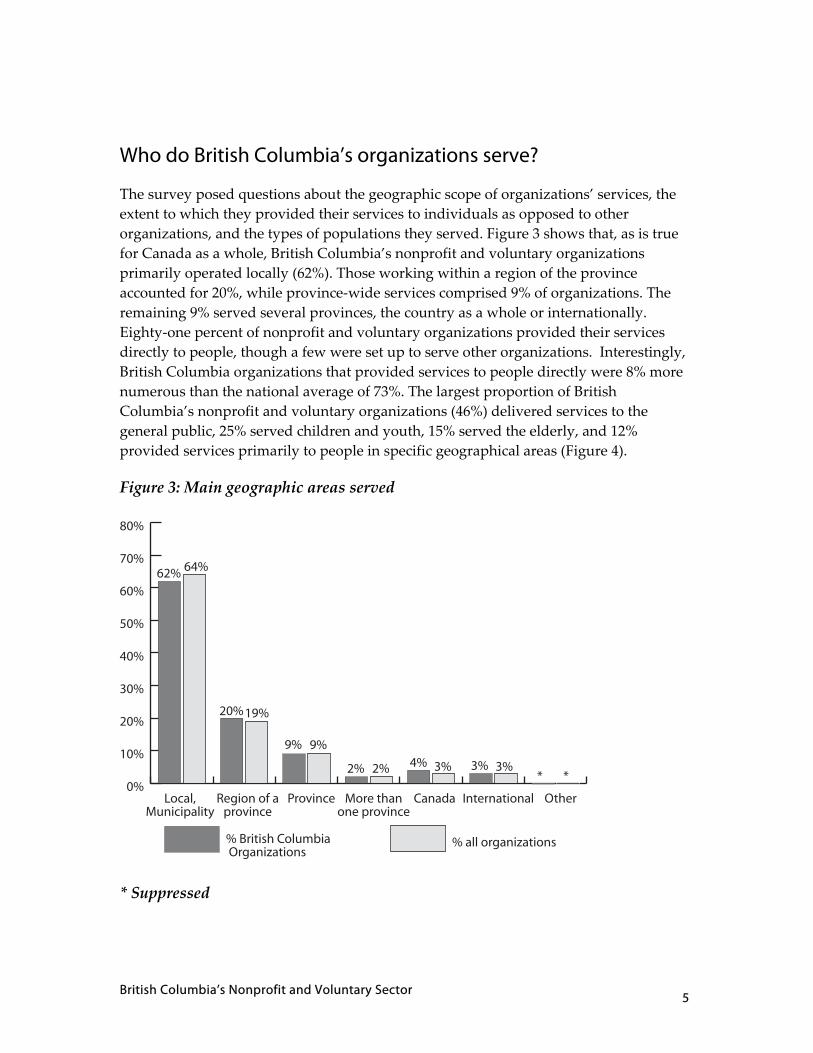
The survey posed questions about the geographic scope of organizations’ services, the extent to which they provided their services to individuals as opposed to other organizations, and the types of populations they served. Figure 3 shows that, as is true for Canada as a whole, British Columbia’s nonprofit and voluntary organizations primarily operated locally (62%). Those working within a region of the province accounted for 20%, while province‐wide services comprised 9% of organizations. The remaining 9% served several provinces, the country as a whole or internationally. Eighty‐one percent of nonprofit and voluntary organizations provided their services directly to people, though a few were set up to serve other organizations. Interestingly, British Columbia organizations that provided services to people directly were 8% more numerous than the national average of 73%. The largest proportion of British Columbia’s nonprofit and voluntary organizations (46%) delivered services to the general public, 25% served children and youth, 15% served the elderly, and 12% provided services primarily to people in specific geographical areas (Figure 4).
Figure 3: Main geographic areas served
* Suppressed
0%
10%
20%
30%
40%
50%
60%
70%
80%
% all organizations% British Columbia Organizations
64%
19%
9%
2% 3%3%
62%
20%
9%
2% 4% 3%
OtherInternationalCanadaMore than one province
ProvinceRegion of a province
Local, Municipality
* *
British Columbia’s Nonprofit and Voluntary Sector 6
Figure 4: Population served
Who benefits most?
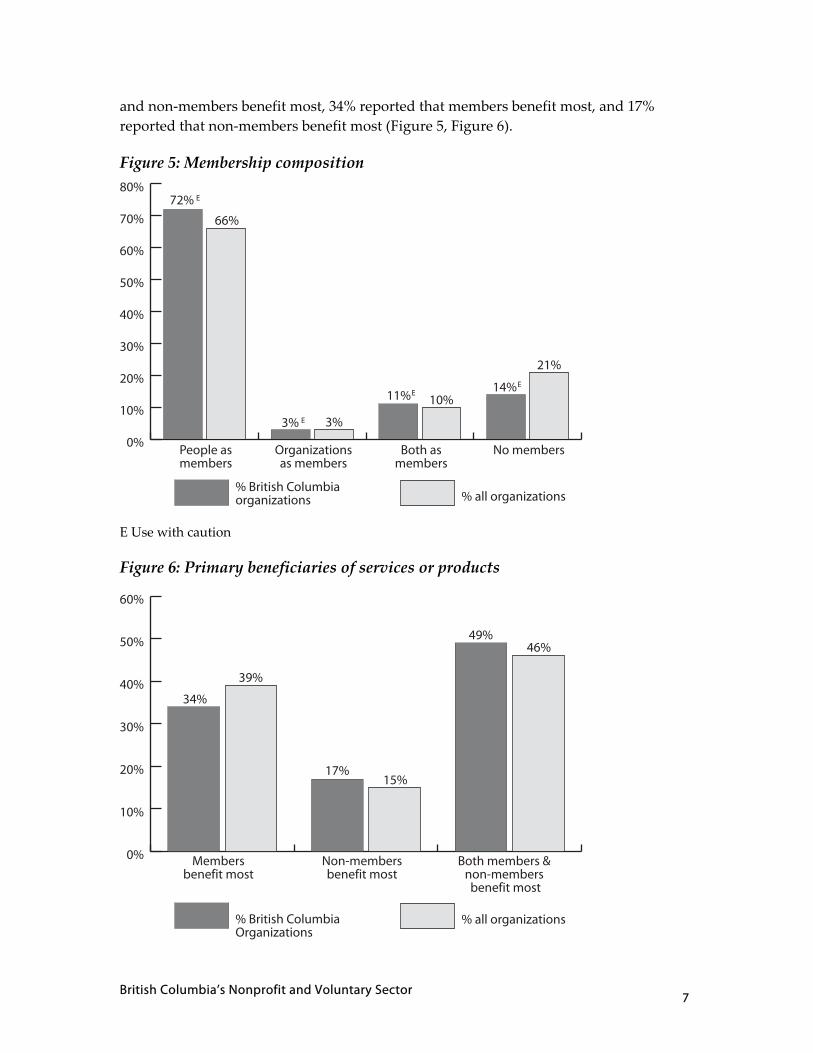
Eight‐six percent of British Columbia’s organizations served members. Seventy‐two percent served individuals only (compared to 66% nationally), while only 3% served other organizations exclusively. Eleven percent served both individuals and organizations, whereas 14% had no members at all, 7% fewer than the national average. Of the organizations that served people, almost half (49%) reported that both members
0% 10% 20% 30% 40% 50%
% all organizations% British Columbia organizations
Medical problems
Adults
Religious community
Students/schools
Athletes, participants, enthusiasts
Disadvantaged, needy, offenders
Parents/families
Members
Single sex
Professionals or professional groups
Aboriginal people or organizations
Other
Specific ethnicity/culture or immigrants
People with disabilities/special needs
Geographic area
Elderly people
Children/young people
General public46%46%
25%23%
15%11%
12%8%
11%8%8%
5%
7%5%
5%2%
5%5%
4%3%
4%4%
3%3%3%
4%2%
2%1%1%
2%1%1%1%
2%
2%
British Columbia’s Nonprofit and Voluntary Sector 7
and non‐members benefit most, 34% reported that members benefit most, and 17% reported that non‐members benefit most (Figure 5, Figure 6).
Figure 5: Membership composition
E Use with caution Figure 6: Primary beneficiaries of services or products
0%
10%
20%
30%
40%
50%
60%
% all organizations% British ColumbiaOrganizations
34%
39%
17%15%
49%46%
Both members & non-members benefit most
Non-members benefit most
Members benefit most
0%
10%
20%
30%
40%
50%
60%
70%
80%
% all organizations% British Columbia organizations
No membersBoth as members
Organizations as members
People as members
72%
66%
3% 3%
11% 10%14%
21%
E
E
EE
British Columbia’s Nonprofit and Voluntary Sector 8
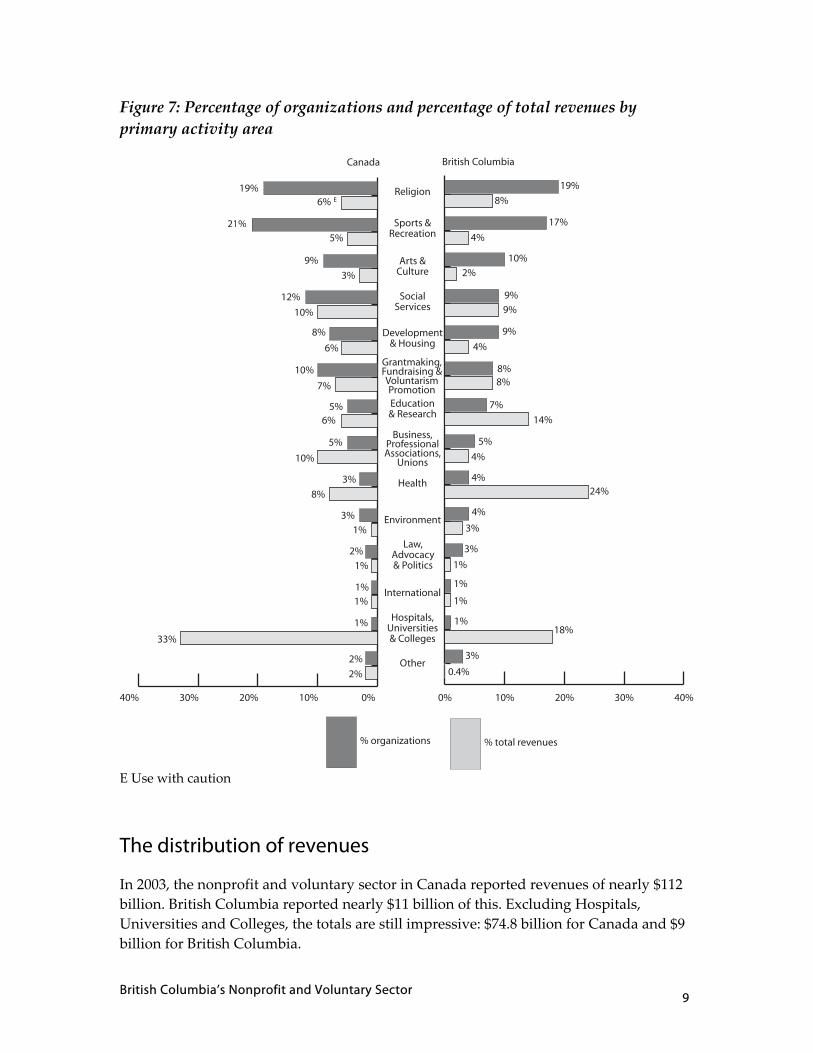
Financial Resources Cornerstones of Community provided the first comprehensive picture of the nature and extent of funding sources of nonprofit and voluntary organizations. One of the most striking findings in this area is the extent to which Hospitals, Universities and Colleges, legally constituted as nonprofit organizations yet funded primarily by government, form a unique group within the sector. While they made up just 1% of the organizations in the Canadian sector, they accounted for one‐third of its revenues. In British Columbia, Hospitals, Universities and Colleges also comprised 1% of the sector but reported only 18% of the revenue. By contrast, Hospitals, Universities and Colleges receive almost half (48%) of total funding in the combined regions of Manitoba, Saskatchewan, and the Territories, about one‐quarter of the revenues in the Atlantic provinces, and 11% of the revenues in Alberta. Why British Columbia’s Hospitals, Universities and Colleges appear to be under‐funded relative to other types of organizations is an interesting question. Health (24%) and Education and Research (14%) organizations in the province benefitted from 38% of total funding compared to only 14% nationally (see Figure 7). The pattern of health care delivery in British Columbia evidently deviates significantly from other areas of the country, with substantially greater emphasis on the provision of community‐based services as opposed to institutional care.
British Columbia’s Nonprofit and Voluntary Sector 9
Figure 7: Percentage of organizations and percentage of total revenues by primary activity area
E Use with caution
The distribution of revenues
In 2003, the nonprofit and voluntary sector in Canada reported revenues of nearly $112 billion. British Columbia reported nearly $11 billion of this. Excluding Hospitals, Universities and Colleges, the totals are still impressive: $74.8 billion for Canada and $9 billion for British Columbia.
0% 10% 20% 30% 40%
% total revenues% organizations
40% 30% 20% 10% 0%
19%6%
21%5%
9%
3%
12%
10%
8%
6%
10%
7%
5% 6%
5%
10%
3%
8%
3%
1%
2%
1%
2%
2%
1%1%
33%
1%
19%
8%
17%
4%
10%
2%
9%
9%
9%
4%
8%8%
7%
14%
5%
4%
4% 24%
4%
3%
3%
1%
3%
0.4%
1%
1%
1%18%
Hospitals, Universities & Colleges
International
Other
Law, Advocacy & Politics
Environment
Health
Business, Professional Associations,
Unions
Education & Research
Grantmaking, Fundraising & Voluntarism Promotion
Development & Housing
Social Services
Arts & Culture
Sports & Recreation
Religion
Canada British Columbia
E
British Columbia’s Nonprofit and Voluntary Sector 10
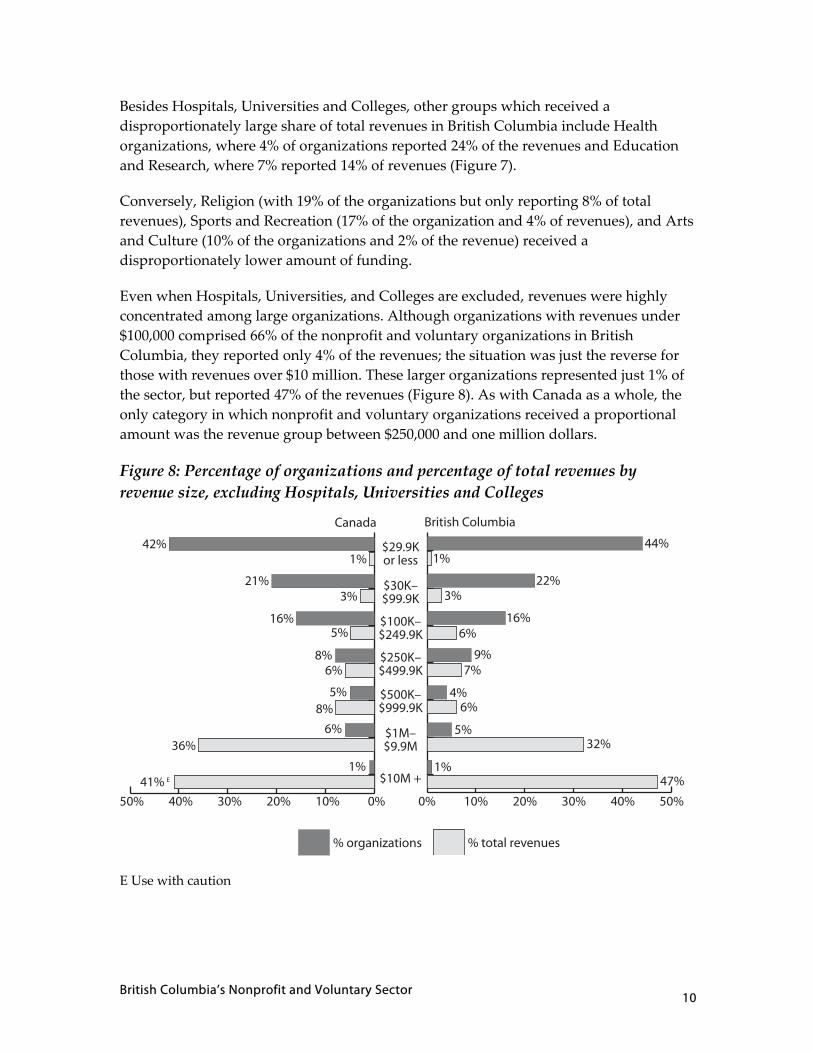
Besides Hospitals, Universities and Colleges, other groups which received a disproportionately large share of total revenues in British Columbia include Health organizations, where 4% of organizations reported 24% of the revenues and Education and Research, where 7% reported 14% of revenues (Figure 7).
Conversely, Religion (with 19% of the organizations but only reporting 8% of total revenues), Sports and Recreation (17% of the organization and 4% of revenues), and Arts and Culture (10% of the organizations and 2% of the revenue) received a disproportionately lower amount of funding.
Even when Hospitals, Universities, and Colleges are excluded, revenues were highly concentrated among large organizations. Although organizations with revenues under $100,000 comprised 66% of the nonprofit and voluntary organizations in British Columbia, they reported only 4% of the revenues; the situation was just the reverse for those with revenues over $10 million. These larger organizations represented just 1% of the sector, but reported 47% of the revenues (Figure 8). As with Canada as a whole, the only category in which nonprofit and voluntary organizations received a proportional amount was the revenue group between $250,000 and one million dollars.
Figure 8: Percentage of organizations and percentage of total revenues by revenue size, excluding Hospitals, Universities and Colleges
E Use with caution
0% 10% 20% 30% 40% 50%
% total revenues% organizations
$10M +
$1M– $9.9M
$500K– $999.9K
$250K– $499.9K
$100K– $249.9K
$30K– $99.9K
$29.9K or less
British Columbia
44%1%
22%3%
16%6%
9%7%
4%6%
5%32%
1%47%
50% 40% 30% 20% 10% 0%
Canada
42%1%
21%3%
16%5%
8%6%
5%8%
6%36%
1%41% E
British Columbia’s Nonprofit and Voluntary Sector 11
How do organizations generate revenue?
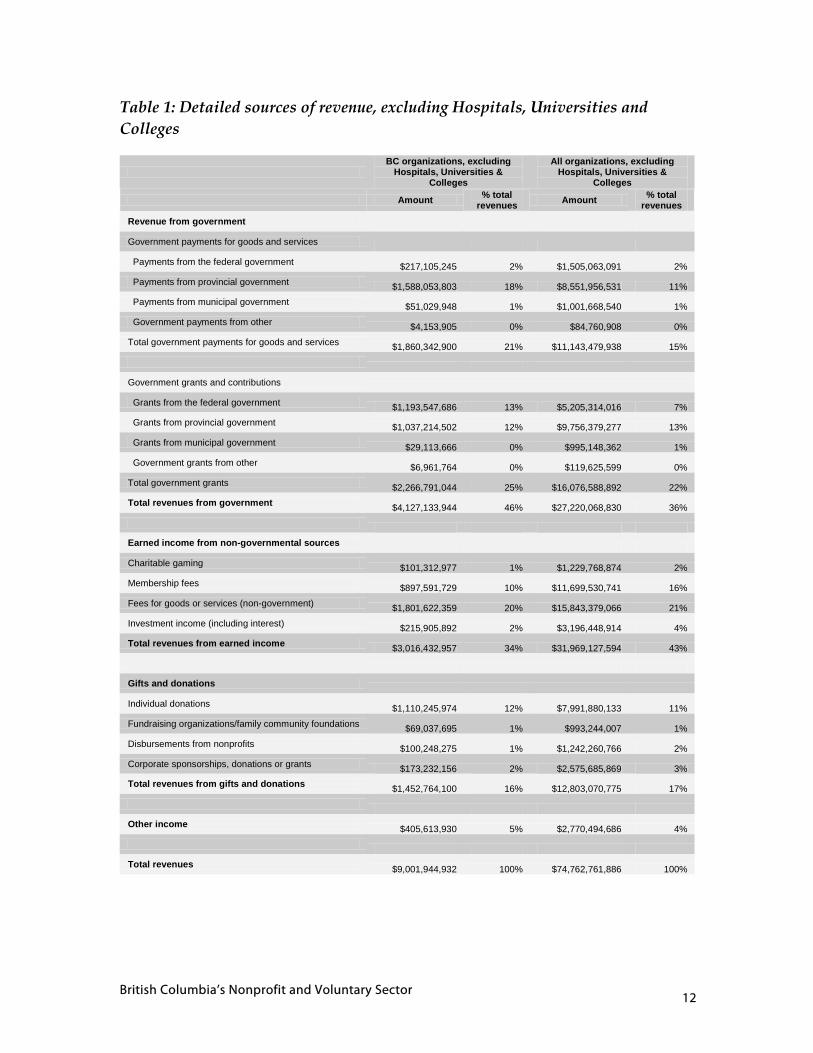
British Columbia’s organizations reported that 46% of their funding came from various government sources, 34% from earned income, 16% from gifts and donations, and 5% from other sources. By comparison, national receipts from governments were 10% lower. At the same time, receipts from earned income were 9% less than the Canadian average (see Table 1)
British Columbia’s Nonprofit and Voluntary Sector 12
Table 1: Detailed sources of revenue, excluding Hospitals, Universities and Colleges
BC organizations, excluding
Hospitals, Universities & Colleges
All organizations, excluding Hospitals, Universities &
Colleges
Amount % total revenues Amount % total
revenues Revenue from government Government payments for goods and services Payments from the federal government $217,105,245 2% $1,505,063,091 2% Payments from provincial government $1,588,053,803 18% $8,551,956,531 11% Payments from municipal government $51,029,948 1% $1,001,668,540 1% Government payments from other $4,153,905 0% $84,760,908 0% Total government payments for goods and services $1,860,342,900 21% $11,143,479,938 15% Government grants and contributions Grants from the federal government $1,193,547,686 13% $5,205,314,016 7% Grants from provincial government $1,037,214,502 12% $9,756,379,277 13% Grants from municipal government $29,113,666 0% $995,148,362 1% Government grants from other $6,961,764 0% $119,625,599 0% Total government grants $2,266,791,044 25% $16,076,588,892 22% Total revenues from government $4,127,133,944 46% $27,220,068,830 36% Earned income from non-governmental sources Charitable gaming $101,312,977 1% $1,229,768,874 2% Membership fees $897,591,729 10% $11,699,530,741 16% Fees for goods or services (non-government) $1,801,622,359 20% $15,843,379,066 21% Investment income (including interest) $215,905,892 2% $3,196,448,914 4% Total revenues from earned income $3,016,432,957 34% $31,969,127,594 43% Gifts and donations Individual donations $1,110,245,974 12% $7,991,880,133 11% Fundraising organizations/family community foundations $69,037,695 1% $993,244,007 1% Disbursements from nonprofits $100,248,275 1% $1,242,260,766 2% Corporate sponsorships, donations or grants $173,232,156 2% $2,575,685,869 3% Total revenues from gifts and donations $1,452,764,100 16% $12,803,070,775 17% Other income $405,613,930 5% $2,770,494,686 4% Total revenues $9,001,944,932 100% $74,762,761,886 100%
British Columbia’s Nonprofit and Voluntary Sector 13
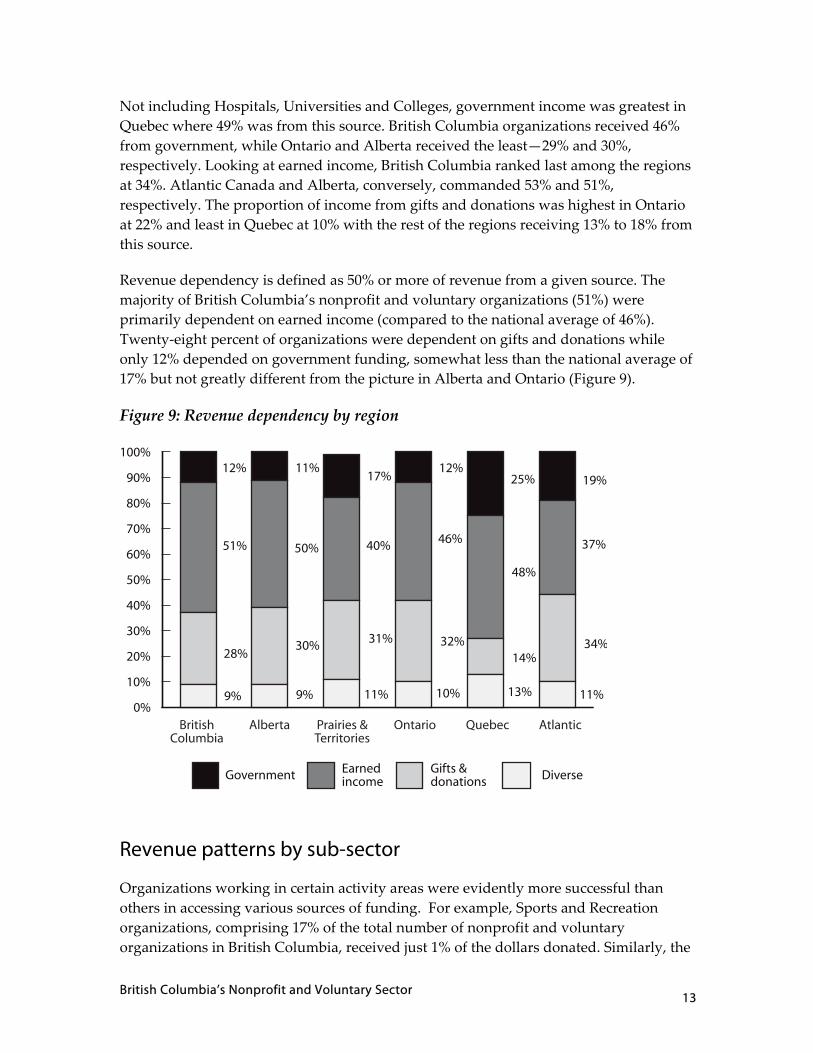
Not including Hospitals, Universities and Colleges, government income was greatest in Quebec where 49% was from this source. British Columbia organizations received 46% from government, while Ontario and Alberta received the least—29% and 30%, respectively. Looking at earned income, British Columbia ranked last among the regions at 34%. Atlantic Canada and Alberta, conversely, commanded 53% and 51%, respectively. The proportion of income from gifts and donations was highest in Ontario at 22% and least in Quebec at 10% with the rest of the regions receiving 13% to 18% from this source.
Revenue dependency is defined as 50% or more of revenue from a given source. The majority of British Columbia’s nonprofit and voluntary organizations (51%) were primarily dependent on earned income (compared to the national average of 46%). Twenty‐eight percent of organizations were dependent on gifts and donations while only 12% depended on government funding, somewhat less than the national average of 17% but not greatly different from the picture in Alberta and Ontario (Figure 9).
Figure 9: Revenue dependency by region
0%
10%
20%
30%
40%
50%
60%
70%
80%
90%
100%12%
51%
28%
9%
11%
50%
30%
9%
17%
40%
31%
11%
12%
46%
32%
10%
25%
48%
14%
13%
19%
37%
34%
11%
Government Earned income
Gifts & donations Diverse
AtlanticQuebecOntarioPrairies &Territories
AlbertaBritishColumbia
Revenue patterns by sub-sector
Organizations working in certain activity areas were evidently more successful than others in accessing various sources of funding. For example, Sports and Recreation organizations, comprising 17% of the total number of nonprofit and voluntary organizations in British Columbia, received just 1% of the dollars donated. Similarly, the
British Columbia’s Nonprofit and Voluntary Sector 14
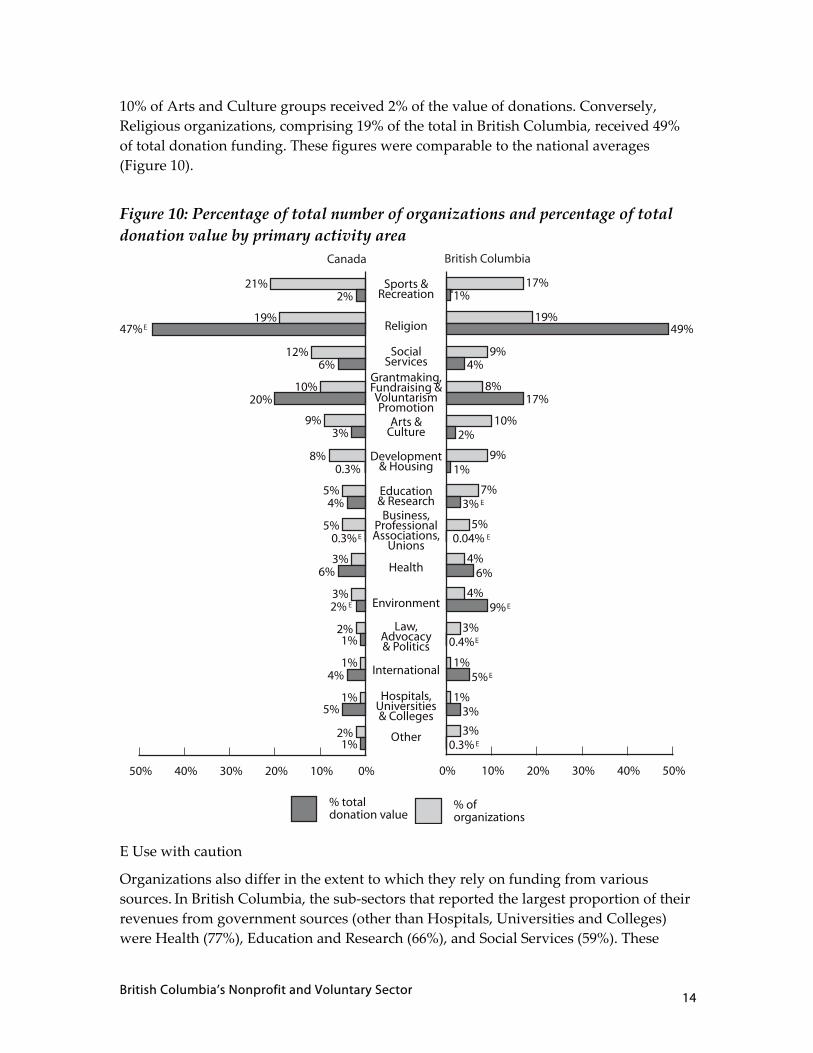
10% of Arts and Culture groups received 2% of the value of donations. Conversely, Religious organizations, comprising 19% of the total in British Columbia, received 49% of total donation funding. These figures were comparable to the national averages (Figure 10).
Figure 10: Percentage of total number of organizations and percentage of total donation value by primary activity area
E Use with caution
Organizations also differ in the extent to which they rely on funding from various sources. In British Columbia, the sub‐sectors that reported the largest proportion of their revenues from government sources (other than Hospitals, Universities and Colleges) were Health (77%), Education and Research (66%), and Social Services (59%). These
Hospitals, Universities & Colleges
International
Other
Law, Advocacy & Politics
Environment
Health
Business, Professional Associations,
Unions
Education & Research
Development & Housing
Arts & Culture
Grantmaking, Fundraising & Voluntarism Promotion
Social Services
Religion
Sports & Recreation n
50% 40% 30% 20% 10% 0%
9%3%
21%2%
5%4%
3%6%
12%6%
3%2%
8%0.3%
2%1%
10%20%
1%4%
19%47%
5%0.3%
2%1%
1%5%
0% 10% 20% 30% 40% 50%
% of organizations
% total donation value
17%1%
19%49%
9%4%
8%17%
10%2%
9%1%
7%3%
5%0.04%
4%6%
4%9%
3%0.4%
3%0.3%
1%5%
1%3%
Canada British Columbia
E
E
E
E
E
E
E
E
E
British Columbia’s Nonprofit and Voluntary Sector 15
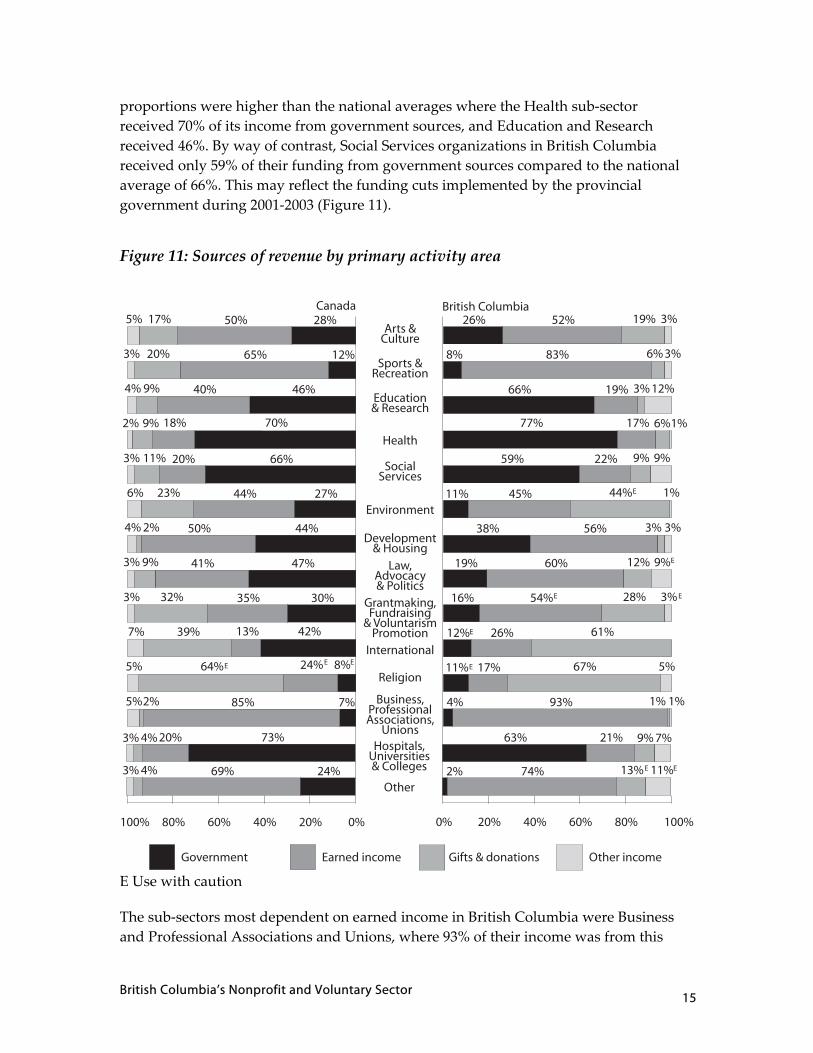
proportions were higher than the national averages where the Health sub‐sector received 70% of its income from government sources, and Education and Research received 46%. By way of contrast, Social Services organizations in British Columbia received only 59% of their funding from government sources compared to the national average of 66%. This may reflect the funding cuts implemented by the provincial government during 2001‐2003 (Figure 11).
Figure 11: Sources of revenue by primary activity area
E Use with caution
The sub‐sectors most dependent on earned income in British Columbia were Business and Professional Associations and Unions, where 93% of their income was from this
Hospitals, Universities & Colleges
Other
Business, Professional Associations,
Unions
Religion
International
Grantmaking, Fundraising
& Voluntarism Promotion
Law, Advocacy& Politics
Development & Housing
Environment
Social Services
Health
Education & Research
Sports & Recreation
Arts & Culture
100% 80% 60% 40% 20% 0%
28%50%17%5%
12%65%20%3%
46%40%9%4%
70%18%9%2%
66%20%111%3%
27%44%23%6%
44%50%2%4%
47%41%9%3%
30%35%32%3%
42%13%39%7%
8%24%64%5%
7%85%2%5%
24%69%4%3%
73%20%4%3%
0% 20% 40% 60% 80% 100%
26% 52% 19% 3%
8% 83% 6% 3%
66% 19% 3% 12%
77% 17% 6%1%
59% 22% 9% 9%
11% 45% 44% 1%
38% 56% 3% 3%
19% 60% 12% 9%
16% 54% 28% 3%
12% 26% 61%
11% 17% 67% 5%
4% 93% 1% 1%
2% 74% 13% 11%
63% 21% 9% 7%
Canada British Columbia
Gifts & donations Other incomeGovernment Earned income
E EEE
E
E E
EE
E
E
British Columbia’s Nonprofit and Voluntary Sector 16
source, and Sports and Recreation organizations (83%), Law, Advocacy and Politics (60%), Development and Housing (56%), and Grantmaking, Fundraising and Voluntarism Promotion (54% E ). All of these sub‐sectors significantly exceeded the national averages.
Organizations operating in the area of Religion were the most likely to receive their funding from gifts and donations (67%), followed by, International organizations (61%), Environment (44%E), and Grantmaking, Fundraising and Voluntarism Promotion (28%). In all but the last of these areas, nonprofit and voluntary organizations in British Columbia significantly exceeded the national averages.
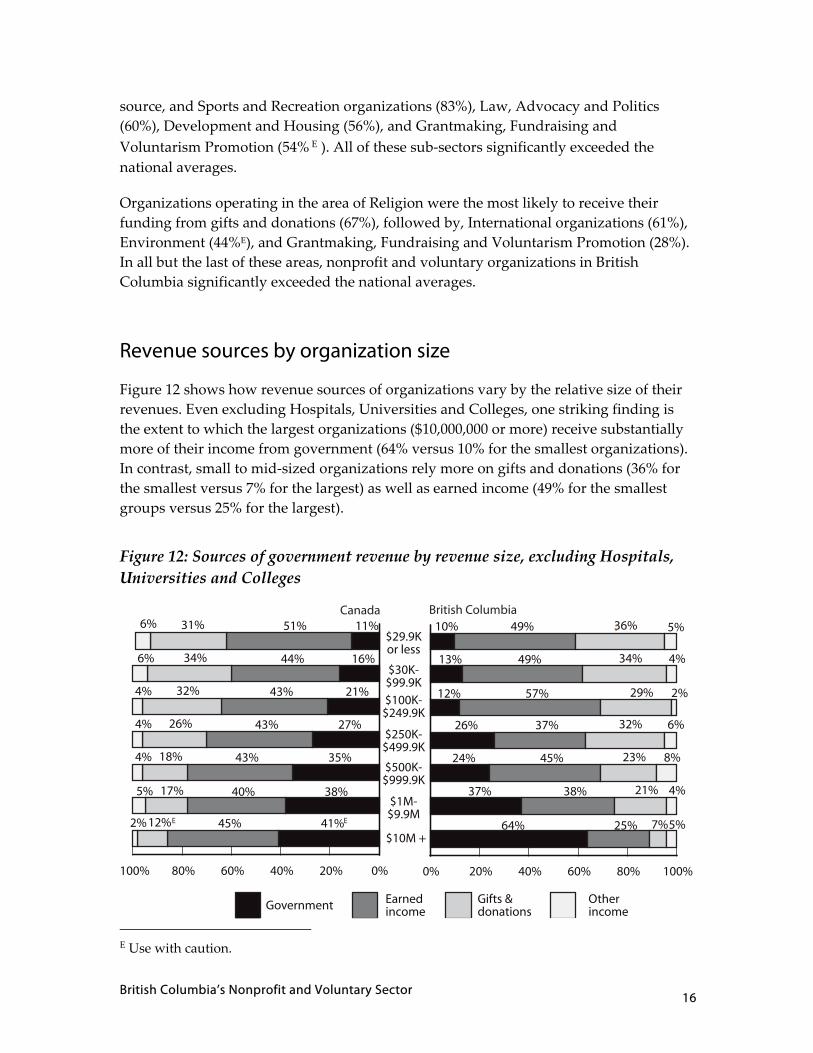
Revenue sources by organization size
Figure 12 shows how revenue sources of organizations vary by the relative size of their revenues. Even excluding Hospitals, Universities and Colleges, one striking finding is the extent to which the largest organizations ($10,000,000 or more) receive substantially more of their income from government (64% versus 10% for the smallest organizations). In contrast, small to mid‐sized organizations rely more on gifts and donations (36% for the smallest versus 7% for the largest) as well as earned income (49% for the smallest groups versus 25% for the largest).
Figure 12: Sources of government revenue by revenue size, excluding Hospitals, Universities and Colleges
E Use with caution.
$10M +
$1M- $9.9M
$500K- $999.9K
$250K- $499.9K
$100K- $249.9K
$30K- $99.9K
$29.9K or less
100% 80% 60% 40% 20% 0%
11%51%31%6%
16%44%34%6%
21%43%32%4%
27%43%26%4%
35%43%18%4%
38%40%17%5%
41%45%12%2%
Government Earned income
Gifts & donations
Other income
0% 20% 40% 60% 80% 100%
10% 49% 36% 5%
13% 49% 34% 4%
12% 57% 29% 2%
26% 37% 32% 6%
24% 45% 23% 8%
37% 38% 21% 4%
64% 25% 7%5%
:Canada British Columbia
E E
British Columbia’s Nonprofit and Voluntary Sector 17
Provincial patterns for the largest group (organizations reporting annual revenues of $10 million or more) deviate in a major way from the national case, with 41%E of revenues for national organizations coming from government sources and 45% obtained from earned income. Accordingly, the largest organizations in British Columbia relied on government to a much greater extent to finance their operations, and far less on earned income.
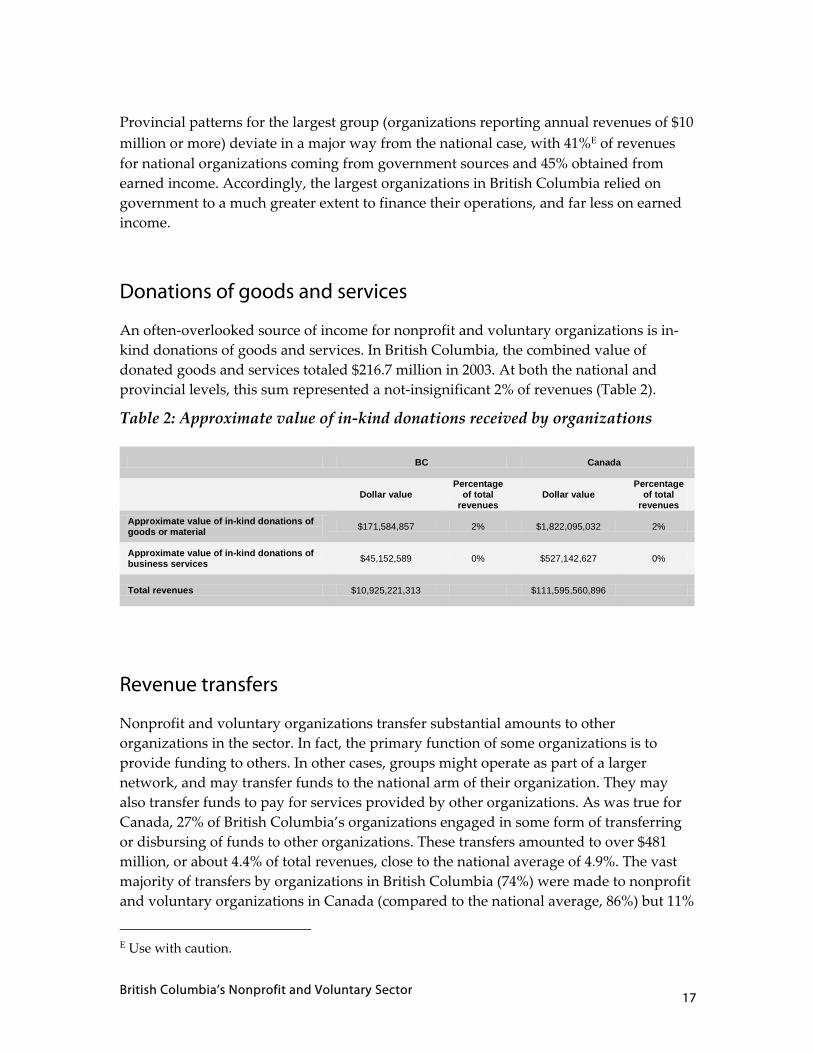
Donations of goods and services
An often‐overlooked source of income for nonprofit and voluntary organizations is in‐kind donations of goods and services. In British Columbia, the combined value of donated goods and services totaled $216.7 million in 2003. At both the national and provincial levels, this sum represented a not‐insignificant 2% of revenues (Table 2).
Table 2: Approximate value of in‐kind donations received by organizations
Revenue transfers
Nonprofit and voluntary organizations transfer substantial amounts to other organizations in the sector. In fact, the primary function of some organizations is to provide funding to others. In other cases, groups might operate as part of a larger network, and may transfer funds to the national arm of their organization. They may also transfer funds to pay for services provided by other organizations. As was true for Canada, 27% of British Columbia’s organizations engaged in some form of transferring or disbursing of funds to other organizations. These transfers amounted to over $481 million, or about 4.4% of total revenues, close to the national average of 4.9%. The vast majority of transfers by organizations in British Columbia (74%) were made to nonprofit and voluntary organizations in Canada (compared to the national average, 86%) but 11%
E Use with caution.
BC Canada
Dollar value Percentage
of total revenues
Dollar value Percentage
of total revenues
Approximate value of in-kind donations of goods or material $171,584,857 2% $1,822,095,032 2%
Approximate value of in-kind donations of business services $45,152,589 0% $527,142,627 0%
Total revenues $10,925,221,313 $111,595,560,896
British Columbia’s Nonprofit and Voluntary Sector 18
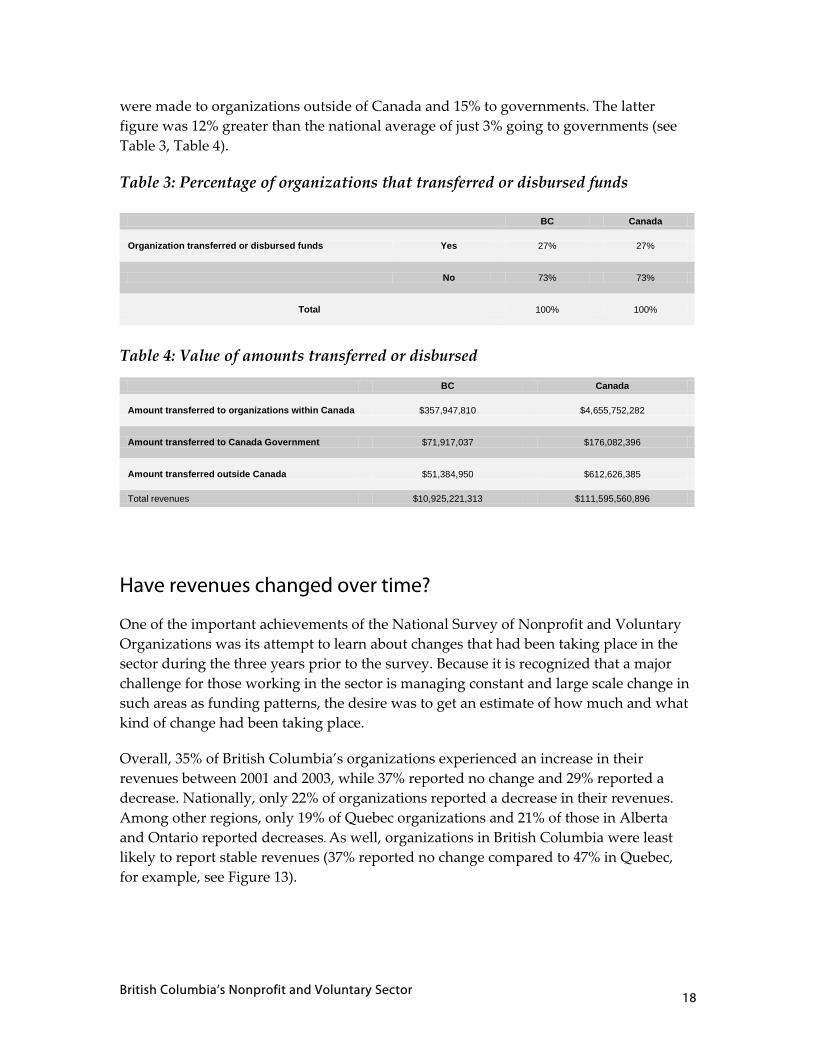
were made to organizations outside of Canada and 15% to governments. The latter figure was 12% greater than the national average of just 3% going to governments (see Table 3, Table 4).
Table 3: Percentage of organizations that transferred or disbursed funds
Table 4: Value of amounts transferred or disbursed
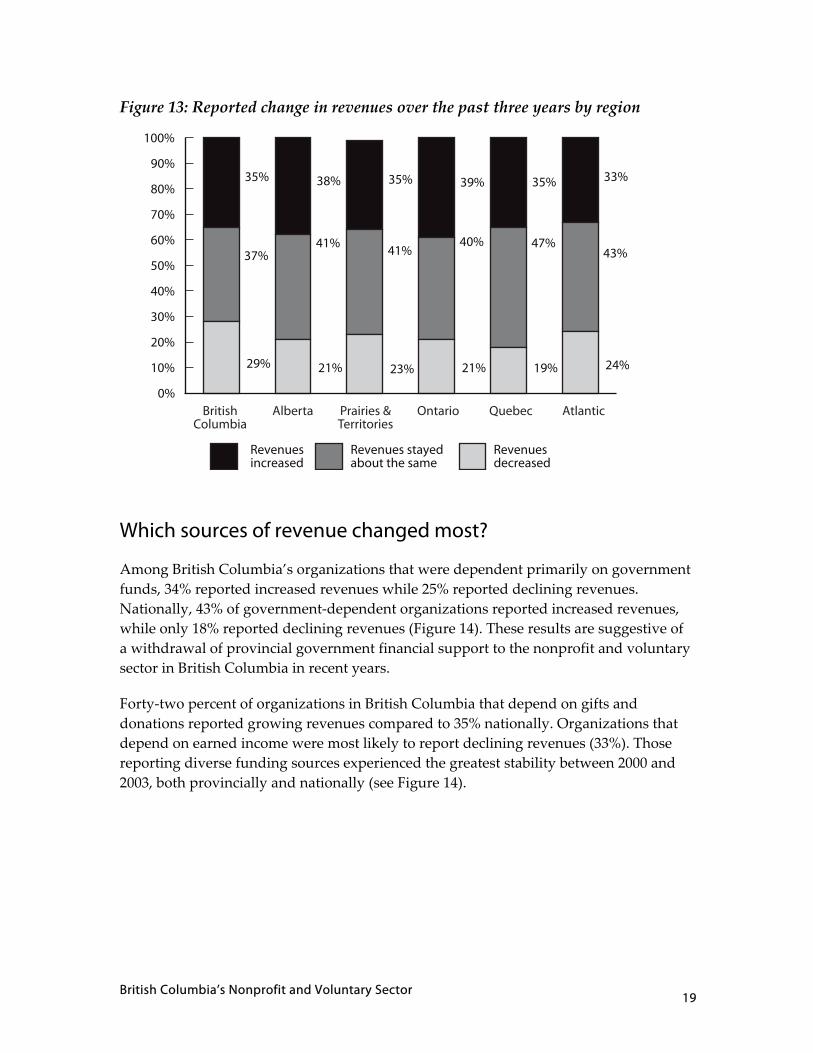
Have revenues changed over time?
One of the important achievements of the National Survey of Nonprofit and Voluntary Organizations was its attempt to learn about changes that had been taking place in the sector during the three years prior to the survey. Because it is recognized that a major challenge for those working in the sector is managing constant and large scale change in such areas as funding patterns, the desire was to get an estimate of how much and what kind of change had been taking place.
Overall, 35% of British Columbia’s organizations experienced an increase in their revenues between 2001 and 2003, while 37% reported no change and 29% reported a decrease. Nationally, only 22% of organizations reported a decrease in their revenues. Among other regions, only 19% of Quebec organizations and 21% of those in Alberta and Ontario reported decreases. As well, organizations in British Columbia were least likely to report stable revenues (37% reported no change compared to 47% in Quebec, for example, see Figure 13).
BC Canada
Amount transferred to organizations within Canada $357,947,810 $4,655,752,282
Amount transferred to Canada Government $71,917,037 $176,082,396
Amount transferred outside Canada $51,384,950 $612,626,385
Total revenues $10,925,221,313 $111,595,560,896
BC Canada
Organization transferred or disbursed funds Yes 27% 27%
No 73% 73%
Total 100% 100%
British Columbia’s Nonprofit and Voluntary Sector 19
Figure 13: Reported change in revenues over the past three years by region
Which sources of revenue changed most?
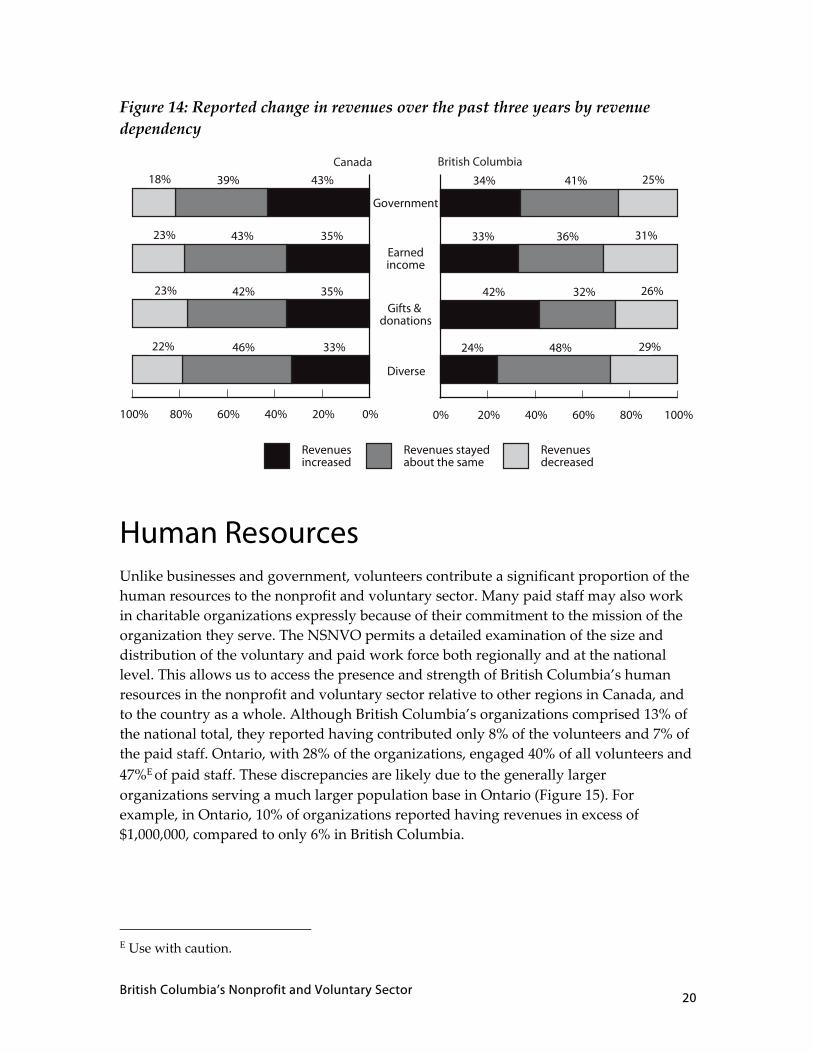
Among British Columbia’s organizations that were dependent primarily on government funds, 34% reported increased revenues while 25% reported declining revenues. Nationally, 43% of government‐dependent organizations reported increased revenues, while only 18% reported declining revenues (Figure 14). These results are suggestive of a withdrawal of provincial government financial support to the nonprofit and voluntary sector in British Columbia in recent years.
Forty‐two percent of organizations in British Columbia that depend on gifts and donations reported growing revenues compared to 35% nationally. Organizations that depend on earned income were most likely to report declining revenues (33%). Those reporting diverse funding sources experienced the greatest stability between 2000 and 2003, both provincially and nationally (see Figure 14).
0%
10%
20%
30%
40%
50%
60%
70%
80%
90%
100%
35%
37%
29%
38%
41%
21%
35%
41%
23%
39%
40%
21%
35%
47%
19%
33%
43%
24%
Revenues increased
Revenues stayed about the same
Revenues decreased
AtlanticQuebecOntarioPrairies &Territories
AlbertaBritishColumbia
British Columbia’s Nonprofit and Voluntary Sector 20
Figure 14: Reported change in revenues over the past three years by revenue dependency
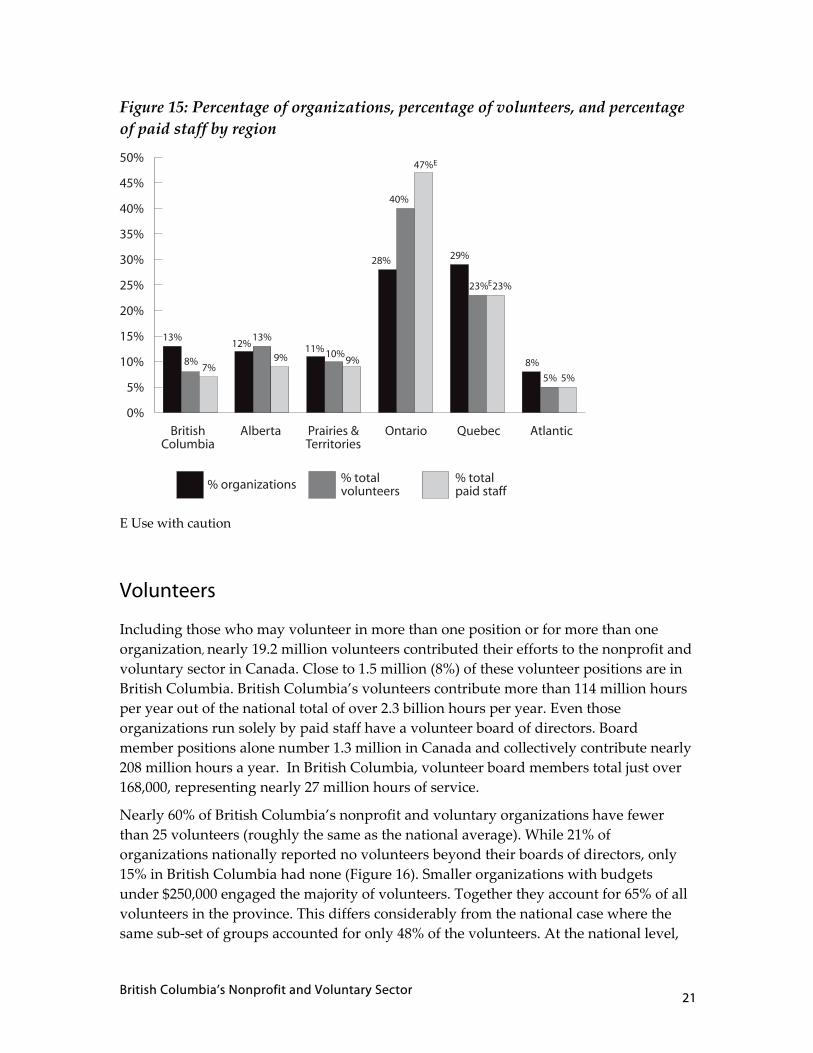
Human Resources Unlike businesses and government, volunteers contribute a significant proportion of the human resources to the nonprofit and voluntary sector. Many paid staff may also work in charitable organizations expressly because of their commitment to the mission of the organization they serve. The NSNVO permits a detailed examination of the size and distribution of the voluntary and paid work force both regionally and at the national level. This allows us to access the presence and strength of British Columbia’s human resources in the nonprofit and voluntary sector relative to other regions in Canada, and to the country as a whole. Although British Columbia’s organizations comprised 13% of the national total, they reported having contributed only 8% of the volunteers and 7% of the paid staff. Ontario, with 28% of the organizations, engaged 40% of all volunteers and 47%E of paid staff. These discrepancies are likely due to the generally larger organizations serving a much larger population base in Ontario (Figure 15). For example, in Ontario, 10% of organizations reported having revenues in excess of $1,000,000, compared to only 6% in British Columbia.
E Use with caution.
Diverse
Gifts & donations
Earned income
Government
100% 80% 60% 40% 20% 0%
43%39%18%
35%43%23%
35%42%23%
33%46%22%
Revenues increased
Revenues stayed about the same
Revenues decreased
0% 20% 40% 60% 80% 100%
34% 41% 25%
33% 36% 31%
42% 32% 26%
24% 48% 29%
Canada British Columbia
British Columbia’s Nonprofit and Voluntary Sector 21
Figure 15: Percentage of organizations, percentage of volunteers, and percentage of paid staff by region
E Use with caution
Volunteers
Including those who may volunteer in more than one position or for more than one organization, nearly 19.2 million volunteers contributed their efforts to the nonprofit and voluntary sector in Canada. Close to 1.5 million (8%) of these volunteer positions are in British Columbia. British Columbia’s volunteers contribute more than 114 million hours per year out of the national total of over 2.3 billion hours per year. Even those organizations run solely by paid staff have a volunteer board of directors. Board member positions alone number 1.3 million in Canada and collectively contribute nearly 208 million hours a year. In British Columbia, volunteer board members total just over 168,000, representing nearly 27 million hours of service.
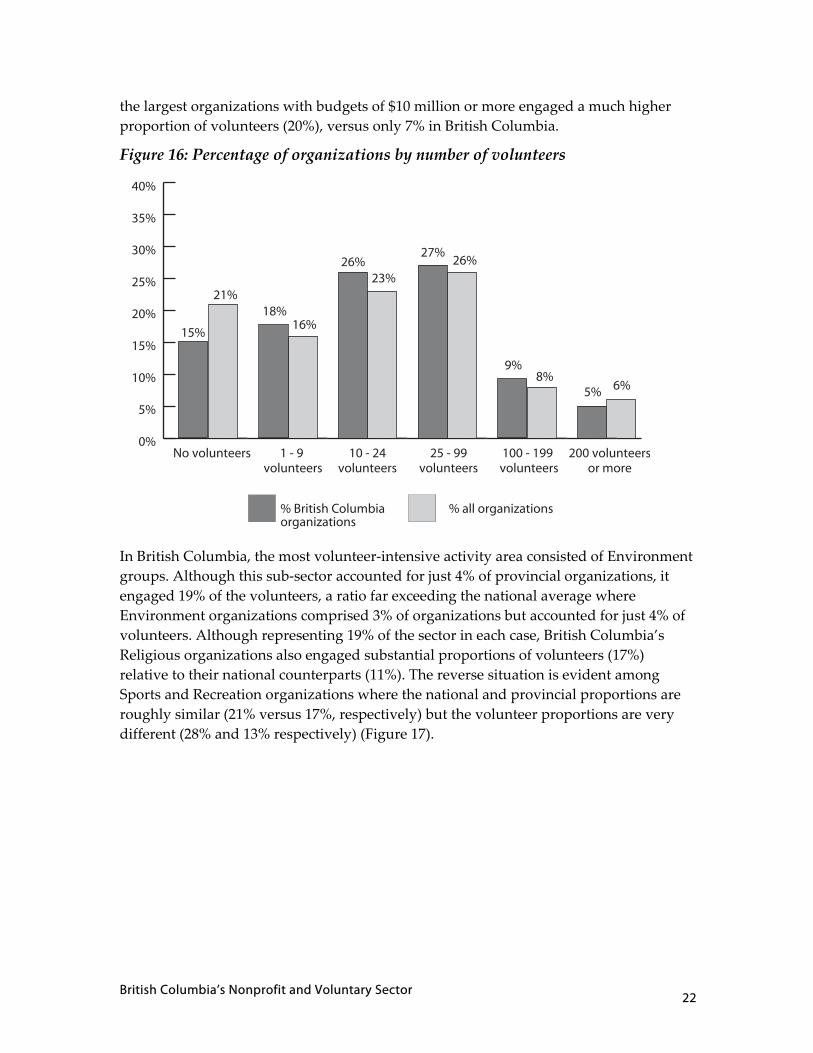
Nearly 60% of British Columbia’s nonprofit and voluntary organizations have fewer than 25 volunteers (roughly the same as the national average). While 21% of organizations nationally reported no volunteers beyond their boards of directors, only 15% in British Columbia had none (Figure 16). Smaller organizations with budgets under $250,000 engaged the majority of volunteers. Together they account for 65% of all volunteers in the province. This differs considerably from the national case where the same sub‐set of groups accounted for only 48% of the volunteers. At the national level,
0%
5%
10%
15%
20%
25%
30%
35%
40%
45%
50%
10%
13%
8%7%
12%13%
9%11%
9%
28%
40%
47%
29%
23% 23%
8%
5% 5%
% organizations % total volunteers
% total paid staff
AtlanticQuebecOntarioPrairies &Territories
AlbertaBritishColumbia
E
E
British Columbia’s Nonprofit and Voluntary Sector 22
the largest organizations with budgets of $10 million or more engaged a much higher proportion of volunteers (20%), versus only 7% in British Columbia.
Figure 16: Percentage of organizations by number of volunteers
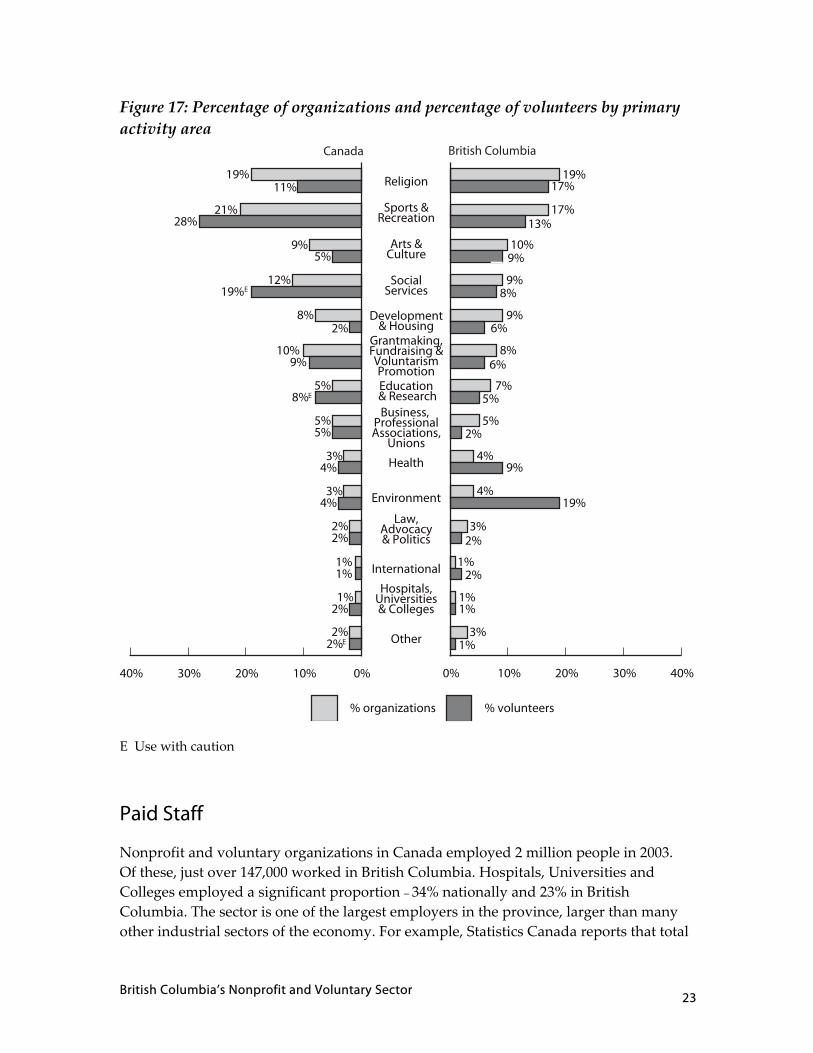
In British Columbia, the most volunteer‐intensive activity area consisted of Environment groups. Although this sub‐sector accounted for just 4% of provincial organizations, it engaged 19% of the volunteers, a ratio far exceeding the national average where Environment organizations comprised 3% of organizations but accounted for just 4% of volunteers. Although representing 19% of the sector in each case, British Columbia’s Religious organizations also engaged substantial proportions of volunteers (17%) relative to their national counterparts (11%). The reverse situation is evident among Sports and Recreation organizations where the national and provincial proportions are roughly similar (21% versus 17%, respectively) but the volunteer proportions are very different (28% and 13% respectively) (Figure 17).
0%
5%
10%
15%
20%
25%
30%
35%
40%
21%
15%16%
18%
23%26% 26%
27%
8%9%
6%
No volunteers 1 - 9volunteers
10 - 24volunteers
25 - 99volunteers
100 - 199 volunteers
200 volunteersor more
% all organizations% British Columbiaorganizations
5%
British Columbia’s Nonprofit and Voluntary Sector 23
Figure 17: Percentage of organizations and percentage of volunteers by primary activity area
E Use with caution
Paid Staff
Nonprofit and voluntary organizations in Canada employed 2 million people in 2003. Of these, just over 147,000 worked in British Columbia. Hospitals, Universities and Colleges employed a significant proportion – 34% nationally and 23% in British Columbia. The sector is one of the largest employers in the province, larger than many other industrial sectors of the economy. For example, Statistics Canada reports that total
Hospitals, Universities & Colleges
International
Other
Law, Advocacy & Politics
Environment
Health
Business, Professional Associations,
Unions
Education & Research
Grantmaking, Fundraising & Voluntarism Promotion
Development & Housing
Social Services
Arts & Culture
Sports & Recreation
Religion
40% 30% 20% 10% 0%
19%11%
21%28%
9%5%
12%19%
8%2%
10%9%
5%8%
5%5%
3%4%
3%4%
2%2%
2%2%
1%1%
1%2%
0% 10% 20% 30% 40%
19%17%
17%13%
10%9%
9%8%
9%6%
8%6%
7%5%
5%2%
4%9%
4%19%
3%2%
3%1%
1%2%
1%1%
% organizations % volunteers
Canada British Columbia
E
E
E
British Columbia’s Nonprofit and Voluntary Sector 24
British Columbia employment in the forestry, fishing, and mining, oil and gas extraction industries combined in 2004 was 35,300, and 141,700 in the construction industry.5
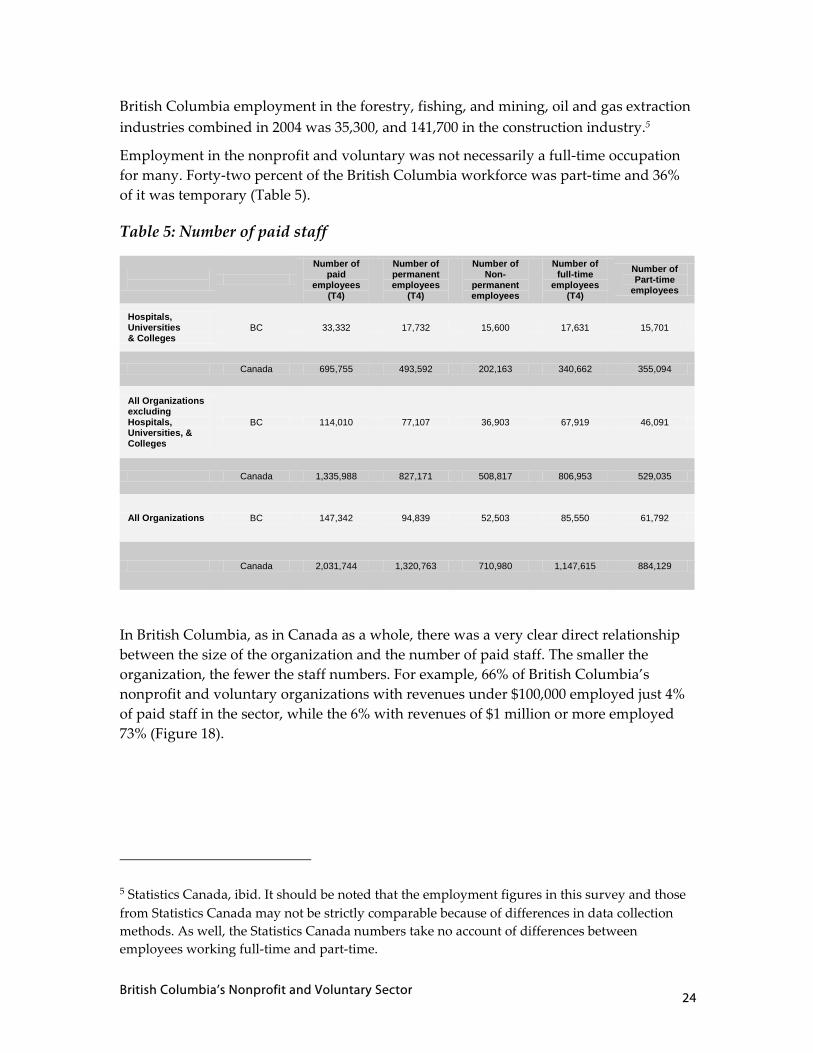
Employment in the nonprofit and voluntary was not necessarily a full‐time occupation for many. Forty‐two percent of the British Columbia workforce was part‐time and 36% of it was temporary (Table 5).
Table 5: Number of paid staff
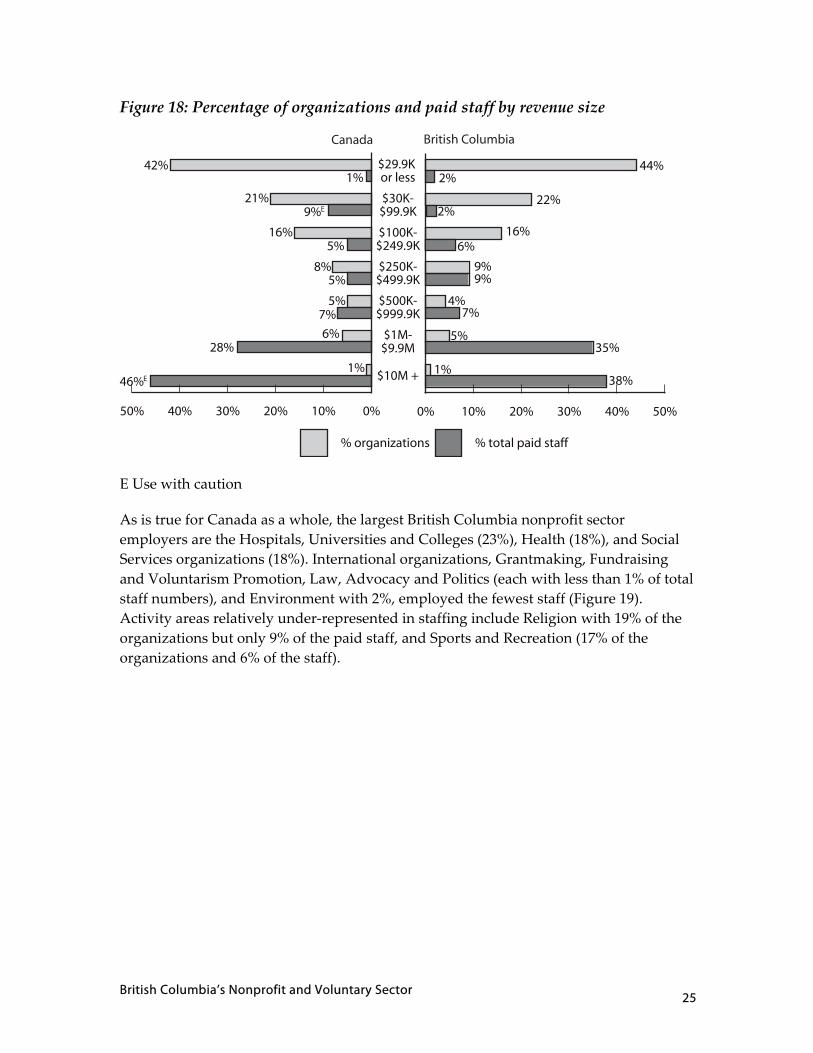
In British Columbia, as in Canada as a whole, there was a very clear direct relationship between the size of the organization and the number of paid staff. The smaller the organization, the fewer the staff numbers. For example, 66% of British Columbia’s nonprofit and voluntary organizations with revenues under $100,000 employed just 4% of paid staff in the sector, while the 6% with revenues of $1 million or more employed 73% (Figure 18).
5 Statistics Canada, ibid. It should be noted that the employment figures in this survey and those from Statistics Canada may not be strictly comparable because of differences in data collection methods. As well, the Statistics Canada numbers take no account of differences between employees working full‐time and part‐time.
Number of paid
employees (T4)
Number of permanent employees
(T4)
Number of Non-
permanent employees
Number of full-time
employees (T4)
Number of Part-time
employees
Hospitals, Universities & Colleges
BC 33,332 17,732 15,600 17,631 15,701
Canada 695,755 493,592 202,163 340,662 355,094
All Organizations excluding Hospitals, Universities, & Colleges
BC 114,010 77,107 36,903 67,919 46,091
Canada 1,335,988 827,171 508,817 806,953 529,035
All Organizations BC 147,342 94,839 52,503 85,550 61,792
Canada 2,031,744 1,320,763 710,980 1,147,615 884,129
British Columbia’s Nonprofit and Voluntary Sector 25
Figure 18: Percentage of organizations and paid staff by revenue size
E Use with caution
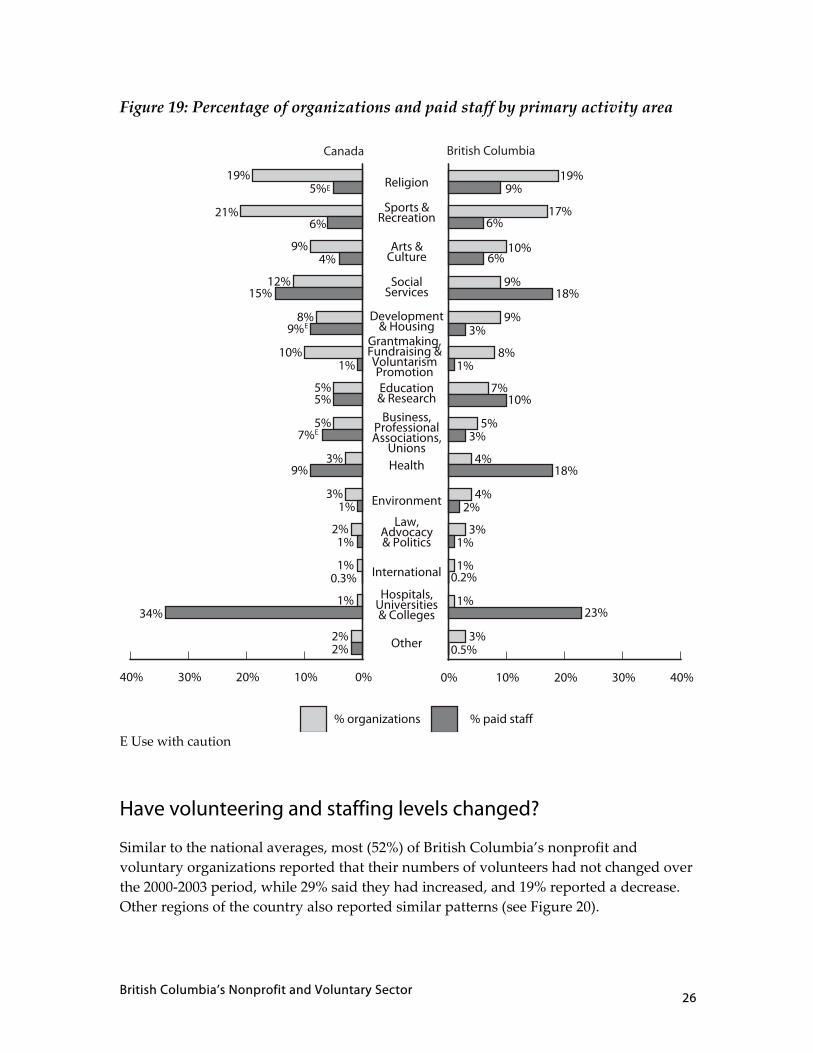
As is true for Canada as a whole, the largest British Columbia nonprofit sector employers are the Hospitals, Universities and Colleges (23%), Health (18%), and Social Services organizations (18%). International organizations, Grantmaking, Fundraising and Voluntarism Promotion, Law, Advocacy and Politics (each with less than 1% of total staff numbers), and Environment with 2%, employed the fewest staff (Figure 19). Activity areas relatively under‐represented in staffing include Religion with 19% of the organizations but only 9% of the paid staff, and Sports and Recreation (17% of the organizations and 6% of the staff).
$10M +
$1M- $9.9M
$500K- $999.9K
$250K- $499.9K
$100K- $249.9K
$30K- $99.9K
$29.9K or less
50% 40% 30% 20% 10% 0%
42%1%
21%9%
16%5%
8%5%
5%7%
6%28%
1%46%
0% 10% 20% 30% 40% 50%
44%2%
22%
16%
9%9%
5%
7%
35%
1%38%
Canada British Columbia
2%
6%
4%
E
E
% organizations % total paid staff
British Columbia’s Nonprofit and Voluntary Sector 26
Figure 19: Percentage of organizations and paid staff by primary activity area
E Use with caution
Have volunteering and staffing levels changed?
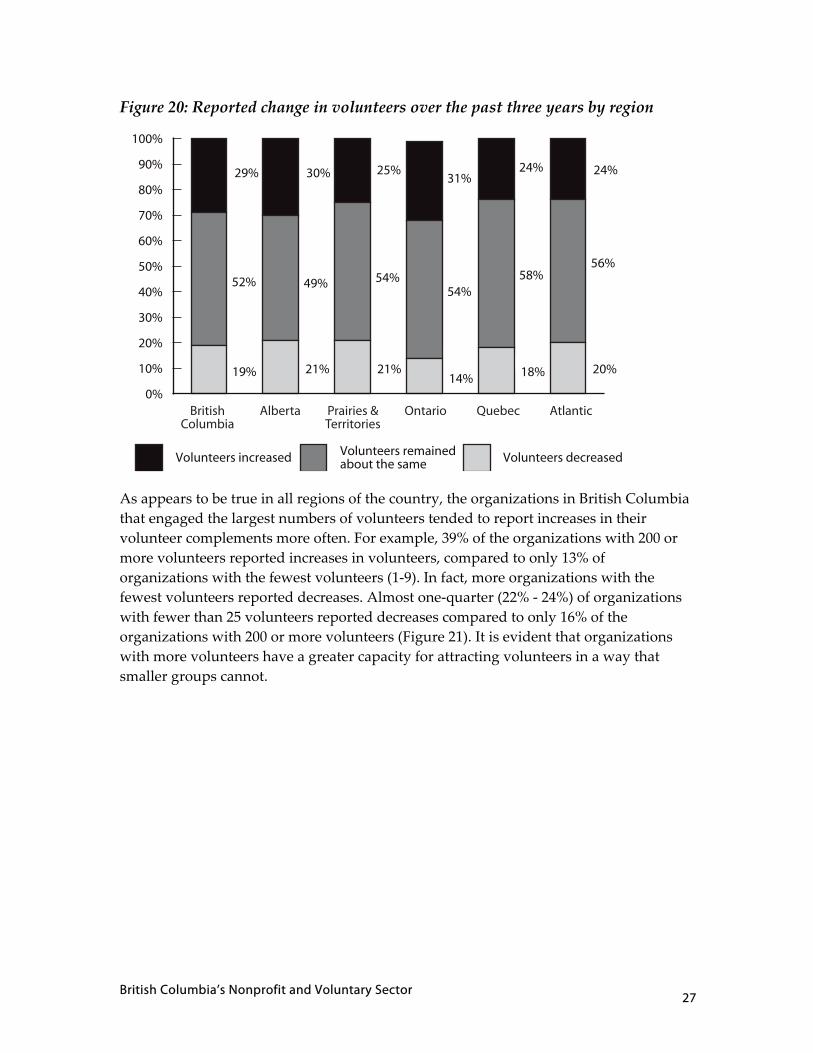
Similar to the national averages, most (52%) of British Columbia’s nonprofit and voluntary organizations reported that their numbers of volunteers had not changed over the 2000‐2003 period, while 29% said they had increased, and 19% reported a decrease. Other regions of the country also reported similar patterns (see Figure 20).
0% 10% 20% 30% 40%
19%9%
17%6%
10%6%
9%18%
9%3%
8%1%
7%10%
5%3%
4%18%
4%2%
3%1%
3%0.5%
1%0.2%
1%23%
% organizations % paid staff
Hospitals, Universities & Colleges
International
Other
Law, Advocacy & Politics
Environment
Health
Business, Professional Associations,
Unions
Education & Research
Grantmaking, Fundraising & Voluntarism Promotion
Development& Housing
Social Services
Arts & Culture
Sports & Recreation
Religion
40% 30% 20% 10% 0%
6%
1%
19%5%
21%
9%4%
12%15%
8%9%
10%1%
5%5%
5%7%
3%9%
3%1%
2%1%
2%
0.3%
1%34%
2%
Canada British Columbia
E
E
E
British Columbia’s Nonprofit and Voluntary Sector 27
Figure 20: Reported change in volunteers over the past three years by region
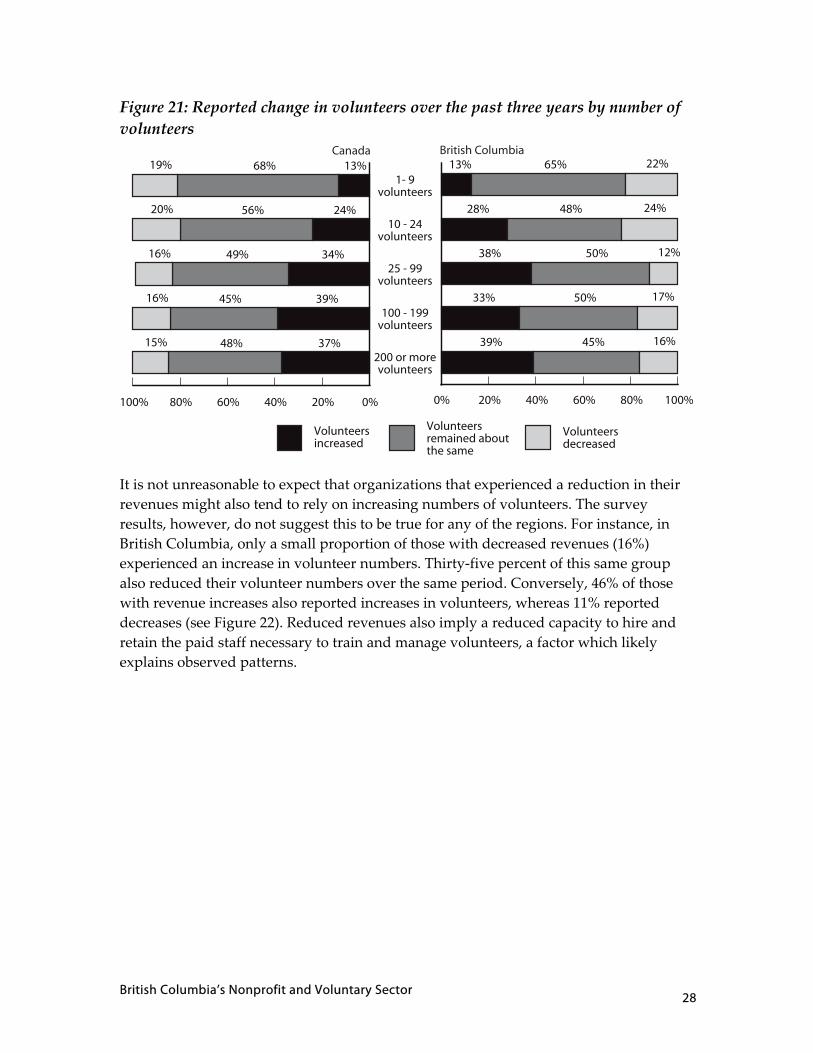
As appears to be true in all regions of the country, the organizations in British Columbia that engaged the largest numbers of volunteers tended to report increases in their volunteer complements more often. For example, 39% of the organizations with 200 or more volunteers reported increases in volunteers, compared to only 13% of organizations with the fewest volunteers (1‐9). In fact, more organizations with the fewest volunteers reported decreases. Almost one‐quarter (22% ‐ 24%) of organizations with fewer than 25 volunteers reported decreases compared to only 16% of the organizations with 200 or more volunteers (Figure 21). It is evident that organizations with more volunteers have a greater capacity for attracting volunteers in a way that smaller groups cannot.
0%
10%
20%
30%
40%
50%
60%
70%
80%
90%
100%
29%
52%
19%
30%
49%
21%
25%
54%
21%
31%
54%
14%
24%
58%
18%
24%
56%
20%
Volunteers increased Volunteers remained about the same Volunteers decreased
AtlanticQuebecOntarioPrairies &Territories
AlbertaBritishColumbia
British Columbia’s Nonprofit and Voluntary Sector 28
Figure 21: Reported change in volunteers over the past three years by number of volunteers
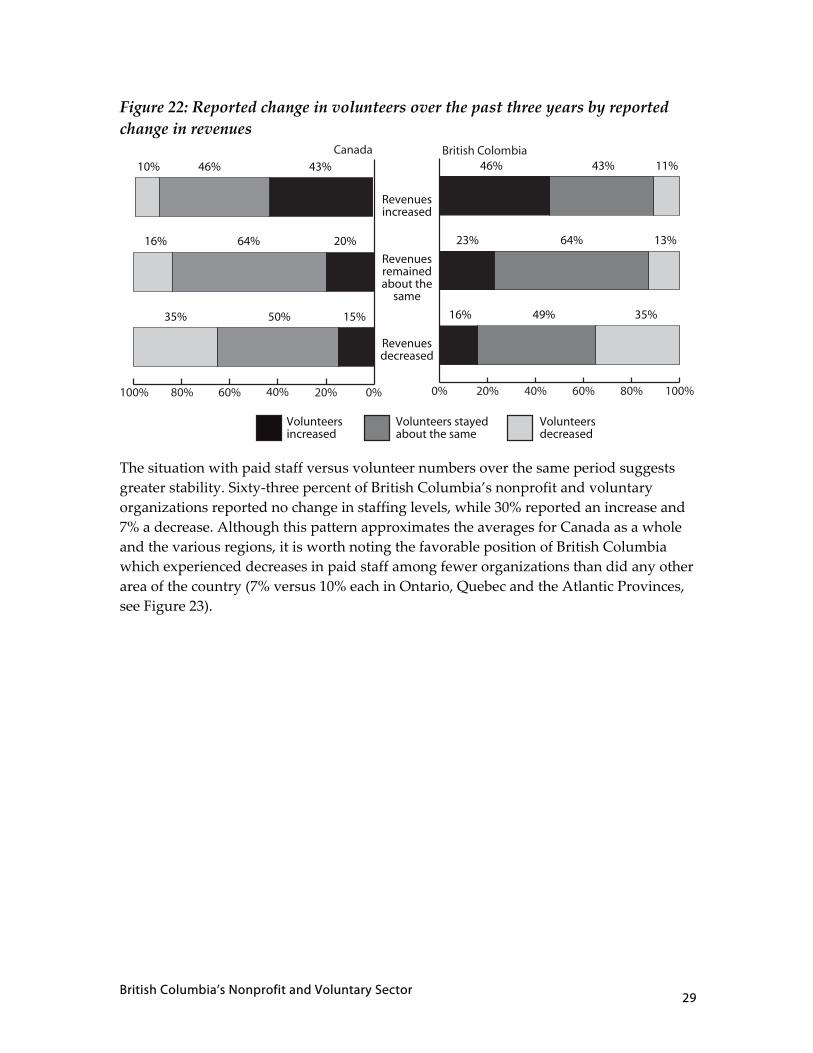
It is not unreasonable to expect that organizations that experienced a reduction in their revenues might also tend to rely on increasing numbers of volunteers. The survey results, however, do not suggest this to be true for any of the regions. For instance, in British Columbia, only a small proportion of those with decreased revenues (16%) experienced an increase in volunteer numbers. Thirty‐five percent of this same group also reduced their volunteer numbers over the same period. Conversely, 46% of those with revenue increases also reported increases in volunteers, whereas 11% reported decreases (see Figure 22). Reduced revenues also imply a reduced capacity to hire and retain the paid staff necessary to train and manage volunteers, a factor which likely explains observed patterns.
200 or more volunteers
100 - 199 volunteers
25 - 99volunteers
10 - 24 volunteers
1- 9 volunteers
100% 80% 60% 40% 20% 0%
13%68%19%
24%56%20%
34%49%16%
39%45%16%
37%48%15%
0% 20% 40% 60% 80% 100%
13% 65% 22%
28% 48% 24%
38% 50% 12%
33% 50% 17%
39% 45% 16%
Canada British Columbia
Volunteers increased
Volunteers remained about the same
Volunteers decreased
British Columbia’s Nonprofit and Voluntary Sector 29
Figure 22: Reported change in volunteers over the past three years by reported change in revenues
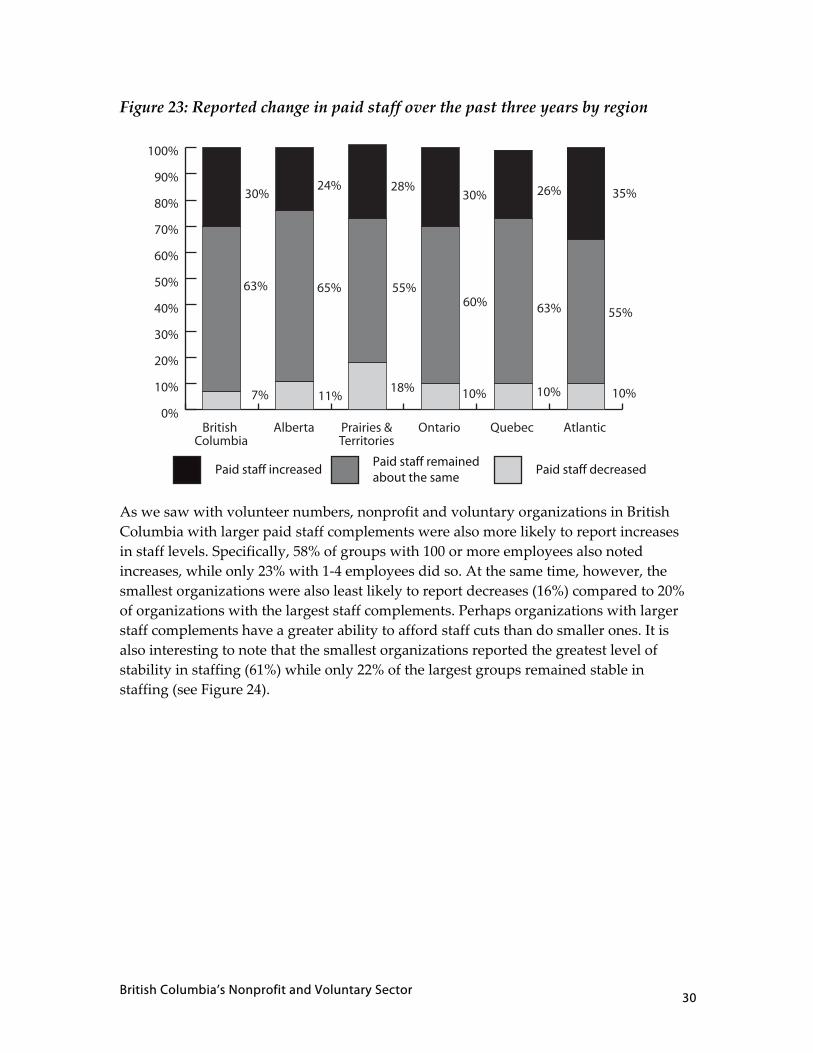
The situation with paid staff versus volunteer numbers over the same period suggests greater stability. Sixty‐three percent of British Columbia’s nonprofit and voluntary organizations reported no change in staffing levels, while 30% reported an increase and 7% a decrease. Although this pattern approximates the averages for Canada as a whole and the various regions, it is worth noting the favorable position of British Columbia which experienced decreases in paid staff among fewer organizations than did any other area of the country (7% versus 10% each in Ontario, Quebec and the Atlantic Provinces, see Figure 23).
0%20%40%60%80%100%
Volunteersincreased
Volunteers stayed about the same
Volunteers decreased
Revenues decreased
Revenues remained about the
same
Revenuesincreased
Canada British Colombia
0% 20% 40% 60% 80% 100%
43%46%10%
20%64%16%
15%50%35%
46% 43% 11%
23% 64% 13%
16% 49% 35%
British Columbia’s Nonprofit and Voluntary Sector 30
Figure 23: Reported change in paid staff over the past three years by region
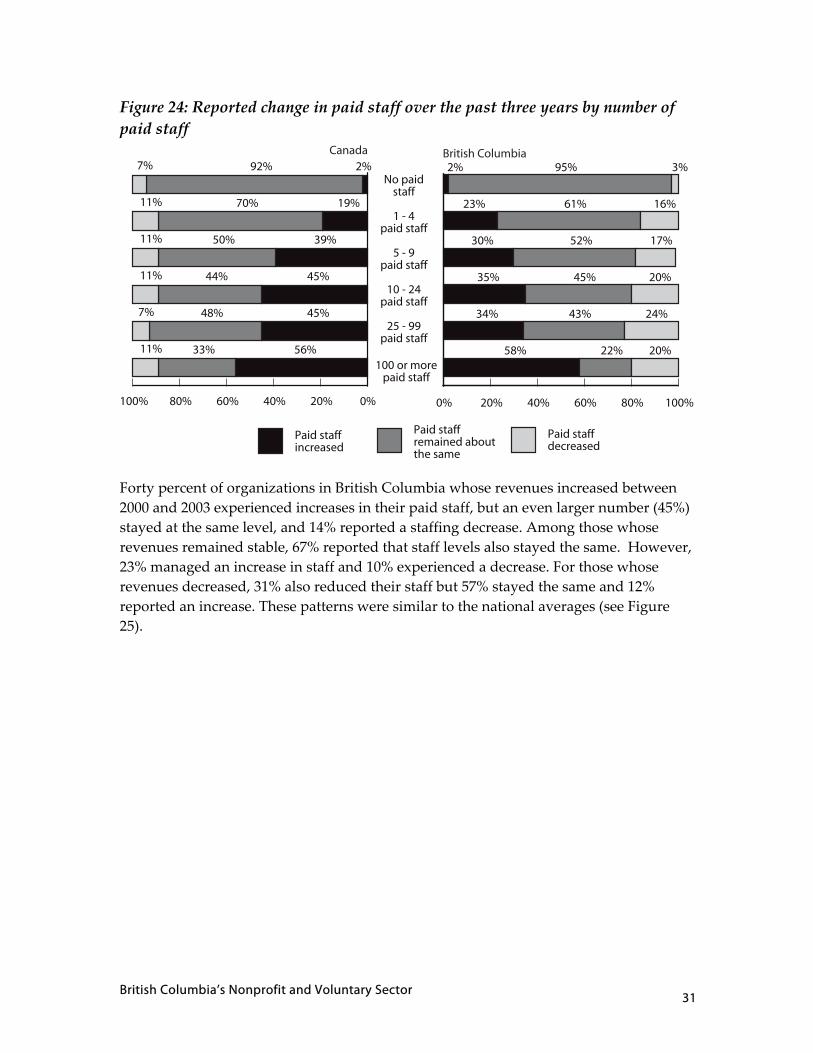
As we saw with volunteer numbers, nonprofit and voluntary organizations in British Columbia with larger paid staff complements were also more likely to report increases in staff levels. Specifically, 58% of groups with 100 or more employees also noted increases, while only 23% with 1‐4 employees did so. At the same time, however, the smallest organizations were also least likely to report decreases (16%) compared to 20% of organizations with the largest staff complements. Perhaps organizations with larger staff complements have a greater ability to afford staff cuts than do smaller ones. It is also interesting to note that the smallest organizations reported the greatest level of stability in staffing (61%) while only 22% of the largest groups remained stable in staffing (see Figure 24).
Paid staff increasedPaid staff remained about the same
Paid staff decreased
0%
10%
20%
30%
40%
50%
60%
70%
80%
90%
100%
AtlanticQuebecOntarioPrairies &Territories
AlbertaBritish Columbia
30%24% 28%
30% 26% 35%
63% 65% 55%60% 63% 55%
7% 11%18% 10% 10% 10%
British Columbia’s Nonprofit and Voluntary Sector 31
Figure 24: Reported change in paid staff over the past three years by number of paid staff
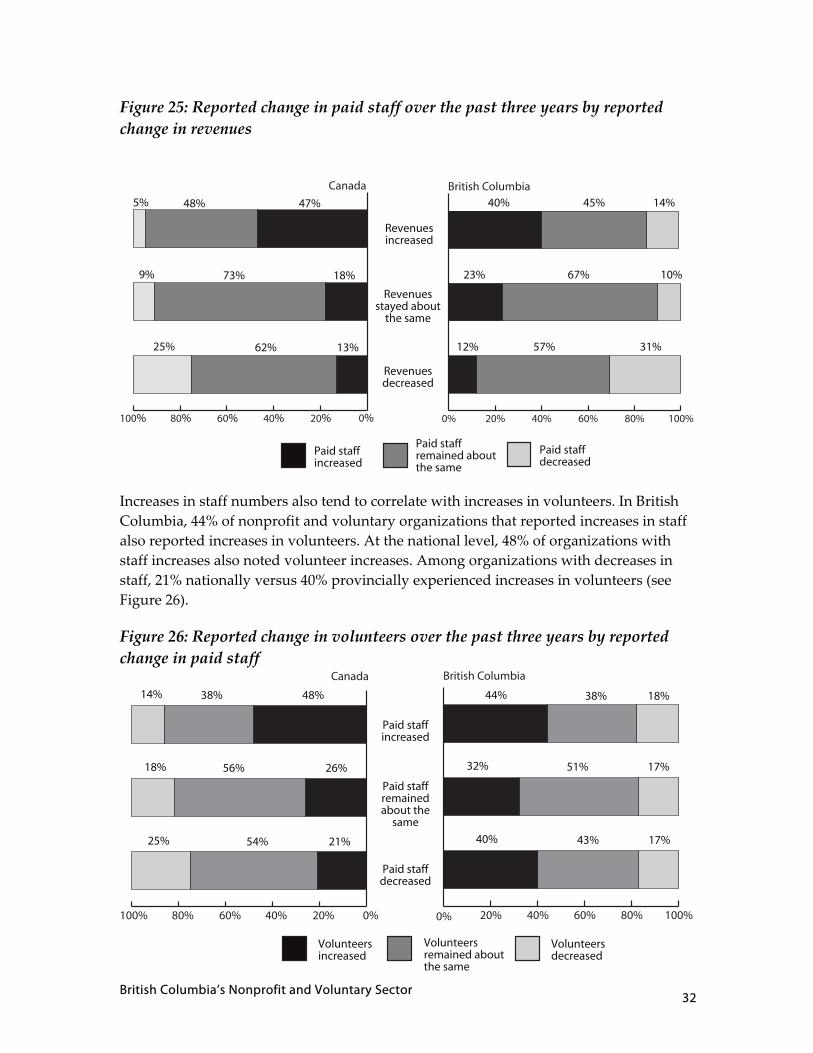
Forty percent of organizations in British Columbia whose revenues increased between 2000 and 2003 experienced increases in their paid staff, but an even larger number (45%) stayed at the same level, and 14% reported a staffing decrease. Among those whose revenues remained stable, 67% reported that staff levels also stayed the same. However, 23% managed an increase in staff and 10% experienced a decrease. For those whose revenues decreased, 31% also reduced their staff but 57% stayed the same and 12% reported an increase. These patterns were similar to the national averages (see Figure 25).
100 or more paid staff
25 - 99 paid staff
10 - 24 paid staff
5 - 9 paid staff
1 - 4 paid staff
No paid staff
0% 20% 40% 60% 80% 100%
2% 95% 3%
23% 61% 16%
30% 52% 17%
35% 45% 20%
34% 43% 24%
58% 22% 20%
British Columbia
100% 80% 60% 40% 20% 0%
2%92%7%
19%70%11%
39%50%11%
45%44%11%
45%48%7%
56%33%11%
Canada
Paid staffincreased
Paid staff remained about the same
Paid staff decreased
British Columbia’s Nonprofit and Voluntary Sector 32
Figure 25: Reported change in paid staff over the past three years by reported change in revenues
Increases in staff numbers also tend to correlate with increases in volunteers. In British Columbia, 44% of nonprofit and voluntary organizations that reported increases in staff also reported increases in volunteers. At the national level, 48% of organizations with staff increases also noted volunteer increases. Among organizations with decreases in staff, 21% nationally versus 40% provincially experienced increases in volunteers (see Figure 26).
Figure 26: Reported change in volunteers over the past three years by reported change in paid staff
47%%
48%5%
18%73%9%
13%62%25%
0% 20% 40% 60% 80% 100%
40% 45% 14%
23% 67% 10%
12% 57% 31%
Revenuesdecreased
Revenues stayed about
the same
Revenuesincreased
Canada British Columbia
0%20%40%60%80%100%
Paid staff increased
Paid staff remained about the same
Paid staff decreased
0% 20% 40% 60% 80% 100%0%20%40%60%80%100%
Paid staff decreased
Paid staffremained about the
same
Paid staff increased
Canada British Columbia
48%38%14%
26%56%18%
21%54%25%
18%38%44%
17%51%32%
17%43%40%
Volunteersincreased
Volunteers remained about the same
Volunteersdecreased
British Columbia’s Nonprofit and Voluntary Sector 33
Organizational Capacity Challenges
Although nonprofit and voluntary organizations play a major social and economic role in the country, they face a number of challenges in their ability to fulfill their missions and meet their mandates. The NSNVO posed a series of questions about the financial, human resources and structural capacity issues that organizations may be experiencing. Respondents were asked about the extent to which each of the following posed a problem for their organizations:6
• Human resources capacity—the ability to recruit and deploy volunteers and paid staff within the organization;
• Financial capacity—the ability to develop and deploy the revenues and assets of the organization;
• Planning and development capacity—the ability to develop and draw on organizational strategic plans, program plans, policies, and procedures;
• Relationship and network capacity—the ability to collaborate and draw on relationships with clients, members, funders, partners, government, and other stakeholders;
• Infrastructure and process capacity—the ability to deploy or rely on infrastructure such as internal administrative systems, information technology, software, or databases; and,
• External factors that affect an organization’s overall capacity, such as the level of demand for services or products.
For each issue, respondents were asked to indicate whether it was “not a problem”, “a small problem”, “a moderate problem”, “or a serious problem”.7
6 For a discussion of the conceptual model of organizational capacity that guided this research and the results of qualitative research that informed the development of the survey items used by the NSNVO, see M. H. Hall, et al., 2003, The Capacity to Serve: A qualitative study of the challenges facing Canada’s nonprofit and voluntary organizations, Toronto: Canadian Centre for Philanthropy. 7 Organizations reporting “no problem” with a given issue may include those for which the issue was not perceived to be applicable. Unless otherwise stated, the presence of a problem refers to the number reporting all levels of difficulty combined (i.e., the sum of responses of “a small problem”, “a moderate problem” and “a serious problem”).
British Columbia’s Nonprofit and Voluntary Sector 34
External funding problems
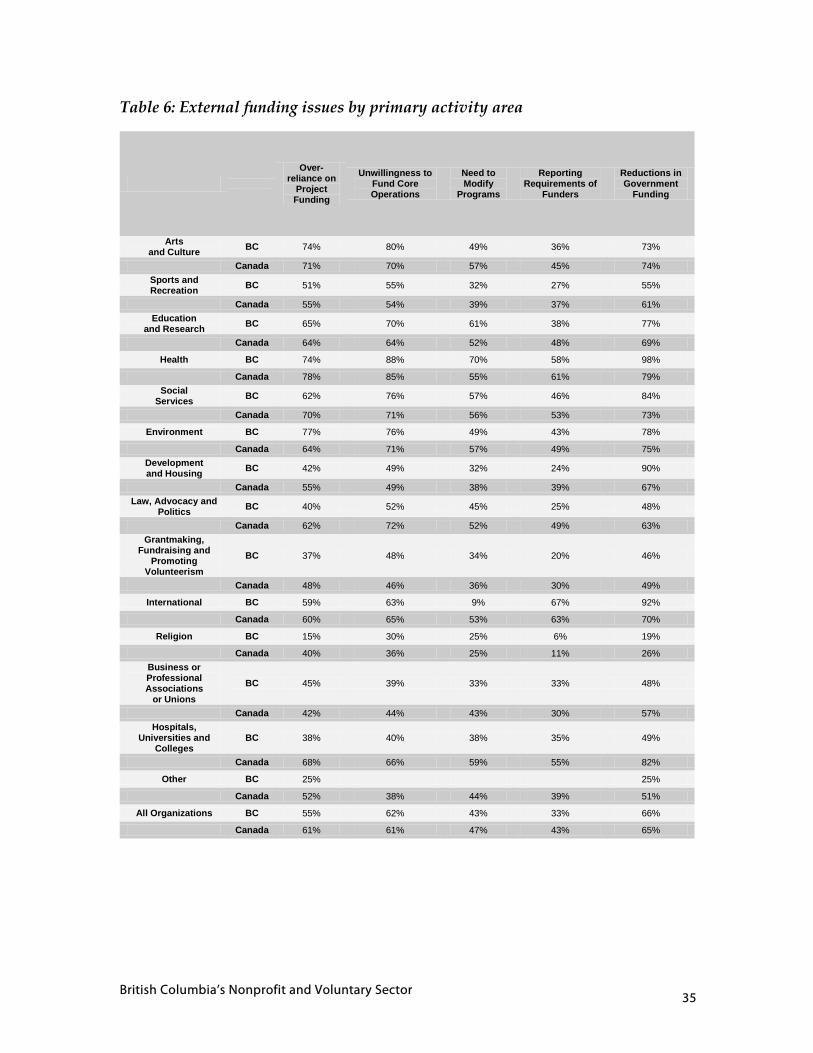
Two‐thirds of organizations in British Columbia that receive external funding reported problems with reductions in government support (66%), and an unwillingness to fund core operations (62%). British Columbia’s organizations, furthermore, were more likely to consider reductions in government funding to be a “serious problem” than the Canadian average (44% compared to 36%). Groups working in certain activity areas appeared to be more vulnerable than others to reductions in government funding, including Health organizations (98%), International (92%), Development and Housing (90%), Social Services (84%), Environment (78%), Education and Research (77%) and Arts and Culture (73%). In most cases, these percentages are well above the national averages. For Canada as a whole, 65% reported a problem with reductions in government support. Many organizations working in these areas also reported a problem with the unwillingness of funders to fund core operations, most notably Health (88%), Arts and Culture (80%), Social Services, and Environment (76%), and Education and Research (70%).
More than half (55%) of all organizations in British Columbia identified an over‐reliance on project funding to be a concern, with 77% of Environment, 74% of Arts and Culture, 74% of Health organizations, 65% of Education and Research, 62% of Social Services, 59% of International, and 51% of Sports and Recreation groups having reported this problem. Health organizations in particular (70%) seem to feel pressured to modify their programs (see Table 6).
British Columbia’s Nonprofit and Voluntary Sector 35
Table 6: External funding issues by primary activity area
Over-reliance on
Project Funding
Unwillingness to Fund Core Operations
Need to Modify
Programs
Reporting Requirements of
Funders
Reductions in Government
Funding
Arts and Culture BC 74% 80% 49% 36% 73%
Canada 71% 70% 57% 45% 74% Sports and Recreation BC 51% 55% 32% 27% 55%
Canada 55% 54% 39% 37% 61% Education
and Research BC 65% 70% 61% 38% 77%
Canada 64% 64% 52% 48% 69%
Health BC 74% 88% 70% 58% 98%
Canada 78% 85% 55% 61% 79% Social
Services BC 62% 76% 57% 46% 84%
Canada 70% 71% 56% 53% 73%
Environment BC 77% 76% 49% 43% 78%
Canada 64% 71% 57% 49% 75% Development and Housing BC 42% 49% 32% 24% 90%
Canada 55% 49% 38% 39% 67% Law, Advocacy and
Politics BC 40% 52% 45% 25% 48%
Canada 62% 72% 52% 49% 63% Grantmaking,
Fundraising and Promoting
Volunteerism
BC 37% 48% 34% 20% 46%
Canada 48% 46% 36% 30% 49%
International BC 59% 63% 9% 67% 92%
Canada 60% 65% 53% 63% 70%
Religion BC 15% 30% 25% 6% 19%
Canada 40% 36% 25% 11% 26% Business or Professional Associations
or Unions
BC 45% 39% 33% 33% 48%
Canada 42% 44% 43% 30% 57% Hospitals,
Universities and Colleges
BC 38% 40% 38% 35% 49%
Canada 68% 66% 59% 55% 82%
Other BC 25% 25%
Canada 52% 38% 44% 39% 51%
All Organizations BC 55% 62% 43% 33% 66%
Canada 61% 61% 47% 43% 65%
British Columbia’s Nonprofit and Voluntary Sector 36
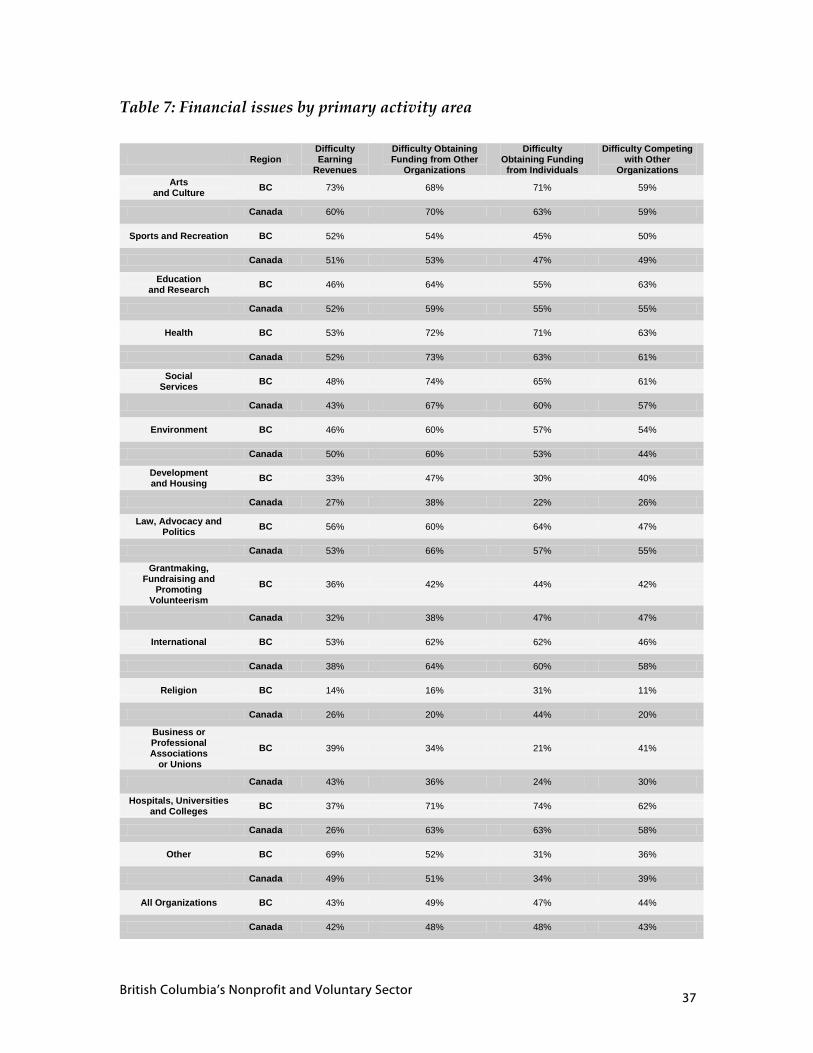
Aside from external funding issues, other financial capacity issues of concern to many British Columbia’s nonprofit and voluntary organizations include difficulty earning revenues, difficulty obtaining funding from other organizations and individual donors, competition with other organizations and increasing demands for services or products. In each case, over 50% of Health organizations cited these problems.
British Columbia’s Nonprofit and Voluntary Sector 37
Table 7: Financial issues by primary activity area
Region Difficulty Earning
Revenues
Difficulty Obtaining Funding from Other
Organizations
Difficulty Obtaining Funding
from Individuals
Difficulty Competing with Other
Organizations Arts
and Culture BC 73% 68% 71% 59%
Canada 60% 70% 63% 59%
Sports and Recreation BC 52% 54% 45% 50%
Canada 51% 53% 47% 49%
Education and Research BC 46% 64% 55% 63%
Canada 52% 59% 55% 55%
Health BC 53% 72% 71% 63%
Canada 52% 73% 63% 61%
Social Services BC 48% 74% 65% 61%
Canada 43% 67% 60% 57%
Environment BC 46% 60% 57% 54%
Canada 50% 60% 53% 44%
Development and Housing BC 33% 47% 30% 40%
Canada 27% 38% 22% 26%
Law, Advocacy and Politics BC 56% 60% 64% 47%
Canada 53% 66% 57% 55%
Grantmaking, Fundraising and
Promoting Volunteerism
BC 36% 42% 44% 42%
Canada 32% 38% 47% 47%
International BC 53% 62% 62% 46%
Canada 38% 64% 60% 58%
Religion BC 14% 16% 31% 11%
Canada 26% 20% 44% 20%
Business or Professional Associations
or Unions
BC 39% 34% 21% 41%
Canada 43% 36% 24% 30%
Hospitals, Universities and Colleges BC 37% 71% 74% 62%
Canada 26% 63% 63% 58%
Other BC 69% 52% 31% 36%
Canada 49% 51% 34% 39%
All Organizations BC 43% 49% 47% 44%
Canada 42% 48% 48% 43%
British Columbia’s Nonprofit and Voluntary Sector 38
Human Resources and Structural Capacity Problems
Apart from external funding issues, for all organizations in British Columbia combined, the biggest capacity issue was planning for the future, with 55% having indicated this is a problem. This difficulty is no doubt a result of problems in the sector with obtaining stable, long‐term funding. At least half of all respondents reported difficulty recruiting the right type of volunteers (54%), retaining volunteers (51%), and obtaining board members (50%). The extent to which organizations report capacity problems also varied according to the size of their revenues, the source of revenue on which they are dependent, and the activity area in which they operate (see Table 6 through Table 13).
Capacity problems and revenue size
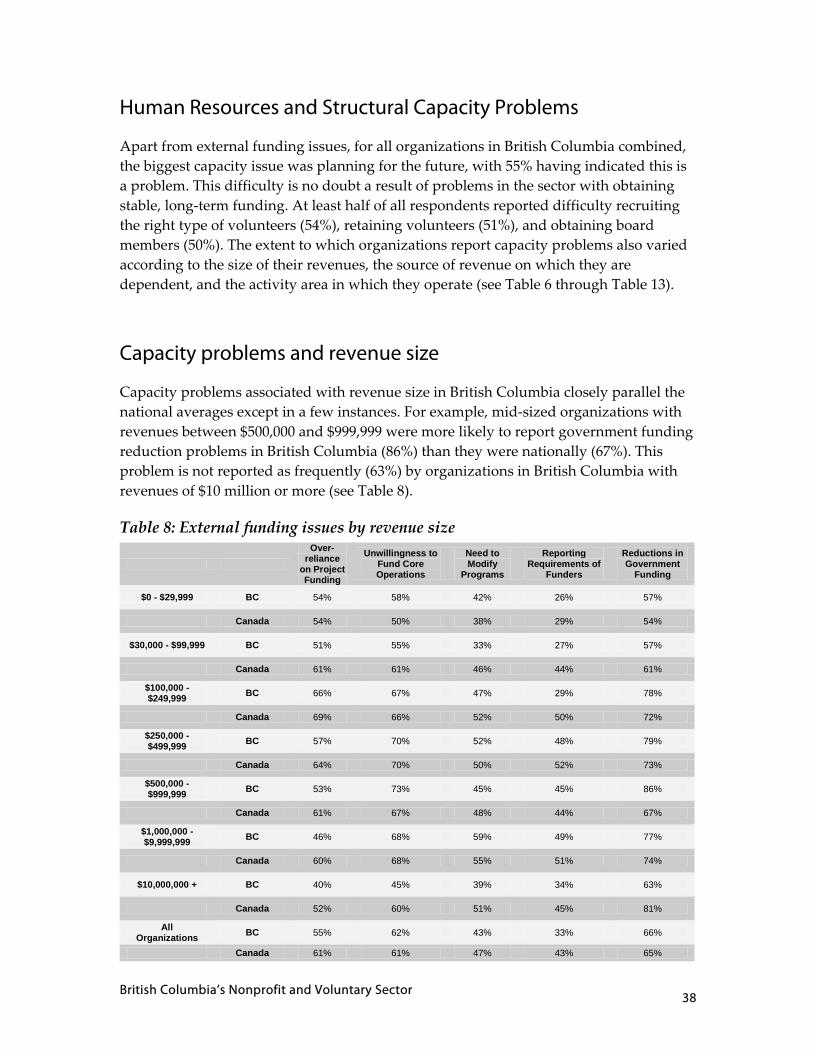
Capacity problems associated with revenue size in British Columbia closely parallel the national averages except in a few instances. For example, mid‐sized organizations with revenues between $500,000 and $999,999 were more likely to report government funding reduction problems in British Columbia (86%) than they were nationally (67%). This problem is not reported as frequently (63%) by organizations in British Columbia with revenues of $10 million or more (see Table 8).
Table 8: External funding issues by revenue size
Over-reliance
on Project Funding
Unwillingness to Fund Core Operations
Need to Modify
Programs
Reporting Requirements of
Funders
Reductions in Government
Funding
$0 - $29,999 BC 54% 58% 42% 26% 57%
Canada 54% 50% 38% 29% 54%
$30,000 - $99,999 BC 51% 55% 33% 27% 57%
Canada 61% 61% 46% 44% 61%
$100,000 - $249,999 BC 66% 67% 47% 29% 78%
Canada 69% 66% 52% 50% 72%
$250,000 - $499,999 BC 57% 70% 52% 48% 79%
Canada 64% 70% 50% 52% 73%
$500,000 - $999,999 BC 53% 73% 45% 45% 86%
Canada 61% 67% 48% 44% 67%
$1,000,000 - $9,999,999 BC 46% 68% 59% 49% 77%
Canada 60% 68% 55% 51% 74%
$10,000,000 + BC 40% 45% 39% 34% 63%
Canada 52% 60% 51% 45% 81%
All Organizations BC 55% 62% 43% 33% 66%
Canada 61% 61% 47% 43% 65%
British Columbia’s Nonprofit and Voluntary Sector 39
Organizations with the largest and the smallest revenues in British Columbia reported problems less often with volunteer recruitment than organizations in the middle‐revenue range. Only 24% of nonprofit and voluntary organizations with the largest revenues indicated this to be a problem, and only half of the lowest income groups did. By contrast, organizations with earnings between $250,000 ‐ $499,999 cited this problem in 62% of cases. Difficulty obtaining board members was a substantial difficulty regardless of revenue size although, once again, the largest organizations (42%) appear to find this less problematic than their smaller revenue counterparts with, for example, incomes in the range of $30,000 ‐ $99,999 (57%, see Table 9).
Table 9: Human resources issues by revenue size
Organizations with higher revenues tended to have a bigger problem finding the type of staff required. Interestingly, a much smaller proportion of the lowest revenue groups reported this problem (13% in both British Columbia and the country as a whole). This may be due to generally greater requirements for staff expertise among the largest organizations relative to smaller groups which may, for the most part, expect to rely mostly on volunteer effort to carry out their activities. British Columbia’s nonprofit and
Diffic-ulty
Obtain-ing
Type of Paid Staff
Diffic-ulty
Retain-ing
Paid Staff
Difficulty Providing
Staff Training
and Develop-
ment
Diffic-ulty
Obtain-ing
Board Mem-bers
Diffic-ulty
Train-ing
Board Mem-bers
Diffic-ulty
Recruit-ing
Type of Volun-teers
Diffic-ulty
Retai-ning
Volun-teers
Lack of Paid
Staff to Recruit
or Man-age
Volun-teers
Diffic-ulty
Provid-ing
Training for
Volunt-eers
$0 - $29,999 BC 13% 26% 16% 50% 25% 50% 46% 26% 30%
Canada 13% 23% 14% 53% 26% 51% 45% 22% 28%
$30,000 - $99,999 BC 32% 13% 25% 57% 39% 58% 56% 40% 40%
Canada 28% 16% 26% 61% 36% 61% 52% 36% 37%
$100,000 - $249,999 BC 29% 11% 26% 45% 28% 60% 57% 43% 33%
Canada 40% 17% 38% 60% 43% 68% 57% 45% 46%
$250,000 - $499,999 BC 40% 22% 40% 46% 43% 62% 57% 50% 48%
Canada 45% 17% 42% 59% 42% 65% 57% 52% 54%
$500,000 - $999,999 BC 44% 14% 44% 44% 49% 53% 49% 58% 35%
Canada 49% 23% 46% 51% 44% 55% 42% 51% 47%
$1,000,000 - $9,999,999 BC 50% 16% 49% 52% 49% 52% 50% 47% 49%
Canada 55% 20% 49% 50% 43% 53% 46% 49% 47%
$10,000,000 + BC 77% 31% 31% 42% 19% 24% 25% 44% 46%
Canada 66% 24% 50% 42% 33% 54% 51% 45% 48% All
Organizations BC 25% 16% 24% 50% 32% 54% 51% 36% 36%
Canada 28% 19% 27% 56% 34% 57% 49% 35% 38%
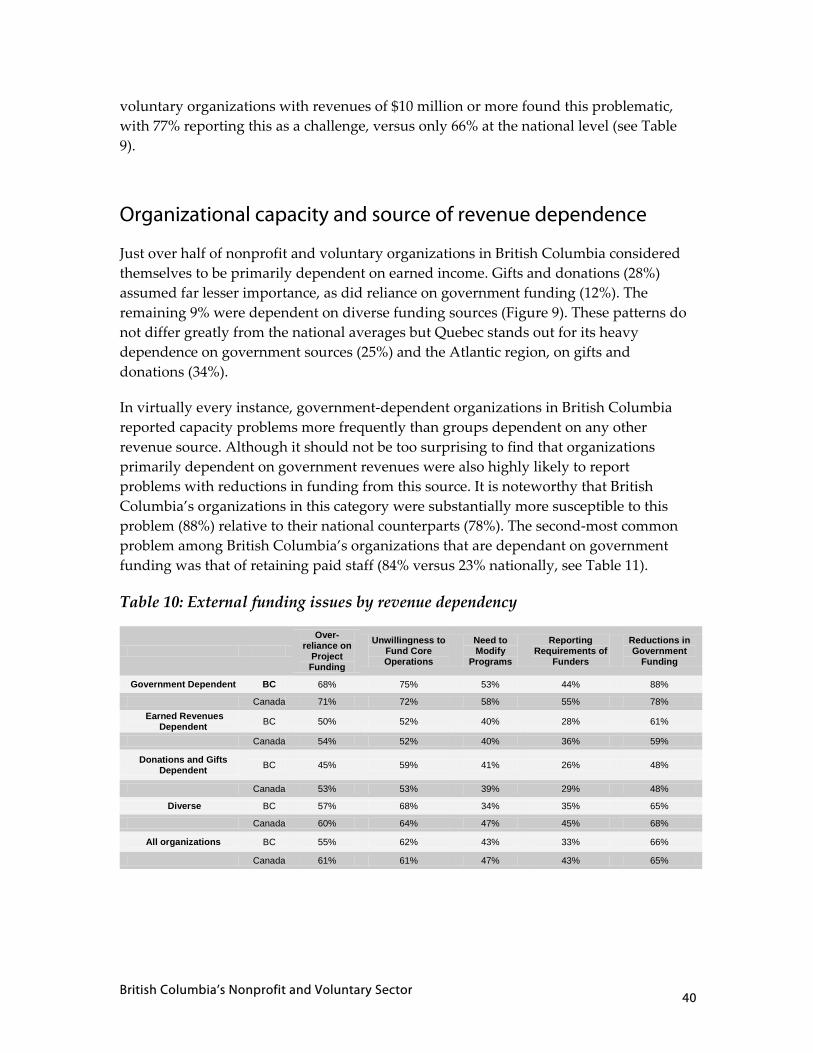
British Columbia’s Nonprofit and Voluntary Sector 40
voluntary organizations with revenues of $10 million or more found this problematic, with 77% reporting this as a challenge, versus only 66% at the national level (see Table 9).
Organizational capacity and source of revenue dependence
Just over half of nonprofit and voluntary organizations in British Columbia considered themselves to be primarily dependent on earned income. Gifts and donations (28%) assumed far lesser importance, as did reliance on government funding (12%). The remaining 9% were dependent on diverse funding sources (Figure 9). These patterns do not differ greatly from the national averages but Quebec stands out for its heavy dependence on government sources (25%) and the Atlantic region, on gifts and donations (34%).
In virtually every instance, government‐dependent organizations in British Columbia reported capacity problems more frequently than groups dependent on any other revenue source. Although it should not be too surprising to find that organizations primarily dependent on government revenues were also highly likely to report problems with reductions in funding from this source. It is noteworthy that British Columbia’s organizations in this category were substantially more susceptible to this problem (88%) relative to their national counterparts (78%). The second‐most common problem among British Columbia’s organizations that are dependant on government funding was that of retaining paid staff (84% versus 23% nationally, see Table 11).
Table 10: External funding issues by revenue dependency
Over-reliance on
Project Funding
Unwillingness to Fund Core Operations
Need to Modify
Programs
Reporting Requirements of
Funders
Reductions in Government
Funding
Government Dependent BC 68% 75% 53% 44% 88%
Canada 71% 72% 58% 55% 78% Earned Revenues
Dependent BC 50% 52% 40% 28% 61%
Canada 54% 52% 40% 36% 59%
Donations and Gifts Dependent BC 45% 59% 41% 26% 48%
Canada 53% 53% 39% 29% 48%
Diverse BC 57% 68% 34% 35% 65%
Canada 60% 64% 47% 45% 68%
All organizations BC 55% 62% 43% 33% 66%
Canada 61% 61% 47% 43% 65%
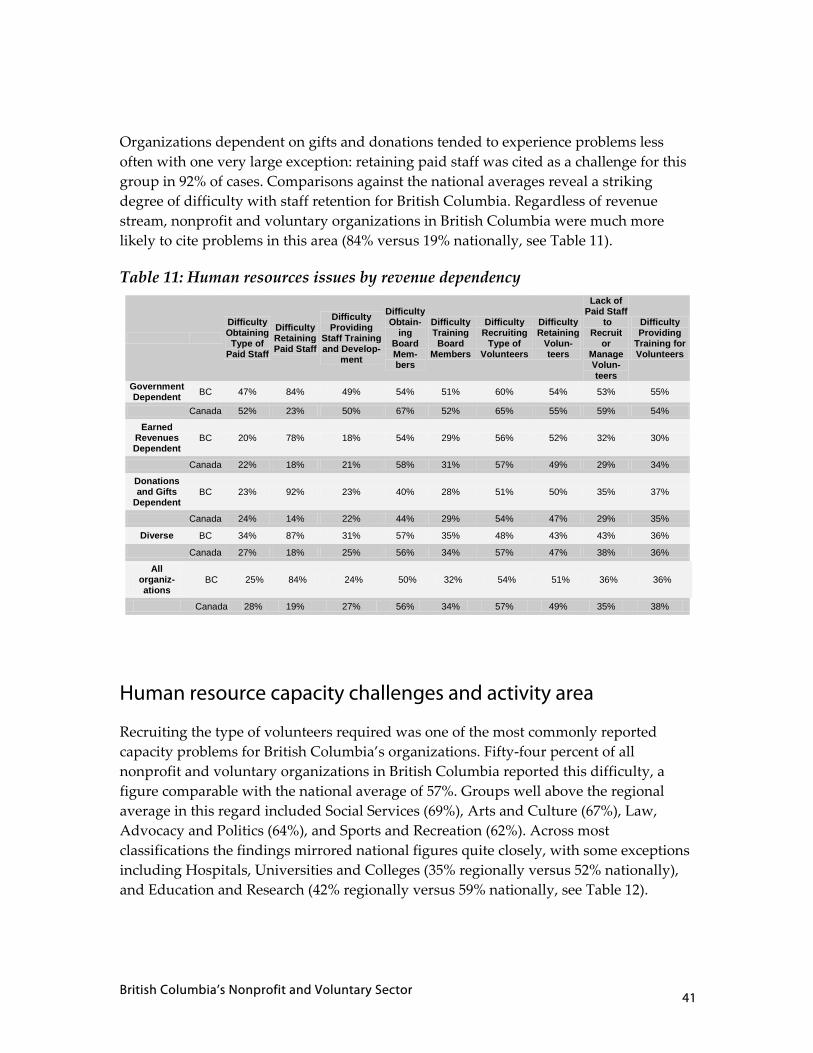
British Columbia’s Nonprofit and Voluntary Sector 41
Organizations dependent on gifts and donations tended to experience problems less often with one very large exception: retaining paid staff was cited as a challenge for this group in 92% of cases. Comparisons against the national averages reveal a striking degree of difficulty with staff retention for British Columbia. Regardless of revenue stream, nonprofit and voluntary organizations in British Columbia were much more likely to cite problems in this area (84% versus 19% nationally, see Table 11).
Table 11: Human resources issues by revenue dependency
Human resource capacity challenges and activity area
Recruiting the type of volunteers required was one of the most commonly reported capacity problems for British Columbia’s organizations. Fifty‐four percent of all nonprofit and voluntary organizations in British Columbia reported this difficulty, a figure comparable with the national average of 57%. Groups well above the regional average in this regard included Social Services (69%), Arts and Culture (67%), Law, Advocacy and Politics (64%), and Sports and Recreation (62%). Across most classifications the findings mirrored national figures quite closely, with some exceptions including Hospitals, Universities and Colleges (35% regionally versus 52% nationally), and Education and Research (42% regionally versus 59% nationally, see Table 12).
Difficulty Obtaining
Type of Paid Staff
Difficulty Retaining Paid Staff
Difficulty Providing
Staff Trainingand Develop-
ment
DifficultyObtain-
ing BoardMem-bers
DifficultyTrainingBoard
Members
DifficultyRecruiting
Type of Volunteers
Difficulty Retaining
Volun- teers
Lack of Paid Staff
to Recruit
or Manage Volun- teers
Difficulty Providing
Training for Volunteers
Government Dependent BC 47% 84% 49% 54% 51% 60% 54% 53% 55%
Canada 52% 23% 50% 67% 52% 65% 55% 59% 54%
Earned Revenues Dependent
BC 20% 78% 18% 54% 29% 56% 52% 32% 30%
Canada 22% 18% 21% 58% 31% 57% 49% 29% 34%
Donations and Gifts
Dependent BC 23% 92% 23% 40% 28% 51% 50% 35% 37%
Canada 24% 14% 22% 44% 29% 54% 47% 29% 35%
Diverse BC 34% 87% 31% 57% 35% 48% 43% 43% 36%
Canada 27% 18% 25% 56% 34% 57% 47% 38% 36%
All organiz-ations
BC 25% 84% 24% 50% 32% 54% 51% 36% 36%
Canada 28% 19% 27% 56% 34% 57% 49% 35% 38%
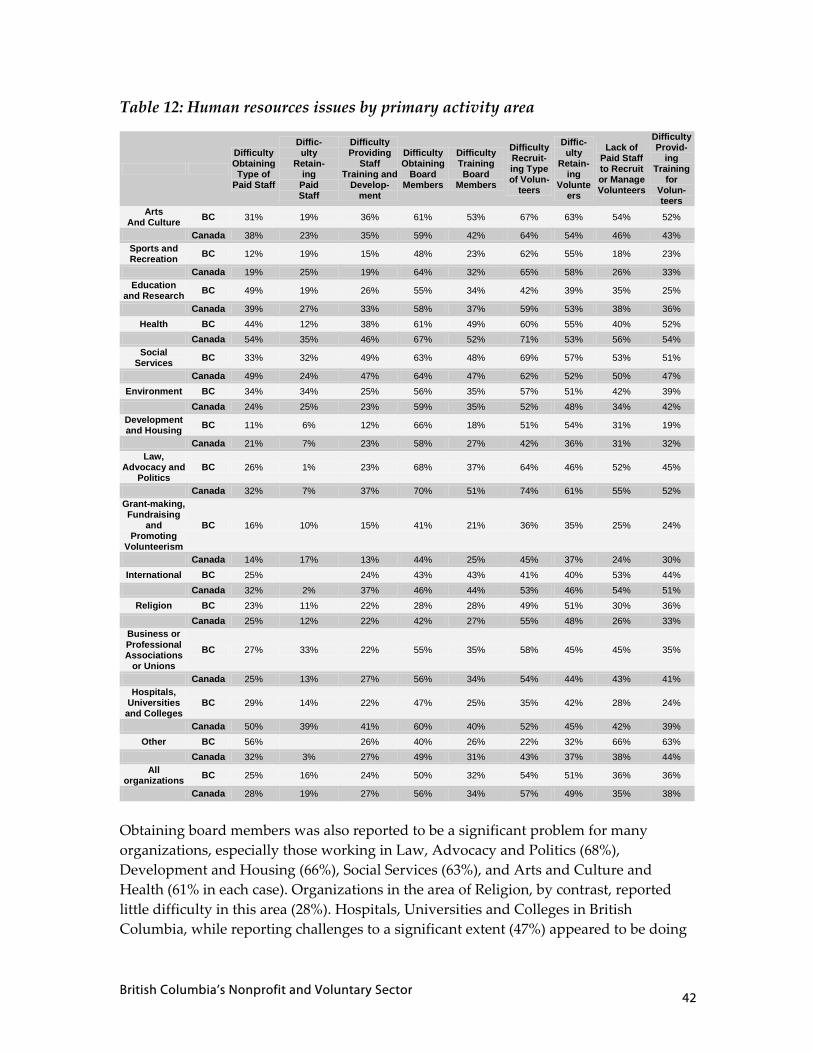
British Columbia’s Nonprofit and Voluntary Sector 42
Table 12: Human resources issues by primary activity area
Obtaining board members was also reported to be a significant problem for many organizations, especially those working in Law, Advocacy and Politics (68%), Development and Housing (66%), Social Services (63%), and Arts and Culture and Health (61% in each case). Organizations in the area of Religion, by contrast, reported little difficulty in this area (28%). Hospitals, Universities and Colleges in British Columbia, while reporting challenges to a significant extent (47%) appeared to be doing
Difficulty Obtaining Type of
Paid Staff
Diffic- ulty
Retain- ing
Paid Staff
Difficulty Providing
Staff Training and
Develop- ment
Difficulty Obtaining
Board Members
Difficulty Training Board
Members
Difficulty Recruit-ing Type of Volun-
teers
Diffic-ulty
Retain-ing
Volunteers
Lack of Paid Staff to Recruit or Manage Volunteers
Difficulty Provid-
ing Training
for Volun-teers
Arts And Culture BC 31% 19% 36% 61% 53% 67% 63% 54% 52%
Canada 38% 23% 35% 59% 42% 64% 54% 46% 43% Sports and Recreation BC 12% 19% 15% 48% 23% 62% 55% 18% 23%
Canada 19% 25% 19% 64% 32% 65% 58% 26% 33% Education
and Research BC 49% 19% 26% 55% 34% 42% 39% 35% 25%
Canada 39% 27% 33% 58% 37% 59% 53% 38% 36% Health BC 44% 12% 38% 61% 49% 60% 55% 40% 52%
Canada 54% 35% 46% 67% 52% 71% 53% 56% 54% Social
Services BC 33% 32% 49% 63% 48% 69% 57% 53% 51%
Canada 49% 24% 47% 64% 47% 62% 52% 50% 47% Environment BC 34% 34% 25% 56% 35% 57% 51% 42% 39%
Canada 24% 25% 23% 59% 35% 52% 48% 34% 42% Development and Housing BC 11% 6% 12% 66% 18% 51% 54% 31% 19%
Canada 21% 7% 23% 58% 27% 42% 36% 31% 32% Law,
Advocacy and Politics
BC 26% 1% 23% 68% 37% 64% 46% 52% 45%
Canada 32% 7% 37% 70% 51% 74% 61% 55% 52% Grant-making, Fundraising
and Promoting
Volunteerism
BC 16% 10% 15% 41% 21% 36% 35% 25% 24%
Canada 14% 17% 13% 44% 25% 45% 37% 24% 30% International BC 25% 24% 43% 43% 41% 40% 53% 44%
Canada 32% 2% 37% 46% 44% 53% 46% 54% 51% Religion BC 23% 11% 22% 28% 28% 49% 51% 30% 36%
Canada 25% 12% 22% 42% 27% 55% 48% 26% 33% Business or Professional Associations
or Unions
BC 27% 33% 22% 55% 35% 58% 45% 45% 35%
Canada 25% 13% 27% 56% 34% 54% 44% 43% 41% Hospitals,
Universities and Colleges
BC 29% 14% 22% 47% 25% 35% 42% 28% 24%
Canada 50% 39% 41% 60% 40% 52% 45% 42% 39% Other BC 56% 26% 40% 26% 22% 32% 66% 63%
Canada 32% 3% 27% 49% 31% 43% 37% 38% 44% All
organizations BC 25% 16% 24% 50% 32% 54% 51% 36% 36%
Canada 28% 19% 27% 56% 34% 57% 49% 35% 38%
British Columbia’s Nonprofit and Voluntary Sector 43
well relative to the Canadian average for the same group of organizations (60%). Concerns about a lack of paid staff to recruit volunteers were also less severe among Hospitals, Universities and Colleges in British Columbia (28% compared to 42% nationally, see Table 12), a finding which correlates with the lesser tendency for these regional organizations to register concerns with government funding reductions relative to Canadian Hospitals, Universities and Colleges as a whole (49% versus 82%).
Structural capacity problems and area of activity
Overall, nonprofit and voluntary organizations in British Columbia experienced problems less often than the national average with the most frequently cited problem – the ability to plan for the future. Specifically, 55% of British Columbia’s organizations versus 58% of organizations as a whole expressed this concern. Looking at sub‐sector variations, Social Services organizations in British Columbia reported this problem most often (73%) whereas at the national level, the top two activity areas were International organizations and Hospitals, Universities and Colleges (each with 72%). It is worth noting that Social Services and Hospitals, Colleges and Universities, whether nationally or regionally, typically relied on government funding. Difficulties with strategic planning are, no doubt, tied to the problem of the short‐term funding frequently allocated by government (see Table 13).
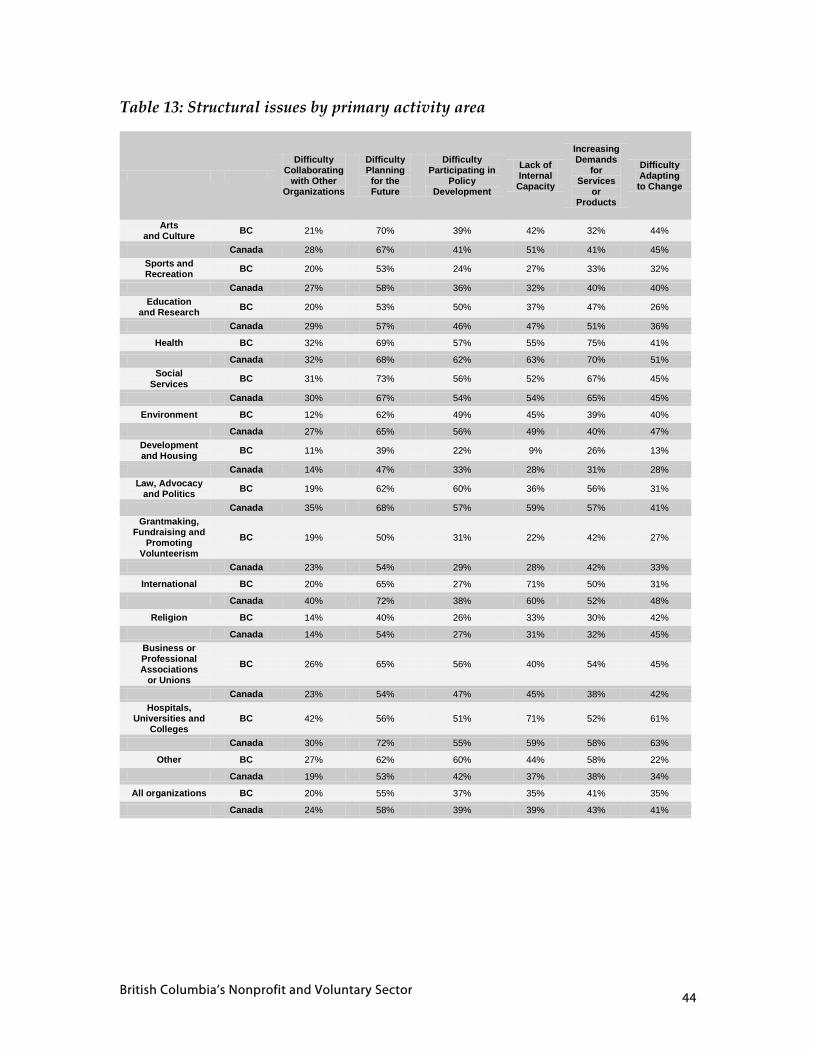
British Columbia’s Nonprofit and Voluntary Sector 44
Table 13: Structural issues by primary activity area
Difficulty Collaborating
with Other Organizations
Difficulty Planning for the Future
Difficulty Participating in
Policy Development
Lack of Internal Capacity
Increasing Demands
for Services
or Products
Difficulty Adapting to Change
Arts and Culture BC 21% 70% 39% 42% 32% 44%
Canada 28% 67% 41% 51% 41% 45% Sports and Recreation BC 20% 53% 24% 27% 33% 32%
Canada 27% 58% 36% 32% 40% 40% Education
and Research BC 20% 53% 50% 37% 47% 26%
Canada 29% 57% 46% 47% 51% 36%
Health BC 32% 69% 57% 55% 75% 41%
Canada 32% 68% 62% 63% 70% 51% Social
Services BC 31% 73% 56% 52% 67% 45%
Canada 30% 67% 54% 54% 65% 45%
Environment BC 12% 62% 49% 45% 39% 40%
Canada 27% 65% 56% 49% 40% 47% Development and Housing BC 11% 39% 22% 9% 26% 13%
Canada 14% 47% 33% 28% 31% 28% Law, Advocacy
and Politics BC 19% 62% 60% 36% 56% 31%
Canada 35% 68% 57% 59% 57% 41% Grantmaking,
Fundraising and Promoting
Volunteerism
BC 19% 50% 31% 22% 42% 27%
Canada 23% 54% 29% 28% 42% 33%
International BC 20% 65% 27% 71% 50% 31%
Canada 40% 72% 38% 60% 52% 48%
Religion BC 14% 40% 26% 33% 30% 42%
Canada 14% 54% 27% 31% 32% 45% Business or Professional Associations
or Unions
BC 26% 65% 56% 40% 54% 45%
Canada 23% 54% 47% 45% 38% 42% Hospitals,
Universities and Colleges
BC 42% 56% 51% 71% 52% 61%
Canada 30% 72% 55% 59% 58% 63%
Other BC 27% 62% 60% 44% 58% 22%
Canada 19% 53% 42% 37% 38% 34%
All organizations BC 20% 55% 37% 35% 41% 35%
Canada 24% 58% 39% 39% 43% 41%
British Columbia’s Nonprofit and Voluntary Sector 45
Conclusions The National Survey of Nonprofit and Voluntary Organizations provides, for the first time, vital information about the size and scope, financial and human resources, and capacity challenges of the voluntary and nonprofit sector in British Columbia.
Organizations in British Columbia contribute enormously to the economic and civic well‐being of the province. They are engaged in a broad range of activities which touch virtually every aspect of life and primarily serve their local communities. Accordingly, their ability to continue to serve in these capacities is a matter of interest to both the funders and primary beneficiaries of their services. Nonprofit and voluntary organizations are also public benefit organizations in most cases and most often serve people directly as opposed to other organizations. The general public and other groups such as children and youth and the elderly are typical recipients of their benefits and services.
British Columbia’s nonprofit and voluntary organizations, representing about 13% of all such organizations in Canada, reported revenues of nearly $11 billion in 2003.
As in other regions of Canada, there are a relatively small number of large organizations receiving a disproportionately large share of financial and human resources and a large number of small organizations which receive a disproportionately small share of resources. Hospitals, Universities and Colleges in British Columbia comprise just 1% of the sector overall but account for 18% of total revenues. At the national level, Hospitals, Universities and Colleges account for even more, with an average of 33% of revenues. Besides Hospitals, Universities and Colleges, several other sub‐sectors in British Columbia reported disproportionately large revenues: Health organizations representing 4% of organizations receive 24% of the revenues, and Research and Education, comprising 7%, account for 14% of the revenues.
Among organizations receiving 50% or more of their revenues from a single source, only 12% in British Columbia were primarily dependent on government, less than the national average of 17%. The majority of British Columbia’s organizations (51%) were primarily dependent on earned income.
While a substantial proportion of British Columbia’s nonprofit and voluntary organizations reported increases in their revenues, a slightly lower number also reported a decrease between 2000 and 2003, significantly more than the national average of 22%. British Columbia’s organizations were also less likely than the country as a whole to report stable revenues over this period.
Nonprofit and voluntary organizations in British Columbia account for 1.5 million volunteers positions. However, most organizations (60%) are served by fewer than 25 volunteers. More than half (52%) reported no change in volunteer numbers over the
British Columbia’s Nonprofit and Voluntary Sector 46
previous three years, while 29% reported increases, and 19% reported decreases. Smaller organizations in British Columbia appeared to have more difficulty augmenting their existing numbers of volunteers than did larger ones.
With a workforce of 147,000 people, the nonprofit and voluntary sector in British Columbia is also a significant employer. However, 42% of this workforce is part‐time and 36% is only temporary. Levels of paid staff remained the same between 2001 and 2003 for 63% of British Columbia’s organizations; 30% reported an increase and 7% reported a decrease.
The Survey results indicate a number of significant problems in the capacities of nonprofit and voluntary organizations to fulfill their missions and meet their mandates. Over half (55%) cited difficulty in planning for the future. Other problems cited by at least 50% of British Columbia’s organizations concerned volunteering. Fifty‐four percent reported having difficulty recruiting the type of volunteers needed; 51% reported difficulties in retaining volunteers, and 50% cited difficulty in obtaining board members.
Among nonprofit and voluntary organizations in British Columbia receiving government funding, 66% reported problems with reduced funding from this source. The twin problems of funders being willing only to fund projects (55%) and unwillingness to fund core operations (62%) were also conspicuous.
Broadly speaking, financial problems were more numerous for larger revenue organizations, especially among those receiving government funding. This suggests that large revenue organizations cannot necessarily escape the difficulties encountered by their smaller counterparts. Funding concerns also tend to pre‐dominate in such sectors as Arts and Culture, Health, and Social Services while concerns involving obtaining and retaining the right volunteers are more prominent in the Sports and Recreation, Religion, and Law, Advocacy and Politics areas.
While it is clear that British Columbia’s nonprofit and voluntary sector compares favorably in many respects to Canada as a whole, it cannot be left untended. To remain strong and meet tomorrow’s challenges, the sector itself must work toward developing a stronger voice to articulate its common concerns. It is also important that those who benefit from the sector—and this includes all the province’s institutions and individuals—must become more aware of its contributions and needs. It is hoped that this report will be just the first of a continuing series that will help to accomplish this goal.

British Columbia’s Nonprofit and Voluntary Sector 47
Imagine Canada 425 University Avenue, Suite 900 Toronto, Ontario Canada M5G 1T6 Tel: 416.597.2293 / 1.800.263.1178 Fax: 416.597.2294 [email protected]