identification of teacher interpersonal relationship
TRANSCRIPT
Georgia Southern University
Digital Commons@Georgia Southern
Electronic Theses and Dissertations Graduate Studies, Jack N. Averitt College of
Fall 2007
Identification of Teacher Interpersonal Relationship Behaviors Related to High School Hispanic Student Success Iris Torres Crews
Follow this and additional works at: https://digitalcommons.georgiasouthern.edu/etd
Recommended Citation Crews, Iris Torres, "Identification of Teacher Interpersonal Relationship Behaviors Related to High School Hispanic Student Success" (2007). Electronic Theses and Dissertations. 295. https://digitalcommons.georgiasouthern.edu/etd/295
This dissertation (open access) is brought to you for free and open access by the Graduate Studies, Jack N. Averitt College of at Digital Commons@Georgia Southern. It has been accepted for inclusion in Electronic Theses and Dissertations by an authorized administrator of Digital Commons@Georgia Southern. For more information, please contact [email protected].
IDENTIFICATION OF TEACHER INTERPERSONAL RELATIONSHIP BEHAVIORS
RELATED TO HIGH SCHOOL HISPANIC STUDENT SUCCESS
by
IRIS TORRES CREWS
(Under the Direction of Barbara J. Mallory)
ABSTRACT
This study investigated high school Hispanic students’ perceptions of their
mathematics or science teacher’s interpersonal relationship behaviors. The Questionnaire
on Teacher Interaction (QTI) was completed by 572 high school Hispanic students in
Georgia. Of these, 259 high school Hispanic students identified the teacher interpersonal
relationships behaviors of their mathematics teacher and 313 students identified the
behaviors of their science teacher. Ratings obtained from high school Hispanic students in
a district with a large percentage of high school Hispanic students whose scores on the
Georgia High School Graduation Tests (GHSGT) exceeded the reported state pass/pass
plus percentage, and ratings from high school Hispanic students in a district with a low
percentage of high school Hispanic students whose scores on the GHSGT were below the
reported pass/pass plus percentage for Hispanic students were compared. Differences
between ratings obtained in science and mathematics classes were also compared for
discussion using descriptive statistics and statistical analysis. Further statistical analysis of
the relationship among demographic factors, parental/community factors, and self-
reported final grade in mathematics or science, and the reported teacher interpersonal
relationship behaviors was reported.

2
On the QTI, high school Hispanic students ranked the teacher’s Leadership,
Understanding, and Helpful/Friendly Behaviors with the highest means and Admonishing,
Dissatisfied, and Uncertain Behaviors with the lowest means. High school Hispanic
students who reported a final grade of 90-100 in mathematics, reported high means on the
Strict, Admonishing, Uncertain, and Dissatisfied Behaviors domains. High school
Hispanic students who reported a final grade of 90-100 in science, reported higher means
in the Admonishing, Strict, Uncertain, and Dissatisfied Behaviors domains than high
school Hispanic students who reported a failing grade. The interaction between the
percentage of Hispanic students in a district and the subject area (mathematics/science)
was significant in the Understanding, Admonishing, and Helpful/Friendly Behaviors
domains.
The majority of the students reported that their parents were involved in decisions
regarding their high school program. Community members, outside of the immediate
family, did not get involved in decisions regarding the students’ high school program.
INDEX WORDS: Hispanics, High school dropouts, High school graduation, Hispanic student achievement, Secondary education, Teacher-student relationships, Questionnaire on Teacher Interaction
3
IDENTIFICATION OF TEACHER INTERPERSONAL RELATIONSHIP BEHAVIORS
RELATED TO HIGH SCHOOL HISPANIC STUDENT SUCCESS
by
IRIS TORRES CREWS
B.A., Jersey City State College, 1973
M.S., Nova University, 1976
A Dissertation Submitted to the Graduate Faculty of Georgia Southern University in
Partial Fulfillment of the Requirements for the Degree
DOCTOR OF EDUCATION
STATESBORO, GEORGIA
2007

4
© 2007
Iris Torres Crews
All Rights Reserved

5
IDENTIFICATION OF TEACHER INTERPERSONAL RELATIONSHIP BEHAVIORS
RELATED TO HIGH SCHOOL HISPANIC STUDENT SUCCESS
by
IRIS TORRES CREWS
Major Professor: Barbara J. Mallory
Committee: Linda M. Arthur Bryan W. Griffin
Electronic Version Approved: December 2007
6
DEDICATION
This dissertation is dedicated to my parents. Throughout my lifetime, they instilled
in me the invaluable benefits of an education and insured that I had every opportunity to
pursue my goals. There was never a doubt that I could achieve whatever I set out to. My
hardworking parents taught me not only to appreciate the gifts and talents that are God
given, but also encouraged me to set high goals and have a strong work ethic.
To my husband, you believed in me and supported my commitment to succeed.
Thank you for always being there and carrying my load. You never questioned my
endurance and were there all the way to the finish line. You are my one and only, and I
love you.
7
ACKNOWLEDGEMENTS
This study would not have been possible without the students and school
personnel in the two school districts in which I collected data. I am most appreciative to
the students who willingly provided the data and the exemplary administrators and school
personnel who genuinely had the students’ best interest in mind. Their willingness to
assist in the data collection made the task much more feasible.
My husband is my biggest cheerleader. He willingly took this journey with me.
His kindness, patience, love, encouragement, and support were beyond belief. I am
forever grateful and love him dearly. Family, friends, and colleagues frequently offered
words of encouragement to fulfill my aspirations and achieve my goals as a lifelong
learner. George was ever generous with his time in assisting me through the technical part
of this research. Yvonne was always willing to assist with typing dilemmas. Marie and
Sonya insured that the finished product met all editorial requirements. I would not be here
without their finishing touches.
I acknowledge and thank each member of my committee. Dr. Mallory, my chair,
through her commitment to the profession and her love of education, inspired me to
ponder, to question, and to investigate. I extend my sincere gratitude to her for helping me
overcome barriers to succeed. Her unconditional support and attention to detail served me
very well in completing this journey. Dr. Griffin, my methodologist, patiently guided me
through a myriad of numbers and helped me make sense of the data. I appreciated his time
and assistance in the pursuit and completion of this research. Dr. Arthur was a valued
committee member, whose experiences and background challenged me to look at
8
leadership. Her thoughtful feedback encouraged me to rethink, to clarify, and to go
beyond the obvious.
I extend my appreciation to faculty of the Educational Administration program at
Georgia Southern University’s Department of Leadership, Technology, and Human
Development. Through the required coursework, readings, and assignments, they inspired
and challenged the students to look at the vital role of leadership in our schools today.
Thank you, Jenny, my driving partner. Through your carefree spirit, you taught me
to unwind and keep going to the end. I also acknowledge my cohort members, whose
friendship I value. We learned from each other and I especially appreciated their support
and motivation.
Thank you, God. You answered my prayers and renewed my energy when I did
not think I could go another step.

9
TABLE OF CONTENTS
Page
ACKNOWLEDGEMENTS.................................................................................................7
LIST OF TABLES.............................................................................................................12
LIST OF FIGURES ...........................................................................................................13
CHAPTER
I INTRODUCTION ...........................................................................................14
Background ...........................................................................................16
Statement of the Problem ......................................................................24
Research Questions ...............................................................................25
Conceptual Framework .........................................................................26
Professional Significance ......................................................................27
Procedures .............................................................................................28
Limitations ............................................................................................31
Delimitations .........................................................................................32
Definition of Terms...............................................................................32
Summary ...............................................................................................32
II REVIEW OF LITERATURE ..........................................................................34
High School Hispanic Student Achievement ........................................34
Interpersonal Teacher Behaviors...........................................................38
Resiliency ..............................................................................................54
School/Family/Community Partnerships ..............................................60
Summary ...............................................................................................65

10
III METHOD ........................................................................................................66
Purpose and Context of the Study .........................................................66
Research Design……………………………………………………… 67
Participants ............................................................................................68
Instrumentation......................................................................................70
Data Collection......................................................................................72
Data Analysis ........................................................................................73
Summary ...............................................................................................74
IV REPORT OF DATA AND DATA ANALYSIS .............................................76
Introduction ...........................................................................................76
Research Questions ...............................................................................77
Setting………………………………………………………………….77
Findings.................................................................................................82
Summary…………………………………………………………….102
V SUMMARY, CONCLUSIONS, RECOMMENDATIONS, AND
IMPLICATIONS………………………………………………………..105
Introduction…………………………………………………………..105
Discussion ...........................................................................................108
Conclusions .........................................................................................113
Implications.........................................................................................114
Recommendations ...............................................................................119
REFERENCES ................................................................................................................121
APPENDICES .................................................................................................................136

11
A INSTITUTIONAL REVIEW BOARD APPROVAL LETTER ...................137
B QUESTIONNAIRE ON TEACHER INTERACTION .................................139
C SCORING PROCEDURE FOR THE QUESTIONNAIRE ON TEACHER
INTERACTION ...........................................................................................144
12
LIST OF TABLES
Page
Table 1: Description of Scales and Sample Items for Each Scale of the QTI
(Adapted from Wubbels, 1993) ..........................................................................29
Table 2: Descriptions of Classroom Environments Typical for the Eight
Typologies of Interpersonal Styles .....................................................................45
Table 3: Mayeroff’s Critical Components of Caring..........................................58
Table 4: The Eight Domains of the Model for Interpersonal Behavior..............71
Table 5: Mean and Standards Deviation for the Eight Domains of the QTI ......83
Table 6: Outcomes for Comparison of Large and Small Group.........................84
Table 7: Comparison of Districts with Large and Small Percentage of Hispanic
Students..................................................................................................88
Table 8:Self-Reported Final Grades ...................................................................93
Table 9:Influence of Self-Reported Grades on Domains....................................94
Table 10: Parental/Community Support .............................................................96
Table 11: Overview of Correlation Matrix with each Domain...........................98
13
LIST OF FIGURES
Page
Figure 1: Typical Teacher Behaviors Relating to the Eight Sectors of the MITB .........41
Figure 2: The Model for Interpersonal Teacher Behavior……………………………… 43
14
CHAPTER I
INTRODUCTION
Hispanics are the largest minority group in the United States, at 13.7% of the
population in 2003 – and the Census Bureau projects 20% by 2030 (Mehring, 2004). The
Hispanic student population is growing rapidly across the country, but more rapidly in
secondary than elementary schools (Capps, et al., 2001). Hispanic youth make up one-
fifth of public school enrollment in the United States (Crosnoe, 2005).
Demographic trends in the United States present major challenges for public
education (Fusarelli & Boyd, 2004). In the year 2000, the Census Bureau reported that the
Hispanic population had grown by nearly 60 percent since 1990. Hispanics are a diverse
group including individuals of different origins and races (Llagas & Snyder, 2003). The
Census Bureau defines Hispanic, or its pseudo-synonym, Latino, as individuals with a
Mexican, Puerto Rican, Cuban, Central American, or South American heritage living in
the United States (Sangillo, 2002). A common Spanish language and a heritage that
contains aspects of Indian, African, and Spanish cultural and religious values unite U.S.
Hispanics. However, geography, country of origin, race, class, traditional group
differences, and the time and circumstances of their entry into the United States divides
Hispanics (Valdivieso & Nicolau, 1992).
Hispanic educational attainment is the indicator that most dramatically illustrates
the lack of parity between Hispanic and Anglo populations (Valdivieso & Nicolau, 1992).
According to a study released by The Civil Rights Project at Harvard University and the
Urban Institute in 2004, only approximately 68% of all students nationally who enter 9th
grade will graduate on time with regular diplomas in 12th grade. This crisis is particularly
15
acute in Southern states, which have some of the lowest graduation rates in the country
(Orfield, 2004). Several southern states are now in the epicenter of a huge Latino
migration (Orfield, 2004). In Georgia, which has a substantial and growing Hispanic
population, the graduation rate for Hispanics was 56.3% in 2002 (Orfield, Losen, Wald, &
Swanson, 2004).
For U.S. born Hispanics, the dropout rate cannot be solely attributed to a language
deficiency (Adam, 2003). Some individuals appear to readily cross language and cultural
boundaries, adjust well in school, and succeed; others do not (Ogbu, 1992). Thousands of
this nation’s Hispanic students have left school without a diploma (Secada, et al., 1998).
Some left because they felt that other life options were more viable; others left because
they felt that they were being pushed out; and still others left because of family
obligations (Secada, et al., 1998). Yet almost all these students left school because no one
had established individual relationships with any of them, nor communicated high
academic expectations to them, nor provided them with meaningful opportunities to
achieve those expectations (Secada, et al., 1998).
Rumberger (2001) states that individual attitudes and behaviors are shaped by the
institutional settings where people live. The success of Hispanic students can often be
measured by “the extent to which kids feel connected to the schools” (Adam, 2003, p.25).
Schools may engage in practices or create conditions that push some students out of
school (Lee & Burkam, 2003). Rather than being an alienating environment, schools can
be supportive by employing teachers that care and ensuring that students want to go to
school (Adam, 2003). Counselors, school administrators, and faculty assess the school
16
climate to determine the factors leading to alienation and determine strategic interventions
for those students at risk of dropping out (Stanard, 2003).
Background
Congress has taken a step in recognizing the severity of the dropout problem by
including graduation rate accountability provisions in the No Child Left Behind (NCLB)
legislation enacted in 2002 (Orfield, et al., 2004). This federal education policy
establishes a framework of standards, testing, and accountability absent in previous
federal legislation (Fusarelli, 2004). NCLB judges school success or failure on student
performance by subgroup – by race, family income, English proficiency and other factors
(Fusarelli, 2004). With its emphasis on student performance by subgroups, NCLB
encourages states to disaggregate data to the student level in an effort to demonstrate the
achievement gap between and among racial/ethnic groups (Fusarelli, 2004). Schools that
fail to graduate large pluralities of their minority students are held accountable (Orfield, et
al., 2004). The U.S. Department of Education, in partnership with states, local
communities, parents, teachers and others developed a strategic plan (2002-2007) to
implement the law and to ensure that its principles guide all endeavors (Paige, 2002).
No Child Left Behind is an opportunity for Hispanics to secure those resources and
options that will prepare them to close the achievement gap (President’s Advisory
Commission on Educational Excellence, 2003). The state monitors the progress of the
districts to insure that students have achieved 100% proficiency in reading and math in
twelve years (Orfield, et al., 2004). The districts monitor their schools to ensure that each
school is making adequate yearly progress (AYP) toward reaching the 100% goal
(Orfield, et al., 2004). Graduation rate accountability was inserted into NCLB’s definition
17
of adequate yearly progress to create an incentive for school officials to hold onto, rather
than push out struggling and disadvantaged students (Orfield, et al., 2004). The annual
test results support the development and implementation of strategies/ interventions for all
students (President’s Advisory Commission on Educational Excellence, 2003).
In October 2002, President Bush named the White House Commission on
Educational Excellence for Hispanic Americans, which aimed to reduce the Hispanic high
school dropout rate – now to the point where one in three Hispanics has failed to complete
high school (Stern, 2004). After an 18- month study, the President’s Advisory
Commission on Educational Excellence for Hispanic Americans submitted a final report
which stated that low societal expectations for Hispanic youth, poor academic instruction
(particularly in reading), and school personnel who are poorly prepared to teach Hispanic
students were issues contributing to the dropout problem plaguing Hispanic students
(President’s Advisory Commission on Educational Excellence, 2003). Raising teacher
expectations of Hispanic Americans and improving teacher training are cited as critical to
improving the low high school dropout rate (Stern, 2004). As the Hispanic population
increases throughout the nation, its impact will be apparent in most aspects of schooling
including teaching strategies and techniques and school/community relations (Marshall,
2002).
Because of the enormous growth in the number of Hispanic youth as a result of
immigration and high birth rates, the number of Hispanic 16 to 19 year old dropouts grew
dramatically, from 347,000 to 529,000 between 1990 and 2000 (Fry, 2003). In 2000,
twenty-one percent of Hispanic students were school dropouts, in comparison to eight
percent of white youth and twelve percent of black youth (Fry, 2003). Hispanic youth face
18
obstacles in the American educational system that threaten to diminish their long-term
prospects and impact the social mobility of the Hispanic population as a whole (Crosnoe,
2005).
Schools can influence a student’s decision to drop out (Lee & Burkam, 2003).
Understanding why students drop out of school is a complex problem influenced by a
number of direct and indirect factors related to the individual, family, school and
community that interact and influence the decision over a long period of time (Stanard,
2003). Romo and Falbo (1995) report that students navigate the culture of the home, the
adult culture of the school system and the student culture of the school in order to
graduate. For Hispanic youth, there are two general dimensions of schooling that foster
basic adjustment and functioning (Crosnoe, 2005). These are the academic side of
schooling, which focuses on achievement, and the social-psychological side of schooling,
which includes school attachment, educational engagement, and extracurricular activities
(Crosnoe, 2005). Schools can engage in specific actions oriented towards keeping
Hispanic students in schools (Romo & Falbo, 1995). These include: focus on student
learning; meet basic needs; make participation in school work more rewarding; value
persistence and hard work; and mobilize resources to link school and work (Romo &
Falbo, 1995).
According to the Hispanic Policy Development Project, Hispanic youth almost
unanimously identify “someone caring” as the most important factor in academic success
(Duany & Pittman, 1991, p.7). The need for caring teachers is a concern of high school
students (Bernard, 1993). The academic success of many Hispanic students is affected by
the nature of the teacher/student relationship (Marshall, 2002). Students want teachers to
19
recognize who they are, to listen to what they have to say, and to respect their efforts
(Phelan, Davidson, & Hanh, 1992). There are differences in the way high-and low-
achieving students define caring behavior (Phelan, et al., 1992). High achievers associate
caring with assistance in academic matters and direct interaction is not always necessary;
whereas, low-achievers equate caring with certain personality traits (i.e. patience,
tolerance, listening) and prefer direct, personal interaction (Phelan, et al., 1992).
According to a study done by Stanford University’s Center for Research on the context of
Secondary School Teaching: “the number of student references to wanting caring teachers
is so great that we believe it speaks to the quiet desperation and loneliness of many
adolescents in today’s society” (Phelan, et al., 1992, p.696).
The level of caring and support within a school gives educators an indicator of
positive outcomes for students (Bernard, 1993). Despite repeated failures and academic
difficulties, some Hispanic students continue to fight through the adversity and become
successful (Hassinger & Plourde, 2005). Students who leave high school before
graduating report a lack of social support as one reason for their decision (Lee & Burkam,
2003). These students feel disconnected from teachers (Croninger & Lee, 2001). Dropouts
are said to have fewer positive social interactions and less access to assistance from
teachers than their more successful peers (Croninger & Lee, 2001).
An approach to helping at-risk students succeed is to examine the notion of
resilience (McMillan & Reed, 1994). Resiliency inquiry did not emerge from academic
grounding in theory, but rather through the phenomenological identification of
characteristics of survivors, mostly young people living in high- risk situations
(Richardson, 2002). The foundational study cited in most of the resiliency literature is a
20
longitudinal study by Emmy Werner and R. Smith (Richardson, 2002). Werner and Smith
studied a multiracial population of children from 1955 through the mid 1980s and
categorized the resilient qualities that helped the children remain competent in the face of
high-risk environments (Richardson, 2002). Resiliency based research focuses on each
student’s potential for success (Bernard, 1993). The construct of “educational resilience”
is not viewed as a fixed attribute; rather “alterable” factors that can impact an individual’s
success in school are the focus (Waxman, Gray, & Padron, 2003, p. 1).
When looking at a profile of a resilient student, educators look beyond personality
traits and examine the environmental characteristics that have fostered resiliency
(Bernard, 1993). Resilient students are those students who succeed in school despite the
presence of adverse conditions (Waxman, et al., 2003). Bernard (1993) reports that there
are four personal characteristics (alterable factors) that resilient children display: social
competence, problem-solving skills, autonomy, and a sense of purpose. Social
competence includes responsiveness, flexibility, empathy, caring, and communication
skills (Bernard, 1993). Problem-solving skills include planning and resourcefulness in
seeking help from others (Bernard, 1993). Autonomy denotes an ability to act
independently and exert some control over one’s environment (Bernard, 1993). McMillan
& Reed (1994) describe four other factors related to resiliency: motivation and goal
orientation, positive use of time, family life, and school and learning environment.
Research on resilience provides a framework for examining why some students are
successful in school, while others from the same social and economic background and
communities are not (Waxman, et al., 2003). For students whose customs, values, and
21
home practices are significantly different from school values and customs, alienation and
“discontinuity” often occurs (Wahome, 2003, p. 6).
Positive social relationships can create powerful incentives for students to come to
school (Lee & Burkam, 2003). Schools are central to this developmental process and are
an essential source of social capital for adolescents (Croninger & Lee, 2001). How
schools are structured and organized in relation to their academic and social elements
influences school engagement (Lee & Burkam, 2003). The development of a successful
support network rests upon students developing social consciousness in response to their
assessment of the opportunity structure (Conchas, 2001).
Croninger and Lee (2001) report that social capital is strongly related to dropping
out, even after taking students’ social and academic risk factors into consideration. In
their research, Croninger & Lee (2001) focus on whether teachers provide students with
valuable forms of social capital. In addition, these researchers consider whether students’
access to social capital from high school teachers reduces the risk that students will drop
out of school. Social capital is often measured by relationships between students and
teachers (Croninger & Lee, 2001). Students prefer dynamic pedagogy, active rather than
passive instruction and transaction rather than transmission (Phelan, et al., 1992). When
students do not understand the material and find the teacher unapproachable, they exhibit
frustration and discouragement (Phelan, et al., 1992). Some of these students may persist
in asking questions, yet others may be fearful of revealing their inability to comprehend
(Phelan, et al., 1982). Teacher-based forms of social capital reduce the probability of
dropping out (Croninger & Lee, 2001).

22
Shared responsibility for the social well being of a school is rooted in a “culture of
concern” (Valdivieso & Nicolau, 1992, p. 32). Such a culture fosters bonds among
students and between students and the school, and it promotes a strong sense of belonging
(Valdivieso & Nicolau, 1992). A nurturing school climate has the power to overcome risk
factors in the lives of students (Bernard, 1993). Creating this climate for students
necessitates creating this environment for all school personnel (Bernard, 1993).
Challenging a student to excel is caring for that student (Valdivieso & Nicolau, 1992). To
look beyond students’ risks and see their resiliency, educators acknowledge their own
strengths and resiliency (Bernard, 1993). Teachers who are not well prepared to deal with
culturally and linguistically different students make inaccurate assumptions about those
students (President’s Advisory Commission on Educational Excellence, 2003). The
teacher may not relate well to a student and may assume the student has limited
intellectual capabilities (President’s Advisory Commission on Educational Excellence,
2003). There are stereotypes that have been used to blame Hispanic students for dropping
out of school (Secada, et al., 1998). These include, but are not limited to: Hispanics do not
care about school, they do not want to learn, they engage in violence and/or belong to
gangs, Hispanics cannot achieve and they have cultural backgrounds that are incompatible
with schools (Secada, et al., 1998).
Hispanic students thrive best in school and classroom environments in which
teachers demonstrate commitment to their success (Marshall, 2002). It is not productive to
confuse caring for fellow human beings with handouts or lowered expectations
(Valdivieso & Nicolau, 1992). After a school establishes an orderly climate and the
beginning of a culture of concern for all the students, the teachers can raise academic
23
standards and expect greater effort from the students (Valdivieso & Nicolau, 1992).
Schools can shape social and academic success (Conchas, 2001).
Before dropping out of school, at-risk students demonstrate low self esteem, a
sense of having lost control of their futures, and perceive that teachers do not show much
interest in them (Wehlage, Rutter, & Turnbaugh, 1987). Schools can influence students’
beliefs and attitudes and schools can change student perceptions about adults’ caring and
interest (Wehlage, et al., 1987). The Hispanic Dropout Project reported in its final report,
No More Excuses (1998), the efforts of school personnel in programs that were effective
in preventing students from dropping out (Secada, et al., 1998). There were two major
findings and recommendations in this report involving Hispanic students (Secada, et al.,
1998). First, school personnel must connect to Hispanic students and their families,
provide students with a quality education based on high standards, and provide backup
options to move beyond past obstacles (Secada, et al., 1998). Second, students and their
families deserve respect (Secada, et al., 1998). There must be a shared belief that Hispanic
students belong (Secada, et al., 1998).
An epidemiological model has often been used to explain success and failure in
school (Aviles, Guerrero, Howarth, & Thomas, 1999). This model supports the belief that
poor achievement is inherent in the student because of the demographic, socioeconomic,
and/or behavioral characteristics that contribute to the student’s success or failure (Aviles,
et al., 1999). Thus, educators are limited in their efforts to help the students since
“predisposing” factors cannot be readily changed and education is perceived as the
remedy for the dropout problem (Aviles, et al., 1999). Shifting to a perspective of
empowerment, or bicultural competence, may improve the educational opportunities of
24
minority students (Aviles, et al., 1999). In the empowerment model, majority-minority
societal group relations, school-minority community relations, and educator-minority
relations impact school performance (Aviles, et al., 1999).
The principal’s involvement in framing, conveying, and sustaining school goals
represents an important domain of influence on student outcomes (Cavazos, 1999).
Educators face the critical issue of identifying and understanding protective practices that
moderate risk and foster resilience (Jacobsen, 2005). Sergiovanni (1982) provides a
quality leadership equation that encompasses leadership skills interacting with leadership
antecedents, meanings and cultural expression. This leadership model is interdependent
and requires an interaction of perspectives, norms, beliefs, and principles to which
organizational members give allegiance (Sergiovanni, 1982). Principals can utilize
instructional leadership to enhance the academic success of Hispanic students (Cavazos,
1999). Escoffery (2004) engaged in a study that is congruent with Sergiovanni’s (1979)
suggestion that the school principal can shape the school culture to support and ensure
educational excellence for all students. Escoffery (2004) reported that principals, in
successful Hispanic majority high schools, sustain a strong emphasis on teacher
accountability for the academic performance of all students. Schools are better able to
fulfill their potential when they are armed with information that enhances understanding
of diverse populations (Valdivieso & Nicolau, 1992).
Statement of the Problem
There is evidence that a significant percentage of Hispanic students are dropping
out of high school. Some students succeed in school while others choose to drop out.
Reportedly, many Hispanic students perceive their teachers as engaged in inadequate
25
student – teacher interaction. These teacher behaviors may negatively impact the students’
achievement. The teachers’ lack of interest/concern in students can promote alienation.
Subsequently, these students may lack self-esteem and/or motivation to succeed if they
feel that the teachers do not expect them to succeed or care about their success.
Educational systems need to adjust to accommodate diverse populations. Some
Hispanic students are achieving academically while others are not. Students may possess
resiliency factors and succeed in spite of the difficult issues with which they may have
had to deal. It is unclear whether socio-economic status, student/teacher personality traits,
and/or parental involvement contribute to student success.
Teacher behavior is said to influence student behavior. An examination of the
interaction of high school Hispanic students’ learning environments with learning
processes is of importance in addressing student success. The purpose of this study was to
determine high school Hispanic students’ perceptions of teachers’ interpersonal
relationship behaviors to understand how the behaviors relate to Hispanic student success.
Research Questions
The proposed study was designed to answer the following major research
question: What are the teacher interpersonal relationship behaviors related to Hispanic
student success in high school? Several sub questions guided the study:
1.How do high school Hispanic students identify teacher interpersonal relationship
behaviors within the eight domains of the Model for Interpersonal Behavior on the
Questionnaire on Teacher Interaction?
26
2.Which teacher interpersonal relationship behaviors, as identified by high school
Hispanic students on the Questionnaire on Teacher Interaction, vary by setting and
selected academic disciplines: mathematics and science?
3.Do the teacher interpersonal relationship behaviors, as identified by high school
Hispanic students on the Questionnaire on Teacher Interaction, differ by certain
characteristics: student’s stated chronological age, current grade placement,
student self-reported final grade in mathematics/science, and parental/community
support?
Conceptual Framework
This research study was based on literature that hypothesizes that Hispanic student
success in high school results from factors related to classroom environment and teacher
behaviors (McMillan & Reed, 1994). Werner and Smith (1992) propose that the most
important factor is a caring relationship with someone, regardless of whether that person
is a parent, teacher, or community mentor. Richardson’s resiliency model postulates that
there are specific learning environment qualities (teachers’ classrooms) that promote
resiliency in children: i.e., caring and support, high expectations and
participation/involvement (Richardson, 2002). The construct of educational resilience is
not viewed as a fixed attribute but as something that can be promoted by focusing on
alterable factors that can impact an individual’s success in school (Waxman, et al., 2003).
Another feature of this study was the theoretical framework used to conceptualize
teaching. Individuals in the classroom environment and what they learn are influenced by
a variety of interpersonal, emotional and cultural factors in addition to the cognitive
factors associated with classroom learning (denBrok, Brekelmans, & Wubbels, 2004). In

27
this context, the teacher is one of the elements contributing to the opportunities for pupils
to learn. Teaching can be studied from an interpersonal perspective that describes
teaching in terms of the relationship between teacher and pupils (Brekelmans, Sleegers, &
Fraser, 2000).
Professional Significance
Demographics provided by the Census Bureau direct attention to the current and
projected significant increase of Hispanics in the United States. Educational preparation
not only affects the individual but also impacts the nation’s economic growth and social
development. Closing the achievement gap extends beyond academic modifications and
special programs. Accountability legislation charges schools with the responsibility of
ensuring success for all students. The graduation rate for Hispanic students is
considerably below the norm. This investigation added information to the scholarly
research and literature in the field of high school Hispanic students’ academic success. A
focus on educational resiliency leads to improvement in the education of students at risk
of academic failure.
The results of this investigation served as a basis for school leaders to take note of
the school climate and culture and to encourage behaviors that support academic success
for all students. Educators cannot control demographics and family conditions, but can
change/enforce policies and practices to ensure that the needs of individuals at risk of
academic failure are addressed. Schools can incorporate resiliency-building factors and
create programs around predictors of academic success. Additionally, the data suggested
that teachers, who give students the support necessary to attain the high expectations
established, promote students’ academic success.
28
Procedures
Data were collected through the use of the Questionnaire on Teacher Interaction
(Wubbels, Levy, & Fraser, 1993). This instrument was selected for use in this research
because it was designed to gather data that describes students’ perceptions of teacher
behavior. Teacher behavior in the Questionnaire on Teacher Interaction (QTI) is
represented in eight scales and is based on the circumplex model of communication
proposed by Leary (1957). These scales are arrayed around two axes representing an
Influence dimension and a Proximity dimension. Each dimension is divided into axes that
describe specific aspects of teacher behavior in the classroom. The QTI contains eight
scales based on the Model of Interpersonal Teacher Behavior. There are eight domains of
the Model for Interpersonal Teacher Behavior: Strict Behavior, Leadership Behavior,
Helping/Friendly Behavior, Understanding Behavior, Student Responsibility/Freedom
Behavior, Uncertain Behavior, Dissatisfied Behavior, and Admonishing Behavior (Fisher,
Fraser, & Rickards 1997). Table 1 provides a description of the scales and corresponding
sample items. Each item is scored on a 5-point Likert scale (0-4).

29
Table 1
Description of Scales and Sample Items for Each Scale of the QTI (Adapted from
Wubbels, 1993)
Scale Name Description of Scale Sample Item (The extent to which the teacher ...) Leadership ... leads, organizes, This teacher talks gives orders, enthusiastically determines procedure about his/her and structures the subject. classroom situation. Helping/Friendly ... shows interest, This teacher helps behaves in a friendly us with our work. or considerate manner and inspires confidence and trust. Understanding ... listens with This teacher interest, empathizes, trusts us. shows confidence and understanding and is open with students. Student ... gives opportunity We can decide some Responsibility/ for independent work, things in this Freedom gives freedom and teacher's class. responsibility to students. Uncertain ... behaves in an This teacher seems uncertain manner uncertain. and keeps a low profile. Dissatisfied ... expresses This teacher dissatisfaction, thinks that we looks unhappy, cheat. criticizes and waits for silence. Admonishing ... gets angry, This teacher gets expresses irritation angry and anger, forbids unexpectedly. and punishes. Strict ... checks, maintains This teacher is silence and strictly strict. enforces the rules.
30
Two public school districts in Georgia were selected for this study. In the first
district, a Georgia public high school was selected based on multiple criteria: (1)
enrollment of at least 1500 students, (2) had at least 50% Hispanic student population, (3)
the majority of teachers had a minimum of 10 years teaching experience, and (4) more
than 50% of Hispanic students taking the Georgia High School Graduation Tests had a
score of pass/pass plus on the Mathematics and Science portions. Comparative data were
collected from another sample of students in a second school district that had a smaller
percentage of high school Hispanic students and lower high school Hispanic student
achievement in mathematics and science, as measured by the Georgia High School
Graduation Tests. After fulfilling the requirements to obtain school district and university
internal review board approval, data collection began. Hispanic students currently
enrolled in grades 9-12 in the selected Georgia public high school were asked to
voluntarily complete the questionnaire. Parents and students, prior to participation,
completed an informed consent form. The consent form was translated to Spanish, if
warranted, to insure comprehension.
After administration of the QTI to students, mean differences between groups
were calculated using analysis of variance procedures (ANOVA) for each variable.
Analysis of variance was used to compare the means of two or more independent samples
and to test whether the differences between the means were statistically different (Ravid,
1994). The variables included: student’s stated chronological age, current grade
placement, student’s self- reported final grade in mathematics or science, and
parental/community support. Mean and standard deviation were calculated for each
31
variable. All data were analyzed using the Statistical Analysis Package for the Social
Sciences, version 13 (SPSS, 2004). The data were reported in table and narrative format.
Limitations
This study was limited geographically and demographically to only one state.
Thus, generalizability may be compromised. Generalizability is problematic since the
findings may not apply to other cases representing the phenomenon being studied. Lee
Cronbach (1975) argues that any generalization should be regarded as a tentative
hypothesis that must be tested against specific conditions operating in each situation.
Another limitation was the extent that Hispanic students had been assimilated into
the community. The length of time enrolled in the school may have not only impacted
their perceptions of teachers’ behaviors, but also their awareness of community resources
and support available to them. In addition to assimilation factors, English language
fluency was another limitation. Although clarification was provided if a student asked, the
instrument used was administered in English.
A fourth limitation was that the investigation depended on data as reported by the
students. A disadvantage of this self-reported data is potential inaccuracy. In order to
address this issue, this study used internationally validated scales of the revised Fraser
Questionnaire of Classroom Environment (Wubbels et al., 1993). By using a validated
scale, the changes in the calibration of the Fraser Questionnaire will not result in changes
in questionnaire results. The purpose of this study was to obtain information regarding
high school Hispanic students’ perceptions and the participants were reminded that there
was no right or wrong answer. In their research, Boman and Yates (2001) allude to the
possibility that students’ perceptions could also be affected by their expectancies with
32
regard to the high school experience. This effect could distort students’ perceptions of
teacher interactions and impact generalizability of research findings.
A fifth limitation was the specific data collected, teacher interpersonal relationship
behaviors. Due to the nature of the research question, the researcher was limited to data
provided by students during a specific school year. Focus groups with school personnel
helped the researcher better understand the educational setting of the students. The
researcher gained insight relative to the programs and policies pertaining to the high
school Hispanic students.
Delimitations
The data used in the study to measure student achievement are available through
the Georgia Department of Education’s yearly Georgia Public education report cards
(Georgia Department of Education, 2005).
Definition of Terms
Hispanic – a person of Mexican, Puerto Rican, Cuban, Central or South American, or
other Spanish culture or origin, regardless of race (State of Georgia K-12 Report Card).
Drop out – a student who withdraws and is no longer pursuing a high school diploma in a
state approved education program; students who have completed all the required
coursework and required units, but have not been able to pass the Georgia High School
Graduation Tests are not considered dropouts (Education Coordinating Council, Office of
Education, Atlanta, GA).
Summary
The researcher proposed an investigation that directed attention to Hispanics, a
large minority group who is at-risk for dropping out of the educational system and

33
truncating or reducing their opportunities for educational and socioeconomic attainment.
Demographic, socioeconomic, and/or behavioral characteristics that contribute to the
student’s success or failure may be perceived as an explanation of success and failure in
school. Educators cannot control demographics and family conditions, but can engage in
practices to ensure that the needs of individuals at risk of academic failure are addressed.
Students may perceive teachers who incorporate resiliency factors as agents who give
students the support necessary to achieve high rates of academic success.
Schools are receiving relentless scrutiny due to the emphasis on accountability and
the increased expectations of national standards and assessments. Teachers are said to
play an important role in the success of resilient students. Research data support the belief
that student perception of the teachers’ interpersonal qualities positively impacts school
success.
34
CHAPTER II
REVIEW OF LITERATURE
The purpose of this chapter was to provide a review of the literature as it relates
tohigh school Hispanic student achievement, interpersonal teacher relationship behaviors,
resiliency, and school/family, community partnerships. An overview of the status of high
school Hispanic students and their school success is presented in the first section. Section
two reviews literature pertinent to teacher interpersonal relationship behaviors as related
to student school performance. The interpersonal perspective of teaching is addressed.
Factors related to resiliency, as presented in the literature, are discussed in section three
and school, family, and community partnerships are addressed in section four. A summary
of the literature is provided to support this investigation of teacher interpersonal
relationship behaviors related to high school Hispanic student success.
High School Hispanic Student Achievement
Hispanic youth currently make up one-fifth of public school enrollment in the United
States and the numbers are rising rapidly (U.S. Census Bureau, 2002). These individuals
are struggling in school and the educational system is struggling to serve them (Crosnoe,
2005). Improved educational attainment is a key requirement for Hispanics’ overall, long-
term economic success (Fry, 2003). In the American educational system, Hispanic youth
face obstacles that threaten to diminish their long-term prospects (Crosnoe, 2005).
Effectively serving Hispanic youth is one of the most pressing problems facing the
American educational system in the new century (Stanton- Salazar, 2001).
For Hispanic youth, two general dimensions of schooling are important (Crosnoe,
2005). The first is the academic side of schooling, tapped here by graded achievement.
35
The second dimension is the social-psychological side of schooling, tapped by various
indicators of school orientation, including school attachment and educational engagement
(Crosnoe, 2005). There is significant evidence that suggests that the degree to which
students like school and participate in both academic and social activities has implications
for their persistence in school (Crosnoe & Needham, 2004). Both the academic and the
social-psychological sides of schooling underlie basic adjustment and transition to
adulthood (Crosnoe, 2005). Students are more comfortable when they feel similar to
others, encouraged to make use of social and academic opportunities in the school
(Goldsmith, 2004). Hispanic students are likely to fit the higher achieving profiles when
they attend school with a well-educated parent population and a large proportion of other
Hispanics. They are also likely to exhibit stronger school orientation in such schools even
if their achievement is low (Crosnoe, 2005).
The majority of literature on the failure of Hispanic students can be separated into
two conceptual categories: studies that blame Hispanics for their own school failures and
studies that articulate a deficiency model of minority education, a model of remediation,
or one of compensation (Olivas, 1986). A definition of school failure usually found in
such studies, is provided by Valencia (1991): school failure among Hispanic students
refers to their persistently, pervasively, and disproportionately, low academic
achievement. Valencia (1991) reports that the high dropout rates of Hispanics are one of
the truly major tragedies of the Hispanic schooling experience. Nieto (2000) states, “some
have failed to consider the significance of culture in learning; others have not taken into
account the social, cultural, and political context of schooling; still others have placed all
36
the responsibility for academic success or failure on the students and their families”
(p.244).
Romo and Falbo (1995) present insightful accounts of how high-risk Hispanic
students either overcome their “at-riskness” or drop out. They used a parent survey form
to select 100 Hispanic students, whom they tracked for four years, with a focus on grades,
gang involvement, teen motherhood, immigrant families, and schools’ policies and
administrative practices. They reported that “students had to navigate the boundaries of
three cultures in order to graduate: the culture of the home, the adult culture of the school
system, and the student culture of the school” (Romo & Falbo, 1995, p. 47).
Lee & Burkam’s research (2003) is grounded in the belief that high schools,
through their organization, may either force out or hold in students whose personal
characteristics might put them at risk of dropping out before they graduate. Few studies
cast schools as sharing the responsibility for the bad decisions made by some students
(Lee & Burkam, 2003). Personal characteristics of individual students are reported as the
most common explanation for dropping out (Lee & Burkam, 2003). In their research, Lee
& Burkam (2003) made use of data from the High School Effectiveness Supplement to
the National Educational Longitudinal Study of 1988. This data provided the researchers
an opportunity to explore a school organizational explanation for the dropout
phenomenon. Multilevel research methods examined school effects on individual
behaviors. The longitudinal data focused on mathematics and Lee & Burkam (2003) also
focused on this area of the curriculum to capture students’ academic background and
schools’ curriculum structure. An important finding in this study is the contingency of the
influence of school social organization on dropout behavior.
37
In the American cultural orientation, educational behavior is explained in terms of
what takes place within the school, classroom, or family (Ogbu, 1992). Attention on
affective variables, particularly attitudes, in education research stems from the view that
affective variables are as important as cognitive variables in influencing, and, possibly,
predicting, learning and other outcomes (Koballa, 1988). Coleman (1988) (as cited in Lee
& Burkam, 2003) pointed out the special significance of social capital for children.
Variation in social background is a far more potent predictor of differences in
achievement and attainment than is variation among the schools that students attend
(Coleman, 1988) (as cited in Lee & Burkam, 2003). Social capital may be measured by
the students’ beliefs about how much their teacher supports the students’ efforts to
succeed in school, thus increasing the likelihood that students complete high school
(Croninger & Lee, 2001).
Shrigley (1983) noted that attitude is not innate, but learned as a part of culture.
The forces that affect the social adjustment and academic performances of minority
children are not limited to the school and the classroom, they also include those from the
minority communities (Ogbu, 1992). These community forces appear to be different for
different minorities and they interact differently with the societal and school factors,
producing different educational results. Ogbu (1992) defines community forces as a
combination of cultural models of what it means to be a minority, the cultural and
language frame of reference for judging appropriate behavior and affirmation of group
membership and solidarity, the degree of trust or acquiescence in a relationship with
White Americans and their institutions and the attitudes, plans, and actions minorities use
or do not use in their pursuit of formal education. These distinguishing beliefs and

38
practices affect the cultural knowledge, attitudes, and behaviors that minority parents
employ in preparing their children for school and minority children bring to school
(Ogbu, 1992). The children’s beliefs interact with school factors and together they
influence the children’s social adjustment and academic performance (Ogbu, 1992).
Interpersonal Teacher Behaviors
The contribution made by teachers to students has been studied mainly in terms of
imparting knowledge within the instructional framework (Galbo, 1984). Teachers not
only impart knowledge and skills to students, but also serve as confidants and role models
(Wang, Haertel, & Walberg, 1998). When students develop strong and meaningful
relationships with their teachers, they identify with the school and with their teachers
(Nieto, 2000). Frequent opportunities for students to interact socially with teachers,
enhance students’ sense of belonging (Nieto, 2000). While instructional methodology is
an important consideration, exceptional teaching can also be described in terms of
teacher-student relationships (Wubbels, Levy, & Brekelmans, 1997). Teacher
interpersonal behavior is a major component of classroom management (Doyle, 1986).
Positive teacher-student relationships and a positive classroom environment promote
improved student outcomes and are worthwhile process goals of education (Fraser&
Walberg, 2005). Research on teacher-student interaction is not only of interest to
educational researchers, but also to policy makers who wish to improve student outcomes
through positive teacher-student interactions (Fraser & Walberg, 2005).
Barr and Emans (1930) identified six primary characteristics of the successful
teacher as seen from the perspective of the administrator or teacher. The top qualities
were identified as: instruction; classroom management; professional attitude; choice of
39
subject matter; personal habits; and discipline. Hart (1934) directed his research to
identifying the characteristics of the effective teacher as seen from the perspective of the
high school student. The four characteristics identified by the students in the Hart study
are: 1.) More demanding of the student, 2.) More teaching ability, 3.) More
knowledgeable of the subject matter, and 4.) Better discipline. In studies by Barr &
Emans (1930), Charter & Waples (1929), and Kratz (1894) (as cited in Smith, 1997), the
characteristics of being a demanding, knowledgeable, pedagogically sound teacher, while
being supportive of the students’ emotional and social need were repeated from the
perspectives of the students, teacher, and administrator (Smith, 1997). This research was
said to develop an understanding of personality traits and professional knowledge
considered necessary for a person to be a successful teacher (Smith, 1997).
Wubbels and Brekelmans (2005) analyze teaching from an interpersonal
perspective – in terms of the relationship between teacher and students. They report that
two elements are central to this perspective: the communicative systems approach and a
model to describe teacher-student relationships in terms of teacher behavior. The systems
approach focuses on the pragmatic aspects of communication; that is, the effects on the
other involved. According to the systems approach, every form of communication has
content and a relation aspect (Watzlawick, Beavin, & Jackson, 1967). Content focuses on
the message, whereas the relation aspect focuses on the behavior associated with the
message (Marshal & Weinstein, 1986). Specifically, one cannot not communicate when in
the presence of someone else, whatever a person’s intentions are, others will infer
meaning from this behavior. For example, if teachers ignore students’ questions because
40
they do not hear them, students might make a variety of inferences, such as the teacher is
busy or considers the question irrelevant (Wubbels & Brekelmans, 2005).
The second element described by Wubbels & Brekelmans (2005) in their
discussion of the relationship between teachers and students, is the Model for
Interpersonal Teacher Behavior (MITB). This model is based on Timothy Leary’s (1957)
research on the interpersonal diagnosis of personality and its application to teaching
(Wubbels, Creton, & Hooymayers, 1985). There is evidence that the Leary model is
cross-culturally generalizable (Lonner, 1980). In the MITB there are two dimensions,
Influence and Proximity, which underlie eight types of teacher behavior: leading,
helpful/friendly, understanding, student responsibility and freedom, uncertain,
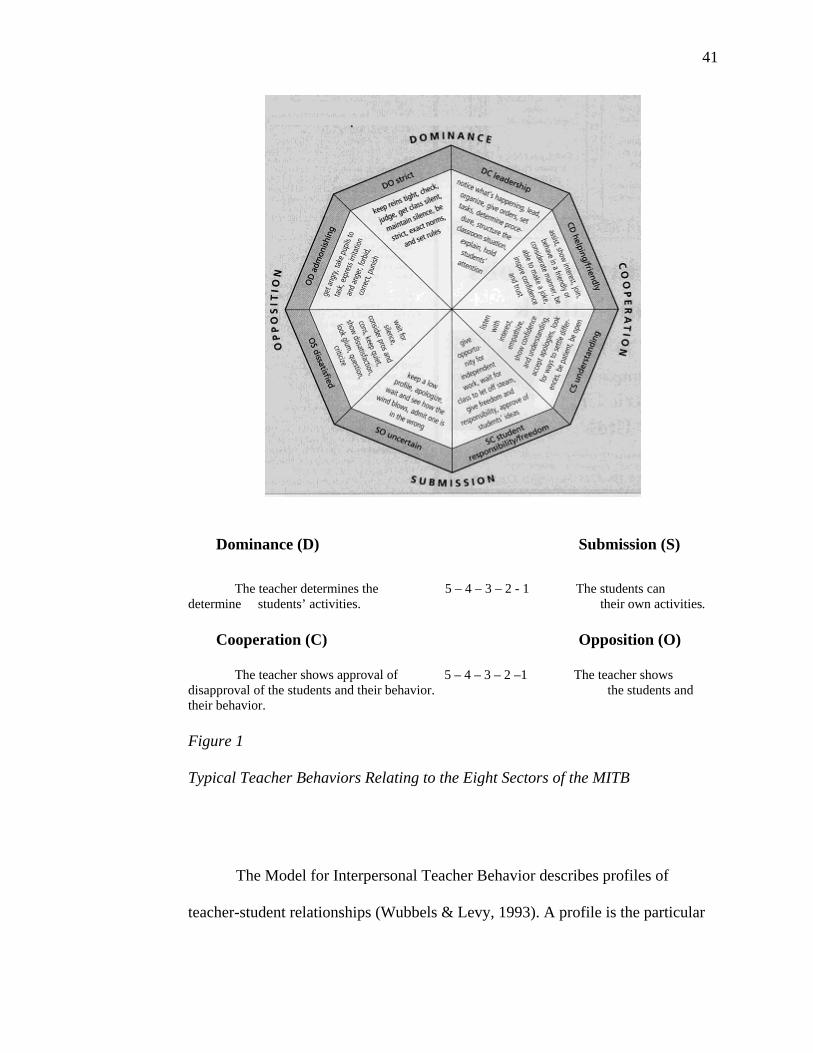
dissatisfied, admonishing and strict (Wubbels & Brekelmans, 2005). Figure 1 provides an
overview of typical teacher behaviors that relate to each of the eight sectors of the MITB
(Wubbels & Brekelmans, 2005).
41
Dominance (D) Submission (S)
The teacher determines the 5 – 4 – 3 – 2 - 1 The students can determine students’ activities. their own activities.
Cooperation (C) Opposition (O)
The teacher shows approval of 5 – 4 – 3 – 2 –1 The teacher shows disapproval of the students and their behavior. the students and their behavior.
Figure 1 Typical Teacher Behaviors Relating to the Eight Sectors of the MITB
The Model for Interpersonal Teacher Behavior describes profiles of
teacher-student relationships (Wubbels & Levy, 1993). A profile is the particular
42
combination of eight scale scores resulting from the administration of the
Questionnaire on Teacher Interaction. Eight different types of profiles could be
distinguished in Dutch and American classes (Brekelmans, Levy, & Rodriguez,
1993). These profiles have been named: Directive; Authoritative;
Tolerant/Authoritative; Tolerant; Uncertain/Tolerant; Uncertain/Aggressive;
Drudging; and Repressive. The Authoritative, the Tolerant/Authoritative, and the
Tolerant type are patterns wherein students perceive their teachers as relatively
high on the Proximity dimension, with the Tolerant type lowest on the Influence
dimension (Wubbels & Levy, 1993). Less cooperative than the three previous
types are the Directive, the Uncertain/Tolerant, and the Drudging type, with the
Uncertain/Tolerant type lowest on the Dominance dimension. The least
cooperative patterns of interpersonal relationships have been indicated as
Repressive and Uncertain/Aggressive. In Repressive type classes, teachers are the
most dominant of all eight types (Wubbels & Levy, 1993).
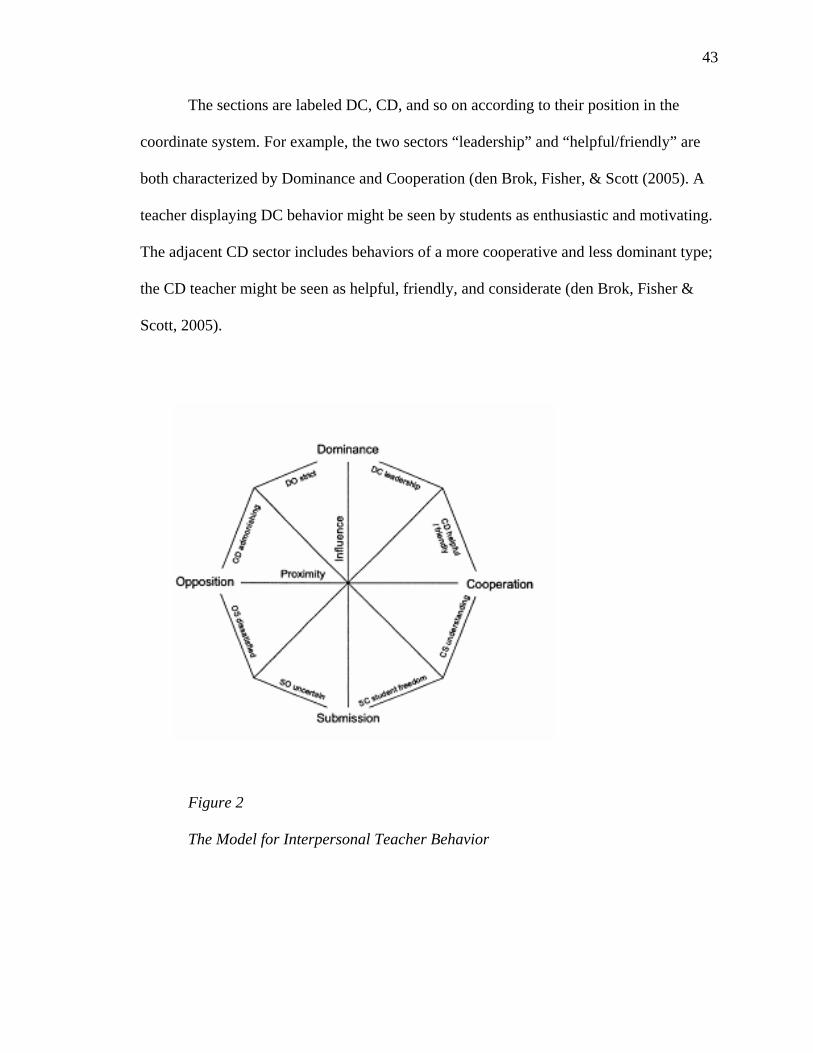
Figure 2 is a graphic representation of the adopted model for education, the
Model for Interpersonal Teacher Behavior (Wubbels et al, 1985). It is important to
note that teachers can exhibit acceptable behavior in each sector and that most
teachers show behaviors in every category (Levy, Wubbels, Brekelmans, &
Morganfield, 1997). One of the fundamental ideas behind the Leary model is that
communication behaviors continually change and communication styles emerge
only after a great many behaviors have occurred and been observed (Levy,
Wubbels, Brekelmans & Morganfield, 1997).
43
The sections are labeled DC, CD, and so on according to their position in the
coordinate system. For example, the two sectors “leadership” and “helpful/friendly” are
both characterized by Dominance and Cooperation (den Brok, Fisher, & Scott (2005). A
teacher displaying DC behavior might be seen by students as enthusiastic and motivating.
The adjacent CD sector includes behaviors of a more cooperative and less dominant type;
the CD teacher might be seen as helpful, friendly, and considerate (den Brok, Fisher &
Scott, 2005).
Figure 2
The Model for Interpersonal Teacher Behavior
44
In the Netherlands, Wubbels, Creton and Holvast (1988) investigated teacher
behavior in classrooms from a systems perspective, adapting the theory on
communication processes developed by Watzlawick, Beavin and Jackson (1967). Within
the systems perspective on communication, it is assumed that the behaviors of participants
influence each other mutually (Fisher, Fraser, & Rickards, 1997). Wubbels, Creton and
Hooymayers (1985) applied Leary’s general model for interpersonal relationships (Leary,
1957) to the context of education. The Leary model has been extensively investigated in
clinical psychology and psychotherapeutic settings (Strack, 1996). It has proven adept at
describing interpersonal relationships (Lonner, 1980). According to Leary, two
dimensions are important – Dominance-Submission and Hostility-Affection (den Brok,
Fisher, Scott, 2005). Adapting the Leary Model to the context of education, Wubbels et al.
(1985) labeled the two dimensions as Influence (Dominance-Submission) and Proximity
(Opposition-Cooperation). These researchers structured interpersonal teacher behavior
into eight segments: leadership, helpful/friendly, understanding, giving students freedom
and responsibility, uncertain, dissatisfied, admonishing, and strict (den Brok, Fisher,
Scott, 2005).
Classroom environment studies that have included the interpersonal perspective on
teaching indicate a strong and positive relationship between perceptions of Influence and
Proximity or their related subscales and cognitive and affective student outcomes (Wubels
& Brekelmans, 2005). The Brekelmans’ (1989) study with physics teachers investigated
the relationship between student outcomes and students’ perceptions of teacher-student
relationships. The results of the interpersonal profile suggested that Directive,
Authoritative, and Tolerant teacher profiles had the highest achievement outcomes. In
45
comparison, teachers with Uncertain/Tolerant, Uncertain/Aggressive, and Drudging
profiles reflected relatively low student achievement. The Authoritative and Directive
teachers had the highest student attitude scores, whereas students of the Drudging,
Uncertain/Aggressive, and Repressive teachers had the worst attitudes towards physics. In
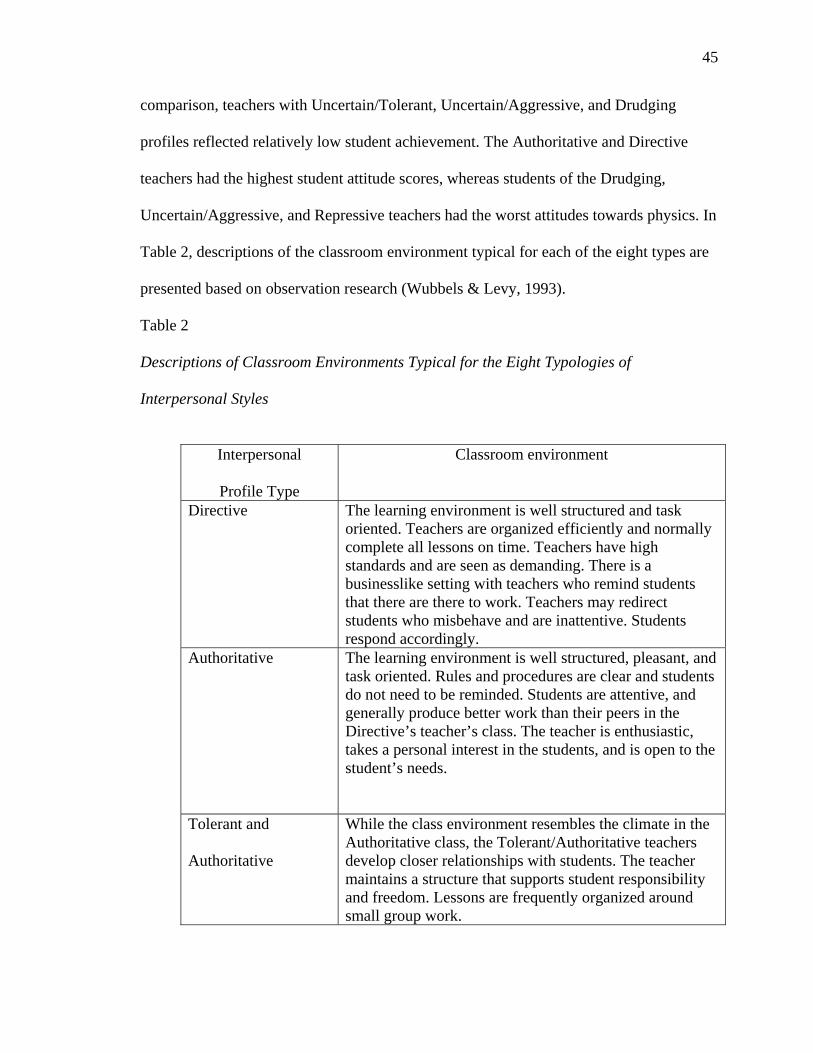
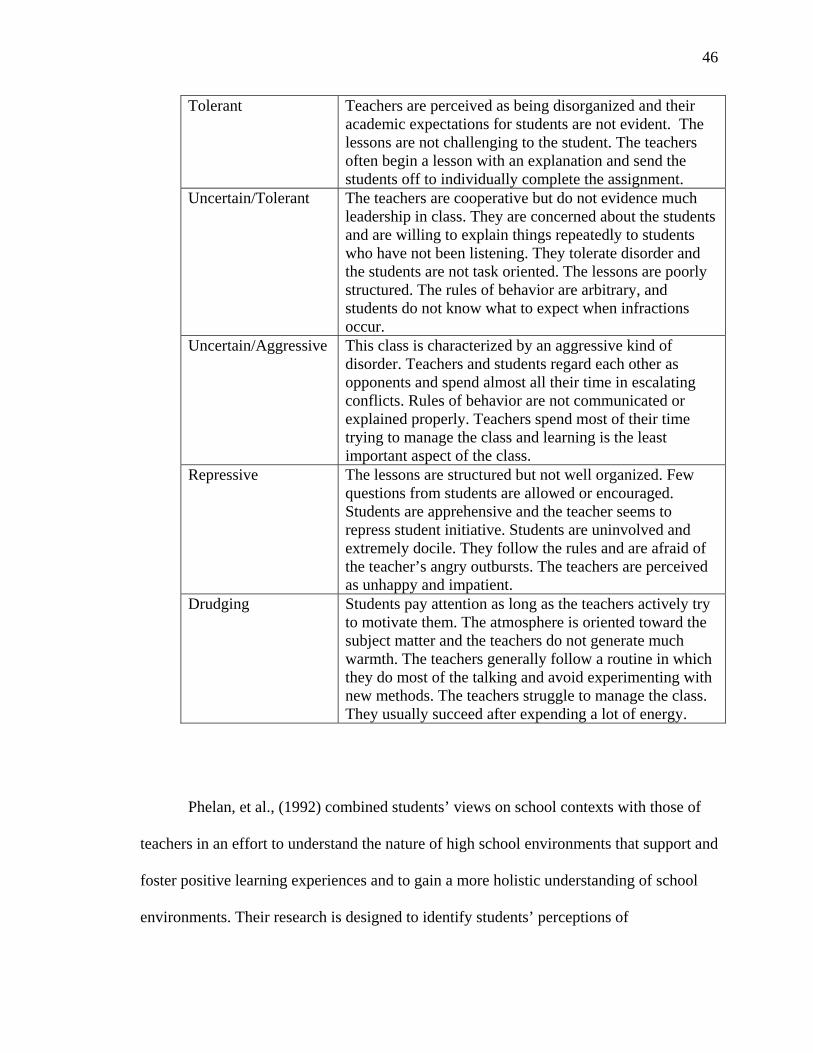
Table 2, descriptions of the classroom environment typical for each of the eight types are
presented based on observation research (Wubbels & Levy, 1993).
Table 2
Descriptions of Classroom Environments Typical for the Eight Typologies of
Interpersonal Styles
Interpersonal
Profile Type
Classroom environment
Directive The learning environment is well structured and task oriented. Teachers are organized efficiently and normally complete all lessons on time. Teachers have high standards and are seen as demanding. There is a businesslike setting with teachers who remind students that there are there to work. Teachers may redirect students who misbehave and are inattentive. Students respond accordingly.
Authoritative The learning environment is well structured, pleasant, and task oriented. Rules and procedures are clear and students do not need to be reminded. Students are attentive, and generally produce better work than their peers in the Directive’s teacher’s class. The teacher is enthusiastic, takes a personal interest in the students, and is open to the student’s needs.
Tolerant and
Authoritative
While the class environment resembles the climate in the Authoritative class, the Tolerant/Authoritative teachers develop closer relationships with students. The teacher maintains a structure that supports student responsibility and freedom. Lessons are frequently organized around small group work.
46
Tolerant Teachers are perceived as being disorganized and their academic expectations for students are not evident. The lessons are not challenging to the student. The teachers often begin a lesson with an explanation and send the students off to individually complete the assignment.
Uncertain/Tolerant The teachers are cooperative but do not evidence much leadership in class. They are concerned about the students and are willing to explain things repeatedly to students who have not been listening. They tolerate disorder and the students are not task oriented. The lessons are poorly structured. The rules of behavior are arbitrary, and students do not know what to expect when infractions occur.
Uncertain/Aggressive This class is characterized by an aggressive kind of disorder. Teachers and students regard each other as opponents and spend almost all their time in escalating conflicts. Rules of behavior are not communicated or explained properly. Teachers spend most of their time trying to manage the class and learning is the least important aspect of the class.
Repressive The lessons are structured but not well organized. Few questions from students are allowed or encouraged. Students are apprehensive and the teacher seems to repress student initiative. Students are uninvolved and extremely docile. They follow the rules and are afraid of the teacher’s angry outbursts. The teachers are perceived as unhappy and impatient.
Drudging Students pay attention as long as the teachers actively try to motivate them. The atmosphere is oriented toward the subject matter and the teachers do not generate much warmth. The teachers generally follow a routine in which they do most of the talking and avoid experimenting with new methods. The teachers struggle to manage the class. They usually succeed after expending a lot of energy.
Phelan, et al., (1992) combined students’ views on school contexts with those of
teachers in an effort to understand the nature of high school environments that support and
foster positive learning experiences and to gain a more holistic understanding of school
environments. Their research is designed to identify students’ perceptions of
47
circumstances that impinge on their involvement with the school community. The
participants included 54 students, selected for diversity with respect to gender,
achievement, and ethnicity, from four comprehensive high schools in two California
school districts. Through interviews, observations, and analyses of student records, the
researchers conclude that students from all achievement levels and sociocultural
backgrounds want to succeed and want to be in an environment in which it is possible to
do so (Phelan, et al., 1992). Specifically, students report that they appreciate a well-
organized and orderly environment, yet not one in which the teacher is detached and treats
the classroom as a whole rather than as a roomful of individuals. A recurring theme in
students’ comments is the tremendous value they place on having teachers who care
(Phelan, et al., 1992).
Students report humor, openness, and consideration as important qualities in a
teacher. High achieving students associate caring with assistance in academic matters,
whereas low-achieving students equate caring with certain personality traits (Phelan, et
al., 1992). Teachers interviewed in this study also reported that they want to be respected
and want to work with students who care. However, when teachers do not perceive this
congruence, the result is an emphasis on differences and problems. This
miscommunication can lead to a perception of students as adversaries rather than
individuals engaged in learning (Phelan, et al., 1992).
According to the systems approach, non-verbal behavior is particularly important
for the perception of the relationship aspect of communication (Wubbels & Brekelmans,
2005). Differences between beginning and experienced teachers, in non-verbal behavior,
in relation to the position in class, may explain problems of beginning teachers in creating
48
positive teacher-student relationships. van Tartwijk, Brekelmans, Wubbels, Fisher, &
Fraser (1998) researched the contribution of non-verbal behaviors to the perception of the
relationship at the message level using five channels of behavior: space - the teacher’s use
of classroom space, body - position and movement, face - various expressions, visual
behavior - duration of the teacher looking at the students, and voice - the non-content
aspects of speech. Behaviors such as looking at the students continuously and speaking
loud and emphatically were often observed together. This combination of behaviors was
rated as highly dominant. Behaviors such as not being heard, being close to the students,
and bending toward the student yield a low influence score (van Tartwijk et al., 1998).
Secondary school students evaluate their teachers according to their capability to
teach a subject matter, their sensitivity to students’ individual needs (Cullingford, 1995),
their ability to develop personal relationships with pupils, and their professional
competence (Kutnick & Jules, 1993). Tatar (1998) examined gender differences in
secondary pupils’ perceptions. The study explored the views of secondary school girls and
boys regarding positive and negative aspects of the significance of their teachers. Two
hundred ninety-seven Israeli secondary school students (57% girls, 43% boys) in 10th
grade classes participated in this study. The 18 item Hebrew questionnaire used in this
study was obtained by translating items presented in the research by Hendry, Roberts,
Glendinning, & Coleman (1992). Students were also asked to respond to two open ended
questions: 1.) In which domains teachers might be significant for them, as compared to
their parents; and 2.) In which domains teachers might be significant for them as
compared to their friends (Tatar, 1998). The answers to these questions were classified
into two categories: affective support and help in problem solving and education and
49
instruction. The findings suggest that many adolescents perceive teachers as potential
significant individuals, even when compared with parents and friends (Tatar, 1998). Boys
indicated, more than girls, negative aspects of significance. Girls perceive significant
teachers as personal and affective supporters. Girls, more than boys, seek confirmation
and support from their teachers (Tatar, 1998). Fisher, Rickards, Goh, & Wong (1997) also
investigated gender differences in students’ perceptions of interpersonal teacher behavior.
In their study, statistically significant gender differences were detected in students’
responses to seven of the eight scales of the QTI. In general, it was reported that females
perceived their teachers in a more positive way than males.
A study by Levy, den Brok, Wubbels, and Brekelmans (2003) examined variables
associated with differences in students’ perceptions of interpersonal teacher behavior. The
perceptions of 3023 students and 74 teachers in 168 classes in seven secondary schools
were used in the analysis. The researchers reported several variables significantly related
to students’ perceptions: student and teacher gender; student and teacher ethnic
background; student age and grade; class size; grade level; subject taught; and teacher
experience. Multilevel variance analysis techniques were used. The outcomes of the study
were said to have an implication relative to teachers’ affirmations of the diversity in their
classrooms. Because of the link between student perceptions and student outcomes, and
because of the differences in perceptions as a result of background variables of students,
teachers are encouraged to become aware of these differences and incorporate this aspect
in their instructional repertoire (Levy, den brok, Wubbels & Brekelmans, 2003). This
background knowledge could assist teachers in affirming their culturally responsive
strategies in their classrooms.

50
There is evidence of an association between interpersonal teacher behavior and
learning outcomes. In one study involving 720 students in Singapore and 705 students in
Australia (Fisher, et al., 1997), the scales of the Questionnaire for Teacher Interaction
were used as independent variables. Associations between the QTI scales and students’
attitudinal outcomes were computed (Khine & Fisher, 2004). It was reported that the QTI
scales, leadership, helping/friendly, understanding, and student responsibility/freedom
were significantly and positively associated with the attitude towards science classes in
both countries. In addition, the QTI scales, uncertain, dissatisfied, admonishing, and strict
were significantly and negatively correlated with the attitude to class in both countries
(Khine & Fisher, 2004). Associations also exist between student perceptions of teacher
interpersonal behavior and student outcomes in mathematics classes (Rawnsley & Fisher,
1998).
The QTI was first constructed in The Netherlands between 1978 and 1984 and
resulted in seventy- seven items being selected for the final version. The Australian
version of the QTI (Wubbels, 1993; Fisher, Henderson and Fraser, 1995) has forty-eight
items, six for every sector of the Model of Interpersonal Teacher Behavior. Each item is
scored on a 5- point Likert scale, from “Never/Not At All” to “Always/Very” (Levy,
Wubbels, Brekelmans, & Morganfield, 1997). The total score for each scale is the sum of
the circled numbers for the six items that belong to that scale. Omitted or invalid
responses are scored “3”. For example, in order to calculate the total score for
“Leadership Behavior”, responses to questions 1,5,9,13,17, and 21 are added together.
The American version was created between 1985 and 1987 by translating the set
of seventy-seven items from the Dutch version, adding several items (since several items

51
could be translated in more than one way), and adjusting this set of items based on various
rounds of testing (Wubbels, Levy & Fraser, 1993). The original American version
contained one hundred items from the original seventy-seven items in the Dutch version
(Smith, 1997). Wubbels, Levy, & Fraser (1993) inspected the American version to
ascertain if it was still in accordance with the original Leary (1957) model. Thirty- three
items were removed from the original one hundred American items because they did not
correspond to the parameters of the assumptions of the Leary model. According to the
Leary model, “an item should correlate highest with the scale to which it belongs and
lowest with the opposite sector” (Wubbels, Levy, & Fraser, 1993, p.4). Ultimately, the
American version contained 64 items (denBrok, 2001). A series of item analysis were
conducted to ascertain the American instrument’s reliability. Seven of the eight section’s
reliabilities were above .90 and the other section’s reliability was calculated to be .86
(Smith, 1997). The American 64-item version of the QTI was initially also used in
Australia (Wubbels, Levy, & Fraser, 1993), but ultimately Australian researchers ended
up with a more economical 48-item selection (Fisher, Henderson, & Fraser, 1995). The
Questionnaire on Teacher Interaction can be used to map students’ perceptions of teacher
interpersonal behavior according to the Model for Interpersonal Teacher Behavior and
was developed based on this model (Wubbels, Levy, & Fraser, 1993). It has eight scales
formatted on two axes representing an Influence dimension and a Proximity dimension
(Fisher, Fraser, & Rickards, 1997).
The validity and reliability of the Questionnaire on Teacher Interaction were
determined by administration in Australia, The Netherlands, and the United States
(Wubbels, Levy, & Fraser, 1993). Internal consistency reliability and scale inter
52
correlations have been reported in several studies conducted on the reliability and validity
of the QTI. They have included Dutch (Brekelmans, Wubbels, & Creton, 1990, denBrok,
2001, Wubbels et al. 1985), American (Wubbels, Levy, & Fraser, 1993), and Australian
(Fisher, Fraser, & Wubbels, 1993) samples. Both reliability and validity were satisfying.
The QTI has been shown to be a valid and reliable instrument when used in The
Netherlands (Wubbels, Levy, & Fraser, 1993). When the 64-item American version was
used with 1,606 students and 66 teachers in the United States, the cross-cultural validity
and usefulness were confirmed. Using the Cronbach alpha coefficient, Wubbels, Levy, &
Fraser (1993) reported acceptable internal consistency reliabilities for the QTI scales
ranging from .76 to .84 for student responses.
Levy, Wubbels, Brekelmans, & Morganfield (1997) provided evidence of student
characteristics and class level covariates that were significant in their research. These
included age, grade level, and cultural background. Without a working knowledge of
students’ home lives and cultural backgrounds, teachers risk misunderstandings that can
damage the educational experiences for all involved (Levy, Wubbels, Brekelmans, &
Morganfield, 1997).
Levy, Wubbels, Brekelmans, and Morganfield (1997) investigated a sample of 550
high school students comprised of Hispanics, Asians, and Americans. The primary focus
of this investigation was the language and cultural factors in students’ perceptions of
teacher communication styles. The results suggested that the students’ cultural
background significantly related to the perceptions they had of their teachers’ interaction
behavior. In a study by Rickards and Fisher (2000), the reliability and validity of the QTI,
when used in mathematics classes, was confirmed. The dimensions of the QTI were found
53
to be significantly associated with student attitude scores. Students’ attitude scores were
higher in classrooms in which students perceived greater leadership and helpful/friendly
behaviors in their teachers (Rickards & Fisher, 2000). Vermeer, Boekaerts, & Seegers
(1997) examined the gender differences in cognitive and affective variables with respect
to performance in mathematics classes. The results demonstrated that both the cognitive
and affective variables measured during mathematics tasks revealed gender differences.
The QTI is capable of differentiating between perceptions of students in different
classrooms (Pehkonen, 1997). The Australian version of the QTI was used in a pilot study
involving upper secondary science classes in Western Australia and Tasmania (Fisher,
Fraser, & Wubbels, 1993). This pilot study supported the validity and potential usefulness
of the QTI. This instrument meets the standards of the American Evaluation Association
(1999) for accuracy, reliability, and validity.
Since is development, the QTI has been the focus of well over 120 studies in many
countries (den Brok, Brekelmans, van Tartwijk, & Admiral, 1997) (as cited in denBrok,
Brekelmans, &Wubbels, 2004). The original QTI, designed for secondary education, has
also formed the basis for a number of other versions for primary education, higher
education, principals, and supervisors (den Brok, 2001).
While research on the relationship between interpersonal teacher behavior and
student attitudes displays fairly consistent results, most studies are subject to some
limitations (den Brok, Fisher, & Scott, 2005). Research has shown that teacher behavior,
and students’ perceptions of them, are partially dependent on and may interact with
characteristics of respondents and the context in which they occur (Levy, den Brok,
Wubbels, & Brekelmans, 2003).

54
Resiliency
Resiliency is defined as the process of coping with adversity, change, or
opportunity in a manner that results in the identification, fortification, and enrichment of
resilient qualities or protective factors (Richardson, 2002). Students who developed
healthy personas and had developed coping skills that enable them to succeed are termed
as resilient (McMillan & Reed, 1994). Resiliency studies have commonly identified
children as “at-risk” based on the presence of many factors that have been proven as
correlated with adverse circumstances - poverty, minority status, and drug addiction
(Wayman, 2002). McMillan and Reed (1993) report the factors that seem to be related to
resiliency as: individual attributes, positive use of time, family and school. In the context
of education theory, resiliency focuses on students’ individual strengths and using those
strengths to promote achievement of goals and standards (Brown, Caston, & Bernard,
2001). Resilient children have characteristics that enable them to develop into healthy
adults (Wang, Haertel, & Walberg 1994). These include: verbal fluency; a sense of
competence; good problem-solving skills; high self-esteem; self-control; and openness to
new experiences (Wang, Haertel & Walberg, 1984). Resiliency includes teaching
practices and procedures that emphasize student strengths so that students develop the
capacity to cope effectively with both internal and external stressors in order to succeed
(Wahome, 2004). Werner and Smith (1988) reported that apart from the family circle,
teachers had a significant role as role models in the lives of resilient children. Resiliency
theory identifies protective factors present in families, schools, and communities of
successful youth that often are missing in the lives of troubled youth (Krovetz, 1999).
Five key factors, which are major influences in developing resilience in children, are: the
55
family, schools, community, peers, and individual predispositions (Krovetz, 1999).
Resilient children have the ability to manage and thrive in the face of adversity (Wang,
Haertel & Walberg, 1998). Richardson’s resiliency theory focuses on caring and support
that fosters interactions leading to pupil resiliency (Richardson, 2002).
Rutter (1987) named “protective mechanisms” that are located both externally in
the social/environmental life space of the individual and internally, as personal attributes
and qualities of the individual. These protective factors are said to promote the
development of resilient qualities (Bernard, 1991). Werner and Smith (1988) identified a
range of important roles families play in providing protective assets. These included
consistency in parenting role models, being supportive and available when needed,
providing a harmonious living environment, having strong beliefs and standards of
behavior, and celebrating and valuing important life stages (McCubbin & McCubbin,
1988). Family support seems to be an attribute of successful at-risk resilient students
(McMillan & Reed, 1994). Parents of resilient students have higher expectations for their
children’s education and these expectations exert pressure on the students to remain
engaged in school. Peng, Lee, Wang, & Walberg (1992) report that family composition
seems to have no significant relationship to at-risk students’ success or failure. They also
found that the educational background of parents was related to student resiliency.
Specifically, their research indicates that less than 11 percent of students whose parents
had less than a high school education were classified as resilient as compared with 23
percent of students whose parents had a high school education or beyond.
In their research, Werner and Smith (1988) also recognized the significant
contributions made by schools and teachers in offering external protective factors. Such
56
schools are characterized as being caring, attentive, and stable environments which are
success oriented and acknowledge academic, sports, musical, and artistic achievements
(Oswald, Johnson, & Howard, 2001). Bernard (1991) summarized external protective
factors demonstrated by schools and teachers under three categories: caring and
supportive relationships, positive and high expectations, and opportunities for meaningful
participation. Communities were reported as another source of protective assets for
individuals whose status may pose a risk factor (Pence, 1998). Wang (1997) advocated
the strengthening of social, health, and other community services to provide a strong
supportive social framework for fostering resilience.
Bernard (1995) suggests that “certain environmental characteristics” must exist for
an individual to develop a range of personal skills and successful coping strategies to
overcome risk and adversity. Bernard (1995) provides a summary of the critical roles
schools and their teachers have in developing resilience in children at risk. Bernard’s
research (1995) reports longitudinal studies that provide evidence that half to two-thirds
of children “growing up in families with mentally ill, alcoholic, abusive or criminally
involved parents or poverty stricken” overcame such disadvantages and successfully
transformed their lives. This capacity for resilience is reportedly biologically based.
Werner and Smith (1988) and Bernard (1993) describe eight key qualities or
predispositions, which are characteristic of children who are resilient:
• Having stable relationships with peers,
• Possessing well-developed problem-solving skills,
• Considering realistic future plans,

57
• Having a positive sense of being able to achieve and deal
effectively with tasks,
• Experiencing success in one or more areas of their lives,
• Being able to communicate effectively,
• Possessing a strong attachment with at least one adult,
• Acceptance of responsibility for themselves and their behavior.
Resilient students see the world as a positive place in spite of the difficult issues
with which they have to deal (McMillan & Reed, 1994). To cope with life prompts,
humans cultivate, through previous disruptions, resilient qualities so that most events
become routine and less likely to be disruptive (Richardson, 2002). Peng, Lee, Wang, &
Walberg (1992), conducted a study with 17,000 tenth graders from low-income families
and found that locus of control was a significant predictor of academic success. The
results of their investigation suggested that students with higher academic achievement
tended to have a more internal locus of control. McMillan and Reed (1993) provide
evidence from a qualitative study of the perceptions of academically successful at-risk
students. Their results state that many students spoke of a satisfaction gained from
experiencing success in self-fulfilling activities. These students were motivated by a
desire to succeed, to be self-starting, and to be personally responsible for their
achievements.
Two central factors impact Hispanic students in high school: a caring environment
and academic resiliency. A study conducted in high poverty high performing schools in
Texas found “effective schools consistently exhibited an ethic of care in their culture”
(Reyes, Scribner, & Scribner, 1999, p.27). The ethic of care applies to the entire school
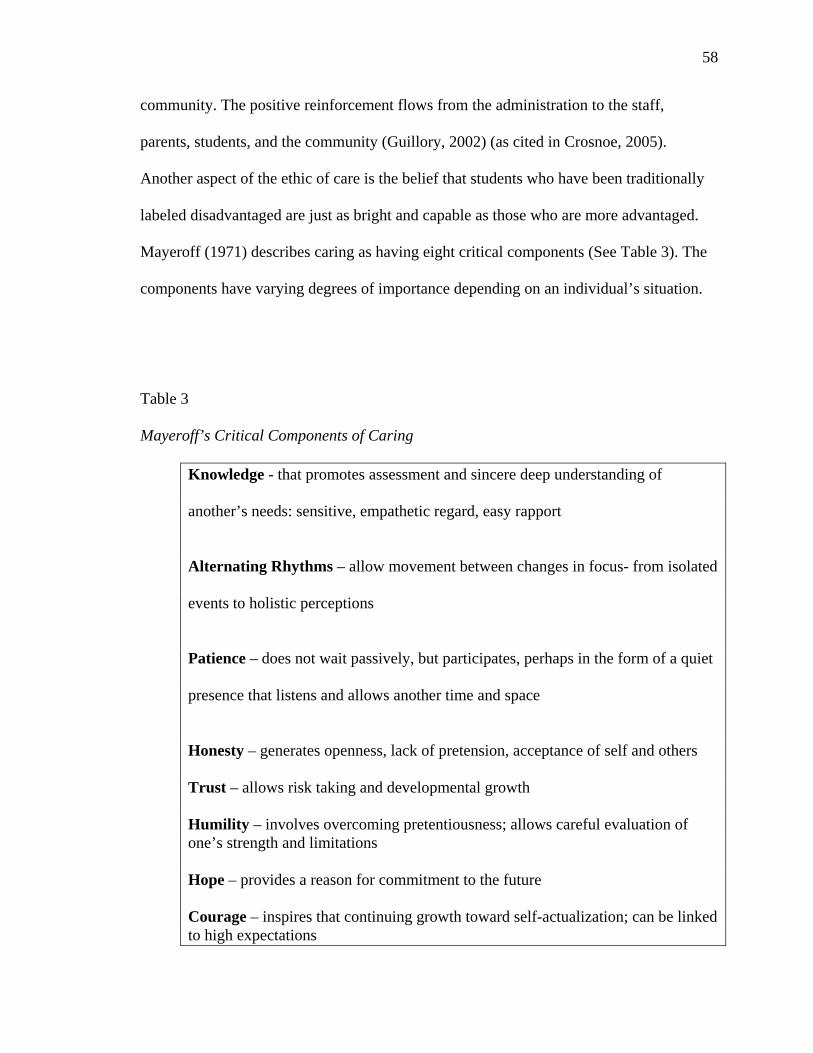
58
community. The positive reinforcement flows from the administration to the staff,
parents, students, and the community (Guillory, 2002) (as cited in Crosnoe, 2005).
Another aspect of the ethic of care is the belief that students who have been traditionally
labeled disadvantaged are just as bright and capable as those who are more advantaged.
Mayeroff (1971) describes caring as having eight critical components (See Table 3). The
components have varying degrees of importance depending on an individual’s situation.
Table 3
Mayeroff’s Critical Components of Caring
Knowledge - that promotes assessment and sincere deep understanding of
another’s needs: sensitive, empathetic regard, easy rapport
Alternating Rhythms – allow movement between changes in focus- from isolated
events to holistic perceptions
Patience – does not wait passively, but participates, perhaps in the form of a quiet
presence that listens and allows another time and space
Honesty – generates openness, lack of pretension, acceptance of self and others
Trust – allows risk taking and developmental growth
Humility – involves overcoming pretentiousness; allows careful evaluation of one’s strength and limitations
Hope – provides a reason for commitment to the future
Courage – inspires that continuing growth toward self-actualization; can be linked to high expectations
59
The level of caring and support within a school provides an indicator of positive
outcomes for students (Bernard, 1993). The power of a caring teacher is documented in
Moskovitz’s (1983) 40-year follow-up study of childhood survivors of the Nazi
Holocaust. All 24 of the resilient survivors “considered one woman to be among the most
potent influences in their lives – the nursery school teacher they were sent to after being in
the concentration camps and orphanages. This teacher provided warmth and caring, and
taught them to behave compassionately. According to a study done by Stanford
University’s Center for Research on the Context of Secondary School Teaching (Phelan,
et al., 1992), the need for caring teachers was a major concern of high school students.
Resilient students take the opportunity to fulfill the basic human need for social
support, caring, and love (Bernard, 1993). Goodenow and Grady (1993) defined “sense of
belonging” as the extent to which students feel personally accepted, respected, included,
and supported in the school social environment. Maslow (1962) stated that the need of
belonging has to be satisfied before other needs can be fulfilled. Families that are
involved in their children’s school experiences and demonstrate caring and high
academic, moral, and social expectations increase the likelihood that their children will be
educationally resilient (Wang, Haertel, & Walberg, 1998). If this opportunity is
unavailable to them in their immediate family environment, Bernard (1993) proposes that
the school give these students a chance to develop caring relationships. A caring teacher
can enhance student learning, create a feeling of belonging, and serve as a role model for
career choice (Wang, Haertel, & Walberg, 1998). While student success and failure are
dependent upon a number of influential determinants, instructional practices and the
learning environment are contributing factors (Waxman & Huang, 1997).
60
School/Family/Community Partnerships
Data from the High School and Beyond study indicate that at-risk students who
drop out share a number of characteristics (Wehlage & Rutter, 1986). Hispanics and
students from low socioeconomic backgrounds have the highest dropout rate. Other
demographic factors that influence the dropout rate include family composition and
school climate (Wehlage, Rutter & Turnbaugh, 1987). In an effort to engage students
who are alienated, schools are encouraged to establish a positive social bond between
teachers, students, and families (Wehlage, Rutter, & Turnbaugh, 1987).
The model of school, family, and community partnerships locates the student at
the center (Epstein, 1995). School, family, and community partnerships cannot simply
produce successful students. Rather, partnership activities may be designed to motivate,
engage, guide, and energize students to produce their own successes (Epsten, 1995). The
linking of parent, school, and community resources helps amplify a student’s sense of
nurturance and support (Wang, Haertel, & Walberg, 1998). There are two common
approaches to involving families in schools and in their children’s education (Epstein,
1995). One approach emphasizes conflict and views the school as a battleground, with
relationships guaranteeing power struggles and disharmony. The other approach
emphasizes partnership and views the school as a homeland, sharing power and mutual
respect and directing focus toward activities that foster student learning (Epstein, 1995).
Parental involvement is defined as the parental participation in the educational
processes and experiences of their children (Jeynes (2007). In a meta- analysis of 52
studies examining the influence of parental involvement on the educational outcomes of
urban secondary school students, Jeynes (2007) addressed four issues pertinent to parents
61
and educators. First, to what degree is parental involvement associated with higher levels
of school achievement among urban students? Second, do school programs of parental
involvement positively influence urban students? Third, what aspects of parental
involvement help those students the most? Fourth, does the relationship between parental
involvement and academic achievement hold across racial groups? The analysis examined
the effects of parental involvement across different kinds of academic measures,
especially standardized versus non-standardized measures (Jeynes, 2007).
There are different types of parental involvement identified by educators (Epstein,
1995; Deslandees, Royer, Turcott, & Bertrand, 1997). These include: general parental
involvement, specific parental involvement, parental expectations, attendance and
participation, communication, homework, parental style. The results of Jeynes’ study
(2007) indicate that parental involvement has a positive impact on children’s academic
achievement. The overall result holds for all measures of academic achievement that were
examined and for minority students as well as the overall student population.
Family involvement in children’s education enhances children’s school
performance (Wang, Haertel, &Walberg, 1998). Educators have identified parental
involvement as the primary vehicle by which to raise academic achievement (Hara, 1998).
The active participation of family members in children’s educational experiences
improves their achievement, increases school attendance, and decreases dropout rates,
delinquency, and teenage pregnancy rates (Wang, Haertel, & Walberg, 1998).
Epstein conducted research on teachers’ practices of parental involvement and the
effects of family-school connections on students, parents, and teachers (Brandt, 1989).
The results of her research affirm that parents want to be more involved in their children’s
62
learning, especially at home, and that they need clear direction from the schools. Epstein
discusses five types of parent involvement (Brandt, 1989):
• Type 1: The basic obligation of parents refers to the responsibilities of
families to ensure children’s health and safety; to the parenting and child rearing
skills needed to prepare children for school; to the continual need to supervise,
discipline, and guide children at each age level; and to the need to build positive
home conditions that support school learning and behavior appropriate for each
grade level.
• Type 2: The basic obligations of schools refer to the communication from
school to home about school programs and children’s progress. Schools vary the
form and frequency of communications such as memos, notices, report cards and
conferences, and greatly affect whether all parents can understand the information
about school programs and children’s progress.
• Type 3: Parent involvement at school refers to parent volunteers who assist
teachers, administrators, and children in classrooms or in other areas of the school.
It also refers to parents who come to school to support student performances,
sports, or other events, or to attend workshops or other programs, for their own
education or training.
• Type 4: Parent involvement in learning activities at home refers to parent
initiated activities or child initiated requests for help and ideas or instructions from
teachers for parents to monitor or assist their own children at home in learning
activities that are coordinated with the children’s class work.
63
• Type 5: Parent involvement in governance and advocacy refers to parents
taking decision-making roles in the parent- teacher organizations, advisory
councils, or other committees or groups at the school, district, or state level. It also
refers to parent and community activists in independent advocacy groups that
monitor the schools and work for school improvement.
Students are often their parents’ main source of information about the school
(Epstein, 1995). Parents provide information, learning opportunities, behavioral models,
and connections to other resources (Wang, Haertel, & Walberg, 1998). A theory of
family-school connections identifies four “microsystems” that influence children:
families, peer groups, schools, and neighborhoods (Wang, Haertel, & Walberg, 1998).
The degree of overlap among these microsystems represents the extent to which they
share constructive values, goals, and understanding of the social and cultural processes
governing everyday life. The greater the overlap among these systems, the more common
their cultures. When home, school, peer group, and larger community are similar, the
impact of interventions on children and youth is greater (Epstein, 1995).
Some children succeed in school without much family involvement or despite
family neglect or distress, particularly if the school has excellent academic and support
programs (Epstein, 1995). Teachers, relatives outside of the immediate family, other
families, and members of the community can provide guidance and encouragement to
these students. As support from school, family, and community accumulates, more
students feel secure and cared for, work to achieve to their full potential, build positive
attitudes and school behaviors, and stay in school (Epstein, 1995).
64
Goals 2000 legislation sets partnerships as a voluntary national goal for all schools
(Sheldon & Epstein, 2005). Title I specifies and mandates programs and practices of
partnership in order for schools to qualify for or maintain funding. Partnership programs
establish a base of respect and trust on which to build. Good partnerships withstand
questions, conflicts, debates, and disagreements and provide structures and processes to
solve problems (Epstein, 1995). Despite real progress in many states, districts, and
schools, there are still many schools in which educators do not understand the families of
their students (Epstein, 1995).
Family-involvement practices at home and at school have been found to influence
middle and high school students’ academic achievement (Ginsburg & Hanson, 1986).
Romo and Falbo (1995) report in their findings that the parents of the students who
graduated from high school set limits for their children, and the children knew that these
were nonnegotiable. The decline in parental participation for secondary students reflects
weaker family practices at the secondary school level. Dornbusch & Ritter (1988)
reported that the majority of high school teachers (60%) reported contacting almost none
or few parents. Purnell and Gott (1985) reported that secondary teachers felt they did not
have sufficient time to implement effective practices of family involvement. Sanders and
Epstein (1998) also report that educators and families feel that time is limited for their
work on partnerships. The results of the Sanders and Epstein study (1998) also suggest
that the attitudes of the educators and families can present obstacles to effective home-
school-community partnerships.
The National Center for Education Statistics (1999) reports that students in the
United States know less mathematics than their peers in Asian and European countries.
65
Using longitudinal data from elementary and secondary schools, Sheldon and Epstein
(2005) examined the connections between specific family and community involvement
activities and student achievement in mathematics. The results of this study support the
expectation that subject-specific, family involvement activities will likely affect student
outcomes in the targeted curricular subject.
Summary
The late Ron Edmonds said, “We currently know enough to educate every child.
The question is how badly we want to” (SREB, 2006). The practice that holds the most
promise for making a more effective system is that we all operate as a learning
community. We make time for collaboration, we enlist all teachers to make a better
system for learners, and we assume a shared responsibility for making our schools better
(Marzano, 2003). We need to concentrate on the educational achievement and attainment
of our nation’s Hispanic youth (Fry, 2003). Individuals are influenced by interpersonal,
emotional, and cultural factors in addition to the cognitive factors associated with
classroom learning (den Brok, Brekelmans, & Wubbels, 2004). Focus on educational
resiliency might lead to improvements in the education of students at risk of academic
failure. Caring for students involves reaching out to involve their families and addressing
their problems resulting from social barriers. Increasing numbers of elementary, middle,
and high schools are working hard to build successful partnerships because they know
that schools can most effectively educate students with the help and support of families
and communities (Sanders & Epstein, 1998).
66
CHAPTER III
METHOD
The purpose of this chapter is to describe the research design and method used in
this research study. This chapter is divided into five sections that discuss the research
purpose and context; participants; instrumentation; data collection; and methods of data
analysis. The researcher describes in the first section, the purpose of the study, the context
of the study, and the research design. Section two addresses the demographics of the
schools, participants, and criteria for selection of schools. Section three provides
information on the instrumentation, and section four describes the data collection process.
In section five, the researcher reports data analysis procedures used to answer the
questions of the study.
Purpose and Context of the Study
Studies have indicated that interpersonal teacher behavior is an important aspect of
the learning environment and that it is strongly related to student outcomes (Rickards &
Fisher, 2000). Wubbels (1993) has reported that interpersonal teacher behavior is an
important factor related to student outcomes. The purpose of this study was to determine
which teacher interpersonal relationship behaviors are related to Hispanic student success
in high school. What teacher behaviors in the high school classroom environment do
Hispanic students identify as providing caring and support?
The study was designed to answer the following major research question: What
are the teacher interpersonal relationship behaviors related to Hispanic student success in
high school? Several sub questions guided the study:
67
• How do high school Hispanic students identify teacher interpersonal
relationship behaviors within the eight domains of the Model for Interpersonal
Behavior on the Questionnaire on Teacher Interaction?
• Which teacher interpersonal relationship behaviors, as identified by high
school Hispanic students on the Questionnaire on Teacher Interaction, vary by
setting and selected academic disciplines: mathematics and science?
• Do the teacher interpersonal relationship behaviors, as identified by high
school Hispanic students on the Questionnaire on Teacher Interaction, differ by
certain characteristics: student’s stated chronological age, current grade
placement, student self- reported final grade in mathematics or science, and
parental/community support?
Research Design
The researcher conducted a descriptive study to identify the teacher interpersonal
relationship behaviors related to high school Hispanic student success. The research
design is quantitative, as data were collected using a valid, reliable instrument, the
Questionnaire on Teacher Interaction (QTI). This investigation, guided by the
aforementioned questions, objectively and systematically provided a quantitative
description of the teacher interpersonal relationship behaviors perceived by high school
Hispanic students. The possible influence of these behaviors on Hispanic student success
was investigated. Hispanic students’ performance on the Georgia High School Graduation
Tests was a criterion for selection of participants. The students’ self reported final grade
in mathematics and science was a measure of student success.

68
Participants
Based on the 2000 U.S. Census Bureau, approximately 5.3% of the population in
Georgia (8, 684, 715) is comprised of individuals of Hispanic or Latino origin. The
researcher selected two public school districts in Georgia with a reported varying
percentage of Hispanic students enrolled in the high school(s). In the first district, the
urban community selected for this study had 27, 912 residents, of which 41% were
Hispanic (U.S. Census Bureau 2000). The majority speaks a language other than English
at home and are foreign born. In this district, a Georgia public high school was selected
based on multiple criteria: (1) enrollment of at least 1500 students, (2) student population
of at least 50% Hispanic, (3) the majority of teachers had a minimum of 10 years teaching
experience, and (4) more the 50% of Hispanic students taking the Georgia High School
Graduation Tests had a score of pass/pass plus on the Mathematics and Science portions.
During the 2006-2007 school year, 52% (820) of the students in the selected high school
were reported as Hispanic. This percentage exceeded the reported 8% state average for
Hispanic students (GA Dept. of Education, 2004-2005). Approximately 820 Hispanic
students enrolled in grades 9-12, in the selected Georgia public high school, were asked to
voluntarily complete the Questionnaire on Teacher Interaction (QTI). The response rate
was 58% (479 students). Specifically, two hundred twelve students identified the
behaviors of their mathematics teacher and two hundred sixty seven identified the
behaviors of their science teacher. Parents and students, prior to participation, completed
an informed consent form. The consent form was translated to Spanish, if warranted, to
insure comprehension.
69
A contrasting sample was selected from another Georgia public school district. In
2005, the selected urban district had a reported population estimate of 154, 918, of which
1.6% (2479) was of Hispanic origin. In the 2005-2006 school year, 82% of the 11th grade
Hispanic students in this district, who took the GHSGT, passed the mathematics portion
and 42% passed the science portion. The performance of the Hispanic students in this
selected district on the GHSGT was below the reported pass/pass plus percentage for
Hispanic students in the state. In the 2006-2007 school year, there were 5876 students
enrolled in the six high schools in the district; 1.6% (94) of the students were Hispanic.
Approximately 94 Hispanic students currently enrolled in grades 9-12, in the selected
Georgia public school district, were asked to voluntarily complete the Questionnaire on
Teacher Interaction (QTI). The response rate was 99% (93 students). Specifically, forty-
six students identified the behaviors of their mathematics teacher and forty-six students
identified the behavior of their science teacher. Parents and students, prior to
participation, completed an informed consent form. The consent form was translated to
Spanish, if warranted, to insure comprehension.
The Georgia High School Graduation Tests (GHSGT) is a standards-based
assessment that measures how well students are mastering specific skills in
English/language arts, math, science, and social studies. Students must pass all parts of
the GHSGT in order to graduate from high school. In Georgia, the high school graduation
rate in 2005-06 was 70.8%. In the 2005-2006 school year, 64% of 11th grade Hispanic
students in the selected high school, who took the GHSGT, passed the science portion and
94% passed the mathematics portion (GA Dept. of Education, 2005-2006). The
performance of Hispanic students in the selected high school exceeded the reported state
70
pass/pass plus percentage of 89% in mathematics and 59% in Science for Hispanic
students.
Instrumentation
Research study participants (n=572) completed the Questionnaire on Teacher
Interaction (QTI) during the spring semester of the 2006-2007 school year. Participants
were asked to select their most current or most recent science or mathematics teacher and
identify to what extent they observed their science or mathematics teacher evidence the
stated behavior. The Questionnaire on Teacher Interaction (Wubbels & Levy, 1993) was
selected for use in this research because it is designed to gather data that describe
students’ perceptions of teacher behavior. The conceptualization of teacher-student
interpersonal behavior partially evolved from a systems approach to communication
(Watzlawick, Beavin, & Jackson, 1967). The Questionnaire on Teacher Interaction
(Wubbels & Levy, 1993) contained 48 items aligned to eight domains: leadership,
understanding, helpful/friendly, dissatisfied, admonishing, strict, uncertain, and
student/responsibility/freedom. Each domain contained six items that were responded to
on a five-point scale (0-4) with the extreme alternatives of Never-Always. The researcher
calculated Cronbach’s alpha, based on the six standardized items for each domain. This
measure of the internal consistency of the QTI was based on the extent to which the
participants in this study who answered a test item one way responded to other items the
same way. Table 4 identifies the eight domains of the Model for Interpersonal Teacher
Behavior on the Questionnaire on Teacher Interaction (Wubbels, Levy, & Fraser, 1993)
and the reliability statistic (Cronbach’s Alpha).
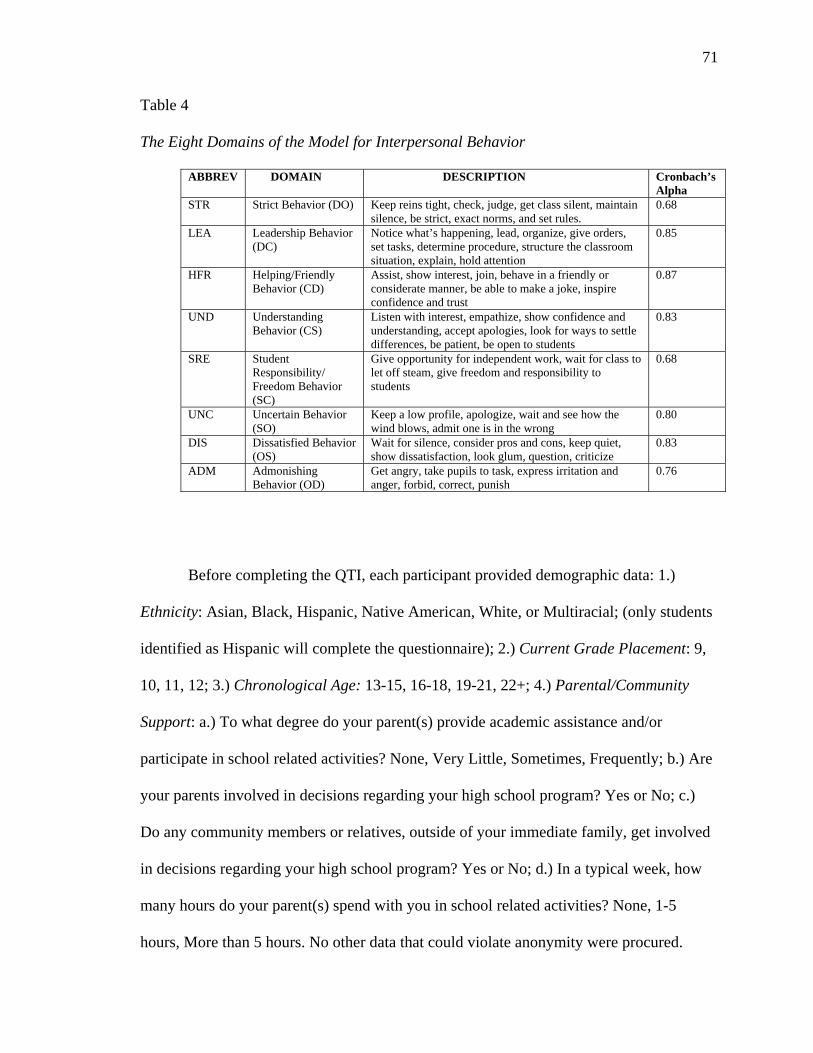
71
Table 4
The Eight Domains of the Model for Interpersonal Behavior
ABBREV DOMAIN DESCRIPTION Cronbach’s Alpha
STR Strict Behavior (DO) Keep reins tight, check, judge, get class silent, maintain silence, be strict, exact norms, and set rules.
0.68
LEA Leadership Behavior (DC)
Notice what’s happening, lead, organize, give orders, set tasks, determine procedure, structure the classroom situation, explain, hold attention
0.85
HFR Helping/Friendly Behavior (CD)
Assist, show interest, join, behave in a friendly or considerate manner, be able to make a joke, inspire confidence and trust
0.87
UND Understanding Behavior (CS)
Listen with interest, empathize, show confidence and understanding, accept apologies, look for ways to settle differences, be patient, be open to students
0.83
SRE Student Responsibility/ Freedom Behavior (SC)
Give opportunity for independent work, wait for class to let off steam, give freedom and responsibility to students
0.68
UNC Uncertain Behavior (SO)
Keep a low profile, apologize, wait and see how the wind blows, admit one is in the wrong
0.80
DIS Dissatisfied Behavior (OS)
Wait for silence, consider pros and cons, keep quiet, show dissatisfaction, look glum, question, criticize
0.83
ADM Admonishing Behavior (OD)
Get angry, take pupils to task, express irritation and anger, forbid, correct, punish
0.76
Before completing the QTI, each participant provided demographic data: 1.)
Ethnicity: Asian, Black, Hispanic, Native American, White, or Multiracial; (only students
identified as Hispanic will complete the questionnaire); 2.) Current Grade Placement: 9,
10, 11, 12; 3.) Chronological Age: 13-15, 16-18, 19-21, 22+; 4.) Parental/Community
Support: a.) To what degree do your parent(s) provide academic assistance and/or
participate in school related activities? None, Very Little, Sometimes, Frequently; b.) Are
your parents involved in decisions regarding your high school program? Yes or No; c.)
Do any community members or relatives, outside of your immediate family, get involved
in decisions regarding your high school program? Yes or No; d.) In a typical week, how
many hours do your parent(s) spend with you in school related activities? None, 1-5
hours, More than 5 hours. No other data that could violate anonymity were procured.
72
A field trial was conducted with 2-3 high school Hispanic students not included in
the sample. This field trial provided an opportunity to critically evaluate the questionnaire,
parental/community support questions, and assess the administration time. Factors relative
to demographic data were examined to assess appropriateness. Revisions to specific
directions for completion and questions relative to parental/community support were
made after the field trial to insure clarity and understanding.
Data Collection
The data collection strategy selected to conduct this descriptive study was the
administration of a questionnaire. After fulfilling the requirements to obtain university
internal review board and school district approval, data collection began. All student data
collection was conducted during connections classes. The impact of the research on
instructional time was minimal. After access was confirmed, Hispanic students in grades
9 through 12 were asked to voluntarily complete the Questionnaire on Teacher Interaction
(QTI). Since participation was voluntary, not all Hispanic students chose to participate.
Absenteeism also accounted for some Hispanic students not having the opportunity to
respond. Completion time was approximately twenty minutes per questionnaire.
Participants were directed to respond in a manner to collect data regarding the
interpersonal relationship behaviors of their mathematics or science teacher. The students
selected their science or mathematics teacher based on recent or current participation in
either class. Two separate instruments provided an opportunity for two separate sets of
responses, one for each academic discipline. In addition, the participants were strongly
encouraged to complete every item, since data could not be generated from incomplete
73
questionnaires. Clarification was provided, if warranted, to insure understanding of
questions on the questionnaire.
Data Analysis
The researcher sought to investigate the relationship between Hispanic student
success in high school and teacher interpersonal relationship behaviors. All data were
analyzed using the Statistical Analysis Package for the Social Scientist, version 13 (SPSS,
2004). Seven variables were manipulated: age, grade placement, final grade received in
core class, and 3 variables pertaining to parental/community involvement. The data were
reported in table and narrative format. One-way analysis of variance, multivariate analysis
of variance, and multiple regression were used to investigate associations. In analyzing
the data, the researcher was mindful of overestimation of the influence of interpersonal
teacher behavior on student motivation (den Brok, Fisher, & Scott, 2005). The strength of
the relationships derived from analyzing the data will be identified as weak, moderate,
and strong. Those relationships identified as weak are less than .4. Those identified as
moderate have relationships of .4 to .59. Strong relationships were .6 or higher. The level
of significance was set at the .05 level of probability. In an effort to determine if there
were significant differences between the means of the groups, an analysis of variance was
used (Ravid, 1994).
Descriptive statistics were used to answer the first research question, “How do
high school Hispanic students identify teacher interpersonal relationship behaviors within
the eight domains of the Model for Interpersonal Behavior on the Questionnaire on
Teacher Interaction?” Mean and standard deviation for the high school Hispanic students
were reported by domain using sector scores (the average of the six items that pertain to
74
one sector or scale). Further analysis was conducted to ascertain if any differences existed
in the data reported by the students in the district with a large percentage of high school
Hispanic students and the high school Hispanic students in the district with a small
percentage of high school Hispanic students.
To answer the second research question, “Which teacher interpersonal relationship
behaviors, as identified by high school Hispanic students on the Questionnaire on Teacher
Interaction, vary by setting and selected academic disciplines: mathematics and science?”
the t test for independent means and a two-way analysis of variance were used to compare
the mean scores of the group in science class and the group in mathematics class, and the
group in the district with a large percentage of high school Hispanic students and the
district with a small percentage of high school Hispanic students.
The third research question is “Do the teacher interpersonal relationship behaviors,
as identified by high school Hispanic students on the Questionnaire on Teacher
Interaction, differ by certain characteristics: student’s stated chronological age, current
grade placement, student self- reported final grade in mathematics or science, and
parental/community support?” A correlational technique, multiple regression, determined
whether the predictor variables, students’ stated chronological age, current grade
placement, self-reported final grade in mathematics/science, and parental community
support, could be combined to predict the criterion, teacher interpersonal relationship
behaviors, better than any one predictor variable does alone.
Summary
This chapter addressed the methods and procedures that were used in this study by
the researcher to ascertain the teacher interpersonal relationship behaviors related to

75
Hispanic student success in high school. Information relative to study sample, research
design, instrumentation, data collection, and data analysis was also included. Data
obtained from the Questionnaire on Teacher Interaction were analyzed using descriptive
statistics, t tests, multiple regression, and two-way analysis of variance.
76
CHAPTER IV
REPORT OF DATA AND DATA ANALYSIS
Introduction
The purpose of this study was to determine what teacher interpersonal relationship
behaviors are related to Hispanic student success in high school. The researcher reported
answers to the research questions that guided this study. High school Hispanic students
completed the Questionnaire on Teacher Interaction (QTI), which was designed to gather
data that identified students’ perceptions of teacher behavior. The QTI contains 48 items,
aligned to eight domains of teacher interpersonal relationship behaviors. The domains
were: leadership, understanding, uncertain, admonishing, helpful/friendly, strict,
dissatisfied, and student responsibility/freedom.
Participants of the study, a total of 572 high school Hispanic students, were asked
to complete this questionnaire about their mathematics or science teacher in the spring of
2007. There were 212 high school Hispanic students from a district with a large
percentage of high school Hispanic students and 47 high school Hispanic students from a
district with a small percentage of high school Hispanic students who identified the
teacher interpersonal relationship behaviors of their mathematics teacher. This resulted in
a total of 259 high school Hispanic students who identified the teacher interpersonal
relationship behaviors of their mathematics teacher. There were 267 high school Hispanic
students from a district with a large percentage of high school Hispanic students and 46
high school Hispanic students from a district with a small percentage of high school
Hispanic students who identified the teacher interpersonal relationship behaviors of their
science teacher. This resulted in a total of 313 high school Hispanic students who

77
identified the teacher interpersonal relationship behaviors of their science teacher. The
data collected from the questionnaire were used to answer the research questions of this
study.
Before reporting the findings, the researcher described the research questions, and
the setting of the study. The chapter ended with a summary of the major findings.
Research Questions
The study was designed to answer the following major research question: What
are the teacher interpersonal relationship behaviors related to Hispanic student success in
high school? The following sub questions were addressed in this research study:
1. How do high school Hispanic students identify teacher interpersonal
relationship behaviors, within the eight domains of the Model for Interpersonal
Behavior, on the Questionnaire on Teacher Interaction?
2. Which teacher interpersonal relationship behaviors, as identified by high
school Hispanic students on the Questionnaire on Teacher Interaction, vary by
setting and selected academic disciplines: mathematics and science?
3. Do the teacher interpersonal relationship behaviors, as identified by high
school Hispanic students on the Questionnaire on Teacher Interaction, differ by
certain characteristics: student’s stated chronological age, current grade placement,
student self- reported final grade in mathematics or science, and
parental/community support?
Setting
Data for this study were collected during the 2006-2007 school year from high
school Hispanic students in two public school districts in Georgia. One district, located in
78
northern Georgia, had a student population of approximately 6500 students. There were
approximately 1600 students enrolled in the one high school in this district. Fifty-one
percent (816 students) of this population was reported as Hispanic. The performance of
the high school Hispanic students in this district exceeded the 2005 reported state
pass/pass plus percentage of 89% in mathematics and 59% in science for Hispanic
students on the Georgia High School Graduation Tests (GHSGT). Specifically, in 2005-
2006, 64% of 11th grade Hispanic students in this district who took the GHSGT, passed
the science portion and 94% passed the mathematics portion (GA Dept. of Education,
2005-2006).
The second district, located in central Georgia, had a student population of
approximately 25,000 students. In the six high schools in the district, there were
approximately 5900 students. One and six-tenths percent (94) of this population was
reported as Hispanic. In this district with a small percentage of high school Hispanic
students, 42% of the Hispanic students who took the GHSGT passed the science portion
and 82% passed the mathematics portion in 2005-2006. The performance of the Hispanic
students in the district with a smaller percentage of high school Hispanic students was
below the 2005-2006 reported state pass/pass plus percentage of 89% in mathematics and
59% in science for Hispanic students on the GHSGT.
Focus groups, with school personnel, helped the researcher better understand the
educational setting of the students. The researcher gained insight relative to the programs
and policies pertaining to the high school Hispanic students. Administrators, teachers,
support personnel, program specialists, and graduation coaches shared experiences and
beliefs relative to Hispanic students in their school. School personnel in both districts
79
discussed issues relative to staff development, language proficiency, cultural awareness,
and educational opportunities available to Hispanic students. The researcher was
familiarized with program components, instructional practices, parent/community
involvement, and school/classroom organization and climate, as they pertained to
Hispanic students. This information helped the researcher better understand the setting in
which the students identified the teacher interpersonal relationship behaviors.
In the district with a large percentage of high school Hispanic students, the focus
group consisted of administrators, teachers, support personnel, alternative program
specialists, and a graduation coach. These individuals willingly shared experiences and
beliefs relative to the Hispanic students and discussed educational opportunities offered to
the Hispanic students. The International Baccalaureate Program provided highly
motivated students an academic experience that emphasized critical thinking, intercultural
understanding, and exposure to a variety of points of view. One of the teachers reported
that there have been more Hispanic students participating in this program within recent
years. It was noted that “generational issues” might have contributed to the increased
participation in this program. Specifically, one family member may report to the other that
this program “really opened doors for me” and encouraged a sibling or relative to pursue
this goal. The teachers spoke of the students being a “millennium generation,” that is, they
embraced group activities, were more accepting of cultural differences, and appeared to
“assimilate easier.” A teacher reported that, although curricular modifications may be
provided, “rigor would not be compromised.” Although a Hispanic student may not have
responded initially to the required rigor, needed to be trained to the expectations and
requirements, and may have performed poorly because he did not have the
80
preparation/perseverance to succeed, that same student made significant progress, once
structured instruction was provided. Although the student was of high school age, study
skills and work habits were taught because the school experience/culture may have been
different. Controversy about grading among the teachers was reported. Some teachers
relied on traditional grading methods, whereas other teachers confirmed, via less
traditional methods, that the student had acquired the course content.
The district with the smaller percentage of high school Hispanic students did not
report the availability of language programs designed to help students transition into
school The focus group, consisting of administrators, teachers, and translators related that
the ESOL program was available to students. The Migrant Education Agency provided
minimal financial assistance to families with medical, legal, and crisis situations. This
agency indirectly benefited from the educational programs. The interpreters were hired on
a contractual basis and served as liaisons for school personnel. They met with families on
an as-needed basis and clarified school issues, when needed. Opportunities for higher
education were sent to teachers rather than a non-existing career office. Subsequently,
insuring that students were aware of opportunities after high school was inconsistent.
Another issue was that of documented students. It was stated that undocumented students
often drop out and do not seek a high school diploma. Due to their status, the high school
diploma would not afford them an opportunity to pursue a college education or a job of
their choice. The policy that both districts clearly stated was that the high school diploma
was “powerful” and “can take you anywhere.”
In both districts there were individuals available to serve as interpreters. School
personnel reported the need for small group activities for the parents. Teachers reported
81
that parents are often not comfortable in large group settings. Educational programs for
parents were noted as an area of need. Specifically, parents may not know how to
encourage their son/daughter to stay in school and pursue career goals due to their own
limited experiences. The parents of most of the Hispanic students did not attend college.
They are not familiar with available career options that may or may not require two or
four years of college training.
In the district with the high percentage of high school Hispanic students, three
language programs were described: the International Academy, the Language Academy,
and the English for Speakers of other Languages classes (ESOL). In addition there were
language labs with computer-assisted instruction. The International Academy was
designed to serve limited English proficient students who are newcomers to the United
States and teach English while remediating academic delays and providing first-language
support to enable students to close the achievement gap. Students in the Language
Academy classes were newcomers, had limited English proficiency, and demonstrated
age/grade level academic and Spanish language skills when tested in Spanish. First
language support was provided to assure that achievement gaps did not develop while
students were learning English. School personnel reported lots of parent involvement in
the academy. All Language Academy teachers were bilingual and the students remained
in this program for one year. The ESOL classes were sheltered for content instruction and
were designed to give students support to achieve higher academic levels. The ACCESS
test is used for entry to and exit from the ESOL program. It was reported that in 2006 only
4% of students exited the program, whereas 26% exited the program in 2007. Exit criteria
also include the student’s grade point average. In 2006, only 13% of the students enrolled
82
in ESOL had a 3.5 or better grade average, as compared to 42% in 2007. Teachers voiced
the belief that the Hispanic students “deserved the same as everybody else.” It was also
reported that students were “taught to get involved” in school activities, yet the “door may
be closed.” Specifically, there were school organizations that presented roadblocks due to
the student’s limited language proficiency, transportation issues, and/or fees/uniforms. It
was noted that many educators talk about “being open to differences” yet “attitudes still
prevail.” It was also reported that some parents believe that if their child gets involved in
school activities, the child may “disconnect” from academic expectations.
The administrators in the high school with a high percentage of Hispanic students
reported using student performance data to guide their actions. The school culture
appeared to be data driven and focused on accountability for the academic performance of
all students. Teachers in this district appeared to be empowered to share in the leadership
of the school and there was evidence of effective communication with all stakeholders.
In the district with the larger percentage of Hispanic students, there was a reported
larger percentage of Hispanic leaders in the community. However, it was reported that
these leaders were more involved in the school activities because their children attended
the school. School personnel reported the need for male role models to encourage students
to stay in school.
Findings
Research Question 1: How do high school Hispanic students identify teacher
interpersonal relationship behaviors within the eight domains of the Model for
Interpersonal Behavior on the Questionnaire on Teacher Interaction?
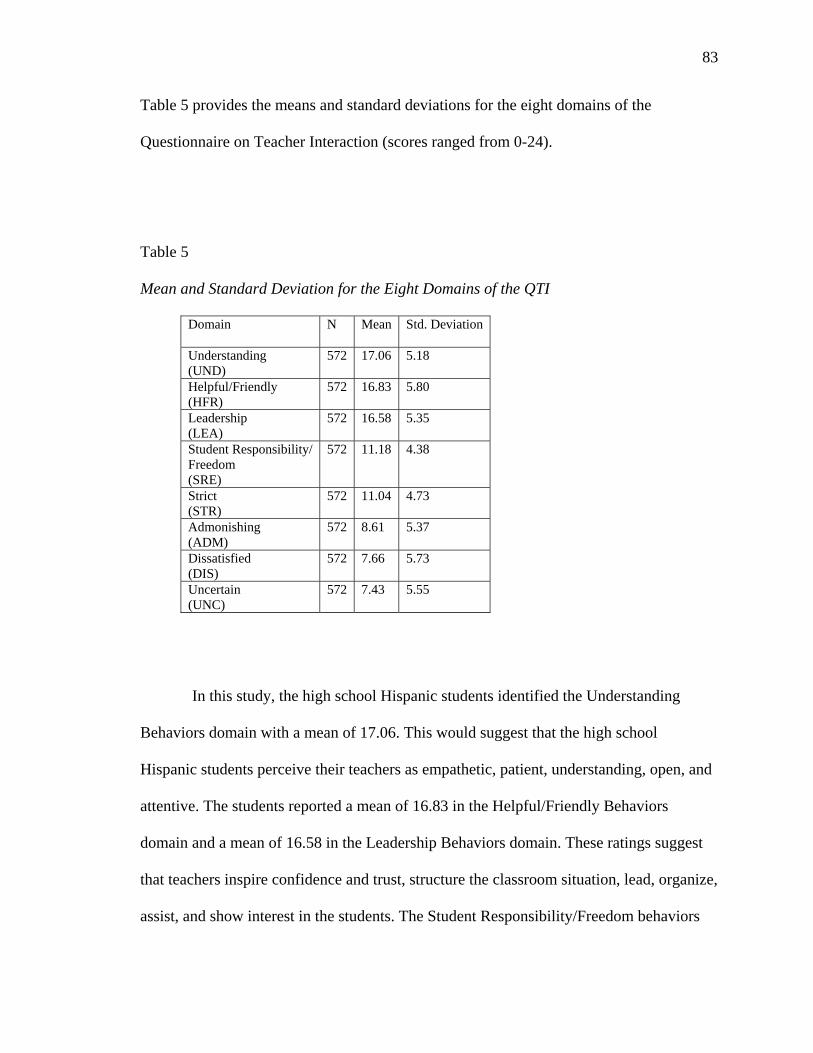
83
Table 5 provides the means and standard deviations for the eight domains of the
Questionnaire on Teacher Interaction (scores ranged from 0-24).
Table 5 Mean and Standard Deviation for the Eight Domains of the QTI
Domain N Mean Std. Deviation
Understanding (UND)
572 17.06 5.18
Helpful/Friendly (HFR)
572 16.83 5.80
Leadership (LEA)
572 16.58 5.35
Student Responsibility/ Freedom (SRE)
572 11.18 4.38
Strict (STR)
572 11.04 4.73
Admonishing (ADM)
572 8.61 5.37
Dissatisfied (DIS)
572 7.66 5.73
Uncertain (UNC)
572 7.43 5.55
In this study, the high school Hispanic students identified the Understanding
Behaviors domain with a mean of 17.06. This would suggest that the high school
Hispanic students perceive their teachers as empathetic, patient, understanding, open, and
attentive. The students reported a mean of 16.83 in the Helpful/Friendly Behaviors
domain and a mean of 16.58 in the Leadership Behaviors domain. These ratings suggest
that teachers inspire confidence and trust, structure the classroom situation, lead, organize,
assist, and show interest in the students. The Student Responsibility/Freedom behaviors
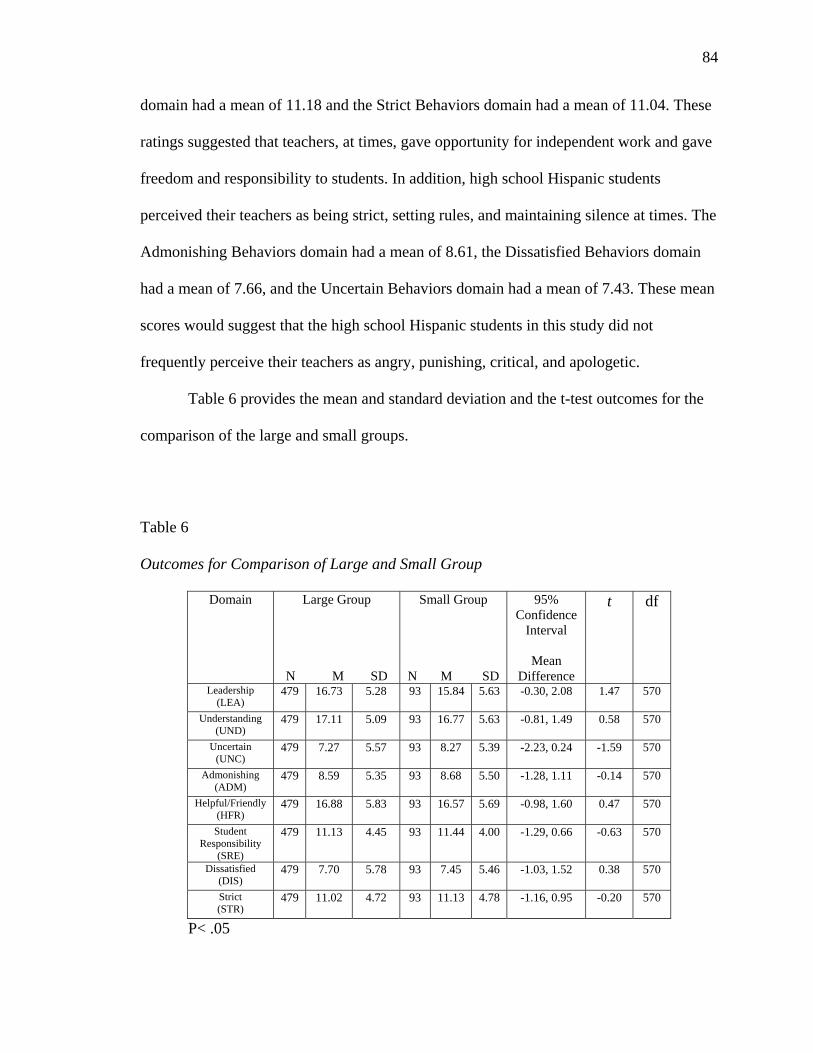
84
domain had a mean of 11.18 and the Strict Behaviors domain had a mean of 11.04. These
ratings suggested that teachers, at times, gave opportunity for independent work and gave
freedom and responsibility to students. In addition, high school Hispanic students
perceived their teachers as being strict, setting rules, and maintaining silence at times. The
Admonishing Behaviors domain had a mean of 8.61, the Dissatisfied Behaviors domain
had a mean of 7.66, and the Uncertain Behaviors domain had a mean of 7.43. These mean
scores would suggest that the high school Hispanic students in this study did not
frequently perceive their teachers as angry, punishing, critical, and apologetic.
Table 6 provides the mean and standard deviation and the t-test outcomes for the
comparison of the large and small groups.
Table 6 Outcomes for Comparison of Large and Small Group
Domain Large Group
N M SD
Small Group
N M SD
95% Confidence
Interval
Mean Difference
t df
Leadership (LEA)
479 16.73 5.28 93 15.84 5.63 -0.30, 2.08 1.47 570
Understanding (UND)
479 17.11 5.09 93 16.77 5.63 -0.81, 1.49 0.58 570
Uncertain (UNC)
479 7.27 5.57 93 8.27 5.39 -2.23, 0.24 -1.59 570
Admonishing (ADM)
479 8.59 5.35 93 8.68 5.50 -1.28, 1.11 -0.14 570
Helpful/Friendly (HFR)
479 16.88 5.83 93 16.57 5.69 -0.98, 1.60 0.47 570
Student Responsibility
(SRE) 479 11.13 4.45 93 11.44 4.00 -1.29, 0.66 -0.63 570
Dissatisfied (DIS)
479 7.70 5.78 93 7.45 5.46 -1.03, 1.52 0.38 570
Strict (STR)
479 11.02 4.72 93 11.13 4.78 -1.16, 0.95 -0.20 570
P< .05
85
The Hispanic students from the district with a large percentage of high school
Hispanic students reported a mean of 17.11 in the Understanding Behaviors domain,
whereas the Hispanic students in the district with the smaller percentage of high school
Hispanic students reported a mean of 16.77 in this domain. In the Helpful/Friendly
Behaviors domain, the high school Hispanic students in the district with the large
percentage of Hispanic students reported a mean of 16.88, and the Hispanic students in
the district with the small percentage reported a mean of 16.57. The Leadership Behaviors
domain was ranked third by both groups of students. In the district with the large
percentage of Hispanic students, the mean was 16.73 and in the district with a small
percentage of Hispanic students, the mean was 15.84. In the domain, Student
Responsibility/Freedom, the high school Hispanic students in the district with a large
percentage of Hispanic students reported a mean of 11.13 and the high school Hispanic
students in the district with a small percentage of Hispanic students reported a mean of
11.44. Both groups ranked Strict Behaviors as fifth. The high school Hispanic students in
the district with a large percentage of Hispanic students reported a mean of 11.02 and the
high school Hispanic students in the district with a small percentage of Hispanic students
reported a mean of 11.13. In the Admonishing Behaviors domain, the high school
Hispanic students in the district with a large percentage of Hispanic students reported a
mean of 8.59 and the high school Hispanic students in the district with a small percentage
of Hispanic students reported a mean of 8.68. The Dissatisfied Behaviors domain and the
Uncertain Behaviors domain were the two lowest reported by both groups of students.
The mean scores reported by the high school Hispanic students in the district with the
large percentage of Hispanic students was 7.70 for Dissatisfied Behaviors and 7.27 for
86
Uncertain Behaviors. The high school Hispanic students in the district with a small
percentage of Hispanic students reported a mean of 7.45 for Dissatisfied Behaviors and a
mean of 8.27 for Uncertain Behaviors.
There was no significant difference in the behaviors identified by the group of
students from the school system with a large percentage of high school Hispanic students
than by the students in the system with a small percentage of high school Hispanic
students. In this study, high school Hispanic students ranked the teacher’s Leadership
Behaviors, Understanding Behaviors, and Helpful/Friendly Behaviors with the highest
means and Admonishing, Dissatisfied, and Uncertain Behaviors with the lowest means.
Leadership behaviors included leading, organizing, giving orders, determining procedure,
and structuring the classroom situation. The behaviors measured in the Understanding
Behaviors domain included empathy, listening with interest, showing confidence and
understanding, and being open with students. Helpful/Friendly Behaviors suggested that
the teacher behaved in a friendly or considerate manner, showed interest, and inspired
confidence and trust. Uncertain Behaviors were evidenced in teachers who kept a low
profile, apologized, and admitted being in the wrong. Within the Admonishing Behaviors
domain, the teacher expressed irritation and anger, and forbad and punished. Teachers
who looked unhappy, questioned, and waited for silence, evidenced behaviors within the
Dissatisfaction domain. Behaviors in the Student Responsibility/Freedom and Strict
Behaviors domain were two standard deviations below the mean. These behaviors
reflected the extent to which the teacher gave opportunity for independent work, gave
freedom and responsibility to the students, and set rules and maintained silence in the
classroom.
87
A t-test for independent means was used to ascertain whether the difference
between the means of the two groups was significant. A difference did not exist between
the two groups on any of the variables. Teacher interpersonal relationship behaviors were
perceived similarly by high school Hispanic students in a school district with a large
percentage of Hispanic students and those in a school district with a much lower
percentage of high school Hispanic students.
In summary, the findings to research question 1 were:
• High school Hispanic students identified the Understanding,
Helpful/Friendly, and Leadership Behaviors domains of the QTI with the highest
means.
• High school Hispanic students identified the Admonishing, Dissatisfied,
and Uncertain Behaviors domains of the QTI with the lowest means.
• There was no significant difference in the behaviors identified by the
group of students from the school system with a large percentage of high school
Hispanic students than those identified by the students in the system with a small
percentage of high school Hispanic students.
Research Question 2: Which teacher interpersonal relationship behaviors, as identified
by high school Hispanic students on the Questionnaire on Teacher Interaction, vary by
setting and selected academic disciplines: mathematics and science?
A two-way analysis of variance was used to examine mean responses to the QTI
by school setting and subject area. Table 7 provides the Mathematics and Science data for
both groups of students.
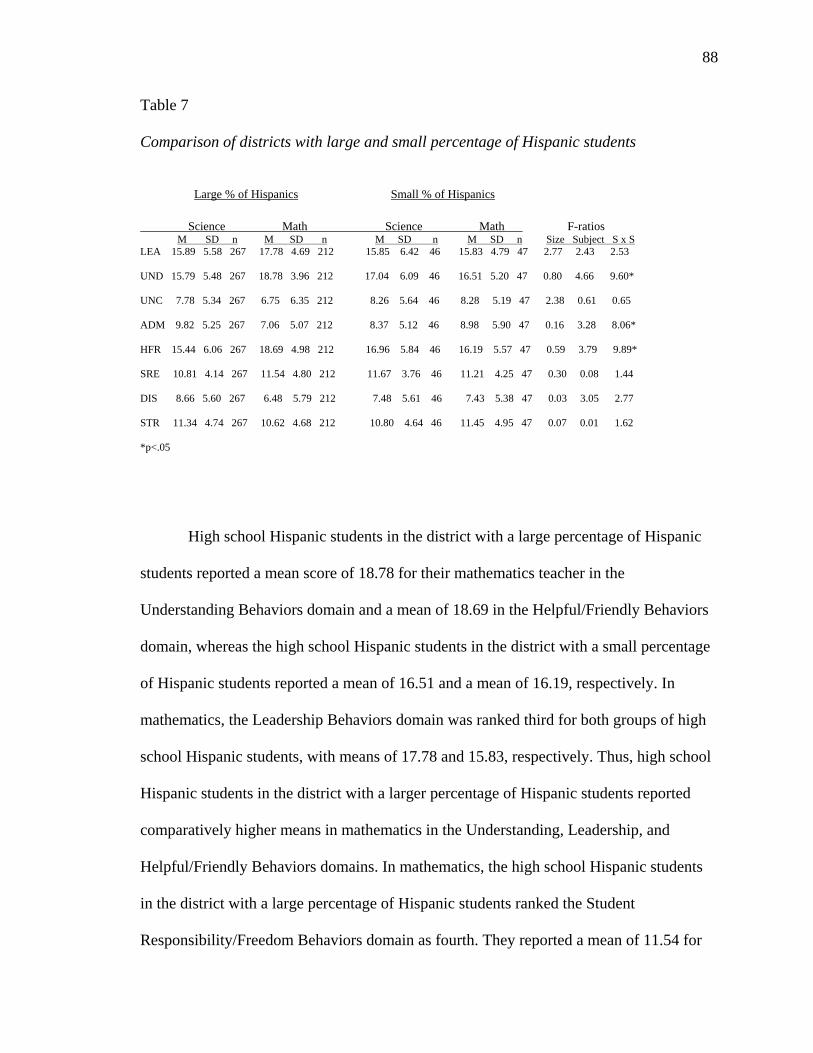
88
Table 7 Comparison of districts with large and small percentage of Hispanic students Large % of Hispanics Small % of Hispanics Science Math Science Math F-ratios M SD n M SD n M SD n M SD n Size Subject S x S LEA 15.89 5.58 267 17.78 4.69 212 15.85 6.42 46 15.83 4.79 47 2.77 2.43 2.53 UND 15.79 5.48 267 18.78 3.96 212 17.04 6.09 46 16.51 5.20 47 0.80 4.66 9.60* UNC 7.78 5.34 267 6.75 6.35 212 8.26 5.64 46 8.28 5.19 47 2.38 0.61 0.65 ADM 9.82 5.25 267 7.06 5.07 212 8.37 5.12 46 8.98 5.90 47 0.16 3.28 8.06* HFR 15.44 6.06 267 18.69 4.98 212 16.96 5.84 46 16.19 5.57 47 0.59 3.79 9.89* SRE 10.81 4.14 267 11.54 4.80 212 11.67 3.76 46 11.21 4.25 47 0.30 0.08 1.44 DIS 8.66 5.60 267 6.48 5.79 212 7.48 5.61 46 7.43 5.38 47 0.03 3.05 2.77 STR 11.34 4.74 267 10.62 4.68 212 10.80 4.64 46 11.45 4.95 47 0.07 0.01 1.62 *p<.05
High school Hispanic students in the district with a large percentage of Hispanic
students reported a mean score of 18.78 for their mathematics teacher in the
Understanding Behaviors domain and a mean of 18.69 in the Helpful/Friendly Behaviors
domain, whereas the high school Hispanic students in the district with a small percentage
of Hispanic students reported a mean of 16.51 and a mean of 16.19, respectively. In
mathematics, the Leadership Behaviors domain was ranked third for both groups of high
school Hispanic students, with means of 17.78 and 15.83, respectively. Thus, high school
Hispanic students in the district with a larger percentage of Hispanic students reported
comparatively higher means in mathematics in the Understanding, Leadership, and
Helpful/Friendly Behaviors domains. In mathematics, the high school Hispanic students
in the district with a large percentage of Hispanic students ranked the Student
Responsibility/Freedom Behaviors domain as fourth. They reported a mean of 11.54 for
89
the mathematics teacher. The high school Hispanic students in the district with a small
percentage of Hispanic students ranked the Strict Behaviors domain as fourth with a mean
score of 11.45. These students reported a mean of 11.21 on the Student
Responsibility/Freedom Behaviors domain. Admonishing, Uncertain, and Dissatisfied
Behaviors were reported with the lowest means for the mathematics teacher by both
groups of students.
In science, both groups of high school Hispanic students reported the Leadership,
Understanding, and Helpful/Friendly Behaviors domains as having the highest means.
The high school Hispanic students in the district with the large percentage of Hispanic
students reported means of 15.89, 15.79, and 15.44, respectively. The high school
Hispanic students in the district with a small percentage of Hispanic students reported
means of 15.85, 17.04, and 16.96, respectively. In the district with a large percentage of
Hispanic students, the high school Hispanic students reported a mean in science of 11.34
on the Strict Behaviors domain and a mean of 10.81 on the Student
Responsibility/Freedom Behaviors domains. The high school Hispanic students in the
district with a small percentage of Hispanic students reported a mean in science of 11.67
on the Student Responsibility/Freedom Behaviors domain and a mean of 10.80 on the
Strict Behaviors domain. Admonishing, Uncertain, and Dissatisfied Behaviors were
reported with the lowest means for the science teacher by both groups of students.
Subgroups differ on the subject (mathematics and science) and the percentage of
high school Hispanic students in each district. In the Leadership Behaviors domain, the
interaction between the percentage of high school Hispanic students in the district and the
subject was not significant. In the Understanding Behaviors domain, the interaction
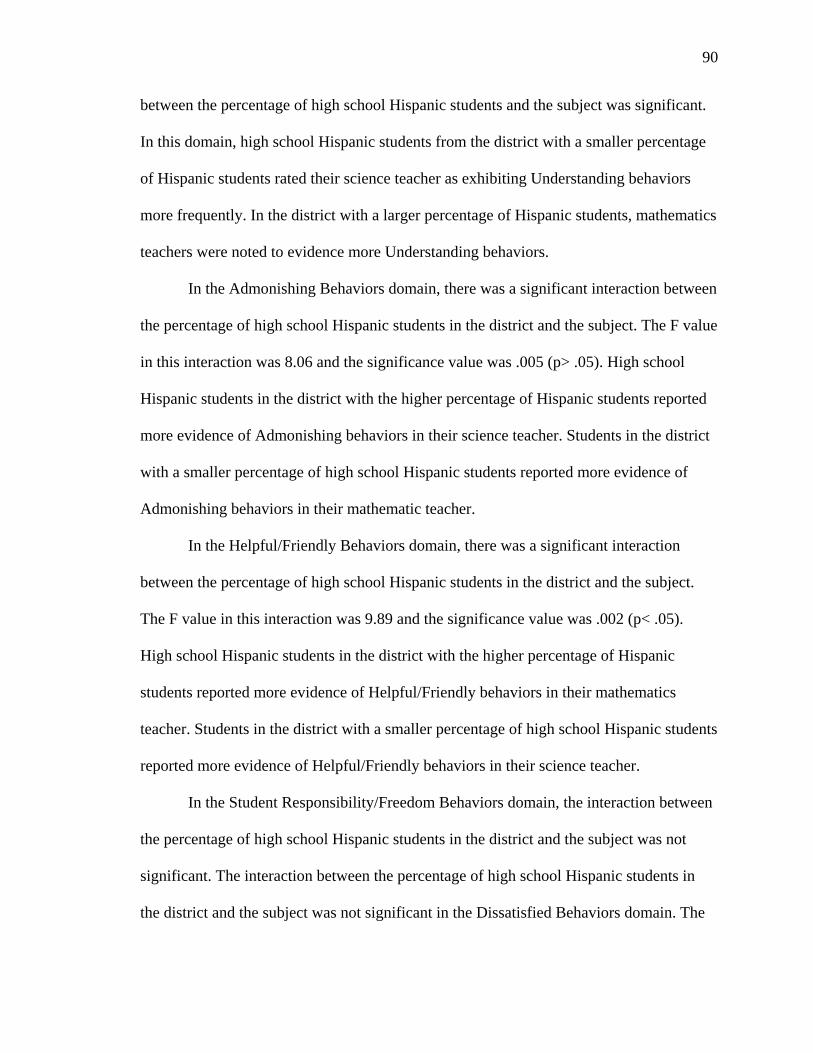
90
between the percentage of high school Hispanic students and the subject was significant.
In this domain, high school Hispanic students from the district with a smaller percentage
of Hispanic students rated their science teacher as exhibiting Understanding behaviors
more frequently. In the district with a larger percentage of Hispanic students, mathematics
teachers were noted to evidence more Understanding behaviors.
In the Admonishing Behaviors domain, there was a significant interaction between
the percentage of high school Hispanic students in the district and the subject. The F value
in this interaction was 8.06 and the significance value was .005 (p> .05). High school
Hispanic students in the district with the higher percentage of Hispanic students reported
more evidence of Admonishing behaviors in their science teacher. Students in the district
with a smaller percentage of high school Hispanic students reported more evidence of
Admonishing behaviors in their mathematic teacher.
In the Helpful/Friendly Behaviors domain, there was a significant interaction
between the percentage of high school Hispanic students in the district and the subject.
The F value in this interaction was 9.89 and the significance value was .002 (p< .05).
High school Hispanic students in the district with the higher percentage of Hispanic
students reported more evidence of Helpful/Friendly behaviors in their mathematics
teacher. Students in the district with a smaller percentage of high school Hispanic students
reported more evidence of Helpful/Friendly behaviors in their science teacher.
In the Student Responsibility/Freedom Behaviors domain, the interaction between
the percentage of high school Hispanic students in the district and the subject was not
significant. The interaction between the percentage of high school Hispanic students in
the district and the subject was not significant in the Dissatisfied Behaviors domain. The
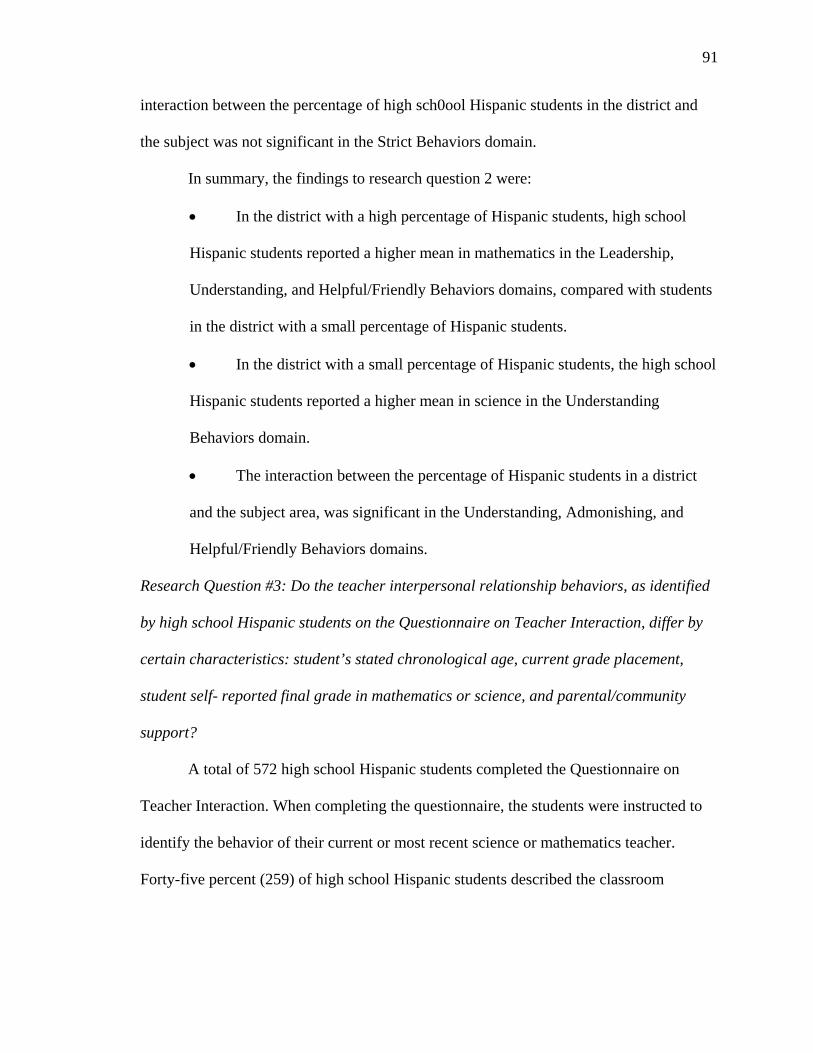
91
interaction between the percentage of high sch0ool Hispanic students in the district and
the subject was not significant in the Strict Behaviors domain.
In summary, the findings to research question 2 were:
• In the district with a high percentage of Hispanic students, high school
Hispanic students reported a higher mean in mathematics in the Leadership,
Understanding, and Helpful/Friendly Behaviors domains, compared with students
in the district with a small percentage of Hispanic students.
• In the district with a small percentage of Hispanic students, the high school
Hispanic students reported a higher mean in science in the Understanding
Behaviors domain.
• The interaction between the percentage of Hispanic students in a district
and the subject area, was significant in the Understanding, Admonishing, and
Helpful/Friendly Behaviors domains.
Research Question #3: Do the teacher interpersonal relationship behaviors, as identified
by high school Hispanic students on the Questionnaire on Teacher Interaction, differ by
certain characteristics: student’s stated chronological age, current grade placement,
student self- reported final grade in mathematics or science, and parental/community
support?
A total of 572 high school Hispanic students completed the Questionnaire on
Teacher Interaction. When completing the questionnaire, the students were instructed to
identify the behavior of their current or most recent science or mathematics teacher.
Forty-five percent (259) of high school Hispanic students described the classroom
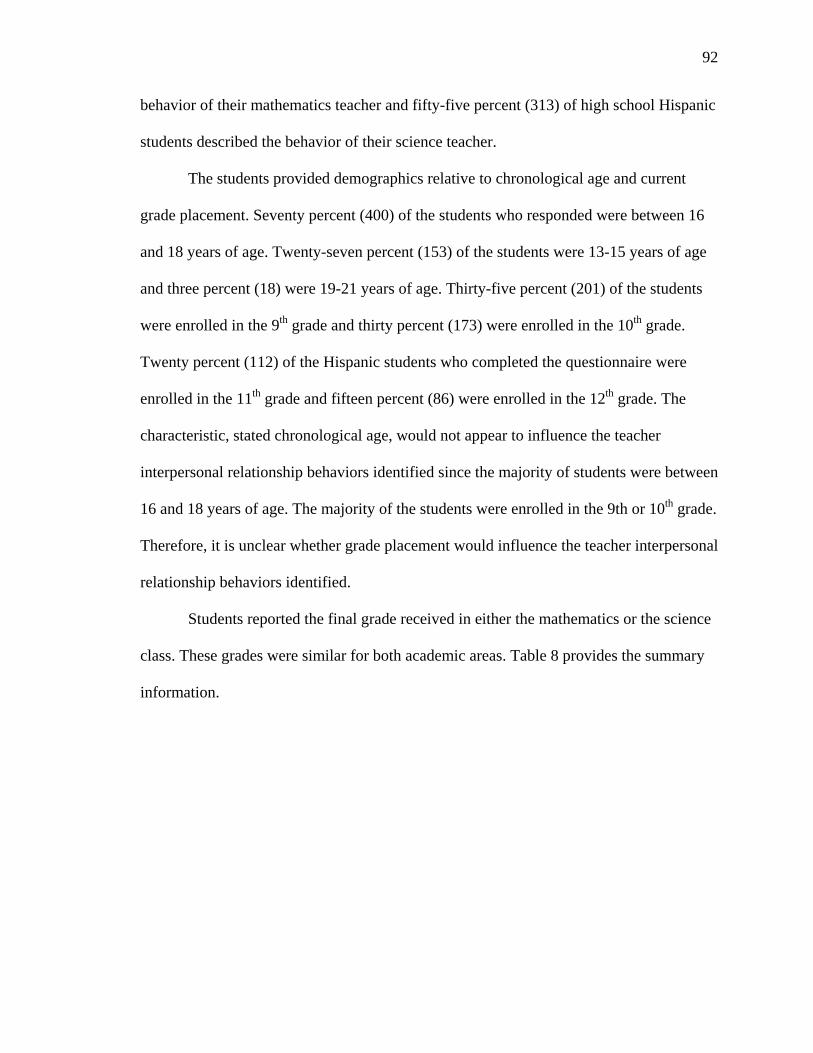
92
behavior of their mathematics teacher and fifty-five percent (313) of high school Hispanic
students described the behavior of their science teacher.
The students provided demographics relative to chronological age and current
grade placement. Seventy percent (400) of the students who responded were between 16
and 18 years of age. Twenty-seven percent (153) of the students were 13-15 years of age
and three percent (18) were 19-21 years of age. Thirty-five percent (201) of the students
were enrolled in the 9th grade and thirty percent (173) were enrolled in the 10th grade.
Twenty percent (112) of the Hispanic students who completed the questionnaire were
enrolled in the 11th grade and fifteen percent (86) were enrolled in the 12th grade. The
characteristic, stated chronological age, would not appear to influence the teacher
interpersonal relationship behaviors identified since the majority of students were between
16 and 18 years of age. The majority of the students were enrolled in the 9th or 10th grade.
Therefore, it is unclear whether grade placement would influence the teacher interpersonal
relationship behaviors identified.
Students reported the final grade received in either the mathematics or the science
class. These grades were similar for both academic areas. Table 8 provides the summary
information.
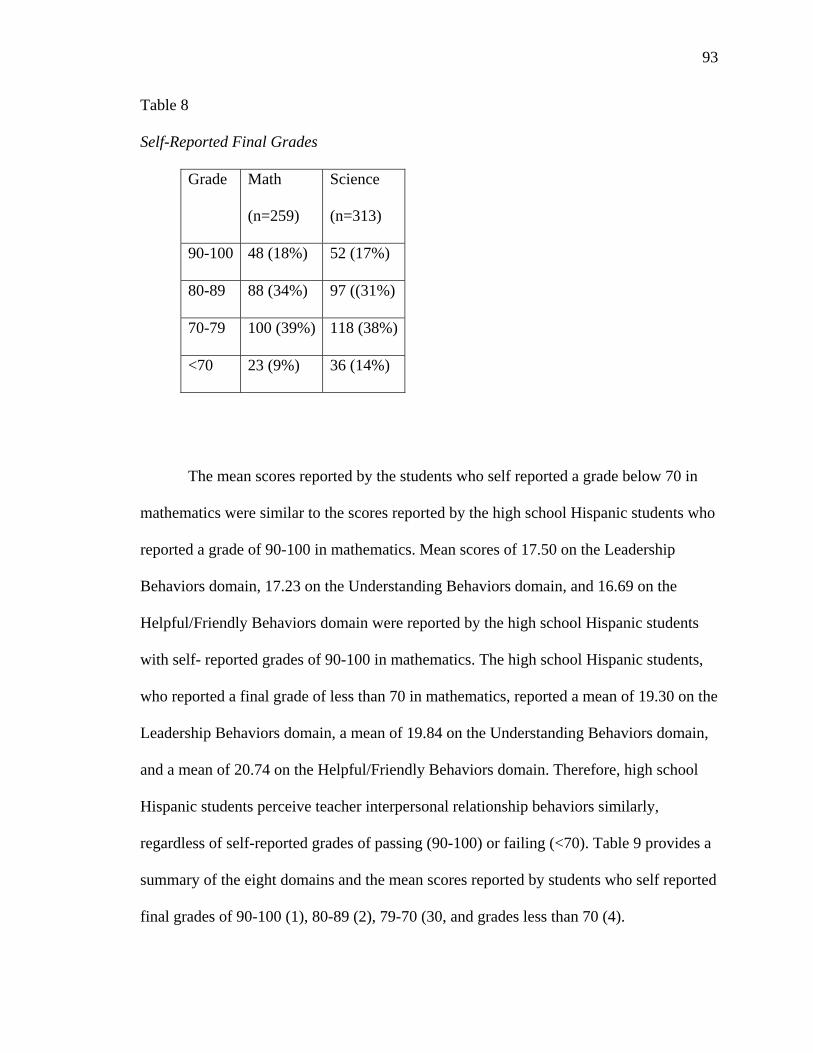
93
Table 8
Self-Reported Final Grades
Grade Math
(n=259)
Science
(n=313)
90-100 48 (18%) 52 (17%)
80-89 88 (34%) 97 ((31%)
70-79 100 (39%) 118 (38%)
<70 23 (9%) 36 (14%)
The mean scores reported by the students who self reported a grade below 70 in
mathematics were similar to the scores reported by the high school Hispanic students who
reported a grade of 90-100 in mathematics. Mean scores of 17.50 on the Leadership
Behaviors domain, 17.23 on the Understanding Behaviors domain, and 16.69 on the
Helpful/Friendly Behaviors domain were reported by the high school Hispanic students
with self- reported grades of 90-100 in mathematics. The high school Hispanic students,
who reported a final grade of less than 70 in mathematics, reported a mean of 19.30 on the
Leadership Behaviors domain, a mean of 19.84 on the Understanding Behaviors domain,
and a mean of 20.74 on the Helpful/Friendly Behaviors domain. Therefore, high school
Hispanic students perceive teacher interpersonal relationship behaviors similarly,
regardless of self-reported grades of passing (90-100) or failing (<70). Table 9 provides a
summary of the eight domains and the mean scores reported by students who self reported
final grades of 90-100 (1), 80-89 (2), 79-70 (30, and grades less than 70 (4).
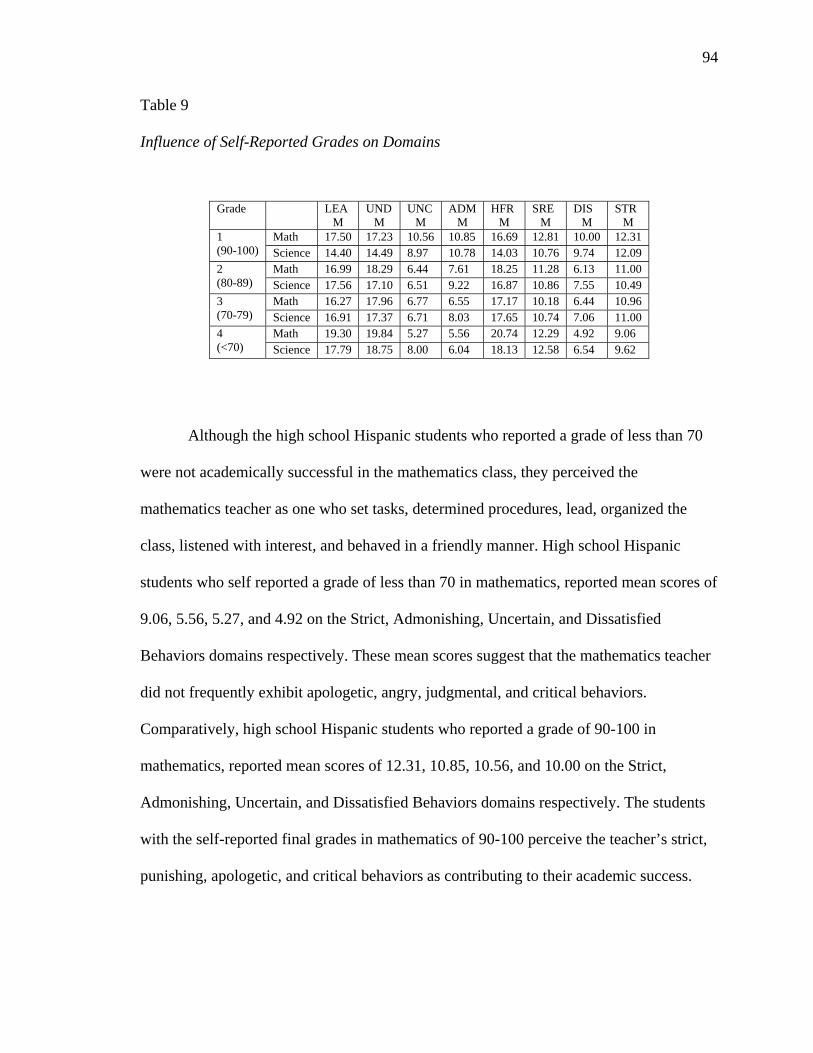
94
Table 9
Influence of Self-Reported Grades on Domains
Although the high school Hispanic students who reported a grade of less than 70
were not academically successful in the mathematics class, they perceived the
mathematics teacher as one who set tasks, determined procedures, lead, organized the
class, listened with interest, and behaved in a friendly manner. High school Hispanic
students who self reported a grade of less than 70 in mathematics, reported mean scores of
9.06, 5.56, 5.27, and 4.92 on the Strict, Admonishing, Uncertain, and Dissatisfied
Behaviors domains respectively. These mean scores suggest that the mathematics teacher
did not frequently exhibit apologetic, angry, judgmental, and critical behaviors.
Comparatively, high school Hispanic students who reported a grade of 90-100 in
mathematics, reported mean scores of 12.31, 10.85, 10.56, and 10.00 on the Strict,
Admonishing, Uncertain, and Dissatisfied Behaviors domains respectively. The students
with the self-reported final grades in mathematics of 90-100 perceive the teacher’s strict,
punishing, apologetic, and critical behaviors as contributing to their academic success.
Grade LEA M
UND M
UNC M
ADM M
HFR M
SRE M
DIS M
STR M
Math 17.50 17.23 10.56 10.85 16.69 12.81 10.00 12.31 1 (90-100) Science 14.40 14.49 8.97 10.78 14.03 10.76 9.74 12.09
Math 16.99 18.29 6.44 7.61 18.25 11.28 6.13 11.00 2 (80-89) Science 17.56 17.10 6.51 9.22 16.87 10.86 7.55 10.49
Math 16.27 17.96 6.77 6.55 17.17 10.18 6.44 10.96 3 (70-79) Science 16.91 17.37 6.71 8.03 17.65 10.74 7.06 11.00
Math 19.30 19.84 5.27 5.56 20.74 12.29 4.92 9.06 4 (<70) Science 17.79 18.75 8.00 6.04 18.13 12.58 6.54 9.62
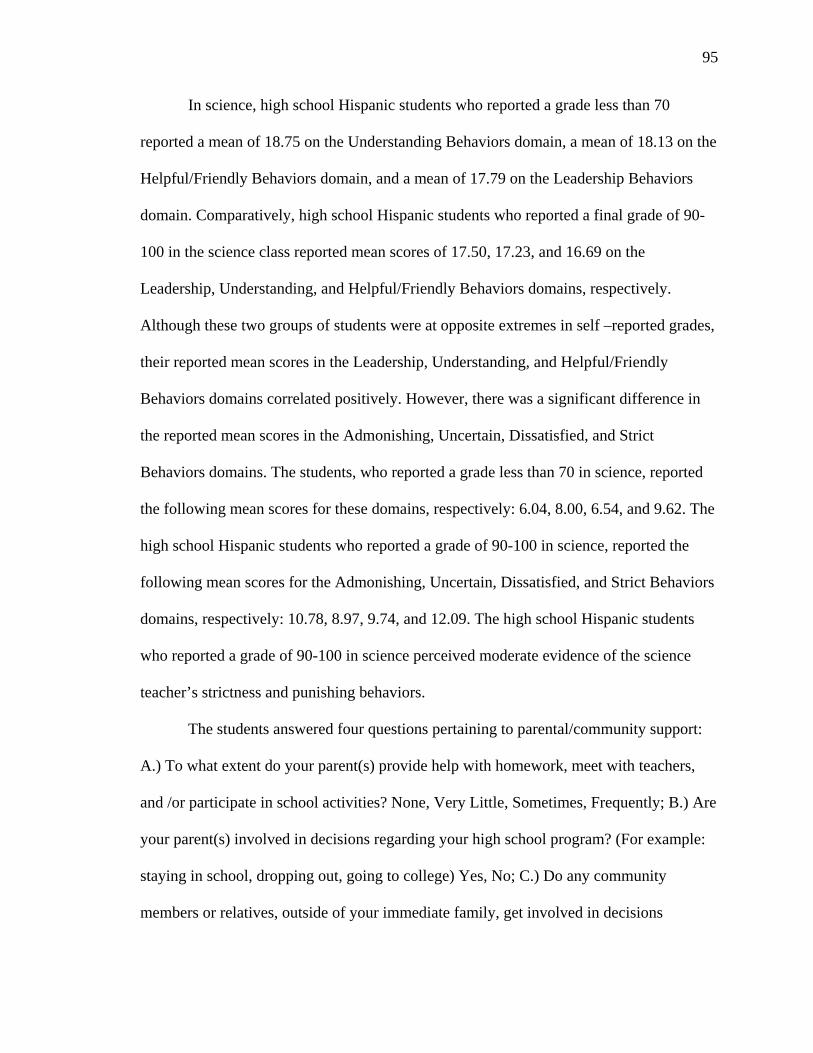
95
In science, high school Hispanic students who reported a grade less than 70
reported a mean of 18.75 on the Understanding Behaviors domain, a mean of 18.13 on the
Helpful/Friendly Behaviors domain, and a mean of 17.79 on the Leadership Behaviors
domain. Comparatively, high school Hispanic students who reported a final grade of 90-
100 in the science class reported mean scores of 17.50, 17.23, and 16.69 on the
Leadership, Understanding, and Helpful/Friendly Behaviors domains, respectively.
Although these two groups of students were at opposite extremes in self –reported grades,
their reported mean scores in the Leadership, Understanding, and Helpful/Friendly
Behaviors domains correlated positively. However, there was a significant difference in
the reported mean scores in the Admonishing, Uncertain, Dissatisfied, and Strict
Behaviors domains. The students, who reported a grade less than 70 in science, reported
the following mean scores for these domains, respectively: 6.04, 8.00, 6.54, and 9.62. The
high school Hispanic students who reported a grade of 90-100 in science, reported the
following mean scores for the Admonishing, Uncertain, Dissatisfied, and Strict Behaviors
domains, respectively: 10.78, 8.97, 9.74, and 12.09. The high school Hispanic students
who reported a grade of 90-100 in science perceived moderate evidence of the science
teacher’s strictness and punishing behaviors.
The students answered four questions pertaining to parental/community support:
A.) To what extent do your parent(s) provide help with homework, meet with teachers,
and /or participate in school activities? None, Very Little, Sometimes, Frequently; B.) Are
your parent(s) involved in decisions regarding your high school program? (For example:
staying in school, dropping out, going to college) Yes, No; C.) Do any community
members or relatives, outside of your immediate family, get involved in decisions
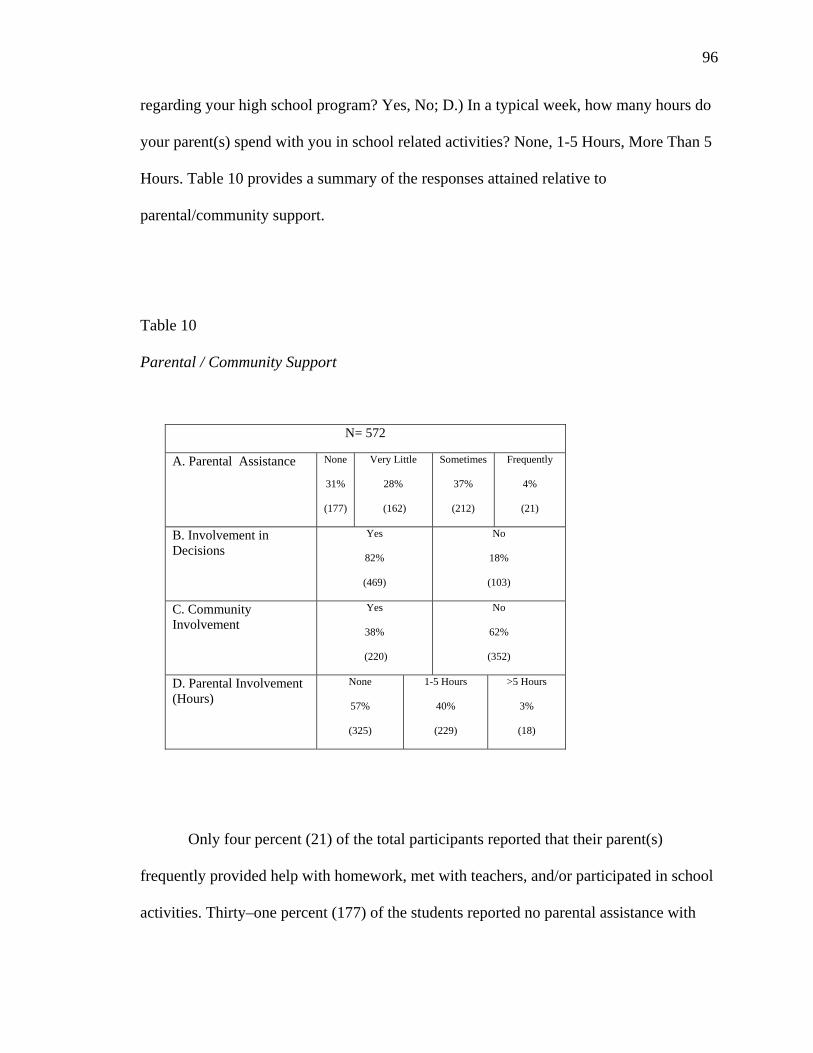
96
regarding your high school program? Yes, No; D.) In a typical week, how many hours do
your parent(s) spend with you in school related activities? None, 1-5 Hours, More Than 5
Hours. Table 10 provides a summary of the responses attained relative to
parental/community support.
Table 10
Parental / Community Support
Only four percent (21) of the total participants reported that their parent(s)
frequently provided help with homework, met with teachers, and/or participated in school
activities. Thirty–one percent (177) of the students reported no parental assistance with
N= 572
A. Parental Assistance None
31%
(177)
Very Little
28%
(162)
Sometimes
37%
(212)
Frequently
4%
(21)
B. Involvement in Decisions
Yes
82%
(469)
No
18%
(103)
C. Community Involvement
Yes
38%
(220)
No
62%
(352)
D. Parental Involvement (Hours)
None
57%
(325)
1-5 Hours
40%
(229)
>5 Hours
3%
(18)
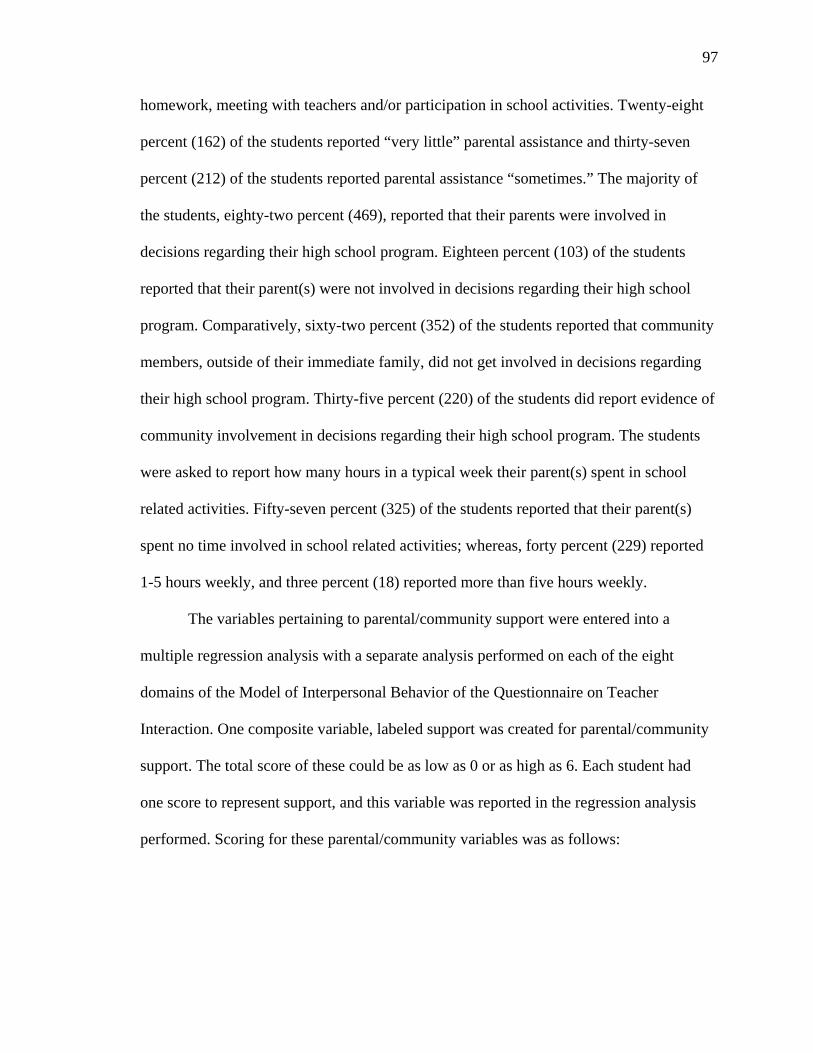
97
homework, meeting with teachers and/or participation in school activities. Twenty-eight
percent (162) of the students reported “very little” parental assistance and thirty-seven
percent (212) of the students reported parental assistance “sometimes.” The majority of
the students, eighty-two percent (469), reported that their parents were involved in
decisions regarding their high school program. Eighteen percent (103) of the students
reported that their parent(s) were not involved in decisions regarding their high school
program. Comparatively, sixty-two percent (352) of the students reported that community
members, outside of their immediate family, did not get involved in decisions regarding
their high school program. Thirty-five percent (220) of the students did report evidence of
community involvement in decisions regarding their high school program. The students
were asked to report how many hours in a typical week their parent(s) spent in school
related activities. Fifty-seven percent (325) of the students reported that their parent(s)
spent no time involved in school related activities; whereas, forty percent (229) reported
1-5 hours weekly, and three percent (18) reported more than five hours weekly.
The variables pertaining to parental/community support were entered into a
multiple regression analysis with a separate analysis performed on each of the eight
domains of the Model of Interpersonal Behavior of the Questionnaire on Teacher
Interaction. One composite variable, labeled support was created for parental/community
support. The total score of these could be as low as 0 or as high as 6. Each student had
one score to represent support, and this variable was reported in the regression analysis
performed. Scoring for these parental/community variables was as follows:
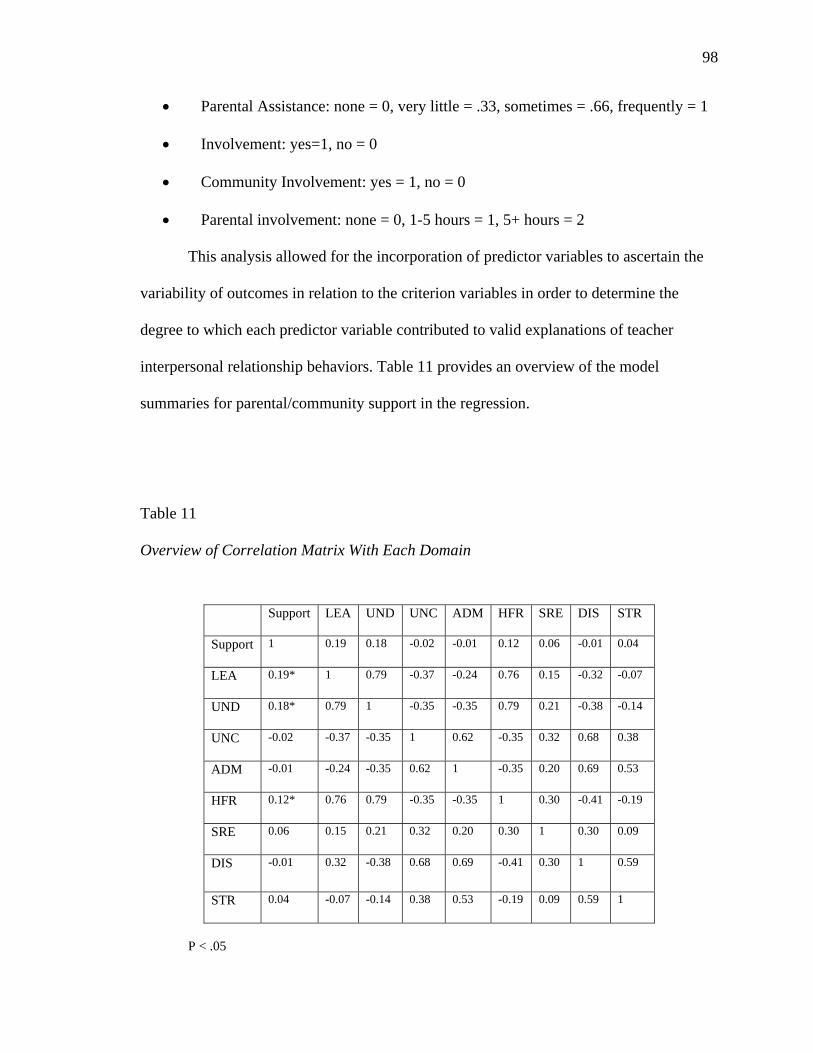
98
• Parental Assistance: none = 0, very little = .33, sometimes = .66, frequently = 1
• Involvement: yes=1, no = 0
• Community Involvement: yes = 1, no = 0
• Parental involvement: none = 0, 1-5 hours = 1, 5+ hours = 2
This analysis allowed for the incorporation of predictor variables to ascertain the
variability of outcomes in relation to the criterion variables in order to determine the
degree to which each predictor variable contributed to valid explanations of teacher
interpersonal relationship behaviors. Table 11 provides an overview of the model
summaries for parental/community support in the regression.
Table 11
Overview of Correlation Matrix With Each Domain
P < .05
Support LEA UND UNC ADM HFR SRE DIS STR
Support 1 0.19 0.18 -0.02 -0.01 0.12 0.06 -0.01 0.04
LEA 0.19* 1 0.79 -0.37 -0.24 0.76 0.15 -0.32 -0.07
UND 0.18* 0.79 1 -0.35 -0.35 0.79 0.21 -0.38 -0.14
UNC -0.02 -0.37 -0.35 1 0.62 -0.35 0.32 0.68 0.38
ADM -0.01 -0.24 -0.35 0.62 1 -0.35 0.20 0.69 0.53
HFR 0.12* 0.76 0.79 -0.35 -0.35 1 0.30 -0.41 -0.19
SRE 0.06 0.15 0.21 0.32 0.20 0.30 1 0.30 0.09
DIS -0.01 0.32 -0.38 0.68 0.69 -0.41 0.30 1 0.59
STR 0.04 -0.07 -0.14 0.38 0.53 -0.19 0.09 0.59 1

99
The researcher was able to build a regression model using the support variable to
make a prediction about each domain. The factors that contributed to the dependent
variable were held constant to attain the relationship between teacher interpersonal
relationship behaviors and parental/community support. With regression, the F ratio was
used as an overall level of significance of the model that was created and the F was
evaluated using the < .05 level of significance. Therefore, the researcher was 95% certain
that the significance did not occur by chance.
Using the support variable, only 10% of the variance in the Leadership Behaviors
domain was accounted for by four variables: current grade placement, student self-
reported final grade, parent involvement in school decisions, and the number of hours the
parent(s) spent with the student in school related activities. The four support variables
were combined into a set of predictors that were statistically significant and did have a
small to moderate influence on the Leadership domain rating. In the domain
Understanding Behaviors, 14% of the variance was accounted for by four predictor
variables: current grade placement, student self-reported final grade, parent involvement
in school decisions, and the number of hours the parent(s) spent with the student in school
related activities. The combination of the four variables was statistically significant. Three
predictors, current grade placement, student self-reported final grade, and parent
involvement in school decisions, accounted for only 6% of the variance in the Uncertain
Behaviors domain. Despite the small amount of variance accounted for, the three
variables were statistically significant. In the Admonishing Behaviors domain, 16% of the
variance was accounted for by three variables: current grade placement, student self-
reported final grade, and parental involvement in school decisions. The three variables

100
were statistically significant. Two variables, current grade placement, and self reported
final grade, accounted for 11% of the variance in the Helpful/Friendly Behaviors domain.
The variables did have an impact on the domain and were statistically significant.
In the domain Student Responsibility/Freedom Behaviors (SRE), the SPSS
program was unable to build a model that would significantly predict SRE scores. All
correlations were exceptionally low. Therefore, the Student Responsibility/Freedom
Behaviors domain does not appear to relate to the variables used to predict it. For the
domain, Dissatisfied Behaviors, the model summary indicates that 10% of the variance is
accounted for by three variables: current grade placement, student self-reported final
grade, and parental involvement in school decisions. The variables are statistically
significant. In the Strict Behaviors domain, three predictors account for 6% of the
variance: current grade placement, student self-reported final grade, and parental
assistance with homework, meeting with teachers, and/or participation in school activities.
The variables are statistically significant.
Significant correlations were reported between the variable, support, and the
Leadership Behaviors domain (0.19), between the variable, support, and the
Understanding Behaviors domain (0.18), and between the variable, support, and the
Helpful/Friendly domain (0.12). However, these correlations were very small. High
correlations were reported between the following domains: Understanding Behaviors and
Leadership Behaviors (0.79), Admonishing Behaviors and Uncertain Behaviors (0.62),
Helpful/Friendly Behaviors and Leadership Behaviors ((0.76), Helpful/Friendly
Behaviors and Understanding Behaviors (0.79), Dissatisfied Behaviors and Uncertain
Behaviors (0.68), and Dissatisfied Behaviors and Admonishing Behaviors (0.69).
101
In summary, the findings to research question 3 were:
• The researcher could not ascertain if the student’s stated chronological age
had an influence on the ratings pertaining to the teacher’s interpersonal
relationship behavior. Seventy percent (400) of the high school Hispanic students
who completed the Questionnaire on Teacher Interaction were reportedly between
16 and 18 years of age.
• The researcher could not ascertain if the student’s current grade placement
had an influence on the ratings pertaining to the teacher’s interpersonal
relationship behaviors. Sixty five percent (394) of the high school Hispanic
students who completed the Questionnaire on Teacher Interaction were enrolled in
either the 9th or 10th grade.
• High school Hispanic students perceived teacher interpersonal relationship
behaviors similarly, regardless of self-reported grades of passing (90-1000 or
failing (<70) in mathematics.
• High school Hispanic students who reported a grade of 90-100 in
mathematics, reported high means on the Strict, Admonishing, Uncertain, and
Dissatisfied Behaviors domains.
• High school Hispanic students who reported a grade less the 70 in science
reported higher means in the Leadership, Understanding, Helpful/Friendly
Behaviors domains than high school Hispanic students who reported a grade of 90-
100 in science.
• High school Hispanic students who reported a final grade of 90-100 in science,
reported higher means in the Admonishing, Strict, Uncertain, and Dissatisfied Behaviors
102
domains than high school Hispanic students who reported a grade of less than 70 in
science.
• Eighty-two percent (469) of the high school Hispanic students, who completed
the Questionnaire on Teacher interaction, reported that their parents were involved
in decisions regarding their high school program.
• Sixty-two percent (352) of the high school Hispanic students, who completed
the Questionnaire on Teacher Interaction, reported that community members,
outside of their immediate family, did not get involved in decisions regarding their
high school program.
• The students’ current grade placement, self reported final grade, and parental
support accounted for 14% of the variance in the Understanding Behaviors domain
and 16 % of the variance in the Admonishing behaviors domain.
Summary
The purpose of this study was to determine what teacher interpersonal relationship
behaviors are related to Hispanic student success in high school. Quantitative research
methods were used in this investigation. Five hundred seventy-two high school Hispanic
students completed the Questionnaire on Teacher Interaction. Specifically, 259 high
school Hispanic students identified the mathematic teachers’ interpersonal relationship
behaviors and 313 high school Hispanic students identified the science teachers’
interpersonal relationship behaviors.
The data were analyzed using descriptive statistics, analysis of variance, and
stepwise multiple regression analysis to determine patterns and trends. Significant
findings of the study were:
103
• High school Hispanic students ranked the teacher’s Leadership
Behaviors, Understanding Behaviors, and Helpful/Friendly
Behaviors with the highest means and Admonishing, Dissatisfied,
and Uncertain Behaviors with the lowest means.
• High school Hispanic students in a district with a large percentage
of Hispanic students reported a high mean in mathematics in the
Leadership, Understanding, and Helpful/Friendly Behaviors
domains.
• High school Hispanic students in the district with a small
percentage of Hispanic students reported a higher mean in science
in the Understanding Behaviors domain.
• Admonishing, Uncertain, and Dissatisfied Behavior domains were
reported with the lowest means in both science and mathematics by
both groups of high school Hispanic students.
• The student’s stated chronological age was not a relevant factor in
the responses obtained. The majority of the responses were
obtained from students 16-18 years of age.
• High school Hispanic students perceived teacher interpersonal
relationship behaviors similarly, regardless of a self-reported final
grade of passing (90-100) or failing (<70) in mathematics.
• High school Hispanic students who reported a final grade of 90-100
in mathematics, reported high means on the Strict, Admonishing,
Uncertain, and Dissatisfied Behaviors domains.

104
• High school Hispanic students who reported a final grade less than
70 in science reported higher means in the Leadership, Understanding,
Helpful/Friendly Behaviors domains than high school Hispanic students
who reported a grade of 90-100 in science.
• High school Hispanic students who reported a final grade of 90-100
in science, reported higher means in the Admonishing, Strict, Uncertain,
and Dissatisfied Behaviors domains than high school Hispanic students
who reported a final grade of less than 70 in science.
• The majority of the students reported that their parent(s) were
involved in decisions regarding their high school program.
• More than half of the students reported that their parent(s) did not
spend any time with them in school related activities. However, 40% of the
students reported that their parent(s) did spend 1-5 hours per week
involved in school related activities.
• More than half of the students reported that community members,
outside of their immediate family, did not get involved in decisions
regarding their high school program.
This chapter reviewed the purpose of the study, research questions, setting, and
findings. Conclusions, implications, and recommendations drawn from the data are
presented in the next chapter.
105
CHAPTER V
SUMMARY, CONCLUSIONS, RECOMMENDATIONS, AND IMPLICATIONS
Introduction
A significant percentage of Hispanic students are dropping out of high school.
Understanding why students drop out of school is a complex problem influenced by a
number of direct and indirect factors related to the individual, family, school, and
community that interact and influence the decision over a long period of time (Stanard,
2003). The academic success of many Hispanic students is affected by the nature of the
teacher-student relationship (Marshall, 2002). Hispanic students almost unanimously
identify “someone caring” as the most important factor in academic success (Duany &
Pittman, 1991, p.7).
Hispanic students may perceive their teachers as engaged in inadequate student–
teacher interaction. Many Hispanic students who have left school without a diploma, have
left because no one had established individual relationships with them, nor communicated
high academic expectations to them, nor provided them with meaningful opportunities to
achieve those expectations (Secada, et al., 1998). The teachers’ lack of interest/concern in
students can promote alienation. Subsequently, high school Hispanic students may lack
the motivation to succeed if they feel that the teachers do not expect them to succeed or
care about their success. Thus, teacher behaviors may negatively impact the student’s
achievement and success in high school. The focus of this study was to identify which
teacher interpersonal relationship behaviors, as identified by high school Hispanic
students on the Questionnaire on Teacher interaction, are related to Hispanic student
success in high school.
106
High school Hispanic students in two public school districts in Georgia completed
the Questionnaire on Teacher Interaction. A total of 572 students participated in the study.
The majority of the participants were reportedly 16-18 years of age. Focus groups were
also conducted with school personnel in both districts to address issues relevant to high
school Hispanic student success. One district, located in Northern Georgia, had a large
Hispanic student enrollment in the high school, whereas the other, located in Central
Georgia, had a comparatively smaller high school Hispanic student enrollment. This study
was designed to answer the following major research question: What are the teacher
interpersonal relationship behaviors related to Hispanic student success in high school?
Several sub questions guided the study:
• How do high school Hispanic students identify teacher interpersonal
relationship behaviors within the eight domains of the Model for Interpersonal
Behavior on the Questionnaire on Teacher Interaction?
• Which teacher interpersonal relationship behaviors, as identified by high
school Hispanic students on the Questionnaire on Teacher Interaction, vary by
setting and selected academic disciplines: mathematics and science?
• Do the teacher interpersonal relationship behaviors, as identified by high
school Hispanic students on the Questionnaire on Teacher Interaction, differ by
certain characteristics: student’s stated chronological age, current grade
placement, student self- reported final grade in mathematics/science, and
parental/community support?
On the Questionnaire on Teacher Interaction, high school Hispanic students
identified Leadership Behaviors, Understanding Behaviors, and Helpful/Friendly
107
Behaviors as most prevalent in the mathematics/science teachers who contributed to their
success. Students’ self-reported grades in math and science were higher in classrooms in
which students perceived greater leadership, helping/friendly, and understanding
behaviors in their teachers. The most prevalent behaviors were indicative of the teacher’s
organizational procedures within the classroom setting, the teacher’s demonstration of
empathy, interest, confidence, and openness, and the teacher’s considerate and friendly
manner that inspired confidence and trust on the students’ behalf. High school Hispanic
students identified Uncertainty Behaviors, Admonishing Behaviors, and Dissatisfaction
Behaviors as being least prevalent among teachers who contributed to their school
success. These behaviors were indicative of the teacher’s tendency to show
dissatisfaction, question, criticize, get angry, correct, and punish students, and the
teacher’s apologetic demeanor and tendency to keep a low profile.
The relationship among teacher interpersonal relationship behaviors and the
percentage of high school Hispanic students in a district was examined in relation to the
subject area (mathematics/science) reported. The interaction between the percentage of
high school Hispanic students in a district and the subject area (mathematics/science) was
significant in the Understanding, Admonishing, and Helpful/Friendly Behaviors domains.
The high school Hispanic students in the district with a small percentage of Hispanic
students rated their science teachers as exhibiting understanding and helpful/friendly
behaviors more frequently. These students also reported that their mathematics teachers
exhibited admonishing behaviors more frequently. The high school Hispanic students in
the district with a large percentage of Hispanic students reported that mathematics
teachers exhibited understanding and helpful/friendly behaviors more frequently. These

108
students also reported that science teachers exhibited admonishing behaviors more
frequently.
The majority of the participants reported that their parent(s) were involved in
decisions regarding their high school program and spent none/very little time with the
student in school related activities. Their parent(s) provided none or very little help with
homework. Community members, outside of the immediate family, did not get involved
in decisions regarding the students’ high school program.
Discussion
The graduation rate for Hispanic students is considerably below the norm. This
investigation of high school Hispanic students’ perceptions of their teachers’ interpersonal
relationship behaviors added information to the scholarly research and literature in the
field of high school Hispanic students’ academic success. The academic success of many
Hispanic students is affected by the nature of the teacher/student relationship (Marshall,
2002). Students learn to think of themselves as learners when they identify with school
and with their teachers. This means the development of strong and meaningful
relationships with their teachers (Nieto, 2000). Secondary school students evaluate their
teachers according to the teacher’s ability to develop personal relationships with pupils
(Kutnick & Jules, 1983). While instructional methodology is an important consideration,
exceptional teaching can be described in terms of teacher-student relationships (Wubbels,
Levy, & Brekelmans, 1997).
As schools become increasingly diverse in their scope, an examination of the
interaction of culturally sensitive factors of students’ learning environments with learning
processes is of critical importance (Fisher, Fraser, & Rickards, 1997). Many students
109
come from communities with widely differing cultural practices. The teaching and
learning strategies adopted in science and mathematics classrooms can be perceived as
being in conflict with the natural learning strategies of the learner. Some teachers can use
practices that may inadvertently conflict with students’ previous learning patterns, home
environments, and morals and values. The purpose of the study by Fisher, Fraser, &
Rickards (1997) was to determine associations between science and mathematics
students’ perceptions of their classroom learning environments. The subjects in the study
were 3,994 students from 182 secondary school science and mathematics classes in 35
coeducational schools in Western Australia and Tasmania. The students completed the
Questionnaire on Teacher Interaction, an attitude to class scale, and questions relating to
cultural background (Fisher, Fraser, & Rickards 1997). Furthermore, students from Asian
backgrounds had statistically high mean scores on the Questionnaire on Teacher
Interaction scales of Leadership, Helping/Friendly, Understanding, and Student
Responsibility/Freedom. The results of the investigation by Fisher, Fraser, & Rickards
(1997) correlated, in part, with this current study. The high school Hispanic students
(n=572) reported that teachers who contributed to their success exhibited more
Leadership, Helping/Friendly, and Understanding behaviors, and less Admonishing,
Dissatisfied, Uncertain, and Strict behaviors.
In the study by Fisher, Rickards, Goh, & Wong (1997), 720 students in Singapore,
and 705 students in Australia responded to the Questionnaire on Teacher Interaction
(QTI). It was reported that the QTI scales, Leadership, Helpful/Friendly, Understanding,
and Student Responsibility/Freedom were significantly and positively associated with the
attitude towards science classes in both countries. In this current investigation, there were
110
313 high school Hispanic students that described the behavior of their current or most
recent science teacher. Of these, 267 students were from a district with a large percentage
of Hispanic students and 46 were from a district with a much smaller percentage of high
school Hispanic students. The academic performance of the Hispanic students in the
district with a higher percentage of high school Hispanic students exceeds the reported
state of Georgia pass/pass plus percentage of 59% in science on the Georgia High School
Graduation Tests (GHSGT). Specifically, in 2005, 64% of 11th grade Hispanic students
who took the GHSGT, passed the science portion (GA Dept. of Education, 2005-2006). In
the district with the lower percentage of high school Hispanic students, 42% of the
Hispanic students who took the GHSGT passed the science portion. The performance of
the Hispanic students in the district with a lower percentage of high school Hispanic
students was below the reported 2005 pass/pass plus percentage (59%) for Hispanic
students in the State of Georgia.
The data suggested that the students’ responses on the Questionnaire on Teacher
Interaction (QTI) did not differ significantly in relation to the number of high school
Hispanic students in a district. On the QTI, high school Hispanic students reported
evidence of teacher interpersonal relationship behaviors in the scales measuring
Leadership Behaviors, Understanding Behaviors, and Helpful/Friendly Behaviors. Thus,
the behaviors identified as positively associated with student success were similar in both
studies. The findings in this current investigation are supportive of the research of Fisher,
Rickards, Goh, & Wong (1997).
In his research, Crosnoe (2005) examined four high school Hispanic student
profiles: 1.) low-achieving and weakly oriented, 2.) low-achieving and strongly oriented,
111
3.) high-achieving and moderately oriented, and 4.) high-achieving and strongly oriented.
The two dimensions of schooling, academic and social-psychological, were taken into
consideration in these profiles. Crosnoe (2005) reports that investigation of the two
dimensions, achievement and school orientation, provides the foundation needed to
improve the educational services available to Hispanic students. In conjunction with
understanding these dimensions, an understanding of the interpersonal behavioral
characteristics Hispanic students seek in their teachers was offered by this researcher’s
investigation. Positive teacher-student relationships are worthwhile process goals of
education.
A focus on educational resiliency leads to improvement in the education of
students at risk of academic failure. The use of the risk and resilience framework guided
this research in the social domain of academic success. High school Hispanic students’
perceptions of caring and support foster interactions leading to and sustaining pupil
resiliency. Through their responses on the Questionnaire on Teacher Interaction, the high
school Hispanic students in this study provided evidence that caring and supportive
teachers demonstrated understanding, concern, and encouragement. The students’
responses also suggested that caring and supportive teachers expected them to achieve and
succeed through participation in class and completion of assignments. High achievers
associate caring with assistance in academic matters and direct attention is not always
necessary; whereas, low achievers equate caring with certain personality traits (i.e.
patience, tolerance, listening) and prefer direct, personnel interaction (Phelan, Davidson,
& Hanh, 1992). In this investigation of high school Hispanic students’ perceptions, the
self-reported final grade in either mathematics or science accounted for statistically
112
significant variability in seven of the eight domains of the Model for Interpersonal
Teacher Behavior.
The forces that affect the social adjustment and academic performances of
minority students are not limited to the school and the classroom, they also include those
from the minority community (Ogbu, 1992). These community forces appear to be
somewhat different for different minorities and they interact differently with the societal
and school factors, producing different educational results. Some of the community forces
that Ogbu (1992) defines are the cultural and language frame of reference for judging
appropriate behavior and affirmation of group membership and solidarity. In addition, a
combination of cultural models of what it means to be a minority, and the actions
minorities use or do not use in their pursuit of formal education are significant community
forces. School, family, and community partnerships are designed to motivate, engage,
guide, and energize students to produce their own successes (Epstein, 1995). A majority
(62%) of the high school Hispanic students in this researcher’s investigation reported that
community members did not get involved in decisions regarding their high school
program. This variable did not contribute to the explanations of teacher interpersonal
relationship behaviors. Epstein (1995) reported that some students succeed in school
without much family/community support if the school has excellent academic and support
programs. However, parental involvement was reported by a majority of the high school
Hispanic students as evidenced in school decisions. Parent(s) were said to provide little
assistance with homework/school activities. Ginsburg’s & Hanson’s (1986) research
supports that family-involvement practices at home influence high school students’
academic achievement.
113
Schools are better able to fulfill their potential when they are armed with
information that enhances the understanding of diverse populations. School personnel
must connect to Hispanic students and their families and there must be a shared belief that
Hispanic students belong (Secada, et al., 1998). In this investigation, school personnel
conveyed their commitment to support the academic achievement of all students in the
focus group discussions. The principal’s involvement in framing, conveying, and
sustaining school goals represents an important domain of influence on student outcomes
(Cavazos, 1999). The experiences related were suggestive of instruction that went beyond
the classroom. Parental and community involvement was evidenced in language programs
and post-secondary options. Communities with a larger percentage of high school
Hispanic students appeared to promote a broader awareness of the contribution made by
Hispanics.
Conclusions
High school environments that support and foster positive learning experiences
have been investigated in educational research. Students have reported that they
appreciate a well-organized and orderly environment with a teacher who cares (Phelan, et
al., 1992). Research on learning environments, particularly teacher-student relationships,
suggests that these relationships promote improved student outcomes (Fraser & Walberg,
2005). Based on the findings in this study and the findings reported in previous literature,
the researcher concludes:
1. Teachers are perceived by high school Hispanic students as evidencing
Leadership Behaviors, Understanding Behaviors, and Helpful/Friendly
Behaviors, as measured on the Questionnaire on Teacher Interaction. These

114
reported behaviors provide evidence of the teachers’ ability to hold students’
attention, listen to students’ concerns, and assist students as needed. However,
high school Hispanic students recognize Admonishing and Strict Behaviors
favorably in relation to their success in school.
2. The interaction between the percentage of Hispanic students in a district
and the subject area (mathematics/science) was significant in the
Understanding Behaviors domain, the Admonishing Behaviors domain, and
the Helpful/Friendly Behaviors domain, as measured on the Questionnaire on
Teacher Interaction.
3. The majority of the high school Hispanic students reported that their
parent(s) were involved in decisions regarding their high school program and
that community members, outside of their immediate family, did not get
involved in decisions regarding their high school program.
Implications
The choices and decisions we make about Hispanic education in the U.S. today are choices we make about the future of the United States itself. We
know that the achievement levels can be raised. The question is whether we have the will to do what we know works. If we’re going to set high expectations
of students, we must have high expectations of ourselves to do what it takes to make sure all of our students can make the grade. – President William J.
Clinton, June 15, 2000.
Demographics provided by the Census Bureau direct attention to the current and
projected significant increase of Hispanics in the United States. The U.S. Census Bureau
estimates that by the year 2050, racial and ethnic minorities will account for forty-seven
115
percent of the nation’s population. The President’s Advisory Commission on Educational
Excellence for Hispanic Americans stated in their report (2003) that low societal
expectations for Hispanic youth, poor academic instruction in reading, and school
personnel who are poorly prepared to teach Hispanic students were issues contributing to
the dropout problem plaguing Hispanic students (President’s Advisory Commission on
Educational Excellence, 2003). Placing the blame for student failure primarily on students
and their families has freed schools of education from considering how their own
practices in teacher education have colluded to perpetuate academic failure for those
students who differ from the majority (Nieto, 2000). As the Hispanic population increases
throughout the nation, its impact will be apparent on most aspects of schooling including
teaching strategies/techniques and school/community relations (Marshall, 2002).
The findings of this study have an implication in teacher training. Improving
teacher training is cited as critical to improving the high school dropout rate (Stern, 2004).
Although it has been a stated goal in the United States that all individuals, regardless of
family background, should benefit from their education, many students have not (Nieto,
2000). Educators have divergent ideas and attitudes about minority students. Teacher
education must be multi/intercultural. Hispanics need to know that a pluralistic society
welcomes cultural differences, and they, as Hispanics, do not have to distance themselves
from their families and traditions and homogenize to be considered successful students.
Individuals who find themselves and their culture underrepresented in the school
curriculum cannot help but feel lost and resentful. Without a multicultural emphasis,
minority students feel like outsiders.
116
Culturally, Hispanic students come to school with a set of experiences, customs,
and values, which differ from those of others. Previous life experiences, family issues,
behavioral adjustment, academic performance and the second language acquisition
process are all important for educators to consider in evaluating the current status of
Hispanic students. Some Hispanic students may have been exposed to stressful or
traumatic life experiences at a very young age. They may have endured separation from
parents and siblings, frequent moves, poverty, hunger, dangerous exoduses from their
countries, and general uprooting. Others who are in the United States illegally live in fear
of the authorities. Some of these students may be in need of medical services, which may
not have been affordable or available in their country. Educationally, some of these
students may have a history of inconsistent schooling. Education may not be mandatory
or even available to them in their country. Students may have attended overcrowded
school with limited resources. The studies by Barr & Emans (1930), Charter & Waples
(1929), and Kratz (1894) (as cited in Smith, 1997) were said to develop an understanding
of personality traits and professional knowledge considered necessary for a person to be a
successful teacher. The characteristics of being a demanding, knowledgeable,
pedagogically sound teacher, while being supportive of the students’ emotional and social
need were repeated from the perspectives of the students, teacher, and administrator
(Smith, 1997).
Many educators may not be knowledgeable about the differences in diverse
populations. What American teachers may perceive as overindulgence and lack of
responsibility may be appropriate behavior for some Hispanic students. Behaviorally, an
educator may witness behaviors ranging from passivity to acting out. Hispanic students
117
may experience temporary adjustment problems because of the stresses and changes they
face in adapting to a new country, language, culture, school, and life situation. The results
of this study can be used as a basis for self-reflection by teachers on their teaching
performance. Teachers may decide to change the way they behave in an attempt to create
a more desirable classroom environment.
Administrators need specific skills and practices and staffs to create learning
environments that readily welcome Hispanic students. School leaders facilitate successful
practices, function as primary change agents, and may use their instructional leadership to
enhance the academic success of Hispanic students through teacher accountability for the
academic performance of all students. Accountability legislation charges schools with the
responsibility of ensuring success for all students. The school culture can support and
ensure educational excellence for all students. A nurturing school climate has the power to
overcome risk factors in the lives of students (Bernard, 1993). Through effective
instructional leadership, teachers can be empowered to develop and implement student
academic goals. The results of this investigation served as a basis for school leaders to
take note of the school climate and culture and encourage behaviors that support academic
success for all students. Educators cannot control demographics and family conditions,
but can change/enforce policies and practices to ensure that the needs of individuals at
risk of academic failure are addressed.
A school culture of oneness supports growth of all students. Schools can
incorporate resiliency- building factors and create programs around predictors of
academic success. Cultural competence is the necessary but not sufficient condition for
students and teachers to acknowledge and appreciate the values, experiences, and
118
contributions of all groups. A culturally responsive education and recognition of racism,
involve an acknowledgement of beliefs and attitudes. Once educators acknowledge the
nature of racism, they can explore the relationship between racism and issues of diversity
and equity in personnel policies and school administration.
The results of this investigation suggested that teachers who give students the
support necessary to attain the high expectations established promote students’ academic
success. The results of the questionnaire would appear to stimulate teachers to reflect on
their own teaching practices. School leaders who embrace diversity and respond to the
needs of every student contribute to the success of every student. For local school
systems, a more proactive approach to meet the needs of the growing Hispanic population
should be undertaken. Neither the size of the system nor the percentage of Hispanic
students enrolled should limit the opportunities offered. School systems with a smaller
percentage of Hispanic students would benefit from consulting with those systems with a
large percentage of successful Hispanic students to gain insight relative to the programs
contributing to school success.
Research on teacher- student interaction is not only of interest to educational
researchers, but also to policy makers who wish to improve student outcomes through
positive teacher-student interactions (Fraser & Walberg, 2005). For policymakers, the
results of this study provided an opportunity to insure that all school districts have
programs designed to meet the needs of Hispanic students. In addition, policymakers can
assess progress and tailor solutions oriented towards decreasing the Hispanic dropout rate.
However, forecasting future trends in Hispanic students’ education may be difficult due to
the continuing flow of immigrants, including many of low economic means and minimal
119
parental education. Professional development opportunities would enhance educators’
cultural competence and provoke thinking relative to diversity issues. The information
found in this study could be disseminated as a presentation at a conference/workshop or as
a submitted journal article.
Recommendations
The purpose of this study was to investigate the teacher interpersonal relationship
behaviors contributing to Hispanic student success in high school. The administration of
the questionnaire took little time and the instructions to the student participants were
clear. However, some students reported difficulties with understanding words such as
“lenient” or “sarcastic,” though no problems were encountered when these were explained
to participants.
With this purpose in mind and the results obtained from this study, the following
considerations for future research are offered:
1. Because data for this study were limited to high schools, an investigation of
elementary and/or middle school students should be undertaken. Performance on
the Criterion Referenced Competency Tests (CRCT) may be used as a barometer
of student achievement. Additional investigation may be undertaken in higher
education to explore if teacher interpersonal relationship behaviors contribute to
successful completion of post secondary education.
2. Because this study focused on self identified Hispanic individuals without
regard to their birthplace, time spent in the United States, and/or primary language
spoken, further investigation may be warranted to account for acculturation issues.
Specifically, to investigate whether the amount of time a Hispanic student has
120
lived in the United States, their birthplace, and/or primary language has an impact
on their perceptions of teacher interpersonal relationship behaviors.
3. Because this study did not account for teachers’ perceptions relative to their
interpersonal relationship behaviors, further investigation, comparing students’
perceptions of teachers and teachers’ self-perceptions, may provide evidence of the
culture within the classroom and provide additional information to the current
literature. In addition, the communal nature of the school can be considered. That
is, the proportion of Hispanic teachers and students in the school.
4. Because this study did not account for gender differences in students, further
research may address differences based on gender in Hispanic students’
perceptions of teacher interpersonal relationship behaviors. The gender of the
teacher being rated may also be taken into consideration.
121
REFERENCES
Adam, M. (2003). Fighting the Latino dropout rate. The Education Digest, 68(6), 23.
Aviles, R. M., Guerrero, M. P., Howarth, H. B., & Thomas, G. (1999). Perceptions of
Chicano/Latino students who have dropped out of school. Journal of Counseling
& Development, 77, 465-473.
Barr, A.S., & Emans, L.E. (1930). What qualities are prerequisites to success in teaching?
The Nation's School, 6(3), 60-64
Bernard, B. (1991). Fostering resiliency in kids: Protective factors in the family, school,
and community. Portland, OR. Western Regional Center for Drug-Free Schools
and Communities Northwest Educational Library.
Bernard, B. (1993). Fostering resiliency in kids. Educational Leadership,51(3), 44-48.
Bernard, B. (1995). Fostering Resilience in Children, ERIC/EECE Digest, EDO-PS-99.
Boman, P., & Yates, G. C. R. (2001). Optimism, hostility and adjustment in the first year
of high school. British Journal of Educational Psychology, 71(3), 401-411..
Brandt, R. (1989). On parents and schools: A conversation with Joyce Epstein.
Educational Leadership, 47(2), 24-27.
Brekelmans, M. (1989). Interpersonal teacher behavior in the classroom. Utrecht, The
Netherlands: W.C.C.
Brekelmans, M., Sleegers, P., & Fraser, B. (2000). Teaching for active learning. In P.R.J.
Simons, J.L. vanderLinden, & T. Duffy (Eds.), New Learning, (pp 227-242).
Dordrecht: Kluwer Academic Publishers.
Brekelmans, M., Wubbels, T., & Creton, H.A. (1990). A study of student perceptions of
physics teacher behavior. Journal of Research in Science Teaching, 27, 335-350.
122
Brekelmans, M., Levy, J., & Rodriquez, R. (1993). A typology of teacher communication
style. In T. Wubbels & J. Levy, (Eds.), Do you know what you look like? 46-55.
London: The Falmer Press.
Brown, J., Caston, M., & Bernard, B. (2001). Resilience Education. Thousand Oaks, CA:
Corwin Press, Inc.
Capps, R., Fix, M. E., Murray, J., Ost, J. P., Jeffrey S., & Herwantoro, S. (2005). The new
demography of America's schools: Immigration and the No Child Left Behind Act.
Harvard University: Urban Institute.
Cavazos, J. M., Ph. D. (1999). The instructional leadership of high school principals in
successful Hispanic majority high schools ( Doctoral dissertation, The University
of Texas at Austin, 1999). Dissertation Abstracts International. (UMI No.
9956807)
Conchas, G. Q. (2001). Structuring failure and success: Understanding the variability in
Latino school engagement. Harvard Educational Review, 71(3), 475-504.
Creswell, J.W. (2003). Research Design: Qualitative, Quantitative, and Mixed Methods
Approaches (2nd ed.). Thousand Oaks, CA: Sage Publications, Inc.
Cronbach, L.J. (1975). Beyond the two disciplines of scientific psychology. American
Psychologist, 38(2), 116-127.
Croninger, R. G., & Lee, V. E. ( 2001). Social capital and dropping out of high school:
Benefits to at-risk students of teachers' support and guidance. Teachers College
Record, 103(4), 548-581.
Crosnoe, R. (2005). The diverse experiences of Hispanic students in the American
educational system. Sociological Forum, 20(4), 561-588.
123
Crosnoe, R., & Needham, B. (2004). Holism, contextual variability, and the study of
friendships in adolescent development. Child Development, 74, 264-279.
Cullinford, C. (1995). The Effective Teacher. London & New York: Cassell.
denBrok, P. (2001). Teaching and student outcomes: A study on teachers' thoughts and
actions from an interpersonal and a learning activities perspective. Utrecht:
W.C.C.
denBrok, P., Brekelmans, M., & Wubbels, T., (2004). Interpersonal teacher behavior and
student outcomes. School Effectiveness and School Improvement, 15(3-4), 407-
442.
denBrok, P., Fisher, D., & Scott, R. (2005). The importance of teacher interpersonal
behavior for student attitudes in Brunei primary science classes. International
Journal of Science Education, 27(7), 765-779.
Deslandes, R., Royer, E., Turcotte, D., & Bertrand, R. (1997). School achievement at the
secondary level: Influence of parenting style and parent involvement in schooling.
McGill Journal of Education, 32(3), 191-207.
Dornbusch, S.M., & Ritter, P. (1988). Parents of high school students: A neglected
resource. Educational Horizons, 66(2), 75-77.
Doyle, W. (1986). Classroom organization and management. In M.C. Wittrock (Ed J,
Handbook of research on teaching (3rd ed.), 392-432. New York: Macmillan.
Duany, L., & Pittman, K. (1991). Latino youths at a crossroads. Education Digest,
56(5), 7-11.
Education Coordinating Council, Atlanta, GA. Available on the World Wide Web:
http://www.state.ga.us/ecc/
124
Epstein, J.L. (1995). School-family community partnerships: Caring for the children we
share. Phi Delta Kappan,76(9), 701-712.
Escoffery, L. A., Ph. D. (2004). Relationship among school characteristics, principal's
characteristics and leadership style, and achievement (Doctoral dissertation,
University of Miami, 2004). Dissertation Abstracts International. (UMI No.
3141911)
Fisher, D.L., Fraser, B.J., & Rickards, T.W., (1997). Gender and cultural differences in
teacher-student interpersonal behavior. Paper presented at the Annual Meeting of
the American Educational Research Association, Chicago, IL.
Fisher, D., Fraser, B., & Wubbels, T. (1993). Associations between school learning
environment and teacher interpersonal behavior in the classroom. In T. Wubbels
& J. Levy (Eds.), Do you know what you look like? (103-112). London: The
Folmer Press.
Fisher, D.L., Henderson, D., & Fraser, B.J. (1995). Interpersonal behavior in senior high
school biology classes. Research in Science Education, 25, 125-133.
Fisher, D.E., Rickards, T., Goh, S.C., & Wong, A. (1997). Perceptions of interpersonal
teacher behavior in secondary science classrooms in Singapore and Australia.
Journal of Applied Research in Education, 1(2), 2-13.
Fraser, B.J., & Walberg, H.J. (2005). Research on teacher-student relationships and
learning environments: Context, retrospect and prospect. International Journal of
Educational Research, 43(1&2), 103-109.
Fry, R. (2003). Hispanic youth dropping out of U.S. schools: Measuring the challenge.
Washington, D.C.: The Pew Hispanic Center.
125
Fusarelli, B., & Boyd, W. L.. (2004). Introduction: One nation indivisible? An overview
of the yearbook. Educational Policy, 18(1), 5-11.
Fusarelli, L. D., (2004). The Potential Impact of the No Child left Behind Act on Equity
and Diversity in American Education. Educational Policy, 18(1), 71-94.
Galbo, J.J. (1984). Adolescents' perceptions of significant adults: a review of the
literature. Adolescence, 19, 951-970.
Georgia Department of Education. (2005-2006). Atlanta, GA. Available on the World
Wide Web: http://www.doe.k12.ga.us
Georgia Public Education Report Card by the Georgia Department of Education. (2005,
2006). Retrieved August 16, 2006, from
http://techservices.doe.k12.ga.us/reportcard/
Ginsburg, A.L., & Hanson, S.L. (1986). Values and educational sources among
disadvantaged children. Washington, D.C.: U.S. Department of Education.
Goodenow, C., & Grady, K. (1993). The relationship of school belonging and friends'
values to academic motivation among urban adolescent students. The Journal of
Experimental Education, 62, 60-71.
Goldsmith, P.A. (2004). Schools' racial mix, students' optimism, and the black-white and
latino-white achievement gaps. Sociology of Education, 77, 121-147.
Hara, S.R. (1998). Parent involvement: The key to improved student achievement. School
Community Journal, 8(2), 9-19.
Hart, F.W. (1934). Teachers and teaching: By ten thousand high school seniors. New
York: Macmillan.
126
Hassinger, M., & Plourde, L. A. (2005). "Beating the odds": How bilingual Hispanic
youth work through adversity to become high achieving students. Education,
126(2), 316-327.
Hendry, L.B., Roberts, W., Glendinning, A., & Coleman, J.C. (1992). Adolescents'
perceptions of significant individuals in their lives. Journal of Adolescence, 15,
255-270.
Jacobsen, J. B., Ed.D. (2005). Teacher perceptions relating to fostering resilience in high
school students. (Doctoral dissertation, Baylor University, 2005). Dissertation
Abstracts International. (UMI No. 317579)
Jeynes, W.H. (2007). The relationship between parental involvement and urban secondary
school student academic achievement: A Meta-Analysis. Urban Education, 42(1),
82-109.
Koballa, T. R. (1988). Attitude and related concepts in science education. Science
Education, 72(2), 115-126.
Khine, M.S., & Fisher, D.L. (2004). Teacher interaction in psychosocial learning
environments: cultural differences and their implications in science instruction.
Research in Science & Technological Education, 22(1), 99-111.
Krovetz, M. (1999). Fostering resiliency: Expecting all students to use their minds and
hearts well. Thousand Oaks, CA: Corwin Press.
Kutnick, P. & Jules, V. (1993). Pupils' perceptions of good teacher: a developmental
perspective from Trinidad and Tobago. British Journal of Educational
Psychology, 63, 400-413.

127
Leary, T. (1957). An interpersonal diagnosis of personality. New York: Ronald-Press
Company.
Lee, V. E., & Burkam, D. T. ( 2003). Dropping out of high school: The role of school
organization and structure. American Educational Research Journal, 40(2), 353-
393.
Llagas, C., & Snyder, T. D. (2003). Status and trends in the education of Hispanics.
National Center for Education Statistics: U.S. Department of Education.
Levy, J., denBrok, P., Wubbels, T., & Brekelmans, M. (2003). Students' perceptions of
interpersonal aspects of the learning environment. Learning Environments
Research, 6(1), 5-36.
Levy, J., Wubbels, T., Brekelmans, M., & Morganfield, B. (1997). Language and cultural
factors in students' perceptions of teacher communication style. International
Journal of Intercultural Relations, 21(1), 29-56.
Lonner, W.J. (1980). The search for psychological universals. In H.C. Traindis, & W.W.
Lambert (Eds), Handbook of cross cultural psychology, 1, 143-204. Boston: Allyn
and Bacon.
Marshall, P. L. (2002). Cultural diversity in our schools. Belmont, CA:
Wadsworth/Thomson Learning.
Marshall, H.H., & Weinstein, R.S. (1986). Classroom context of student-perceived
differential teacher treatment. Journal of Educational Psychology, 78(6), 707-754.
Marzano, R.J. (2003). What works in schools: Translating research into action.
Alexandria: Association for Supervision and Curriculum Development.
Maslow, A. (1962). Toward a psychology of belonging. Princeton, N.J.: Van Nostrand.
128
Mayeroff, M. (1971). On Caring. New York: Harper Perennial.
McCubbin, H.I., & McCubbin, M.A. (1988). typologies of resilient families: emerging
roles of social class and ethnicity. Family Relations, 37, 247-254.
McMillan, J.H., & Reed, D.F. (1993). A qualitative study of resilient at risk students.
Paper presented on the 1993 annual meeting of the American Educational
Research Association, Atlanta, GA.
McMillan, J. H., & Reed, D. F. (1994). At-risk students and resiliency: Factors
contributing to academic success. Clearing House, 67(3), 137-141.
Mehring, J. (2004). Latinos' education gap. Business Week, (3894), 28.
Moskovitz, S. (1983). Love despite hate: child survivors of the Holocaust and their adult
lives. New York: Schocken.
Nieto, S. (2000). Affirming diversity: The sociopolitical context of multicultural
education(3rd ed.). New York: Longman.
Nieto, S. (2000). Placing equity front and center: Some thoughts on transforming teacher
education for a new century. Journal of Teacher Education, 51(3), 180-187.
Ogbu, J. U. (1992). Adaptation to minority status and impact on school success. Theory
Into Practice, 31(4), 287-295.
Olivas, M. (Ed.) (1986). Latino college students. New York: Columbia Teachers College.
Orfield, G. (Ed.). (2004). Dropouts in America: Confronting the graduation rate crisis.
Cambridge, MA: Harvard Education Press.
Orfield, G., Losen, D. J., Wald, J., & Swanson, C. (2004). Losing our future: How
minority youth are being left behind by the graduation rate crisis. Harvard
University: The Civil Rights Project.
129
Oswald, M., Johnson, B., & Howard , S. (2001). Quantifying and evaluating resilience-
promoting factors. Research in Education, 70, 50-64.
Paige, R. (2002). Strategic Plan 2002-2007. Washington, D.C.: U.S. Department of
Education.
Pehkonen, E. (Ed.). (1997). Proceeding of the conference of the international group for
the psychology of Mathematics education. Lahti, Finland. International Group for
the Psychology of Mathematics, 4.
Pence, A.R.(Ed.). (1998). Ecological Research with Children and Families: from
concepts to methodology. New York: Teachers' College Press.
Peng, S.D., Lee, R.M., Wang, M.C., & Walberg, H.J. (1992). Resilient students in urban
settings. Paper presented at the Annual Meeting of the American Educational
Research Association, San Francisco,CA.
Phelan, P., Davidson, A. L., & Hanh, T. C. (1992). Speaking up: Students' perspectives
on school. Phi Delta Kappan, 73(9), 695-704.
President's Advisory Commission on Educational Excellence for Hispanic Americans.
(2003). From risk to opportunity: Fulfilling the educational needs of Hispanic
Americans in the 21st century. Washington, DC: White House Initiative of
Educational Excellence for Hispanic Americans.
Purnell, R.F., & Gott, E.E. (1985). Preparation and role of school personnel for effective
school-family relations. Paper presented at the Annual Meeting of the American
Educational Research Association. Chicago, IL.
Ravid, R. (1994). Practical statistics for Educators. Landham, MD: University Press of
America, Inc.
130
Rawnsley, D., & Fisher, D.L. (1998). Learning environment in mathematics classrooms
and their associations with students' attitudes and learning. Paper presented at the
Australian Association for Research in Education Conference, Adelaide,
December.
Reyes, P., Scribner, J.D., & Scribner, A. P. (Eds.). (1999). Lessons from high-performing
Hispanic schools, creating learning communities. New York: Teachers College
Press.
Richardson, G. E. (2002). The metatheory of resilience and resiliency. Journal of Clinical
Psychology, 58(3), 307-321.
Rickards, T., & Fisher, D. (2000). A comparison of teacher and student perceptions of
classroom interactions: A catalyst for change. Paper presented at the Annual
meeting of the American Educational Research Association, New Orleans.
Romo, H. D., & Falbo, T. (1995). Latino High School Graduation: Defying The Odds (1st
ed.). Austin, Texas: University of Texas Press.
Rumberger, R. W. (2001). Who drops out of school and why. Paper prepared for the
National Research council, Committee on Educational Excellence and Testing
Equity Workshop, "School Completion in Standards-Based Reform: Facts and
Strategies".
Rutter, M. (1987). Psychological resilience and protective mechanisms. American
Journal of Orthopsychiatry, 57, 316-33.
Sanders, M.G., & Epstein, J.L. (1998). School-family community partnerships in middle
and high schools: From theory to practice. Baltimore, MD: Center for Research
131
on the Education of Students Placed At Risk. (ERIC Document Reproduction
Service No. ED 423 330)
Sangillo, G. (2002). Who’s Hispanic? National Journal, 35(23), 1699.
Secada, W. G., Chavez-Chavez, R., Garcia, E., Munoz, C., Oakes, J., Santiago_Santiago,
I., et al. (1998). No more excuses: The final report of the Hispanic Dropout
Project (ED 461 447, 88 pages). Washington, DC: Department of Education.
Sergiovanni, T. J. (1979). Rational, bureaucratic, collegial, and political views of the
principal's role. Theory Into Practice, 18(1), 12.
Sergiovanni, Thomas J. (1982). Ten Principles of Quality Leadership. Educational
Leadership, 39(5), 330.
Sheldon, S.B., & Epstein, J.L. (2005). Involvement counts: Family and community
partnerships and mathematics achievement. The Journal of Educational Research,
98(4), 196-206.
Shrigley, R.L. (1983). The attitude concept and science teaching. Science Education,
67(4), 425-442.
Smith, W.C., Jr. (1997). A review of the research into teaching styles/behaviors' impact
on students' cognitive outcomes and Bloom's taxonomy. Paper presented at the
Annual meeting of the Southwest Educational Research Association, Austin, TX.
Southern Region Education Board. (2006). Atlanta GA. Available on the World Wide
Web: http://www.sreb.org
SPSS, Inc, (2004). Statistical Analysis Package for the Social Scientist (Version 13.9)
[Computer Software]. Chicago, IL.
132
Stanard, R. P. (2003). High school graduation rates in the United States: Implcations for
the counseling profession. Journal of Counseling & Development, 81(2), 217-221.
Stanton-Salazar, R.D. (2001). Manufacturing hope and despair: The school and kin
support networks of U.S. Mexican youth. Vermont: Teachers College Press.
Stern, G. M. (Feb 2004). Hispanic students amBushed again. The Education Digest,
69(6), 47.
Strack, S. (1996). Interpersonal theory and the interpersonal circumplex: Timothy
Leary’s legacy. Journal of Personality Assessment, 66(2), 212-217.
Tatar, M. (1998). Teachers as significant others: gender differences in secondary school
pupils' perceptions. British Journal of Educational Psychology, 68, 217-227.
Tobin, K., & Fraser, B.J. (1998). Qualitative and quantitative landscapes of classroom
learning environments. In B.J. Fraser & K.G. Tobin (Eds.), International
handbook of science education (pp.623-640). Dordrecht, The Netherlands: Kluwer
Valdivieso, R., & Nicolau, S. (1992). Look me in the eye: A Hispanic cultural perspective
on school reform. Washington, D.C.: Office of Educational Research and
Improvement. (ERIC Document Reproduction Service No. ED 362342)
Valencia, R.R. (Ed.). (1991). Chicano school failure and success: Research and policy
agendas for the 1990s. London: The Folmer Press.
vanTartwijk, J., Brekelmans, M., Wubbels, T., Fisher, D.L., & Fraser, B.J. (1998).
Students' perceptions of teacher interpersonal style: The front of the classroom as
the teacher's stage. Teaching and Teacher Education, 14, 1-11.
133
Vermeer, H., Boekaerts, M., & Seegers, G. (1997). Gender differences in cognitive and
affective variables during two types of mathematics tasks. The Netherlands:
Centre for the Study of Education and Instruction. 262-269.
Wahome, T. J., Ed.D.(2003). Who cares? Student perceptions of factors that promote
resiliency in high school. (Doctoral dissertation, The University of North Carolina
at Chapel Hill, 2003). Dissertation Abstracts International. (UMI No. 3100230)
Wang, M. (1997). Next steps in inner city education: focusing on resilience, development
and learning success. Education and Urban Society, 29(3), 255-276.
Wang, M.C., Haertel, G., & Walberg, H. J. (1994). Educational resilience in inner cities,
in M.C. Wang and E.W. Gordon (eds), Educational Resilience in Inner Cities;
Challenges and prospects, Hillsdale, NJ: Erlbaum.
Wang, M.C., Haertel, G.D., & Walberg, H.J. (1998). Educational Resilience. U.S.
Department of Education Office of Educational Research and Improvement.
Publication Series No. 11.
Watzlawick, P., Beavin, J., & Jackson, D. (1967). The pragmatics of human
communication. New York: Norton.
Waxman, H. C., Gray, J. P., & Padron, Y. N. (2003). Review of Research on Educational
Resilience. University of California, Santa Cruz: Center for Research on
Education, Diversity & Excellence.
Waxman, H.C., & Huang, S.L. (1997). Classroom instruction and learning environment
differences between effective and ineffective urban elementary schools for
African American students. Urban Education, 32, 7-44.
134
Wayman, J.C. (2002). The utility of educational resilience for studying degree attainment
in school dropouts. The Journal of Educational Research, 95(3), 167-178.
Wehlage, G., & Rutter, R.A. (1986). Dropping out: How much do schools contribute to
the problem? Teachers College Record, 87(3), 70-73
Wehlage, G. G., Rutter, R. A., & Turnbaugh, A. (1987). A program model for at-risk high
school students. Educatiomal Leadership, 44(6), 70-73.
Werner, E., & Smith, R. (1988). Vulnerable but invincible: a longitudinal study of
resilient children and youth. New York: Adams Bannister & Cox.
Werner, E., & Smith, R. (1992). Overcoming the odds: high risk children from birth to
adulthood. Ithaca, NY: Cornell University Press.
Wubbels, T. (1993). Teacher-student relationships in mathematics and mathematics
classes. (What research says to the mathematics and mathematics teacher, No.
11). Perth: National Key Centre for School Mathematics, Curtin University of
Technology.
Wubbels, T., & Brekelmans, M. (2005). Two decades of research on teacher-student
relationships in class, Chapter 1. International Journal of Educational Research,
42 (1-2), 6-24.
Wubbels, T., Creton, H., & Holvast, A. (1988). Undesirable classroom situations.
Interchange, 19(2), 25-40.
Wubbels, T., Creton, H.A., & Hooymayers, H.P. (1985). Discipline problems of
beginning teachers, interactional teacher behavior mapped out. Paper presented
at Annual Meeting American Education Research Association, Chicago, IL.
135
Wubbels, T., & Levy, J. (Eds). (1993). Do you know what you look like?: Interpersonal
relationships in education. London: Folmer Press
Wubbels, T., Levy, J., & Brekelmans, M. (1997). Paying attention to relationships.
Educational Leadership, 54(7), 82.

136
APPENDICES

137
APPENDIX A
INSTITUTIONAL REVIEW BOARD APPROVAL LETTER
138
139
APPENDIX B
QUESTIONNAIRE ON TEACHER INTERACTION
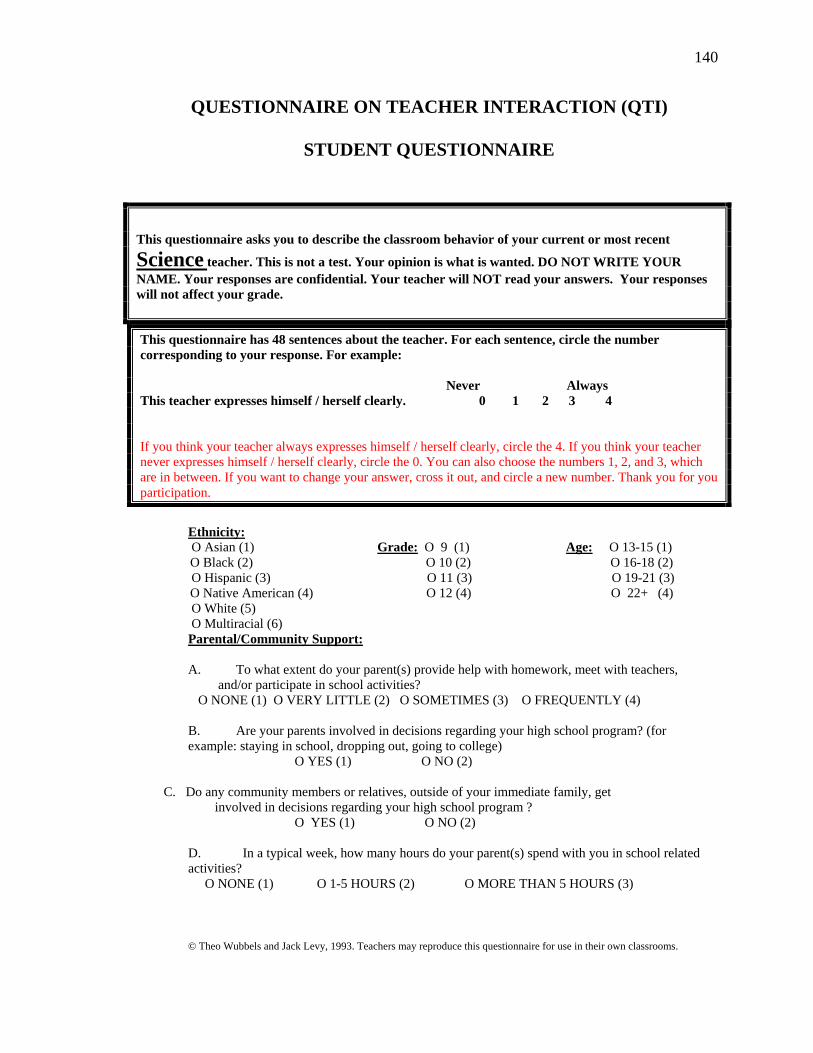
140
QUESTIONNAIRE ON TEACHER INTERACTION (QTI)
STUDENT QUESTIONNAIRE
This questionnaire asks you to describe the classroom behavior of your current or most recent
Science teacher. This is not a test. Your opinion is what is wanted. DO NOT WRITE YOUR NAME. Your responses are confidential. Your teacher will NOT read your answers. Your responses will not affect your grade.
This questionnaire has 48 sentences about the teacher. For each sentence, circle the number corresponding to your response. For example: Never Always This teacher expresses himself / herself clearly. 0 1 2 3 4 If you think your teacher always expresses himself / herself clearly, circle the 4. If you think your teacher never expresses himself / herself clearly, circle the 0. You can also choose the numbers 1, 2, and 3, which are in between. If you want to change your answer, cross it out, and circle a new number. Thank you for you participation.
Ethnicity: O Asian (1) Grade: O 9 (1) Age: O 13-15 (1)
O Black (2) O 10 (2) O 16-18 (2) O Hispanic (3) O 11 (3) O 19-21 (3)
O Native American (4) O 12 (4) O 22+ (4) O White (5) O Multiracial (6) Parental/Community Support: A. To what extent do your parent(s) provide help with homework, meet with teachers, and/or participate in school activities? O NONE (1) O VERY LITTLE (2) O SOMETIMES (3) O FREQUENTLY (4) B. Are your parents involved in decisions regarding your high school program? (for example: staying in school, dropping out, going to college) O YES (1) O NO (2)
C. Do any community members or relatives, outside of your immediate family, get involved in decisions regarding your high school program ? O YES (1) O NO (2) D. In a typical week, how many hours do your parent(s) spend with you in school related activities? O NONE (1) O 1-5 HOURS (2) O MORE THAN 5 HOURS (3) © Theo Wubbels and Jack Levy, 1993. Teachers may reproduce this questionnaire for use in their own classrooms.

141
Never Always
1. This teacher talks enthusiastically about her/his subject. 0 1 2 3 4 2. This teacher trusts us. 0 1 2 3 4 3. This teacher seems uncertain. 0 1 2 3 4 4. This teacher gets angry unexpectedly. 0 1 2 3 4
5. This teacher explains things clearly. 0 1 2 3 4 6. If we don't agree with this teacher, we can talk about it. 0 1 2 3 4 7. This teacher is hesitant. 0 1 2 3 4 8. This teacher gets angry quickly. 0 1 2 3 4 9. This teacher holds our attention. 0 1 2 3 4 10. This teacher is willing to explain things again. 0 1 2 3 4 11. This teacher acts as if she/he does not know what to do. 0 1 2 3 4 12. This teacher is too quick to correct us when we break a rule. 0 1 2 3 4 13. This teacher knows everything that goes on in the classroom 0 1 2 3 4 14. If we have something to say, this teacher will listen. 0 1 2 3 4 15. This teacher lets us boss her/him around. 0 1 2 3 4 16. This teacher is impatient. 0 1 2 3 4
17. This teacher is a good leader. 0 1 2 3 4 18. This teacher realizes when we don't understand. 0 1 2 3 4 19. This teacher is not sure what to do, when we fool around. 0 1 2 3 4 20. It is easy to pick a fight with this teacher. 0 1 2 3 4
21. This teacher acts confidently. 0 1 2 3 4 22. This teacher is patient. 0 1 2 3 4 23. It’s easy to make a fool out of this teacher. 0 1 2 3 4 24. This teacher is sarcastic. 0 1 2 3 4
25. This teacher helps us with our work. 0 1 2 3 4 26. We can decide some things in this teacher's class. 0 1 2 3 4 27. This teacher thinks that we cheat. 0 1 2 3 4 28. This teacher is strict. 0 1 2 3 4
29. This teacher is friendly. 0 1 2 3 4 30. We can influence this teacher. 0 1 2 3 4 31. This teacher thinks that we don't know anything. 0 1 2 3 4 32. We have to be silent in this teacher's class. 0 1 2 3 4 33. This teacher is someone we can depend on. 0 1 2 3 4 34. This teacher lets us fool around in class. 0 1 2 3 4 35. This teacher puts us down. 0 1 2 3 4 36. This teacher's tests are hard. 0 1 2 3 4 37. This teacher has a sense of humour. 0 1 2 3 4 38. This teacher lets us get away with a lot in class. 0 1 2 3 4 39. This teacher thinks that we can't do things well. 0 1 2 3 4 40. This teacher's standards are very high. 0 1 2 3 4
41. This teacher can take a joke. 0 1 2 3 4 42. This teacher gives us a lot of free time in class. 0 1 2 3 4 43. This teacher seems dissatisfied. 0 1 2 3 4 44. This teacher is severe when marking papers. 0 1 2 3 4
45. This teacher's class is pleasant. 0 1 2 3 4 46. This teacher is lenient 0 1 2 3 4 47. This teacher is suspicious. 0 1 2 3 4 48. We are afraid of this teacher. 0 1 2 3 4
***FINAL GRADE YOU RECEIVED IN THIS SCIENCE CLASS:_ 90-100 _ 80-89 _70-79 _ Less than 70

142
QUESTIONNAIRE ON TEACHER INTERACTION (QTI)
STUDENT QUESTIONNAIRE
This questionnaire asks you to describe the classroom behavior of your current or most
recent Mathematics teacher. This is not a test. Your opinion is what is wanted. DO NOT WRITE YOUR NAME. Your responses are confidential. Your teacher will NOT read your answers. Your responses will not affect your grade. This questionnaire has 48 sentences about the teacher. For each sentence, circle the number corresponding to your response. For example: Never Always This teacher expresses himself / herself clearly. 0 1 2 3 4 If you think your teacher always expresses himself / herself clearly, circle the 4. If you think your teacher never expresses himself / herself clearly, circle the 0. You can also choose the numbers 1, 2, and 3, which are in between. If you want to change your answer, cross it out, and circle a new number. Thank you for you participation.
Ethnicity: O Asian (1) Grade: O 9 (1) Age: O 13-15 (1) O Black (2) O 10 (2) O 16-18 (2) O Hispanic (3) O 11 (3) O 19-21 (3) O Native American (4) O 12 (4) O 22+ (4) O White (5) O Multiracial (6) Parental/Community Support:
A. To what extent do your parent(s) provide help with homework, meet with teachers, and/or participate in school activities? O NONE (1) O VERY LITTLE (2) O SOMETIMES(3) O FREQUENTLY (4)
B. Are your parents involved in decisions regarding your high school program? (for example: staying in school, dropping out, going to college)
O YES (1) O NO (2)
C. Do any community members or relatives, outside of your immediate family, get involved in decisions regarding your high school program ? O YES (1) O NO (2)
D. In a typical week, how many hours do your parent(s) spend with you in school related activities? O NONE (1) O 1-5 HOURS (2) O MORE THAN 5 HOURS (3) © Theo Wubbels and Jack Levy, 1993. Teachers may reproduce this questionnaire for use in their own classrooms.
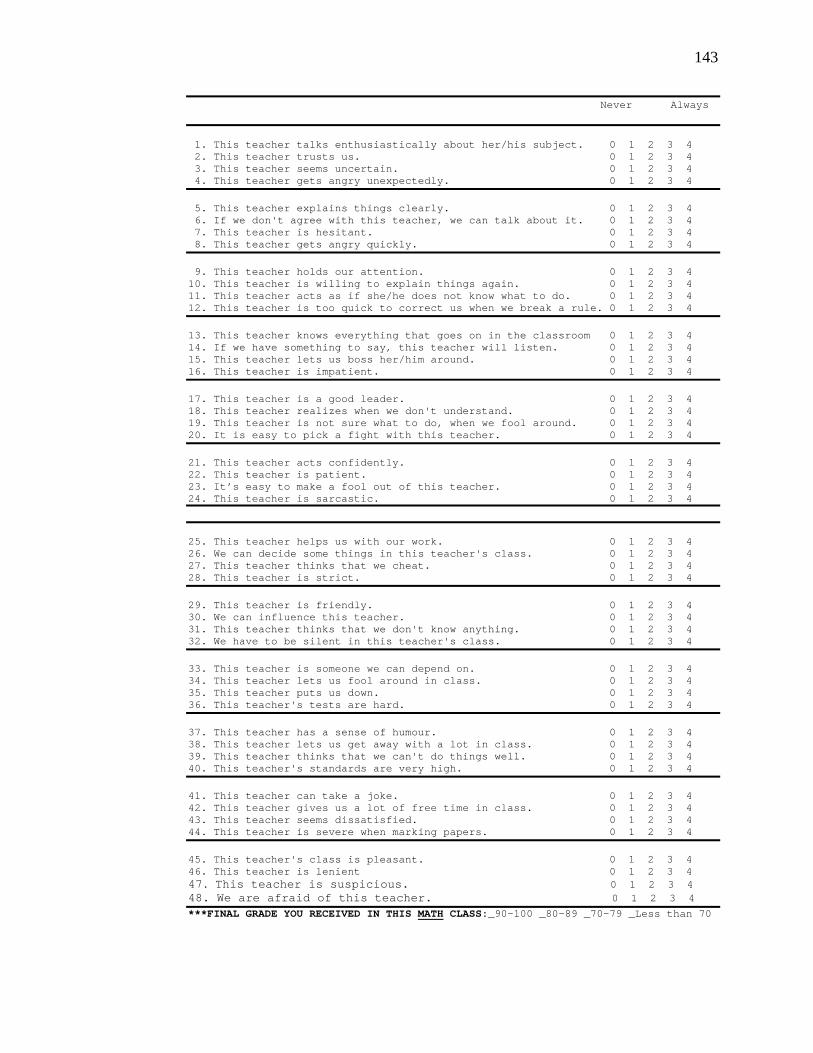
143
Never Always
1. This teacher talks enthusiastically about her/his subject. 0 1 2 3 4 2. This teacher trusts us. 0 1 2 3 4 3. This teacher seems uncertain. 0 1 2 3 4 4. This teacher gets angry unexpectedly. 0 1 2 3 4
5. This teacher explains things clearly. 0 1 2 3 4 6. If we don't agree with this teacher, we can talk about it. 0 1 2 3 4 7. This teacher is hesitant. 0 1 2 3 4 8. This teacher gets angry quickly. 0 1 2 3 4 9. This teacher holds our attention. 0 1 2 3 4 10. This teacher is willing to explain things again. 0 1 2 3 4 11. This teacher acts as if she/he does not know what to do. 0 1 2 3 4 12. This teacher is too quick to correct us when we break a rule. 0 1 2 3 4 13. This teacher knows everything that goes on in the classroom 0 1 2 3 4 14. If we have something to say, this teacher will listen. 0 1 2 3 4 15. This teacher lets us boss her/him around. 0 1 2 3 4 16. This teacher is impatient. 0 1 2 3 4
17. This teacher is a good leader. 0 1 2 3 4 18. This teacher realizes when we don't understand. 0 1 2 3 4 19. This teacher is not sure what to do, when we fool around. 0 1 2 3 4 20. It is easy to pick a fight with this teacher. 0 1 2 3 4
21. This teacher acts confidently. 0 1 2 3 4 22. This teacher is patient. 0 1 2 3 4 23. It’s easy to make a fool out of this teacher. 0 1 2 3 4 24. This teacher is sarcastic. 0 1 2 3 4
25. This teacher helps us with our work. 0 1 2 3 4 26. We can decide some things in this teacher's class. 0 1 2 3 4 27. This teacher thinks that we cheat. 0 1 2 3 4 28. This teacher is strict. 0 1 2 3 4
29. This teacher is friendly. 0 1 2 3 4 30. We can influence this teacher. 0 1 2 3 4 31. This teacher thinks that we don't know anything. 0 1 2 3 4 32. We have to be silent in this teacher's class. 0 1 2 3 4 33. This teacher is someone we can depend on. 0 1 2 3 4 34. This teacher lets us fool around in class. 0 1 2 3 4 35. This teacher puts us down. 0 1 2 3 4 36. This teacher's tests are hard. 0 1 2 3 4 37. This teacher has a sense of humour. 0 1 2 3 4 38. This teacher lets us get away with a lot in class. 0 1 2 3 4 39. This teacher thinks that we can't do things well. 0 1 2 3 4 40. This teacher's standards are very high. 0 1 2 3 4
41. This teacher can take a joke. 0 1 2 3 4 42. This teacher gives us a lot of free time in class. 0 1 2 3 4 43. This teacher seems dissatisfied. 0 1 2 3 4 44. This teacher is severe when marking papers. 0 1 2 3 4
45. This teacher's class is pleasant. 0 1 2 3 4 46. This teacher is lenient 0 1 2 3 4 47. This teacher is suspicious. 0 1 2 3 4 48. We are afraid of this teacher. 0 1 2 3 4 ***FINAL GRADE YOU RECEIVED IN THIS MATH CLASS:_90-100 _80-89 _70-79 _Less than 70

144
APPENDIX C
SCORING PROCEDURE FOR THE QUESTIONNAIRE ON TEACHER
INTERACTION
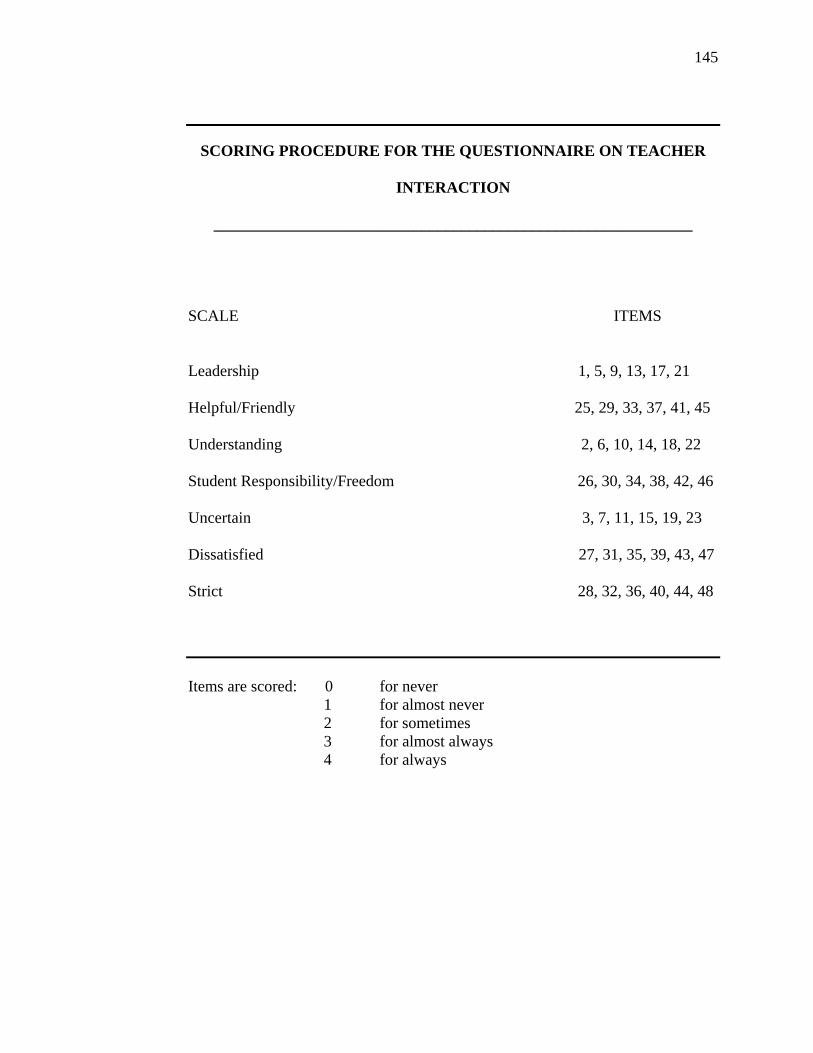
145
SCORING PROCEDURE FOR THE QUESTIONNAIRE ON TEACHER
INTERACTION
____________________________________________________________
SCALE ITEMS Leadership 1, 5, 9, 13, 17, 21 Helpful/Friendly 25, 29, 33, 37, 41, 45 Understanding 2, 6, 10, 14, 18, 22 Student Responsibility/Freedom 26, 30, 34, 38, 42, 46 Uncertain 3, 7, 11, 15, 19, 23 Dissatisfied 27, 31, 35, 39, 43, 47 Strict 28, 32, 36, 40, 44, 48 Items are scored: 0 for never 1 for almost never
2 for sometimes 3 for almost always 4 for always