i. gamma rays from novae - au purepure.au.dk/portal/files/56560778/kirsebom_msu13.pdf · i. gamma...
TRANSCRIPT

A talk in two parts:
I. Gamma rays from novae
and
II. New discoveries about the Hoyle state
Oliver KirsebomTRIUMF, Canada
MSU, 11 March 2013(JINA lunch-talk series)

Part I.
Gamma rays from novae

S1378
When and where
Nov 2012, TRIUMF
What
Lifetime Measurement of the 7.786 MeV State in 23Mg
Who
Charles Akers, Peter Bender, Alison Cheeseman, Greg Christian,
Randy Churchman, David Cross, Barry Davids, Lee Evitts, Jennifer Fallis,
Naomi Galinski, Adam Garnsworthy, Greg Hackman, Steffen Ketelhut,
Jonathan Lighthall, Oliver Kirsebom, Peter Machule, David Miller,
Chantal Nobs, Chris Pearson, Allison Radich, Mustafa Rajabali, Alex Rojas,
Alisher Sanetullaev, Carl Unsworth, Chris Ruiz, and Chris Wrede

Astrophysical motivation
Classical Nova
less evolved star
Hydrogen-rich material
White dwarf
M < 1.35 x solar
C-O
O-Ne-Mg
ejected shell
• 3-5 detected in the Galaxy every year (~30 occuring)
• peak luminosity = 104 x solar
• mass ejected = 10-4-10-5 x solar
• periodicity = 104-105 yr
• ejection speeds up to several 1,000 km/s

γ rays from novae (in the MeV range)
PoS(NIC XI)050
Classical novae ― theory and observations Jordi José
4
are discovered every year (mainly by amateur astronomers), a much higher nova rate, around 30
± 10 yr−1
(Shafter 2002), has been predicted by comparison with the number of events observed
in other galaxies. The reason for the scarcity of detections in our Galaxy is the extinction by
interstellar dust.
Classical novae occur in short period (1 – 12 hr), stellar binary systems consisting of a
white dwarf star and a low-mass main sequence (K-M dwarf) companion (although some
evidences of more evolved companions exist). Contrary to type Ia supernovae, in which the
white dwarf is fully disrupted by the violence of the explosion, all classical novae are expected
to recur, with periodicities of the order of 104–10
5 yr (notice, however, that in the thermonuclear
explosions that occur in very massive white dwarfs, the so called recurrent novae, the expected
periodicities range typically between 10 – 100 yr). Both novae and supernovae are characterized
by a remarkable energy output, with peak luminosities reaching 104 and 10
10 L⊙, respectively. A
basic difference between both explosive phenomena is the amount of mass ejected (the whole
star in a thermonuclear supernova versus 10−4
–10−5
M⊙ in a nova) as well as the mean ejection
velocity (> 104 km s
−1 in a supernova, and several 10
3 km s
−1 in a classical nova).
Fig. 1. The main nuclear activity, shown in terms of reaction fluxes (number of reactions per unit volume
and time), at Tpeak, for a nova model of 1.35 M⊙, with 50% ONe enrichment. The dominant nuclear
reaction flow proceeds close to the valley of stability and is dominated by (p,γ), (p,α), and β-decays. See
text for details.
H
He
Li
Be
B
C
0 1 2
3 4
5
6
7
8
9 10
11
N
O
F
Ne
Na
Mg
Al
Si
P
S
Cl
Ar
K
Ca
N
Z
12
13 14
15 16
17 18 2019
T = 1 x 10⁷ KT = 1 x 10T = 1 x 1077 KK
ModelModel 1.35 1.35 MM
(50% (50% ONeONe enrichmentenrichment))
(p,γ)
(p,α) (β+)
Log (Reaction Fluxes): -2: -3: -4
: -6: -5
: -7
T = 3.2×10⁸ K
ρ = 5.1×10² g cm-3
εnuc = 4.3×10¹⁶ erg g-1 s-1
ΔMenv = 5.4×10⁻⁶ M
Tpeak
Novae inγ-rays 5
Table 1. Radioactivities in nova ejecta.
Isotope Lifetime Main disintegration Type of emission Novatypeprocess
13N 862 s β+-decay 511 keV line and CO and ONecontinuum
18F 158 min β+-decay 511 keV line and CO and ONecontinuum
7Be 77 days e−-capture 478 keV line CO22Na 3.75 years β+-decay 1275 and 511 keV lines ONe26Al 106 years β+-decay 1809 and 511 keV lines ONe
that this nova could accelerate cosmic rays (Tatischeff & Hernanz 2007; Hernanz & Tatischeff2012), with the ensuing emission ofγ-rays with energies larger than 100 MeV coming mainlyfrom neutral pion,π0, production. Such emission from RS Oph would have been detected bythe Fermi satellite, but it was not in orbit yet in 2006. A morerecent object, V407 Cyg (anothernova occurring in a symbiotic binary with a red giant companion) has been detected by Fermi(Abdo et al. 2010), thus confirming our previous theoreticalpredictions for RS Oph.
3. Models
3.1 Emission from radioactivities in novae
The γ-ray signatures of classical novae mainly depend on their yields of radioactive nuclei.CO and ONe novae differ in their production of7Be and22Na, whereas they synthesize similaramounts of13N and18F. Therefore, CO novae should display line emission at 478 keV related to7Be decay, whereas for ONe novae line emission at 1275 keV related to22Na decay is expected.In both nova types, there should be as well line emission at 511 keV related to e−–e+ annihilation,and a continuum produced by Comptonized 511 keV emission andpositronium decay (see Table1).
The shape an intensity of theγ-ray output of novae, related to the radioactive decay of theunstable isotopes synthesized during the explosion, as well as its temporal evolution does notdepend only on the amount ofγ-ray photons produced, but also on how they propagate throughthe expanding envelope and ejecta (Leising & Clayton 1987; Gómez-Gomar et al. 1998). Severalinteraction processes affect the propagation of photons, i.e. Compton scattering, e−–e+ pairsproduction and photoelectric absorption.
The treatment of positron annihilation deserves particular attention. When a positron is emit-ted, it can either escape without interacting with the nova expanding envelope or annihilate withan ambient electron. It can be safely assumed that in nova envelopes positrons thermalize beforeannihilating. This approximation is wrong in less than 1% ofcases in an electronic plasma, ac-
J. Jose (2010)
M. Hernanz (2013)

“Observations” of the 1275 keV line from 22Na
Balloon-borneLeventhal et al. 1977
< 1.2× 10⁻⁶M
SMM/GRS1980–1989 (NASA)
< 1.5–31× 10−7M
CGRO/COMPTON1991–2000 (NASA)
< 3.7× 10⁻⁸M
INTEGRAL/SPI2002–2014(?) (ESA)
< 2.5–5.7× 10⁻⁷M
Jean et al. (2004)
Model prediction ≈ 4× 10⁻⁹M

Main destruction mechanism: 22Na(p,γ)23Mg
Two direct measurements both show that the reaction is dominatedby a resonance at 206 keV (Ex = 7786 keV, Jπ = 7/2+).
But, the resonance strengths differ by a factor of 3:
ωγ = 1.8± 0.7 meV Bochum [1]
ωγ = 5.7+1.6−0.9 meV Seattle [2]
[1] Stegmuller et al., NPA 601, 168 (1996)
[2] Sallaska et al., PRL 105, 152501 (2010); PRC 83, 034611 (2011)

Indirect determination of ωγ
22Na
23Mg
7786 keV
g.s.
7/2+
7/2+
3+ 7850 keV
p
γ(5734 keV)
2052 keV
451 keV 3/2+ 5/2+
γ(7335 keV)
Resonance-strength formula:
ωγ =2J + 1
(2Ja + 1)(2JA + 1)Bp(1− Bp)Γ
Bp and Γ = ~/τ determined in two recent experiments,
Bp = 0.037± 0.007 [3], τ = 10± 3 fs [4]
[3] Saastamoinen et al., PRC 83, 045808 (2011)
[4] Jenkins et al., PRL 92, 031101 (2004)

Experimental situation
ωγ = 1.8+0.7−0.7 meV direct (Bochum 1996)
ωγ = 5.7+1.6−0.9 meV direct (Seattle 2010)
ωγ = 1.4+0.5−0.4 meV indirect

Experimental setup at TRIUMF

Doppler-shift attenuation method (DSAM)
Principle:
γ
γ
τ = 1 fs – 10 ps
Previous experiment at TRIUMF (19Ne)Mythili et al., PRC 77, 035803 (2008)
LIFETIMES OF STATES IN 19Ne ABOVE THE . . . PHYSICAL REVIEW C 77, 035803 (2008)
60
50
40
30
20
10C
ount
s / 2
.5 k
eV
423042204210420041904180
γ Energy (keV)
(a)
80
70
60
50
40
30
20
Cou
nts
/ 2.5
keV
26202610260025902580
γ Energy (keV)
(b)
FIG. 6. (Color online) Doppler-shifted line shapes due to twotransitions of the 4035 keV level. The experimental data are shownalong with the calculated line shape and background that best fitthem. (a) Decay to the ground state with a lifetime of 7.1+1.9
−1.9 ± 0.6 fs.(b) Decay to the 1536 keV level with a lifetime of 6.6+2.4
−2.1 ± 0.7 fs.
Fig. 6(b); the lifetime is found to be 6.6+2.4−2.1 ± 0.7 fs, consistent
with that obtained from the main decay branch.
70
60
50
40
30
20
10
Cou
nts
/ 2.5
keV
30002900280027002600
γ Energy (keV)
4.03 → 1.54
4.14 → 1.51
FIG. 7. (Color online) γ rays detected in coincidence withα particles having kinetic energies between 11 and 14.5 MeV,showing the Doppler-shifted γ ray due to the transition of the4035 keV state to the 1536 keV state and that due to the thedeexcitation of the 4144 keV level to the 1508 keV state.
0.4
0.3
0.2
0.1
Join
t Lik
elih
ood
108642
Lifetime (fs)
FIG. 8. (Color online) Joint likelihood for the lifetime of the4035 keV state in 19Ne, taking into account the two transitions ofthe state observed in this experiment. The combined measurementsyield τ = 6.9+1.5
−1.5 ± 0.7 fs.
Using both transitions, the joint likelihood was computed,and the lifetime of the 4035 keV state was found to be 6.9+1.5
−1.5 ±0.7 fs. Figure 8 shows a plot of the joint likelihood for thelifetime of this state.
C. The (9/2)− state at 4144 keV
This state decays to the level at 1508 keV [10]. The γ rayof 2636 keV is Doppler-shifted to yield a line at 2748 keV.This is one of the lines of interest in the Eγ = 2500 to3000 keV region depicted in Fig. 7. Applying the appropriateα particle energy and timing gates, this line is well separatedfrom the other γ rays in the region. The lifetime of this levelwas determined to be 14.0+4.2
−4.0 ± 1.2 fs. Both the experimentaldata and the best fitting line shape calculation are shown inFig. 9.
D. The (7/2)− state at 4200 keV
This state is known to decay via two branches: an (80 ± 5)%branch to the level at 1508 keV and a (20 ± 5)% branch to thelevel at 238 keV [10]. The former transition results in a γ rayof 2693 keV, while the latter has a higher energy of 3962 keV.
The Doppler-shifted 2693 keV transition was identifiedaround 2810 keV, but interference from γ rays that wereseen with α particles of all energies contributed to a largebackground underneath and around the line. This large,irreducible background due to fusion evaporation residueslimited the precision of the measurement. The lifetime of thislevel was determined to be 38+20
−10 ± 2 fs, in agreement with theonly other measurement [11].
035803-5
τ = 7.1± 1.9± 0.6 fs

Experimental setup
3He +24Mg→ α + 23Mg∗
24Mg @ 75 MeV
3He≈0.1 μm
Au25 µm
ΔE100 µm
E500 µm
collimatorGRIFFIN
Ge detector
8oγ
α
18o
Energy available for excitation:
Erel + Q = 8.3 MeV + 4.0 MeV = 12.3 MeV
Clean γ-ray spectrum by gating on α particles.

Experimental setup

Some preliminary results

∆E -E plot
E (MeV)0 5 10 15 20 25 30 35 40
E (
Me
V)
δ
0
2
4
6
8
10
12
14
16
18
20
α+α
αp+
αHe3
p+dp+pdp

α-particle energy spectrum
E (MeV)δE+10 15 20 25 30 35 400
5000
10000
15000
20000
25000
30000
35000
40000
45000
1α
2α
3α

Known levels in 23Mg below 8 MeV
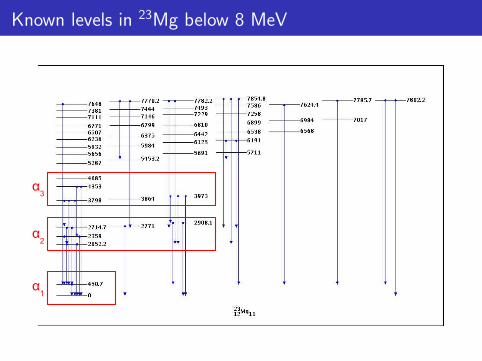
Known levels in 23Mg below 8 MeV
α1
α2
α3

Gate on α2
(keV)γE0 500 1000 1500 2000 2500 3000 3500
Ev
en
ts /
5 k
eV
10
210
310
< 33.8 MeVα
coincidences with 31.5 MeV < Eαγ
* Au coulex197
o Mg23
x Si (fusevap)28
c P (fusevap)31
*
o
511 k
eV
*
o
x o
oc
o
o
o
o
c
c
< 33.8 MeVα
coincidences with 31.5 MeV < Eαγ
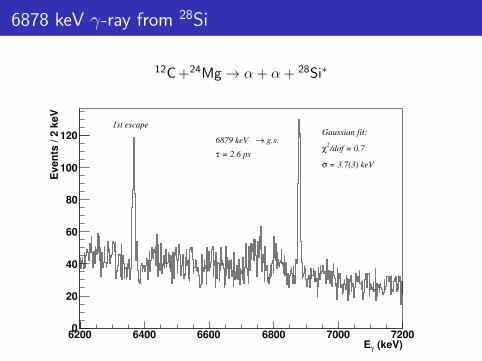
6878 keV γ-ray from 28Si
12C +24Mg→ α + α + 28Si∗
(keV)γE6200 6400 6600 6800 7000 7200
Even
ts / 2
keV
0
20
40
60
80
100
120 Gaussian fit:
/dof = 0.72
χ
= 3.7(3) keVσ
g.s.→6879 keV
= 2.6 psτ
1st escape

First check: 2052 keV level
Tabulated lifetime: τ = 79(20) fs
(keV)γE
1560 1580 1600 1620 1640 1660 1680 1700 1720 1740
Even
ts / 5
keV
0
50
100
150
200
250
451→2052 = 79 fsτ
= 99 fsτ

New result: τ(2908) ≈ 25 fs
(keV)γE3020 3040 3060 3080 3100 3120
Ev
en
ts /
3 k
eV
0
10
20
30
40
50
60
70
80
90
100 g.s.→2908
= 15 fsτ
= 25 fsτ
= 35 fsτ
(keV)γE2540 2560 2580 2600 2620 2640
Ev
en
ts /
3 k
eV
0
10
20
30
40
50
60
70
80
90
100 451→2908

γ-ray line of interest
(keV)γE5500 6000 6500 7000 7500 8000 8500 9000
Ev
en
ts /
10
ke
V
0
10
20
30
40
50
60
70
80
90
100
451→7786

γ-ray line of interest
(keV)γE7600 7650 7700 7750 7800 7850 7900
Ev
en
ts /
10
ke
V
0
5
10
15
20
25
30
35
40
45
= 1 fsτ
= 5 fsτ
= 10 fsτ

γ-ray line of interest
(keV)γE7600 7650 7700 7750 7800 7850 7900
Ev
en
ts /
10
ke
V
0
5
10
15
20
25
30
35
40
45
= 1 fsτ
= 5 fsτ
= 10 fsτ

Summary
Astronomers will soon(?) be able to detect the 1275 keV γ-ray line from22Na produced in novae
The two direct determinations of the 22Na(p, γ) rate disagree, leading toa factor of ∼ 2 uncertainty in the predicted 22Na yield
A new measurement of the lifetime of the 7786 keV level in 23Mg isrequired to establish confidence in the indirect determination of the rate
Lifetime can be determined using the DSAM method; attempt made atTRIUMF in November 2012.
Preliminary result: γ line of interest observed, but statistics are notoverwhelming
Data analysis in progress; line shape is still not fully understood

Part II.
New discoveries about the Hoyle state

The Hoyle state and the triple-α reaction
α0+
0+
α
4He 8Be 12C
0+
γ, e+e‐
92 keV
288 keV
Hydrosta)c helium burning in red giant stars
T = 0.1‐2 GKkT = 10‐200 keV
F. Hoyle1953

Primary astrophysical significance
The triple-α reaction is . . .
the mechanism by which the first generation of stars, created from thehydrogen and helium ashes of the Big Bang, were able to bridge theA = 5 and A = 8 mass gaps, thus allowing nucleosynthesis to proceed.
the main mechanism behind stellar synthesis of carbon, essential to lifeas we know it on earth.

The Hoyle state and the triple-α reaction
α0+
0+
α
4He 8Be 12C
0+
γ, e+e‐
92 keV
288 keV
Hydrosta)c helium burning in red giant stars
T = 0.1‐2 GKkT = 10‐200 keV
F. Hoyle1953

Temperature regimes of the triple-α reaction
equilibrium and helium burns at temperatures between 0.1 GK and 2 GK (1 GK = 109 K).The triple-α reaction and the 12C(α, γ) reaction operate side by side, and their relative ratesdetermine the relative abundances of carbon and oxygen created. The triple-α reaction proceedsas a two-step process, strongly enhanced by two low-lying s-wave (` = 0) resonances,
α+ α→ 8Be(gs) , α+ 8Be(gs)→ 12C(Hoyle) , (1)
the first being due to the ground state in 8Be and the second being due to the Hoyle state in12C.
Furthermore, the triple-α reaction plays an important catalytic role in various explosive stellarprocesses in which the peak temperature exceeds 2 GK. Examples are given in Table 1. At suchelevated temperatures, higher-lying resonances begin to contribute, and the triple-α reaction isno longer completely dominated by the low-lying s-wave resonances.
At temperatures somewhat below 0.1 GK, the thermal energy is too small for the triple-αreaction to proceed sequentially via the s-wave resonances; instead the reaction proceeds directlyby some three-body mechanism. The rate of the triple-α reaction below 0.1 GK is importantfor the evolution of the first generation of stars. Since they were created from the hydrogenand helium ashes of the Big Bang, they lacked the carbon necessary for the CNO-I cycle tooperate, which therefore had to be produced by the triple-α reaction, but at the relatively lowtemperature sustained by the pp chain [2].
Table 1 gives an overview of the three temperature domains of the triple-α reaction, includingthe most important astrophysical sites.
Table 1. Temperature domains of the triple-α reaction.
T (GK) Burning Reaction mechanism Astrophysical sites
0.1–2 hydrostatic s-wave resonances– helium core burning in HB stars– helium shell burning in AGB stars
< 0.1 hydrostatic direct three-body – first-generation stars
> 2 explosive higher-lying resonances– shock fronts of core-collapse supernovae– X-ray bursts– helium flashes during AGB phase
3. Determination of the reaction rateIn the intermediate-temperature domain (0.1–2 GK) the rate of the triple-α reaction isfully determined by the properties of the Hoyle state, which can be measured in laboratoryexperiments. Precisely for this reason the rate is known relatively well, even though it cannotbe directly measured. Currently, the rate is known with 10% precision, but efforts are underwayto reduce this to 5% [3]. The determination of the reaction rate is far more complicated inthe low- and high-temperature domains. In the high-temperature domain (> 2 GK) the ratedepends on the properties of not one, but several states in 12C, which are not well established.This is especially true for the possible 2+ state around 9.6 MeV [4, 5, 6, 7, 8]; see also thecontributions of M. Itoh and M. Gai. In the low-temperature domain (< 0.1 GK) sophisticatedthree-body models are necessary to calculate the rate [9].

Reaction-rate formula
R ∝ Γα0Γrad
ΓT−3/2 exp
(− Q
kT
)
Q = 92 keV + 288 keV = 380 keV
Γα0 = partial width for α decay to the ground state of 8BeΓrad = radiative widthΓ = total width = Γα + Γrad ≈ Γα (Γrad/Γ = 4× 10⁻⁴)
Γα0Γrad
Γ≈ Γα0Γrad
Γα
= Γrad
An often overlooked assumption: Γα = Γα0

Reaction-rate formula
R ∝ Γα0Γrad
ΓT−3/2 exp
(− Q
kT
)
Q = 92 keV + 288 keV = 380 keV
Γα0 = partial width for α decay to the ground state of 8BeΓrad = radiative widthΓ = total width = Γα + Γrad ≈ Γα (Γrad/Γ = 4× 10⁻⁴)
Γα0Γrad
Γ≈ Γα0Γrad
Γα= Γrad
An often overlooked assumption: Γα = Γα0

Uncertainty
Radiative width
Γrad = Γγ + Γπ =Γγ + Γπ
Γ
Γ
ΓπΓπ
Error budget
Q = 379.38± 0.20 keV (1.2%) [1](Γγ + Γπ)/Γ = (4.12± 0.11)× 10−4 (2.7%) [2]
Γπ/Γ = (6.8± 0.7)× 10−6 (10%) [3]Γπ = 62.3± 2.0 µeV (3.2%) [4]
Experiments underway to reduce ∆(Γπ/Γ) to 5%
[1] Nolen and Austin, PRC 13 (1976) 1773[2] Markham, Austin and Shahabuddin, NPA 270 (1976) 489[3] Alburger, PRC 16 (1977) 2394[4] Chernykh et al., PRL 105 (2010) 022501

Direct breakup?
Sequential and direct breakup widths:
Γα = Γα0 + Γ3α
Upper limit due to Freer et al. (1996):
Γ3α/Γα < 0.04
Non-zero value due to Raduta et al. (2011):
Γ3α/Γα = 0.17(5)

Direct breakup?
Sequential and direct breakup widths:
Γα = Γα0 + Γ3α
Upper limit due to Freer et al. (1996):
Γ3α/Γα < 0.04
Non-zero value due to Raduta et al. (2011):
Γ3α/Γα = 0.17(5)

Direct breakup?
Sequential and direct breakup widths:
Γα = Γα0 + Γ3α
Upper limit due to Freer et al. (1996):
Γ3α/Γα < 0.04
Non-zero value due to Raduta et al. (2011):
Γ3α/Γα = 0.17(5)

Direct breakup?
SD = Sequential decay via the ground state of 8BeDDE = Three α particle with equal energiesDDL = One α particle at rest and the other two with equal energiesBG = Background (≈ 40%) Ad.R. Raduta et al. / Physics Letters B 705 (2011) 65–70 69
Fig. 5. (Color online.) RMS spectra of experimental (solid points) and best χ2 simu-lated events (solid line) in the region 90 〈Eα〉 150 keV. Experimental error barsare statistical. Dashed and dotted histograms illustrate simulation results if only se-quential decay (60%) and, respectively, sequential decay (55.5%) + DDE (4.5%) areconsidered. In all cases, background (BG) events amount to 40%.
menta and, eventually, obey the postulated particularities of thedecay. No preferential orientation between emitted particle veloc-ities and source boost exists. The obtained reaction products areassumed to freely propagate toward the detector. Once the detec-tor is reached, the events are filtered: if one or more particles hita dead detector area or a detector which is out of work, the eventis suppressed. If all particles have been detected, the velocity vec-tors are altered such as to account for finite angular and energyresolution. The simulated events are then analyzed as the exper-imental ones. The obtained detection efficiencies vary from 41 to49% depending on the decay type. A comparison of filtered andnormalized DDE (full), SD (dashed) and DDL (dot-dashed) simula-tions is depicted with thin lines in Fig. 4 as a function of 〈Eα〉 (a)and RMS (c). Very little sensitivity on the decay mechanism ofYcorr(〈Eα〉) is observed, which is due to the angular resolution ofthe detection modules. By contrast, the kinetic energy dispersion(RMS) in the emitter CM manifests measurable sensitivity to thedecay mechanism. For the CHIMERA granularity and a perfect en-ergy resolution Ycorr(RMS) are peaked at 10, 70 and 90 keV forDDE, SD and, respectively, DDL while for an average resolutionR E = 2% the corresponding values are 30, 70 and 90 keV. This sug-gests that searching for the best agreement between experimentaland simulated Ycorr(〈Eα〉,RMS) constitutes a pertinent procedureto quantify each decay channel. Not surprisingly, the general cate-gory of DD with random energy sharing (not considered hereafter)leads to a broad Ycorr(RMS) distribution which, under our exper-imental conditions, looks very similar to the dominating SD [12].For a realistic reproduction of the experimental data, we add to thepure simulated events the same proportion of background eventsthat exists in the data. These are produced by partial event mix-ing [23] of experimental events. The comparison is restricted tothe energy domain, 7.4 Eex 7.8 MeV, to reduce the impor-tance of background events to 40%. Applying a χ2 minimizationprocedure and correcting for efficiencies, we infer that 7.5 ± 4.0%of events correspond to DDE, 9.5 ± 4.0% to DDL and 83.0 ± 5.0% toSD. Error bars are estimated by taking into account statistical, χ2
and background errors. The RMS(Eα) spectrum of simulated events(solid line) corresponding to the best χ2 and the energy domain90 〈Eα〉 150 keV is displayed in Fig. 5 and compared to thecorresponding experimental data (solid points). Note that a limi-tation to DDE and SD as possible decays (dotted histogram) leadsto a significant increase of χ2
min without changing the DDE per-
centage. Results of simulations in which one allows only for SDare plotted with dashed lines for the sake of completeness. As onemay notice, they correspond to a worse agreement with the data,particularly a sizeable underestimation of the number of low-RMSevents. In all cases, the amount of background events is 40%.
Finally we can now fully understand the CF pattern (Fig. 4(b));panel (c) of the figure presents also the simulated behaviors ofYcorr(RMS)/Yuncorr(RMS) (thick lines). Apart from DDE, the broadregion around 〈Eα〉 = 90–130 keV and centered at RMS ≈ 70 keVcorresponds to the sharing of the available energy between thetwo α’s of 8Be and the remaining α of 191 keV. The peak at〈Eα〉 ≈ 130 keV and RMS = 90 keV corresponds to the direct decayof a linear chain. Though the CF show, as expected, a certain sen-sitivity to the event selection or event mixing recipe, their overallpattern remains stable. Particularly the DDL peak of the CF is sys-tematically shifted by about 20 keV with respect to the DDE one.As early mentioned, a small shift of the correlated spectrum is at-tributed to the finite size of detection modules (see Fig. 4(a)). Anextra shift could be introduced by statistical effects.
A more popular way to visualize competing 3-particle decaymechanisms is the Dalitz plot. In this representation, DDE eventsmust concentrate around the origin. Fig. 1 in reference [26] showsthat our data manifest this pattern. Note also that, because of lim-ited statistics and background, the rest of the figure cannot beinterpreted.
The same analyses have been performed for the complex regioncentered at 9.64 MeV where the statistics is much higher; no indi-cation in favor of a direct 3α decay with equal energies has beenobtained [26]. For the 0+
6 state at 15.097 MeV of 16O the statis-tics is too poor to allow unambiguous interpretation of low RMSevents.
In conclusion, the nuclear reaction 40Ca + 12C at 25 MeV/nu-cleon bombarding energy was used to produce states theoreticallypredicted as α-particle condensate states. Supposing that equalvalues of kinetic energy of the emitted α-particles represent asufficient criterion for establishing the existence of α-particle con-densation, we found that 7.5 ± 4.0% of events corresponding tothe Hoyle state decay fulfill this criterion. To our knowledge, thisis the first direct experimental indication of α-particle condensa-tion in nuclei. This study also evidenced the presence of direct αdecays from a linear α-chain as recently theoretically mentioned[24,25]. An experiment with higher statistics is planned to studythe 16O case.
Acknowledgements
The authors are indebted to P. Schuck for numerous discussionsand one of the authors Ad.R.R. acknowledges the partial financialsupport from ANCS, Romania, under grant Idei No. 267/2007.
References
[1] L.P. Pitaevski, S. Stringari, Bose–Einstein Condensation, Clarendon Press, Oxford,2003.
[2] G. Röpke, A. Schnell, P. Schuck, P. Nozieres, Phys. Rev. Lett. 80 (1998) 3177.[3] M. Beyer, S.A. Sofianos, C. Kuhrts, G. Röpke, P. Schuck, Phys. Lett. B 448 (2000)
247.[4] T. Sogo, R. Lazauskas, G. Röpke, P. Schuck, Phys. Rev. C 79 (2009) 051301.[5] A. Tohsaki, H. Horiuchi, P. Schuck, G. Röpke, Phys. Rev. Lett. 87 (2001) 192501.[6] Y. Funaki, T. Yamada, H. Horiuchi, G. Röpke, P. Schuck, A. Tohsaki, Phys. Rev.
Lett. 101 (2008) 082502.[7] M. Chernykh, H. Feldmeier, T. Neff, P. von Neumann-Cosel, A. Richter, Phys. Rev.
Lett. 98 (2007) 032501.[8] E. Uegaki, Y. Abe, S. Okabe, H. Tanaka, Prog. Theor. Phys. 57 (1977) 1262.[9] S. Ohkubo, Y. Hirabayashi, Phys. Rev. C 70 (2004) 041602(R).
[10] T. Yamada, P. Schuck, Phys. Rev. C 69 (2004) 024309.[11] W. von Oertzen, Eur. Phys. J. A 29 (2006) 133.[12] M. Freer, et al., Phys. Rev. C 49 (1994) R1751.
SD = 83.0± 5.0 %DDE = 7.5± 4.0 %DDL = 9.5± 4.0 %
Raduta et al., PLB 705 (2011) 65

Astrophysical implications
T = 0.1–2 GK:
Rate reduced by 17%
T < 0.1 GK:
Rate enhanced by several orders of magnitude!(Different energy dependences of Γα0 and Γ3α at low energies)

Low-temperature triple-α reaction rate
Comparison of theoretical calculations
(ρ 100 fm) where it becomes safe to ignore off-diagonalcouplings and matching to known Coulomb functions canbe performed [16]. Extending the orthonormal basis tothe required large ρ would be impractical, so we use an R-matrix propagation technique [25] out to an asymptoticρa ρm. We divide the interval from ρm to ρa intosectors labelled p, the sizes of which are sufficiently smallthat the interactions within can be taken as constant.The propagating functions Gp are then given in terms ofcomplex exponentials [25], and used to propagate fromsector p−1 to the next:
−Rpγγ′ = Gpγγ′(ρpR, ρ
pR) +
∑
α,β
Gpγ,α(ρpR, ρpL)
[Rp−1 −Gp(ρpL, ρpL)]−1α,β Gpβ,γ′(ρ
pL, ρ
pR) . (5)
This gives the R-matrix on the right side of the bound-ary Rp from Rp−1 on the left. The coordinate sub-scripts ρR, ρL imply evaluations on the right and theleft side of the boundary respectively. While withoutCoulomb this propagation method was numerically sta-ble, including the Coulomb interaction introduced nu-merical instabilities in the three-body scattering wave-function, in the turning point region. To overcome theseinstabilities, we introduced screening in the off-diagonalpotentials Eq.(4) using a Woods-Saxon multiplying fac-tor [1+exp((ρ−ρscreen)/ascreen)]−1. Our calculations usea sufficiently large screening radius such that dB(E2)/dEfor E = 0.05–0.5 MeV becomes independent of ρscreenand ascreen.
Convergence of dB(E2)/dE was checked for all therelevant parameters. At relative energies ≈ 0.1 MeV,dB(E2)/dE picks up contributions from the wave func-tions at hyper-radii ρ = 5–30 fm. However, in orderto get a reliable three-body scattering wavefunction, thematching to the asymptotic form needs to be performedat ρ ρscreen. The results here presented include upto K = 26 in the HH expansion, 50 poles in the R-matrix expansion, an R-matrix box size of 50 fm andR-matrix propagation out to 3000 fm. In addition we useρscreen = 800 fm and ascreen = 10 fm to screen the off-diagonal couplings. The only limiting factor for full con-vergence is the truncation in Kmax. We carefully studiedthe exponential behavior of dB(E2)/dE as a function ofKmax, for the relative energy range E = 0.01–0.15 MeV(the relevant region for rates below 0.07 GK). We con-clude that our results with Kmax = 26 differ from thoseobtained from the extrapolation of Kmax →∞ by a fac-tor of at most 2. Our energy averaged rates are plottedin Fig.1 as a function of temperature (solid line). Thefactor of 2 error on the rate at low energy cannot be seengiven the scales in Fig.1.
Our method to determine the three-body scatteringstate can be checked for the pure Coulomb case. In thatcase, no resonances are present in either the two-body orthree-body systems and the capture is necessarily direct.
FIG. 1: (Color online) Different evaluations of the triple-alpha reaction rate: comparing the Hyperspherical HarmonicR-matrix method (solid) with NACRE (dotted), CDCC(dashed) and the three-body Breit Wigner (dot-dashed).
For the pure Coulomb case, the propagation techniqueis stable and we were able to unambiguously determinethat no error is introduced by screening the off-diagonalcouplings. In addition, there is an analytic solution ofEq. (3) for the pure diagonal Coulomb couplings whichwe use to test our implementation. The rate for diagonalCoulomb differs from the full rate by 10 orders of mag-nitude, thus demonstrating the importance of includingthe Coulomb effects correctly. The off-diagonal Coulombcouplings are important, but their major contributionto the rates in the range T = 0.01–1.00 GK occurs forρ < 100 fm.
In Fig. 1 we compare our results (solid) with thoseobtained previously. The rate obtained from the full so-lution of the HHR equations agree with NACRE (dottedline) above 0.07 GK. Although there is a slight reductionof the rate below 0.07 GK, we find a pronounced increaseof the rate for T < 0.06 GK, accompanied by a verydifferent temperature dependence. In some ways, the re-sults obtained assuming a rate extrapolated with a three-body Breit-Wigner form BW(3B) (dot-dashed line) [5]are qualitatively similar, but the BW(3B) treatment en-hances the rate to a smaller degree. Although we do finda strong enhancement at low energy, it is not as strong asthat seen in the CDCC result of [4] (long-dashed). Whilethe deviation of the CDCC results from NACRE is seenall the way up to 0.11 GK, the HHR result agrees withNACRE for T > 0.07 GK. This aspect turns out to becrucial in the repercussions for astrophysics.
The kink observed (Fig. 1) in the full rate aroundT ≈ 0.06 GK is a signature of two processes with dif-ferent temperature dependence. Above T ≈ 0.06 GKthe process through the Holye state dominates, whilebelow there is mostly non-sequential (direct) capture.The calculations in [5] exhibit this same feature. Thetemperature dependence is best illustrated by evaluating
3
Nguyen et al., PRL 109 (2012) 141101
HHR: Nguyen et al.,PRL 109 (2012) 141101
NACRE: C. Angulo et al.,NPA 656 (1999) 3
CDCC: Ogata et al.,PTP 122 (2009) 1055
BW(3B): Garrido et al.,
EPJA 47 (2011) 102

The experiment

The experiment
3He + 11B→ d + 12C∗ → d + α + α + α (Ebeam = 8.5 MeV, Q = 3.2 MeV)
M. Alcorta et al., NIM A 605 (2009) 318
AarhusMadridGoteborgYork

Data analysis and results

12C excitation-energy spectrum
7.65, 0+9.64, 3−
10.84, 1− 11.83, 2−12.71, 1+
(a)
7 8 9 10 11 12 131
10
102
103
104
Ex (MeV)
Eve
nts
/20
keV
7.65 MeV, 0+Hoyle state
(b)
0 30 60 90 120 150 1800
0.5
1
θ (deg)
dσ/d
Ω(a
rb.u
nits
)

Dalitz plot
ε3 ε2
ε1
ρ ϕ

Experimental data
0 max
DDE
DDL
SD

Radial projection of the Dalitz plot
EXPDDE (7.5%)
DDL (9.5%)
SD (100%)
DDΦ (100%)
0 0.5 10
100
200
300
400
3ρ
dN/d
ρ
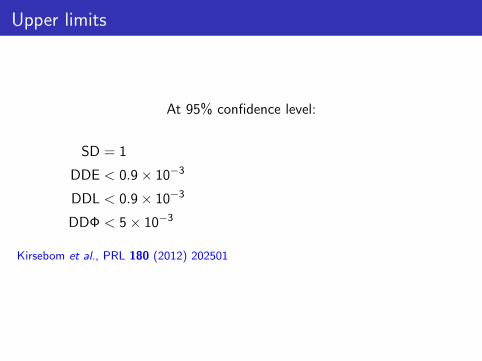
Upper limits
At 95% confidence level:
SD = 1
DDE < 0.9× 10⁻³
DDL < 0.9× 10⁻³
DDΦ < 5× 10⁻³
Kirsebom et al., PRL 180 (2012) 202501
SD = 1
DDE < 0.3× 10⁻²
DDL < . . .
DDΦ < 3× 10⁻²
Manfredi et al., PRC 85 (2012) 037603

Upper limits
At 95% confidence level:
SD = 1
DDE < 0.9× 10⁻³
DDL < 0.9× 10⁻³
DDΦ < 5× 10⁻³
Kirsebom et al., PRL 180 (2012) 202501
SD = 1
DDE < 0.3× 10⁻²
DDL < . . .
DDΦ < 3× 10⁻²
Manfredi et al., PRC 85 (2012) 037603

Structure of the Hoyle state
Raduta et al. postulate connection between the structure of the Hoyle stateand the Dalitz-plot distribution:
α-condensate structure ←→ DDELinear-chain structure ←→ DDL
But, the Dalitz-plot distribution is strongly influenced by the tunnelingthrough the Coulomb barrier
So, the Dalitz-plot distribution provides sensitive test of structure models ifthe latter is combined with a sophisticated three-body models of thebreakup
Graphical illustration
2 / 44

Summary

Key points
The Hoyle state decays sequentially (> 99.5%).
The uncertainty on the triple-α reaction rate is 10% in the temperatureregime of s-wave resonance dominance (T = 0.1–2 GK); the dominatingsource of uncertainty is Γπ/Γ.
At low temperatures (T < 0.1 GK), the triple-α reaction is not sequential.Three-body models predict very different rates (important for evolution ofearly massive stars). Observation of direct-decay branches could constrainthe models.
Can the observation of direct-decay branches be used to test 12C structuremodels? Yes, but only if the latter is combined with a sophisticatedbreakup model.

The end
Collaboration
O. S. Kirsebom1, M. Alcorta2, M. J. G. Borge2, M. Cubero2, C. Aa.Diget3, R. Dominguez-Reyes2, L. M. Fraile4, B. R. Fulton3, H. O. U.Fynbo1, D. Galaviz2, S. Hyldegaard1, B. Jonson5, M. Madurga2, A.
Munoz Martin6, T. Nilsson5, G. Nyman5, A. Perea2, K. Riisager1, O.Tengblad2 and M. Turrion2
1 Department of Physics and Astronomy, Aarhus University, Denmark2 Instituto de Estructura de la Materia, CSIC, Madrid, Spain
3 Department of Physics, University of York, UK4 PH Department, CERN, Geneva, Switzerland
5 Fundamental Physics, Chalmers University of Technology, Goteborg, Sweden6 CMAM, Universidad Autonoma de Madrid, Spain