1 the origin gamma rays - los alamos national ….,. the origin of gamma rays doughs re41i!j 1.1...
TRANSCRIPT
1
,.,. The Origin of Gamma Rays
Doughs Re41i!j
1.1 GAMMA RAYS AND THE EIECI’ROMAGNETICsPEclmJM
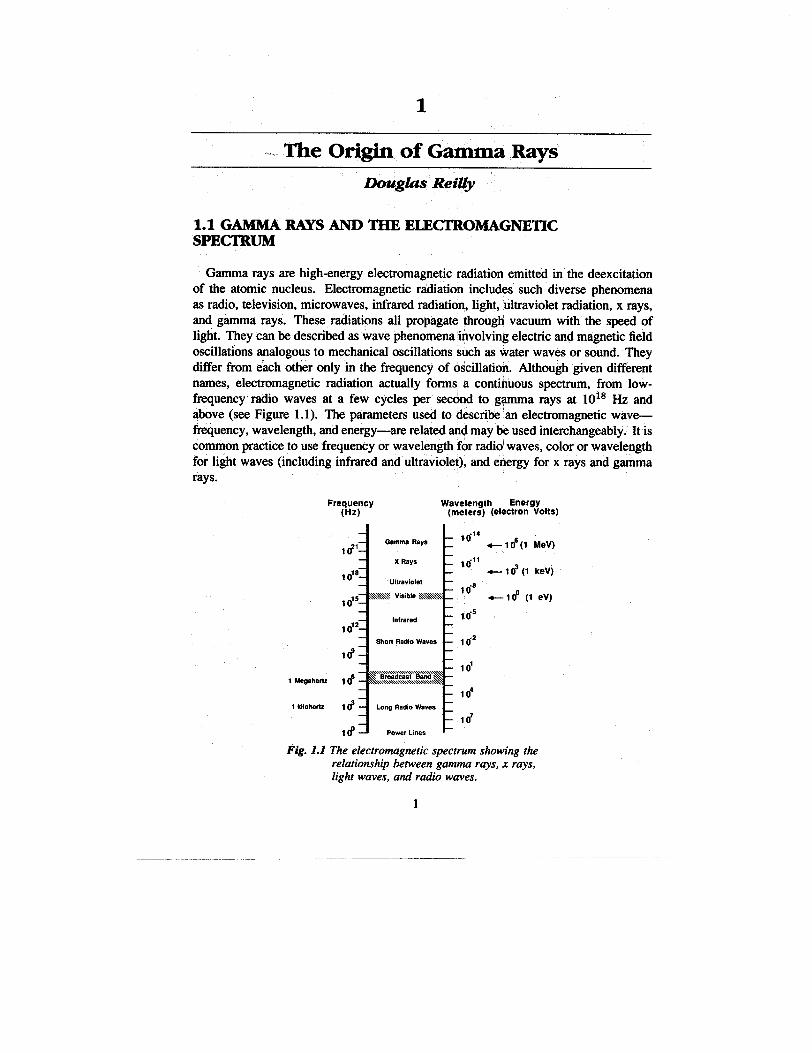
Gamma rays are high-energy electromagnetic radiation emitted in the deexcitationof the atomic nucleus. Electromagnetic radiation includes such diverse phenomenaas radio, television, microwaves, infrared radation, light, ultraviolet radiation, x rays,and gamma rays. These ti]ations all propagate througli vacuum with the speed oflight. They can be described as wave piienomena involving electric and magnetic fieldoscillations analogous to mechanical oscillations such as water waves or sound. Theydiffer from each other only in the frequency of oscillation. Although given dWferentnames, electromagnetic radiation actually forms a continuous spect~m, from low-frequency radio’ waves at a few cycles per second to gamma rays at 1018 Hz andabove (see Figure 1.1). The parameters used to describe’ an electromagnetic wave—fre@ency, wavelength, and energy—are related and maybe used interchangeably. It iscommon practice to use frequency or wavelength for radio’waves, color or wavelengthfor light waves (including infrared and ultraviolet), and energy for x rays and gammarays.
Frequenty Wavelength Energy(Hz) (meters)(electronvolts)
t Mefmhertz
1 kit01wrt2
//
Oamma Rays1 i?’
x Rays
10’8ultraviolet
\\S Wsibb SSSSS10’5Inrrared
10’2ehon mdlo waves
llf
V \\\\\\\\\\\\\\~\\\\\\\boadcasl emdlcf’ \\\\\\\\\\\\\\\\\\\\\\\\\\
ltf LongRadio Waves
lrf’ Power Lines
1(i”
id’
10-8
10-5
10-2
10’
104
10’
+-- 106(1MeV)
+ 103 (1 keV)
4-10° (1 eV)
Fig. 1.1 The electromagnetic spectrum showing therelationship between gamma rays, x rays,light waves, and radio waves.
1

2 Douglas Reilly
Visible light is emitted during changes in the chemical state of elements and com-pounds. These changes usually involve the outermost and least tightly bound atomicelectrons. The colors of the emitted light are characteristic of the radiating elementsand compounds and typically have energies of about 1 eV.* X rays and gamma raysare very high energy light with overlapping energy ranges of 10 keV and above. Xrays are emitted during changes in the state of inner or more tightly bound electrons,whereas gamma rays are emitted during changes in the state of nuclei. The energiesof the emitted radiations are characteristic of the radiating elements and nuclides.
Knowledge of these high-energy electromagnetic radiations began in Germany in1895 with the discovery of x rays by Wilhelm Roentgen. After observing that a zincsulfide screen glowed when it was placed near a cathode-ray discharge tube, Roentgenfound that the radiation that caused the glow was dependent on the electrode materialsand the @e voltage, that it was not bent by elec.~.c or,magnetic fields, and that it couldreacMypenetrate dense ,matter. Natural radioactwpy was discovered the following yearin F~ce by He&i Becquerel, who observed that uranium s,~ts gave off a naturalradiation that could expose or blacken a photographic plate. wile studying thesephenomena, M@e and Pierre Curie isolated imd identified the radioactive elementspolonium and radium. They determined that the phenomena were characteristic of theelement? not its chemical form.
These “radioactive rays” were intensely studied in many I?boratories. In 1899in England, Erqest Rutherford discovered that 95% of the radiation was effectivelystopp@ by 0.02 mm of aluminum and 50% of the remaining %diation was stoppedby 5 mm of aluminum or 1.5 mm of copper., Rutherford named the first component“alpha”, and the second, more penetrating radiation, “beta.” Both pf these radiationswere deflected by electric and magnetic fields, though in opposite dnections; thisfact indicated that the ra&ations carried electrical charge. In 1900 Paul Vilhwd andHenri Becquerel noted that a photographic plate was affected by radioactive materialseven when the plate was shielded by 20 cm of iron’ or 2 to 3 cm of lead. Theyalso noted that this penetrating radiation showed go magnetic deflection. In 1903Rutlierford named this component “gamma” aid stated that “gamma rays are probablylike Roentgen rays.” Thus the three major ra&ations were identified and named forthe first three letters of the Greek alp~abet: Q, P and T.
As indicated by the brief description of their discovery, gamma rays often accom-pany the spontaneous alpha or beta decay of unstable nuclei. X rays are identical togamma rays except that they are emitted during rearrangement of the atomic elec-tron structure rather than changes in nuclear &ructure. X-ray energies are unique toeach element but the same for different isotopes of one element. They frequentlyaccompany nuclear decay processes, which d$rupt the atomic electron shell.
* The electronvolt (eV) is a unit of energyequal to the kinetic energy gained by an electronacceleratedthrough a potentialdifference,of 1 V; 1 eV equals 1.602 x 10⁻¹⁹ J. This smallunit and the multipleunits keV (103 eV) and MeV (106 eV) are useful for describingatomicand molecularphenomena.

The Origin of Gamma Rays 3
Gamma rays from spontaneous nuclear decay are emitted with a rate and energy(color) spectrum that is unique to the nuclear species that is decaying. This uniquenessprovides the basis for most gamma-ray assay techniques: by counting the number ofgamma rays emitted with a specific energy, it is possible to determine the number ofnuclei that emit that characteristic radiation.
1.2 CHARACTERISTICS OF NUCLEAR DECAY
1.2.1 Nuclear Decay Processes: General
The atomic nucleus is assumed to be a bound configuration of protons and neutrons.Protoris and neutrons have nearly the same mass and differ principally in charge:protons have a positive charge of 1 and neutrons are electrically neutral. Differentelements have nuclei with different numbers of neutrons and protons. The number ofprotons in the nucleus is called the atomic number and given the symbol Z. In theneutral atom, the number of protons is equal to the number of electrons. The numberof neutrons in the nucleus is given the symbol N. The total number of nucleons(protons and neutrons) in the nucleus is called the atomic mass number and given thesymbol A (A = Z + N).
For all nuclear decay processes, the number of unstable nuclei of a given speciesis found to diminish exponentially with time:
n =noe -At (l-1)
where n = number of nuclei of a given species at time tno = number of nuclei at t = OA = decay constant, the parameter characterizing the exponential.
Each nuclear species has a characteristic decay constant. Radioactive decay is mostcommonly discussed in terms of the nuclear half-life, T1/z, which is related to thedecay constant by
T1/z = (h 2)/A . (l-2)
The half-life is the time necessary for the number of unstable nuclei of one species todiminish by one-half. (Half-lives are commonly tabulated in nuclear data tables). Thedecay rate or specific activity can be represented in terms of the half-life as follows:
1.32 X 10¹⁶R=
A T1/2
(l-3)
where R = rate in decays per second per gramA = atomic weightT1/2 = half-life in years.
Equation 1-3 is often used to estimate the activity per gram of a sample.
—. ,-—

4 Douglas Reilly
An alpha or beta decay of a given nuclear species is not always accompaniedby gamma-ray emission. The fraction of decays that is accompanied by the emissionof a specific energy gamma ray is called the branching intensity. For example, themost intense gamma ray emitted by 235Uhas an energy of 185.7 keV and a branchingintensity of 54~0. Uranium-235 decays by alpha-particle emission with a half-life of7.038 x 108 yr. Equation 1-3 thus implies an alpha emission rate of 7.98 x 10⁴/g-s. Only 5490 of the alpha particles are accompanied by a 185.7-keV gamma ray;therefore, the specific activity of this gamma ‘my is 4.3 x 10⁴/g-s.
Of the natural decay radiations only the gamma ray is of interest for nondestructiveassay of bulk nuclear materials because the alpha- and beta-particle ranges are veryshort in condensed matter. Consider the following ranges in copper metal:
5-MeV w 0.01 mm or 0.008 g/cm21-MeV @ 0.7 mm or 0.6 ~cm20.4-MeV T 12 mm or 10.9 g/cm2(mean free path).
1.2.2 Alpha Decay
The alpha particle is a doubly ionized (bare) 4He2 nucleus. It is a very stable,tightly bound nuclear configuration. When a nucleus decays by alpha emission, theresulting daughter nucleus has a charge that is two units less than the parent nucleusand an atomic mass that is four units less. This generic reaction can be representedas follows:
Axz + ‘–4XZ–2 + 4He2 . (l-4)
The decay can occur only if the mass of the neutral parent atom is greater than thesum of the masses of the daughter and the neutral 4He atom. The mass differencebetween the parent and the decay products is called the Q-value and is equal to thekinetic energy of the decay products:
Q = (Mp– Md – MH.)c2 (l-5)
where MP,d,He= neutral atomic mass of the parent, daughter, and 4He atomc = velocity of light.
When the parent nucleus decays, most of the energy Q goes to the alpha particlebecause of its lower mass:
Ea = Q(A – 4)/A . (l-6)
The remainder of the available energy goes into the recoil of the daughter nucleus.Most of the approximately 160 known alpha emitters are heavy nuclei with atomic
numbers greater than 82. The energy of the ,emitted alpha particle ranges from 4 to10 MeV and the half-lives vary from 10–G s to 1010 yr. The short-lived nuclei emithigh-energy alpha particles when they decay.

The Origin of Gamma Rays 5
Immediately after the decay of the parent nucleus, the daughter nucleus can be eitherin the ground state or in an excited state. In the latter case the nucleus can relax byeither of two mechanisms: gamma-ray emission or internal conversion. The radiativerelaxation leads to emission of one or more gamma rays (typically, 10– 14 s afterthe alpha emission) with discreet energies whose sum equals the original excitationenergy. During internal conversion the nucleus transfers the excitation energy directlyto one of the most tightly bound atomic electrons, usually a K electron. The electronleaves the atom with an energy equal to the difference of the transition energy andthe electron binding energy. The resulting vacancy leads to the emission of x raysor electrons (called Auger electrons) with the characteristic energy spectrum of thedaughter element. The probability of” internal conversion increases strongly withatomic number (Z) and with decreasing excitation energy.
In some cases the alpha decay leads to an excited state that lives much longer than10–14 s. If the lifetime of this state is longer than approximately 10-6 s, it is calledan isomer of the ground-state nucleus. An example of an isomer is the alpha decayof 239Pu that leads to 235U:
239pu ~ 235mU(26 min 99.96%) ~ 235U
(1-7)239pu ~ 235U(0.04%) .
The common decay mode of 239Pu leads first to the isomer 235mU, which has a
half-life of 26 min. The direct decay to 235U occurs only 0.0470 of the time. One ofthe longest lived isomers is ‘lmNb41, with a half-life of 60 days.
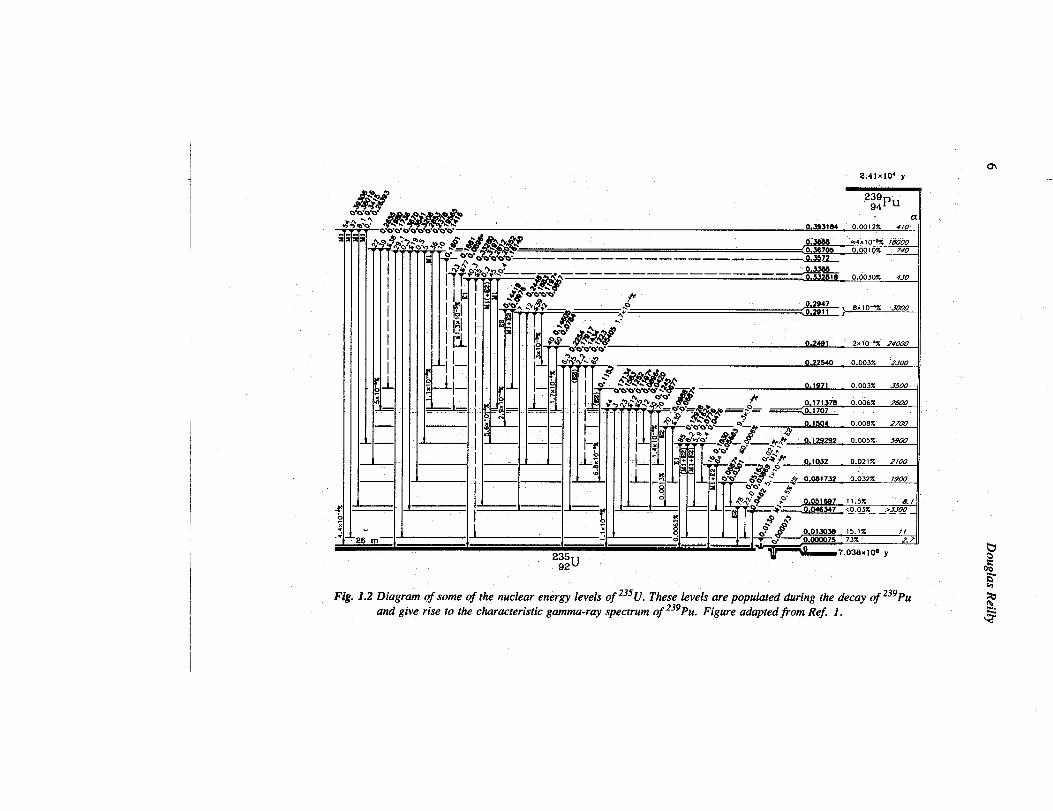
All the alpha particles, gamma rays, and ,intemal conversion electrons emitted dur-ing the decay process have discreet, characteristic energies. The observation of thesecharacteristic ,spectra showed that nuclei have discreet allowed, states or energy lev-els analogous to the allowed states’ of atomic electrons. The various spectroscopic,!observations have provided information for developing the nuclear level schemes pre-sented in handbooks such as the Tab/e of Isotopes (Ref. 1). An example appears
235U populated during the alphain Figure 1.2 showing the lower energy levels ofdecay of 239Pu. These levels give rise: ‘to‘the characteristic gamma-ray spectrum of239Pu. Note that the characteristic gamma-ray spectrum is commonly associated withthe parent or ,decaying nucleus even though the energies are determined by the levelsof the daughter nucleus. Although this practice may seem confusing, it is universallyfollowed for gamma rays. The confusion is further aggravated by the common use ofx-ray nomenclature that associates the chmcteristic x rays with the daughter element.Hence the alpha decay of 239Pu leads to 235U and is accompanied by the emission of239Pugamm? rays and uranium x rays.
1.2.3 Beta Decay
In the beta decay process the atomic number (Z) increases or decreases by oneunit and the atomic mass number (A) stays constant. In effect, neutrons and protonschange state. The three types of beta decay are /3–, E+, and electron capture.
..❑
a
2.41x10⁴Y
*;:PU@@k-’F&+** a
>.awwa, 0.3931M0.0012Z 410
Fig. 1.2 Diagram of some of the nuclear energy levels of 235U. These levels are populated during the decay of 239Pu
239Pu. Figure aalzptedfiom Ref 1.and give rise to the characteristic gamma-ray spectrum of

The Origin of Cam Rays 7
Beta-minus decay was the first detected process; the fl- particle was found to be anormal electron. During the decay process the nucleus changes state according to thefollowing formula:
-%z 4 ‘XZ+I + e–+%. (l-8)
The ~– decay process can be thought of as the decay of a neutron into a proton,an electron, and an electron antineutrino. The decay is energetically possible for afree neutron and occurs with a half-life of 12.8 min. This is the common beta-decayprocess for nuclei with high atomic number and for fission-product nuclei, whichusually have significantly more neutrons than protons.
During ~+ decay the nucleus changes state according to the following formula
Axz + ‘XZ_l +e+ +Ve . (l-9)
Electron capture competes with the ~+ decay process. The nucleus interacts with aninner atomic electron and, in effect, captures it, changing a proton into a neutron withthe emission of a positron and an electron neutrino. The formula for this process is
‘X,Z + e– ~ AxZ–l + Ve. (l-lo)
All unstable nuclei with atomic number less than 82 decay by at least one of the threeprocesses and sometimes by all three (see Figure 1.3). Beta decay occurs wheneverit is energetically possible. It is energetically possible if the following conditions aremet for the masses of the neutral parent atoms (p) and the potential daughter atom(d):
& decay: M,> Md
@ decay: MP> M, + 2me
Electron capture: MP> M~ . (1-11)
>
//
EC1’
P+
64Ni28
\
64Zn30
Fig. 1.3 Nuclear decay scheme of ‘Cu showing three possiblebeta decay processes.
—— -.—

8 Douglas Reilly
Beta decay can be to the ground state or to an excited state in the daughter nucleus. Inthe latter case the excited state decays by giunma-ray emission or internal conversion.
1.3 X-RAY PRODUCI’ION
1.3.1 The Bohr Model of the Atom
In the simple Bohr model of the atom, the positive nucleus contains protons andneutrons and has an approximate radius of 1.4 x 10– 16 (A1/3)m and an approximatedensity of 2 x 10¹⁴g/crn3. The nucleus is surrounded by a cloud of negative electronsin discrete, well-defined energy levels or orbitals. The radii of these orbitals are inthe range 10-9 to 10-8 m. The original Bohr model had well-localized orbits and ledto the familiar planetary diagram of the atom. Although not accepted at present, thisconcrete model is useful for explaining x-ray production.
The ~fferent energy levels are designated K, Ll, Lz, L3, Ml, .... Ms, and so forth.(As an example, consider the electron energy levels of uranium illustrated in Figwe1.4.) The electric force between an electron and the positively charged nucleus variesas the inverse square of the separation, therefore, the electrons closer “tothe nucleushave a higher binding energy B. The binding energy is the energy required to removethe electron from the atom. The K-shell electrons are always the most tightly bound.Quantum mechanics gives a good description of the energies of each level and howthe levels fill up for different elements. The chemical properties of the elements aredetermined by the electron configuration.
In its normal resting configuration the atom is stable and does not radiate. If anelectron moves from a higher to a lower energy level, it radiates an x ray.
URANIUM LEVEL ENERGY (keV)
L3
L2
L,
K
17.168
20.948
21.758
115.61
Fig. 1.4 Electron energy levels in uranium. Transitions be-tween the levels shown give rise to the K-series xrays.

The Origin of Gamma Rays
1.3.2 X-Ray Production Mechanism
Various interactions ionize or remove ancharged particles interact with electrons as
9
electron from an atom. All energetic,they pass through matter. X-ray and
gamma-ray photons also interact with atomic electrons. Nuclear interactions such asinternal conversion or electron capture can cause the ionization of atomic electrons.
When an electron leaves an atom, the atom is in an excited state with energy Bi by“th electron level. This vacancy may be filled by a morevirtue of the vacancy in the z
loosely bound electron from an outer orbital, the jfh level. The change in energy levelis accompanied by the emission of an x ray with energy Bi – Bj or by the emissionof an Auger electron with energy Bi – 2Bj. In the latter case the atom transfers itsexcess energy directly to an electron in an outer orbkd. The fraction of vacancies inlevel i that result in x-ray emission is defined as the fluorescence yield Wi. Figure1.5 shows the variation of the K-shell fluorescence yield with atomic number. X-rayemission is more probable for h@h-Z elements (for Z >70, WK > 95%).
Fig. 1.5 Variation of the K-shellfluorescence yield, WK,with atonu”cnumber.
1.0 ,
0.9 -
0.8-
0.7 -
0.6-
0.5 -
0.4 -
0.3 -
0.2-
0.1-
01020304050 S07080 90100
ATOMICNUMBER
High-Z materials have high internal conversion coefficients, which means that theirnormal decay modes lead to vacancies in an inner electron shell (usually K or L) andthe production of characteristic x rays. Because these vacancies occur in the daught&atom, the x-ray energies are characteristic of the daughter element. In condensedmaterials the charged particles (a, /?) and gamma rays from the nuclear decay arestopped in the parent material by a series of interactions with atomic electrons; thisleads to the production of x rays that are characteristic of the parent atom. Plutoniummetal emits uranium x rays by virtue of the internal conversion process that occursafter alpha decay. It also emits plutonium x rays by virtue of alpha-particle-inducedx-ray fluorescence.

10 Douglas Reilly
1.3.3 Chractdstic x-Ray spectra
Each element emits a characteristic x-ray spectrum. All elements have the samex.-raypattern, but the x-ray energies are different. Figure 1.6 shows the characteristicx rays from uranium and lead.
Early investigators developed the system commonly used today for naming x rays.A reman letter indicates the final level to which the electron moves, and a Greekletter plus a number indicates the electron’s initial energy level. (The Greek letterwas originally related to the x-ray energy and the number to its intensity). Table 1-1gives the major K x rays of uranium and plutonium. The L and M x rays are of lowerenergy and are tabulated in the literature.
b 1 t v
80 - Kal LEAD
Ka2~ 60 -
: 40 -1
‘P
~ 20~ ) 4% I t ILtJ~ 80 -
BKa, URANIUM
1- Ka2
~ 60 -wa 40 - ‘P
20 -
I #70 80 90 100 110 120
ENERGY (keV)
Fig. 1.6 Characteristic x-ray spectra @om lead and uranium. Notethat the pattern is the same but shified in energy.
1.4 W$JOR GAMMA RAYS FROM NUCLEAR MATERIAL
1.4.1 ‘Iypical spectra
Figures 1.7 through 1.12 show typical uranium, plutonium, and thorium gamma-rayspectra. The spectra were measured with high-resolution germanium detector systems.Figure 1.7 shows the spectrum of highly enriched uranium from O to 3 MeV? with
— )————

The Origin of Gamma Rays 11
Table 1-1. Major K x rays of uranium and plutonium”Levels Energy (keV) Intensity~
X Ray (Final - Initial) Uranium Plutonium Uranium Plutonium
K@2 K-L2 94.67 99.55 61.9 62.5Kal K-L3 98.44 103.76 100 100
K@ K-M3 111.30 117.26 22.0 22.2
~f12 K - N2-5 114.5 120.6 12.3 12.5
K03 K-M2 110.41 116.27 11.6 11.7
‘Other x rays in the K series are weaker than those listed here. The energiesand intensities are from Ref. 1.6Relative intensity, 100 is maximum.
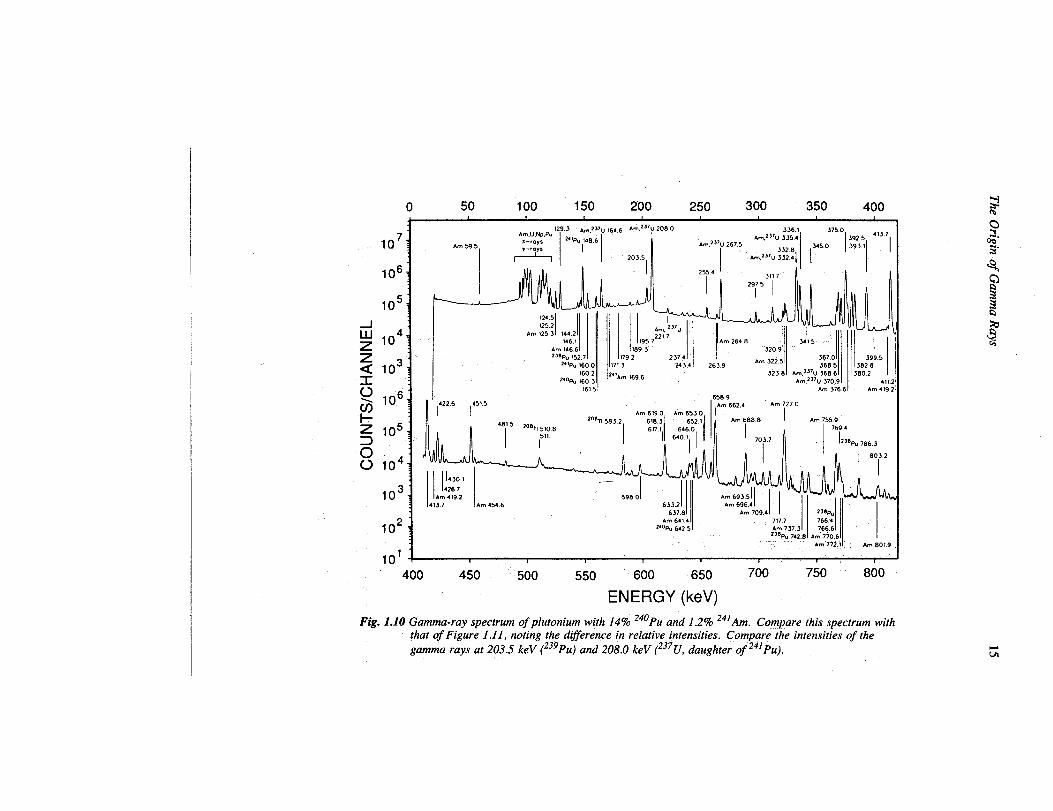
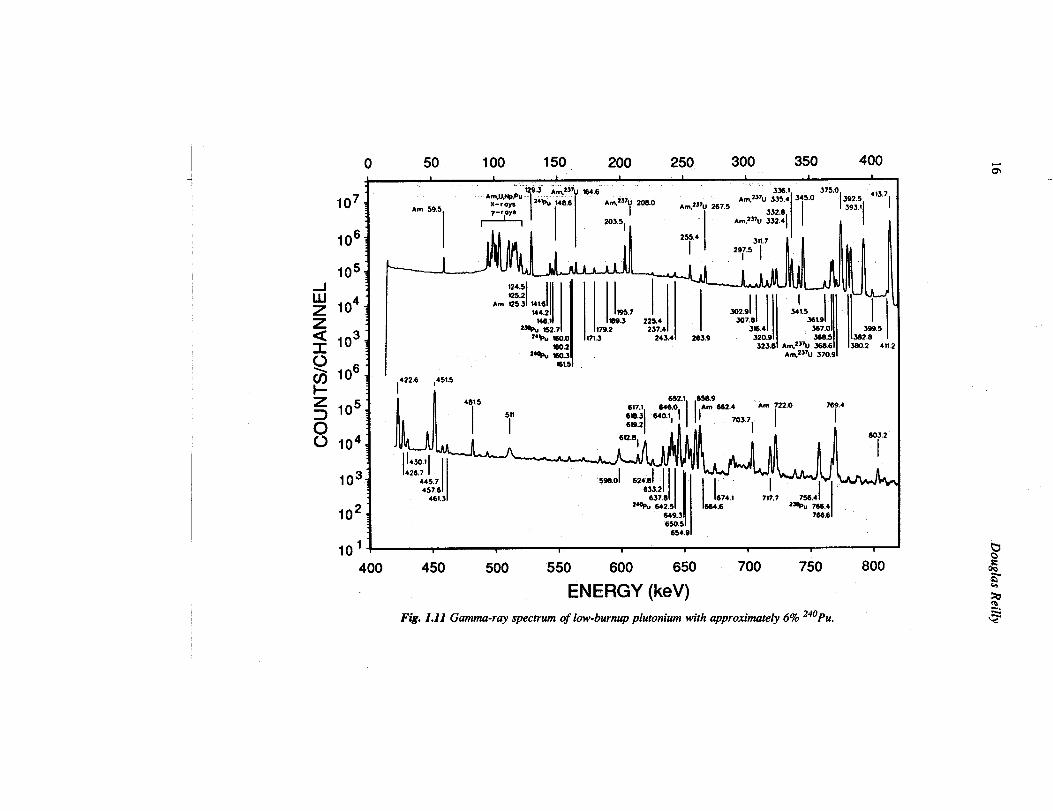
characteristic gamma rays from 235U and. the 23*U daughter 234mPa. The intensegamma rays between 140 and 210 keV are often used for the assay of 235U (Figure1.8 shows this region in more detail). For comparison, Figure 1.9 shows a spectrum ofdepleted uranium; the spectrum shows the 238Udaughter radiations often used for 23*Uassay. Figures 1.10 and 1.11 are gamma-ray spectra of plutonium with approximate240FUconcentrations of 14% and 6%, respectively. Note the differences in relativepeak heights between the two spectrw the.$e differences are used to determine theplutonium isotopic composition (see discussion in Chapter 8). Figure 1.12 shows thecharacteristic gamma-ray spectrum of 232~ all major thorium gamma rays comefrom daughter nuclides.
1.4.2 Major Gamma-Ray Signatures for Nuclear Material Assay
In principle, any of the gamma rays from nuclear material can be used to determinethe maw of the isotope that produces them. In practice, certain gamma rays are usedmore frequently than others because of their intensity, penetrability, and freedom frominterference. The ideal signature would be an intense (> 104 ~/g-s) gamma ray withan energy of 3everal million electron volts. The mass attenuation coefficients of allmaterials show a broad minimum between 1 to 5 MeV and there are very few naturalgamma rays above 1 MeV that can cause interference. Unfortunately, such gammarays do not exist for uranium or plutonium.
Table 1-2 lists the gamma rays most commonly used for the nondestructive analysisof the major uranium and plutonium isotopes.
— -.

CHANNELo 200 400 600 800 1000 1200 1400 1600 1800 2000
106
,05
[
*TI 26(4.6,.3 \
0“E”’’g2”6~ /’620’72*B’ f 2i03.6 SE,
2000 2200 2400 2600 2800 3000 ,3200 3400 3600 3800 4000
CHANNEL
Fig. 1.7 High-resolution gamma-ray spectrum of highly enriched uranium (93Y0 235u). Energiesaregiven in kiloelem-ora
volts. (S.E. and D.E. are the single- and double-escape peaks of the 2614-keV gamma ray.)

I
1(’)9% .UKa. 94.643
i , ThLm, 12.97
1 IIlhL#, 16.20
m>, 18.9s
.W(I7, 96.44
TIM(UZ 89.96 ~,2 185.72
2317~ ~9,95
‘s~h 84.21un#, 11o.43 246..%
‘s~h s2.11, I143.78
lWLV~4.4a I
205.31163.36 ~% 2::6: I
101 1 I , I 1 I.-.0 50 100 150 200 250
ENERGY (keV)
Fig. 1.8 Gamma-ray spectrum of highly enriched uranium showing the intense gamma rays often used for assay of 235U.
w “-w

105
-1 104Luz$ 103x_
t
1:.#+y--+)! 143.6’%
203.3%
106 s 1 1 r I I I 1 I I t 1 1 # t 1,MlO! !-M 9’*., m
~ “ ‘“’”~ le~ ‘:F,
766.4
1
/-!001.0
742.8 786.3
\/_ 946.0
~
\
I
1193s
Am ml 511.0 - /d<! I \ “;7”3‘“lS6613 -..
tQ 102 “ 139se
rn kr .-1614.O
1 ,—--1 I I
“,
1-Z r~103‘1“4x:jjl~,o JJ
/
A&J,!102 1527.6
1534.1,,,
{q j
‘e)yvv :4!yJlJF,jL;!..:. . - “!s93.7 176M
10’ t766.21796.5 . . :.. ....- .-.,.. . - .-t : . .:. . . .. .... . ........ ;-... . .. . . . . . . .. --— .-
C. .. ---- .-.
1809.8 1926.1 . . . . .. . .
.. . . -..
I4,
,s -851.7 J
) L
\,7”.
6605803.2
9218
7
112$.0898.7 92U0
t738.4 1832.0
1868.41875.6
I,h/ ~g’’”;937.2
Ik
11’ 1969.4
‘Uik 1! L20’Ti [BkQ,l 26146,
. . ..—.—---------------------- -------- .--..,....... ....[... . . ..-. ... ... .. ..—..-:. ..-_:--.. ... .. .—. , -.. .
mo.1..- “.. .-. —- . . . . . . ..- . . . . . . . . . .- .—. .-. — .. - . - . - ..-”----- . .
10°t I I 1 1 I 1 1 I I i 1 # I a 1 i I Io 200 400 600 800 1000 1200 1400 1600 1800 2000
2000 2200 2400 2600 2800 3000 3200 3400 3600 3800 4000
CHANNEL
235(J) The intense gamma rays at 766 and 1001 keV are from theFig. 1.9 Gamma-ray spectrum of depleted uranium (0.2% .238U daughter 234mPa, and are often used for the assay of 238U. Most of the weak gamma rays above 1001 keV
234mPa (Ann. Rad. is annihilation radiation; the small peak at 511 keV is due to positron annihi-also come @om .Iation,)
107
,.6
105
6c) 104
103
102
10’
0 50 100 150 200 250 300 350 4001293 Am,l>,u ,~~ Arn:37~ 2080 336.1
Arn,U,NP,PU375.0
24% 148.6~m,237” J,$ ,
x-my,
1
3925 4’”Am 59.5 Am,237U 267,5
l=+ ‘345.0 3931
20351 A,TI?37U :2.:1 \
400 450 500 550 600 650 700 750 800
ENERGY (keV)
Fig. 1.10 Gamma-ray spectrum of plutonium with 14% 240Pu and 1.2% 24’Am. Compare this spectrum withthat of Figure 1.11, noting the difference in relative intensities. Compare the intensities of thegamma rays at 203.5 keV (239Pu) and 208.0 keV (237U, daughter of 24’Pu). l-l
w
o 50 100 150 200 250 300 350 4004 , t 1 , I
1129.3 Am,2371j M,G 336.$
107Am,u,NP.Pu Am,z37u 335..4 345.0
375”01%:, 4’3”71‘m ‘“, , :::?, p% ‘8’6
;;? ‘Mo Am~”~ 2675 Aq,,,u q 1,
I
106
L-L-J ti ‘J’
11’ 255.4 IM.7
II297.5
105 .1.1 1,11 II nilii
vJj 106 ]1 ,422.6 ,451.5
W.51 .
+
I‘~“‘u“ ““1’
z 481.5 652.t 656.9
~ 105 Am 662.4 Am 722.051!
o::4S.%.ylI616.2
703.7,1
0 104672.6
d
I
1430.!
,03 426.7445.7 ,w.o] 624.81 III ~ ;“i~ ‘W;W
I457.6[
461.3I
,.2
769.4
M.mi u633.21
63?.8 I 111Jy ‘ 754.41717.7*%I 642.S. ~% 764.4
649.3 766,6650.S
654.61
10’1 , , , I , 1400 450 500 550 600 650 700 750 800
ENERGY (keV)Fig. 1.11 Gamma-ray spectrum of low-burnup plutonium with approximately 6% 240Pu.

The Origin of Gamma Rays
;! ~: ~
I..=-i........~l.$:.........s...................................+..........................+’’..-”.’’.-”””’”’--’.., .
-.%.,.,,..., .,”-.
1400
17
1600 1800 2000 2200 2400 2600
CHANNEL NUMBER
Gamma-ray spectrum of 232Th and its daughter products.Thorium-232 emits no significant gamma rays of its own. Thedaughter nuclides grow into equilibrium with the 232Th parentover a period of approximately 35 yr. [Figure adapted fromF. Adams and R. Dams, AppliedGamma-RaySpectroscopy,3rd ed. (Pergamon Press, Oxjord, 1970).]

18 Douglas Reilly
Table 1-2. Major NDA gamma-ray signaturesEnergya Activity” Mean Free Pathb(mm)
Isotope (keV) (7/g-s) (High-Z, p) (Low-Z, p)234U 120.9 9.35 x 10⁴ 0.23 69235u 143.8 8.40 X 10³ 0.36 73
185.7 4.32 X 10⁴ 0.69 80238u 766.4’ 2.57 X 101 10.0 139
1001.0’ 7.34 x 101 13.3 159238pu 152.7 5.90 x 10⁶ 0.40 75
766.4 1.387 X 10⁵ 9.5 139239pu 129.3 1.436 X 10⁵ 0.27 71
413.7 3.416x 10⁴ 3.7 106240pu 45.2 3.80 X 10⁶ 0.07 25
160.3 3.37 x 10⁴ 0.45 76642.5 1.044 x 10³ 7.4 127
241pu 148.6 7.15 x 10⁶ 0.37 74208.0d 2.041 X 10⁷ 0.86 83
241Am 59.5 4.54 x 10¹⁰ 0.14 38125.3 5.16 X ’106 0.26 70
“Data for uranium isotopes are from Ref. 1; data for plutoniumisotopes are from Ref. 2 (energy and branching ratio) and Ref.3 (half-life).bThe mean free path is the absorber thickness that reduces thegamma-ray intensity to I/e. The mean free path in uranium orplutonium oxide (p = 10 g/cm3) is given for the high-density,high-atomic-number case (high-Z, p). The mean free path inaluminum oxide (p= 1 ~cm3) is given for the low-density, low-atomic-number case (low-Z, p). Attenuation data are from Ref. 4.‘From the 238Udaughter z~4mpa.Equilibrium assumed.
‘From the 241Pu daughter 237U.Equilibrium assumed.
1.4.3 Fission-Product Gamma Rays
Considerable interest has been shown in the measurement of irradiated fuel fromnuclear reactors. The irradiated fuel has a high monetary value and a high safeguardsvalue because of the plutonium produced during reactor operation. Gamma rays fromthe spontaneous decay of uranium and plutonium cannot be used for, measurementof irradiated fuel because they are overwhelmed by the very intense gamma raysemitted by fission products that build up in the fuel during irradiation. The totalgamma-ray intensity of the fission products from light-water-reactor fuel irradiated to33000 MWd/tU (megawatt days per ton of uranium) is approximately 2 x 10¹⁰~/g-s(g = gr~ of urrmium) one year after removal of the fuel from the reactor, whereas
——- --

The Origin of Gamma Rays 19
the major uranium and plutonium gamma rays have intensities in the range 10s to104 -y/g-s. In some instances the intensity of one or more fission products can bemeasured and related to the mass of the contained nuclear material.
Certain high-Z nuclei can fission or split into two or three medium-Z daughternuclei. The fission process can occur spontaneously or it can be induced when theparent nucleus absorbs a neutron. Spontaneous fission is more probable in nucleiwith even atomic mass numbers (A). Induced fission can occur after absorption ofeither thermal or fast neutrons in nuclei with odd mass numbers; it only occurs afterabsorption of fast neutrons in even-numbered nuclei. The fission process was firstdiscovered in 1939 by Otto ,Hahn and Freidrich Strassman and correctly interpretedin the same year by Lise Meitner and Otto Frisch.
The fission of a nucleus is a cataclysmic event when compared with the alpha- andbeta-decay processes described in Sections 1.2.2 and 1.2.3. The energy released infission is approximately 200 MeV. Most of this energy is carried as kinetic energy bythe two (rarely three) daughter nuclei (called fission products or fission fragments).The fissioning nucleus also emits an average of two prompt neutrons and six promptgamma rays at the instant it splits. A typical fission reaction is illustrated by theformula
n + 235U9Z~ 137CS55+ 97Rb37+ 2n . (1-12)
This formula illustrates only one of the many possible fission reactions. The fission-product nuclei themselves are unstable. They have an excess of neutrons and decayby neutron emission or o- decay (frequently accompanied by gamma-ray emission);the radiations from these reactions are ,called delayed neutrons and gamma rays. Thefission products have half-lives ranging from seconds to years. The gamma rays fromfission products can be used to measure irradiated fuel materials.
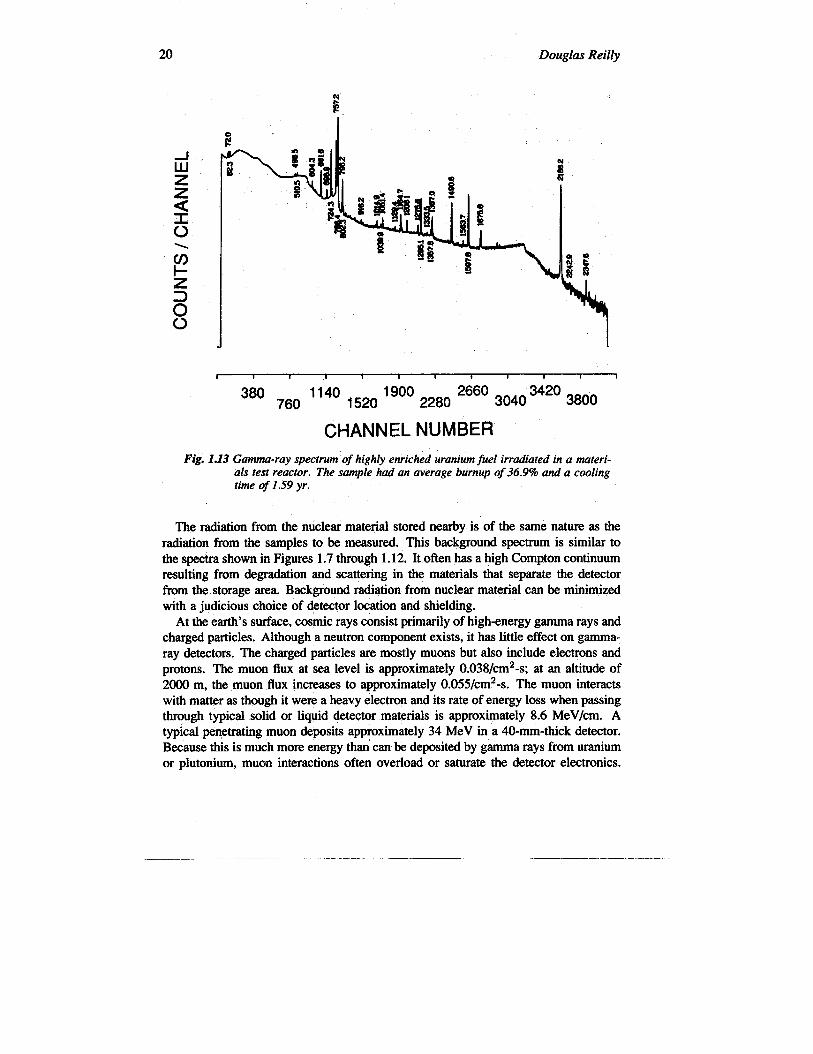
Typical spectra from irradiated fuel are shown in Figures 1.13 and 1.14. Figure1.13 shows a spectrum from highly enriched uranium fuel used in a materials testreactor. Figure 1.14 shows an irradiated light-water-reactor fuel spectrum. The mostcommonly measured fission-product gamma ray is from 137CSat 661.6 keV. Thisfission product has a high yield and a sufficiently long’half-life (30.2 yr) so that itsconcentration is proportional to the total number of fissions that have occurred in thefuel. (See Chapter 18 for a more complete discussion of the fission reaction and themeasurement of irradiated fuel.)
1.4.4 Background RdiiltiOll
All gamma-ray detectors will give ‘some response even in the absence of a mea-surement sample. This response is due to the ambient background in the location ofthe detector. The ambient background consists of radiation from nuclear material innearby storage areas, cosmic-ray interactions, and natural radioactivity in the localenvironment.
___— .—
20 Douglas Reilly
\
380 1140 1900 2660760 1520 2280 304034203800
CHANNEL NUMBER
Fig. 1.13 Gamma-ray spectrum of highly enriched uranium fiel irradiated in a materi-als test reactor. The sample had an average burnup of 36.9% and a coolingtime of 1.59 yr.
The radiation from the nuclear material stored nearby is of the same nature as theradiation from the samples to be measured. This background spectrum is similar tothe spectra shown in Figures 1.7 through 1.12. It often has a high Compton continuumresulting from degradation and scattering in the materials that separate the detectorfrom the storage area. Background radiation from nuclear material can be minimizedwith a judicious choice of detector location and shieldlng.
At the earth’s surface, cosmic rays consist primarily of high-energy gamma rays andcharged particles. Although a neutron component exists, it has little effect on gamma-ray detectors. The charged particles are mostly muons but also include electrons andprotons. The muon flux at sea level is approximately 0.038/cm2-S at an altitude of2000 m, the muon flux increases to approximately 0.055/cm2-s. The muon interactswith matter as though it were a heavy electron and its rate of energy loss when passingthrough typical solid or liquid detector materials is approximately 8.6 MeV/cm. Atypical penetrating muon deposits approximately 34 MeV in a 40-mm-thick detector.Because this is much more energy than can be deposited by gamma rays from uraniumor plutonium, muon interactions often overload or saturate the detector electronics.

The Origin of Gamma Rays
10’I,00 -i
300 600 900 1200 1500 1800 2100 2400GAMMA - RAY ENERGY - keV
Fig. 1.14 Gamma-ray spectrum of irradiated pressurized-water-reactor fuelhaving a burnup of 32000 MWdltU (megawatt days per ton of ura-nium) andacooling time of 9 months.
Foradetector with a front surface area of20cm2, the typical muon interaction rateat sea level is approximately 0.75/s.
All materials have varying degrees of natural radioactivity. For example: thehuman body and even gamma-ray detectors have some measurable natural radioac-tivity: building materials such as concrete can be especially active. The maior radioac-tive species in natural materials are 40K, 232Thand its daughters, and 236U and 23*Uand their daughters. Potassium-40 has a natural abundance of 0.01 17% and decaysby electron capture (10.67%) and /3- decay (89.33%) with a half-life of 1.277 x 10⁹yr. The eleetron capture is accompanied by the emission of a 1.461-MeV gamma raythat is evident in almost all background gamma-ray speetra. Potassium is present inmost organic matter, with 40K being the major source of radioactivity.
Thorium is a common trace element in many terrestrial reeks. Thorium-232 is thenatural parent to the thorium decay series, which goes through 10 generations beforereaching the stable nuclide 208Pb. The half-life of 232Th is 1.41 x 10¹⁰yr. Its majorgamma-ray activity comes from 208Tl, 212Bi, and 228Ac.

22 Douglas Reilly
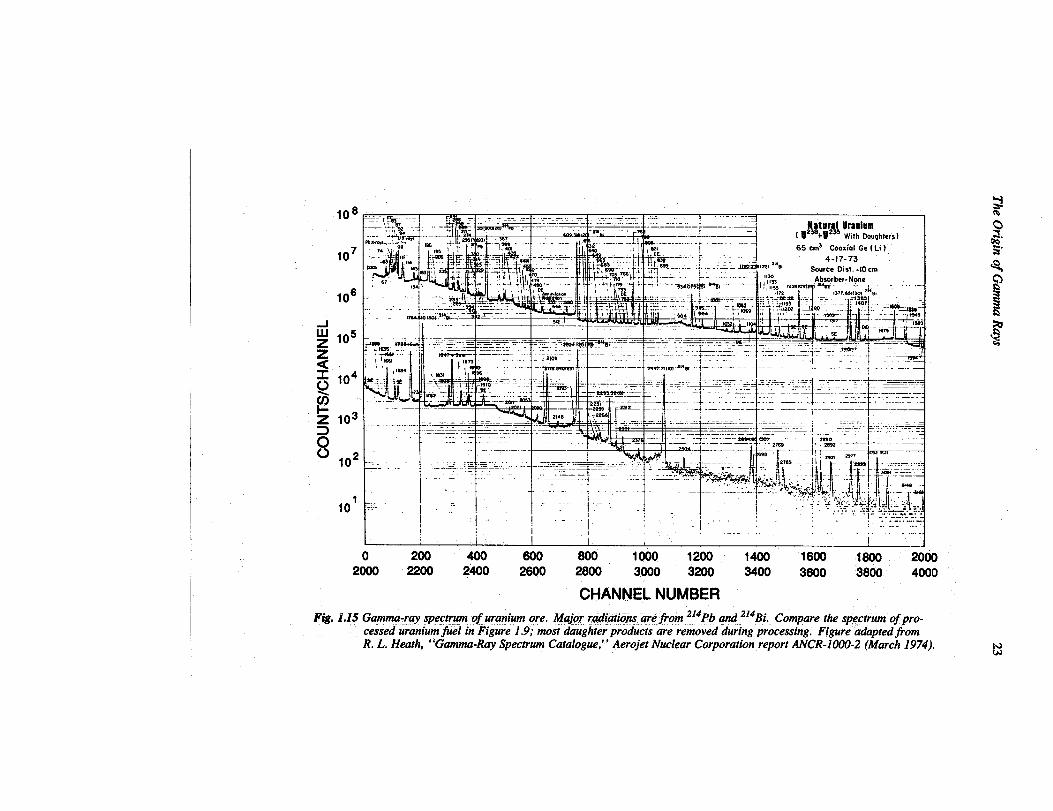
Uranium is also found as a trace element in many rocks, although it is less commonthan thorium. The gamma-ray spectrum of unprocessed uranium ore is much differentfrom that of uranium seen in the nuclear fuel cycle. Because of the long half-life ofthe daughter 230Th (8 x 10⁴ yr), later generations take a long time to grow backinto equilibrium after any chemical treatment that separates uranium daughters fromthe natural ore. Figure 1.15 shows a typical spectrum of uranium ore (compare withFigure 1.9). Natural chemical processes in different rocks can often leach out some ofthe daughter nuclides and cause different ores to have different gamma-ray emissions.
The natural sources discussed above are common and contribute to the backgroundgamma-ray spectrum in most locations. Other sources of background are occasionallyencountered, such as materials contaminated by radioactive tracers. Slag from steelfurnaces, which can have measurable levels of ‘°Co, tid uranium tailings are usedas a concrete aggregate in some ~eas. The use of such materials in buildings cancontribute to background radiation levels.
1.5 ADDITIONAL GAMMA-RAY PRODUCTION REACTIONS
The discussion in Section 1.4 has been limited to gamma rays that come fromthe natural decay reactions of radioactive nuclides; these gamma rays provide thebulk of the signatures useful for nondestructive assay. This section discusses gammarays produced in other nuclear reactions. Some of these radiations can interfere withnondestructive analysis.
1.S.1 Bremsstrahlung (Braking Radiation)
Charged particles continuously decelerate as they move through condensed materi-als. As they decelerate, they emit photons with a continuous energy spectrum knownas bremsstrahlung; these photons are of interest because their energies are often similarto those used for nondestructive assay.
Beta particles from nuclear decay often emit bremsstrahhmg photons while stopping.Although beta particles have a very short range in condensed matter and rarely escapefrom the host material, the bremsstrahlung photons often escape and are detectedalong with the gamma rays of interest for nondestructive aasay. Internal conver-sion electrons can also contribute to the production of bremsstrahlung radiation. Thediscrete gamma rays emitted by a decaying nucleus may be superimposed on a con-tinuous bremsstrahlung background. The electron Iinac (linear accelerator) uses thebremsstrahlung reaction to produce high-energy photons for nuclear research, nuclearmedicine, and active nondestructive assay of nuclear materials (Ref. 5).
108
107
106
-1I.u ,.5zzag ,04
3t-~ 103
g
102
10’
IlataralUranium\2m+82WW,th Oouqhters)
. . ... . . . . . . .
-: UIY?L .‘l,,.
65 cm3 Coaxial Ge ( Li )
4-17-73
Source Di sl, -10 cm.~
,5= ~l& ...
II --- --—— .
~!fi} \ in ----------------., ,_ .— ..– . l.. ,W9 . \ I I - I
-–”kjw-~-”” -+j y+mla-----1-1 1- ==—,-,
1
I II -1 . .. . .. .
. . .I I I !
o 200 400 600 600 1000 1200 1400 1600 160(t 20002000 2200 2400 2600 2600 3000 3200 3400 3600 3800 4000
CHANNEL NUMBER
Fig. 1.15 Gamma-ray spec~m of uranium ore. Major radiatioware from 214Pb and 214Bi. Compare the spectrum of pro-cessed uranium fuel in Figure 1.9; most daughter products are removed during processing; Figure adaptedfiomR. L. Heath, “Gamma-Ray Spectrum Catalogue,” Aerojet Nuclear Corporation report ANCR-1OOO-2 (March 1974). N
w

24 Douglas Reilly
1.5.2 Particle Reactions
When nuclei interact with other particles, charged or neutral, they often emit gammarays as products of the interaction. The neutron capture reaction (n,?) is a classicexample. Usually the new nucleus is radioactive and is created in an excited statefrom which it can decay by gamma-ray emission. The following formulas illustratethe neutron-capture reaction that breeds plutonium in a fission reacto~
n + 238U a T + 239U (23 rein)
239u ~ e– + jj + 23gNp(2.3 days)
239Np -+ e“ + v + 239Pu (24 119 yr)
Gamma rays from the capture reaction have discreet energies that are characteristicof the levels of the, daughter nucleus. Their energies are typically 8 to 9 MeV forhigh-atomic-number nuclei.
Inelastic scattering of neutrons (n,n’~) is usually accompanied. by gamma-ray emis-sion. The gamma rays have discrete energies that are characteristic of the levels inthe target nucleus. Gamma rays produced by this reaction are usually not of interestfor nondestructive aksay.
A major source of neutrons from plutonium compounds and UFGis the interaction ofalpha particles from nuclear decay with Iow-atomic-numlier nuclei in the compoundor surrounding mat$x material. The (~,n) reaction is f~uentiy accompanied bygamma-ray emission from the excited product nucleus. The fluorine reaction can bewritten as follows:
lgF(o,n) 22Na .
The fluorine reaction usually proceeds to the ground state of 22Na and does not resultin gamma-ray emission. However, the subsequent @ decay of 22Na leads to gammarays with energies of 511 and 1275 keV. These radiations are evident in s.mplesof FuF4 and 238PUOZwith trace fluorine impurities. They are not usefhl aa assaysignatures, but may be a source of interference.
REFERENCES
1. C. M. Ledmr and V. S. Shirley, E&., Table of Isotopes, 7th ed. (John Wiley 8CSons, Inc., New York, 1978).
2. R. Gunninlq J. E. Evans, and A. L. Prindle, “A Reevaluation of the Gamma-Ray Energies and Absolute Branching Intensities of 237U, 238’239*240’241Pu, and241AmY Lawrence Livermore Laboratory reportUCRL-52139 (1976).

The Origin of Gamma Rays 25
3.
4.
5.
“Ctilbration Techniques for the Calorimetric Assay of Plutonium-Bearing SolidsApplied to Nuclear Materials Control,” ANSI N15.22-1975 (American NationalStandards Institute, Inc., New York, 1975) and 1986 revision.
J. H. Hubbell, “Photon Cross Sections, Attenuation Coefficients, and Energy Ab-sorption Coefficients from 10 keV to 100 GeV,” National Bureau of Standardsreport NSRDS-NBS 29 (August 1969).
T. Gozani, Active Nondestructive Assay of Nuclear Material, Principles and Appli-cations, NUREG/CR-0602 (US Nuclear Regulatory Commission, Washington, DC,1981).
