huntsman - jp morgan hy & lev. fin. conf. - feb...
TRANSCRIPT

Huntsman CorporationJP Morgan Global High Yield and Leveraged Finance Conference
February 3, 2009

2
Forward Looking Statements
This presentation includes “forward-looking statements” within the meaning of Section 27A of the Securities Act of 1933 and Section 21E of the Securities Exchange Act of 1934. These forward-looking statements include statements concerning our plans, objectives, goals, strategies, future events, future revenue or performance, capital expenditures, financing needs, plans or intentions relating to acquisitions, business trends and other information that is not historical information. When used in this presentation, the words “estimates,” “expects,” “anticipates,”“projects,” “plans,” “intends,” “believes,” “forecasts,” or future or conditional verbs, such as “will,” “should,” “could” or “may,” and variations of such words or similar expressions are intended to identify forward-looking statements. All forward-looking statements, including, without limitation, management’s examination of historical operating trends and data, are based upon our current expectations and various assumptions. Our expectations, beliefs and projections are expressed in good faith, and we believe there is a reasonable basis for them. However, there can be no assurance that management’s expectations, beliefs and projections will be achieved.
There are a number of risks and uncertainties that could cause our actual results to differ materially from the forward-looking statements contained in this presentation. Such risks, uncertainties and other important factors include, among others: future global economic conditions, changes in raw material and energy prices, access to capital markets, industry production capacity and operating rates, the supply demand balance for our products and that of competing products, pricing pressures, technological developments, changes in government regulations, geopolitical events and other risk factors as discussed in our most recently filed Form 10-K and Forms 10-Q.
All forward-looking statements attributable to us or persons acting on our behalf apply only as of the date made and are expressly qualified in their entirety by the cautionary statements included in this presentation. We undertake no obligation to update or revise forward-looking statements which may be made to reflect events or circumstances that arise after the date made or to reflect the occurrence of unanticipated events.This presentation contains financial measures that are not in accordance with generally accepted accounting principles in the U.S. ("GAAP"), including EBITDA, adjusted EBITDA from continuing operations, adjusted EBITDA from discontinued operations, normalized EBITDA and net debt. The Company has provided reconciliations of non-GAAP financial measures to the most directly comparable GAAP financial measures in the Appendix to this presentation.

3
$0
$2
$4
$6
$8
$10
$12
$14
1985 1987 1989 1991 1993 1995 1997 1999 2001 2003 2005 2007
Huntsman Growth
MonsantoMAn/LAB
Rexene
Packaging Spinoff
Nova Styrenics Sale
Shell PP
American Hoechst Texaco
Chemical
TexacoPO/MTBE
Vantico
ICI
Ciba TEButadiene/MTBE SaleEuropean Base Sale
Total revenues Differentiated and Inorganic revenues
Dow Ethyleneamines and Rhodia Surfactants
Recent Events of Significance
Rev
en
ue (
$ in
Billio
ns)
Polymers SaleU.S. Base Sale
Dec-06 Mar-07 Jun-07 Sep-07 Dec-07 Mar-08 Jun-08 Sep-08 Dec-08
12/06 - Sold European
Petrochemicals
business to Sabic 06/07 - Basell to acquire
HUN for $25.25/share
07/07 - Hexion/Apollo to
acquire HUN for $28/share11/07 - Sold U.S. Base
Chemicals business to Koch
08/07 - Sold U.S. Polymer
business to Koch
09/08 - Decisive HUN legal
victory in Delaware against
Hexion/Aopllo
01/09 - $150 mm cost cutting,
significant capex reduction
12/08 - Settlement with
Hexion/Apollo for $1 billion
10/08 - Credit Suisse &
Deutsche Bank unwilling to
fund the Merger
06/08 - Hexion/Apollo attempt
to backout of Merger

4
Geographically DiverseQ3 2008 LTM Differentiated and Inorganic Revenue Distribution
New plant construction
Differentiated and inorganic revenues include Polyurethanes, Materials & Effects, Performance Products and Pigments
U.S. & Canada32 %
Europe 33 % Asia Pacific
21%
Rest of World14%

5
Growth ProfileRevenue Growth Targets
Target: ~GDPPerf. Spec., MAn ~3x GDPPerf. Int. ~GDP
Adv. Mtls. ~1.5x GDPTextile Effects ~GDP
~3x GDP
Polyurethanes
MDI
Polyols
PO/MTBE
TPU
Systems
Materials and Effects
Design & Composites Engineering
Power & Electronics
Coatings, Construction & Adhesives
Pigments
Titanium Dioxide
Performance Products
Performance Specialties
Performance Intermediates
Maleic Anhydride & Licensing
Textile Effects
Differentiated Pigments

6
Paints & Coatings
17%
Construction Materials
13%
Insulation
12%
Chemicals
11%
Energy
11%Aerospace
2%
Leisure Products 2%
Personal Care 3%
Household Products 4%
Home Furnishings 4%
Apparel 8%
Footwear 1%
Household Appliance 4%
Automotive 8%
Differentiated and Inorganic End Markets
Source: management estimates
Differentiated and inorganic revenues include: Polyurethanes, Materials & Effects, Performance Products and Pigments
Consumer durables & non-durables

7
Portfolio Composition – New Huntsman
(1) Adjusted EBITDA excludes restructuring and plant closing costs, loss on the sale of accounts receivables and other unusual
items; segment allocation is before corporate and other unallocated items.
Polyurethanes
53%
Performance
Products
24%
Materials &
Effects
19%
Pigments
4%
Materials &
Effects
24%
Performance
Products
25%
Pigments
11%Polyurethanes
40%
Q3 2008 LTM Revenue: $10.7 billion Q3 2008 LTM Adjusted EBITDA(1): $786 million
Inorganic
Differentiated

8
PolyurethanesBusiness Dimensions
Markets include:
� Adhesives, Coatings and Elastomers
� Appliances
� Automotive
� Construction
� Composite Wood Products
� Footwear
� Furniture and Bedding
� Q3 2008 LTM: Revenue $4.2 billion, Adjusted EBITDA $511 million
� Global reach: 2,000+ customers and sales in 90+ countries
� Commitment and focus on MDI-based applications, over 2,000 distinct MDI-based products
Adjusted EBITDA
$357
$264
$409
$734
$573 $593$511
$-
$250
$500
$750
2002 2003 2004 2005 2006 2007 Q308
LTM$ m
illio
ns

9
Materials & EffectsBusiness Dimensions
Markets include:
� Adhesives ���� Marine
� Aerospace ���� Power
� Apparel ���� Coatings
� Automotive
� Construction
� Electronics
� Sports and Leisure
� Textiles - Home and Technical
� Wind Energy
� Q3 2008 LTM: Revenue $2.5 billion, Adjusted EBITDA $185 million
� Sales in more than 90 countries
� Over 6,000 products to more than 5,000 customers
Adjusted EBITDA
$177$162
$226$242
$202$224
$185
-
100
200
300
2002 2003 2004 2005 2006 2007 Q308
LTM$ m
illio
ns

10
Performance ProductsBusiness Dimensions
Markets include:
� Agriculture ���� Paper
� Construction ���� Fuels
� Personal Care ���� Mining
� Gas Treatment
� Paints and Coatings
� Soaps and Detergents
� Ceramics
� Electronics
� Composites
� Metalworking
� Water Treatment
� Polyurethanes
Adjusted EBITDA
$196
$150
$186 $176
$209 $209$233
-
100
200
300
2002 2003 2004 2005 2006 2007 Q308
LTM$ m
illio
ns
� Q3 2008 LTM: Revenue $2.7 billion, Adjusted EBITDA $233 million
� Over 2,000 products sold to more than 4,000 customers
� Maleic Anhydride Expansion – 100mm lbs Geismar 2009,
100 mm lbs German JV 2011
� Ethyleneamines – 30kt Saudi JV 2009
11
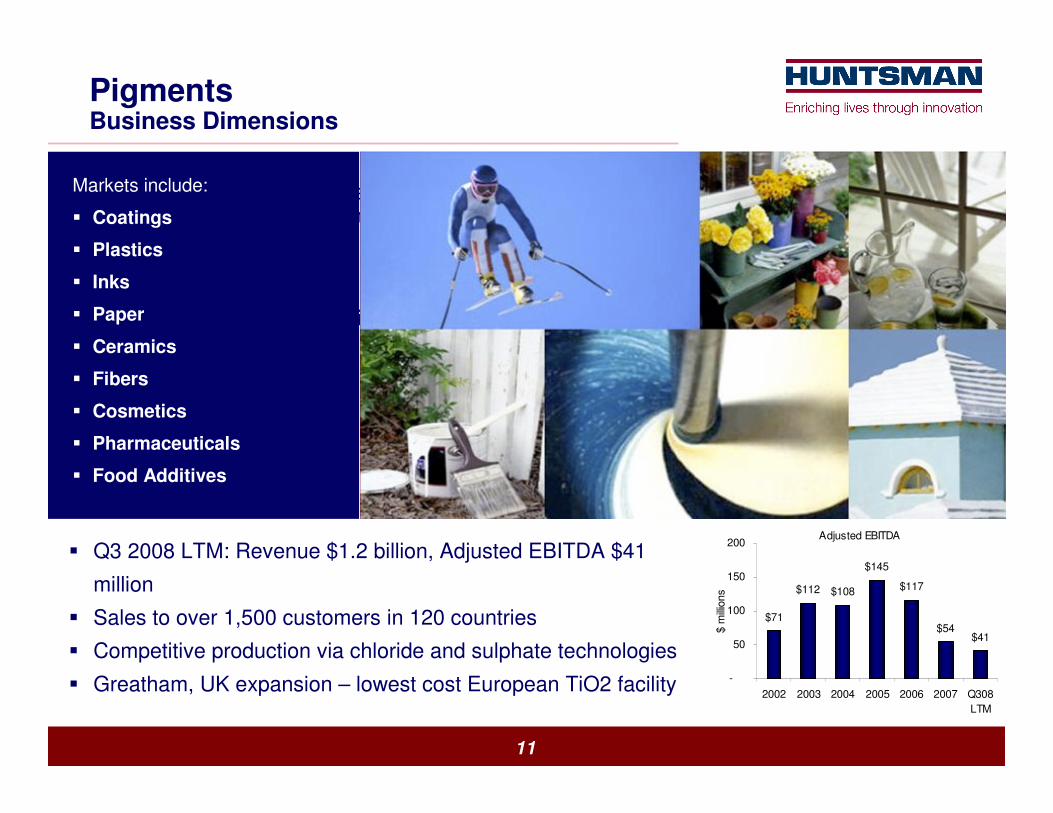
PigmentsBusiness Dimensions
� Q3 2008 LTM: Revenue $1.2 billion, Adjusted EBITDA $41 million
� Sales to over 1,500 customers in 120 countries
� Competitive production via chloride and sulphate technologies
Markets include:
� Coatings
� Plastics
� Inks
� Paper
� Ceramics
� Fibers
� Cosmetics
� Pharmaceuticals
� Food Additives
Adjusted EBITDA
$71
$112 $108
$145
$117
$54$41
-
50
100
150
200
2002 2003 2004 2005 2006 2007 Q308
LTM$ m
illio
ns
� Q3 2008 LTM: Revenue $1.2 billion, Adjusted EBITDA $41
million
� Sales to over 1,500 customers in 120 countries
� Competitive production via chloride and sulphate technologies
� Greatham, UK expansion – lowest cost European TiO2 facility

12
$ 759$ 661
$ 875
$ 1,166
$ 958 $ 925$ 786
-$200
$0
$200
$400
$600
$800
$1,000
$1,200
$1,400
$1,600
2002 2003 2004 2005 2006 2007 2008 LTM
Annual Adjusted EBITDA
Financial Performance
$2 6 2
$3 0 1
$2 2 1
$175
$2 4 4 $2 4 7 $2 4 0
$19 4 $18 8$2 10
$19 4
$ 0
$ 100
$ 200
$ 300
$ 400
Q1 06 Q2 06 Q3 06 Q4 06 Q1 07 Q2 07 Q3 07 Q4 07 Q1 08 Q2 08 Q308
Quarterly Adjusted EBITDA
Polyurethanes
Performance Products
Materials & Effects
Corp/Other
Pigments$ in m
illio
ns
$ in m
illio
ns
Includes $49 million of hurricane impact

13
Cost Structure
0%
5%
10%
15%
20%
25%
30%
2002 2003 2004 2005 2006 2007 2008
% o
f N
et
Sale
s
Total Fixed Costs Plant Indirects SG&A
Fixed Costs(~25% of 2008 total costs)
Raw Material Costs(~65% of 2008 total costs)
50%
55%
60%
65%
2002 2003 2004 2005 2006 2007 2008
% o
f N
et
Sale
s
Raw Materials
Raw material costs increased over $800 million
2008 vs 2007
Note: proforma to include the results of Textile Effects prior to acquisition in June 2006

14
Cost CuttingAnnual Operating Cost Savings of $150 million
� Restructuring- 9% reduction in headcount: 1,175 positions to be eliminated by
year-end 2009
- Full-time contractor reduction of 490 positions
- Pigments Grimbsy, UK plant closure
- 40,000 tonne capacity to cease Q1 2009
- Annual operating cost savings of $28 million
- Estimated Q1 2009 charge of $60 million
- Total cash cost approximately $125 million
� Capital Expenditures
- 2009 capital expenditures expected to be approximately $230 million

15
Capitalization as of September 30, 2008(Excludes $1 billion received in December)
$ in millions Amount Maturity Moody's S&P
Secured Debt
Revolver ($650 million borrow ing capacity) 354 .5 x Aug-10 LIBOR + 1.75% Ba1 BB+
HI Term Loan B 1,540 2.4 x Aug-14 LIBOR + 1.75% Ba1 BB+
11.625% Senior Secured Notes due 2010 295 2.8 x Oct-10 Oct-07 11.63% Ba1 BB+
Senior Unsecured
11.5% Senior Fixed rate Notes due 2012 198 3.0 x Jul-12 Jul-08 11.50% Ba3 B+
Senior Subordinated Debt
6.875% Senior Subordinated Notes due 2013 584 3.8 x Nov-13 Nov-09 6.88% B2 B
7.875% Senior Subordinated Notes due 2014 352 4.2 x Nov-14 Nov-10 7.88% B2 B7.375% Senior Subordinated Notes due 2015 175 4.5 x Jan-15 Jan-10 7.38% B2 B
7.5% Senior Subordinated Notes due 2015 197 4.7 x Jan-15 Jan-10 7.50% B2 B
Other Debt
Huntsman Corporation Australia Credit facility 35 4.7 x May-10 10.15%
Huntsman Chemical Company Australia Credit Facility 19 4.8 x May-10 10.15%
PU Shanghai 127 4.9 x Dec-14 LIBOR + 0.48%
Other Debt 82 5.0 x N/A
Total GAAP Debt 3,958 5.0 x
Wtd. Avg. Interest Rate 6.80%
Cash (113) Wtd. Avg. Interest Rate on Variable Borrowings 5.48%
Total GAAP Net Debt 3,845 4.9 x
AR Securitization 422
Total HC Net Debt 4,267 5.4 x
Pro forma HC Net Debt ($750 settlement proceeds) 3,517 4.5 x
Adjusted LTM EBITDA 786
Multiple of
09/30/08 LTM
EBITDA
First Call
Date Interest Rate
Rating

16
1) Debt maturity does not include off balance sheet Accounts Receivable securitization program ($422 mm as of 09/30/08)2) As represented by first date at which debt becomes callable by its terms3) Huntsman Revolver has a stated maturity of 2010, however for US GAAP purposes it is classified as current debt
752
4468
51
2,816
227
$0
$500
$1,000
$1,500
$2,000
$2,500
$3,000
2008 2009 2010 2011 2012 Thereafter
957
352198
2,451
$0
$500
$1,000
$1,500
$2,000
$2,500
$3,000
$3,500
$4,000
Current 2008 2009 2010
Debt Maturities (1) (3) Callable Debt(1)(2)
($ in millions)($ in millions)
Debt Maturities & Callable Debtas of September 30, 2008

17
Summary
� Strong balance sheet- Ample liquidity ($1 billion received in December)
- Attractive debt maturity profile
- Low borrowing costs
� Insurance claim outstanding for $235 million in arbitration / mediation- $365 million received separately thus far
� Multi-billion dollar tortious interference claim against Credit Suisse and Deutsche Bank
- Texas trial set for May 11, 2009
� Attractive product offering- Most products grow at positive GDP multiples (substitution effect)
� End market usage well diversified
� Strong global position
� Low cost manufacturer
� Proven management team

Appendix

19
Adjusted EBITDA Reconciliation
$ in millions
Q1 '06 Q2 '06 Q3 '06 Q4 '06 Q1 '07 Q2 '07 Q3 '07 Q4 '07 Q1 '08 Q2 '08 Q3 '08
Net (loss) / income 69$ 263$ (182)$ 80$ 47$ (71)$ (150)$ 2$ 7$ 24$ (20)$
Interest expense - net 87 95 83 86 74 70 72 70 65 66 68
Income tax expense / (benefit) 15 18 (18) (65) 12 (8) (13) (3) 3 21 18
Depreciation and amortization 88 88 89 98 95 94 93 99 94 98 99
Income taxes, depreciation and amortization in discont. ops. 23 36 41 38 14 (62) 7 (65) 0 2 1
EBITDA 281 499 14 237 242 23 8 102 170 210 165
Loss on sale of accounts receivable 2 3 3 4 4 5 7 4 5 5 6
Unallocated foreign currency loss 1 (2) (12) 4 3 4 4 2 5 6 (4)
Legal and contract settlement expense, net - (9) - - - 6 - - - - -
Loss on early extinguishment of debt - - 15 13 1 0 - 0 - - -
Other restructuring, impairment and plant closing costs 8 1 4 3 - 13 9 8 - 1 4
Merger associated expenses - - - - 11 - 205 5 4 4 26
Gain (loss) on disposition of assets - (92) (1) 1 (4) - - (69) 5 - -
(Income) loss from discontinued operations net of tax (53) (71) 206 (88) (11) 187 7 141 1 (7) (1)
Extraordinary gain on the acquisition of a business, net of tax - (51) (7) 2 (2) 9 - - (0) (8) (2)
Cumulative effect of changes in accounting principle - - - - - - - - - - -
Adjusted EBITDA from continuing operations 239 279 221 175 244 247 240 194 188 210 194
Acquisition - Textile Effects 22 22 - - - - - - - - - Pro Forma Adjusted EBITDA from continuing operations 262$ 301$ 221$ 175$ 244 247 240$ 194$ 188$ 210$ 194$
2002 2003 2004 2005 2006 2007 Q308 LTM
Net (loss) / income (167)$ (426)$ (228)$ (35)$ 230$ (172)$ 13$
Interest expense - net 544 578 613 427 351 286 269
Income tax (benefit) / expense(1)
(10) 32 (29) 21 (50) (12) 39
Depreciation and amortization(1)
488 480 537 501 363 380 389
Income taxes, depreciation and amortization in discont. ops. n/a n/a n/a n/a 138 (107) (62)
EBITDA 854 664 893 913 1,031 375 647
Loss on sale of accounts receivable 6 32 13 9 13 20 20
Unallocated foreign currency loss (48) (109) (109) 33 (10) 12 8
Legal and contract settlement expense, net (9) 8 7 - (9) 6 -
Loss on early extinguishment of debt 7 - 26 323 27 2 0
Other restructuring, impairment and plant closing costs 109 90 274 107 15 31 13
Merger associated expenses - - - - - 221 38
Gain (loss) on disposition of assets - - - - (92) (73) (64)
(Income) loss from discontinued operations net of tax (109) (117) (301) (337) (6) 324 133
Extraordinary gain on the acquisition of a business, net of tax - - - - (56) 7 (10)
Cumulative effect of changes in accounting principle (167) - - 31 - - -
Adjusted EBITDA from continuing operations 643 567 803 1,078 914 925 786
Acquisition - Textile Effects 116 94 72 88 45 - - Pro Forma Adjusted EBITDA from continuing operations 759$ 661$ 875$ 1,166$ 958$ 925$ 786$
(1) Includes discontinued operations for periods 2002 - 2005

20
Segment Adjusted EBITDA
$ in millions
Q1 '06(2)
Q2 '06(2)
Q3 '06 Q4 '06 Q1 '07 Q2 '07 Q3 '07 Q4 '07 Q1 '08 Q2 '08 Q3 '08
Adjusted EBITDA
Polyurethanes 158$ 172$ 136$ 108$ 119$ 159$ 173$ 142$ 132 148 89 Materials & Effects 60 56 47 40 63 61 53 47 40 51 48
Performance Products 52 77 38 42 72 40 48 49 53 51 81 Pigments 36 32 26 23 23 21 4 7 12 7 16
Corporate and other (43) (35) (26) (37) (32) (35) (37) (50) (48) (46) (40)
Segment Adjusted EBITDA from cont. ops.(1)
262$ 301$ 221$ 175$ 244$ 247$ 240$ 194$ 188$ 210$ 194$
Pro Forma(2,3)
Pro Forma(2,3)
Pro Forma(2)
Pro Forma(2)
Pro Forma(2)
2002 2003 2004 2005 2006 2007 Q308 LTM
Adjusted EBITDA
Polyurethanes 357$ 264$ 409$ 734$ 573$ 593$ 511$
Materials & Effects 177 162 226 242 202 224 185 Performance Products 196 150 186 176 209 209 233
Pigments 71 112 108 145 117 54 41 Corporate and other (42) (28) (54) (131) (142) (154) (184)
Segment Adjusted EBITDA from cont. ops.(1)
759$ 661$ 875$ 1,166$ 958$ 925$ 786$
(1) For a reconcilation of Segment Adjusted EBITDA to Net Income see previous page.
(2) Pro forma as if Huntsman had acquired its interest in Textile Effects as of January 1, 2002.
(3) Pro forma as if Huntsman had acquired the remaining interest in HIH as of January 1, 2002 and its interest in Advanced Materials as of January 1, 2002.