human body composition and energy expenditure...human body composition and energy expenditure...
TRANSCRIPT

Human Body
Composition and Energy
Expenditure
Barbara A. Gower, PhD
Professor, Dept. Nutrition Sciences
PUH 690 “Energetics: Scientific Foundations of
Obesity and Other Health Aspects”

Overview
I. Body composition (fat, lean, bone)
II. Fat distribution
Subcutaneous adipose tissue
Visceral adipose tissue
Ectopic fat (liver, muscle)
Brown adipose tissue
III. Energy Expenditure

Part I: Body composition
Dual-energy X-ray absorptiometry (DXA)
Air-displacement plethysmography
BodPod
PeaPod
Stable isotope dilution

Dual-energy X-ray
absorptiometry
Differential attenuation of two X-ray beams of
differing strength
Bone > lean mass > fat mass
“R” values = X-ray attenuation
Extrapolated R value when bone obscures soft
tissue

DXA Total & regional fat mass, lean mass, bone
mineral content and density

DXA analysis image

Sample output

Body density with Bod Pod
Body volume by air displacement
Body density by volume and mass
Body volume corrected for tidal volume

Air-displacement plethysmography Body density via “Bod Pod”
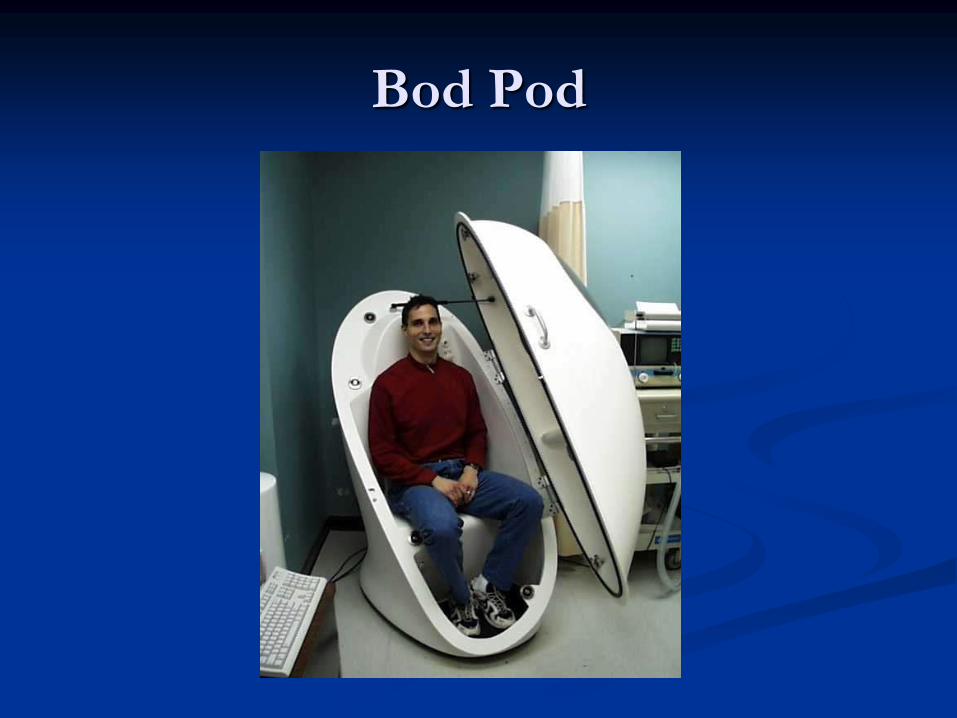
Bod Pod

Bod Pod

Body density with Bod Pod
> mass/volume = > density
> density = > lean:fat
%fat = (4.95/Db-4.5) x 100 (Siri, 1956)

Pea Pod for infant body
composition

Stable Isotope Dilution Total body water via deuterium ingestion
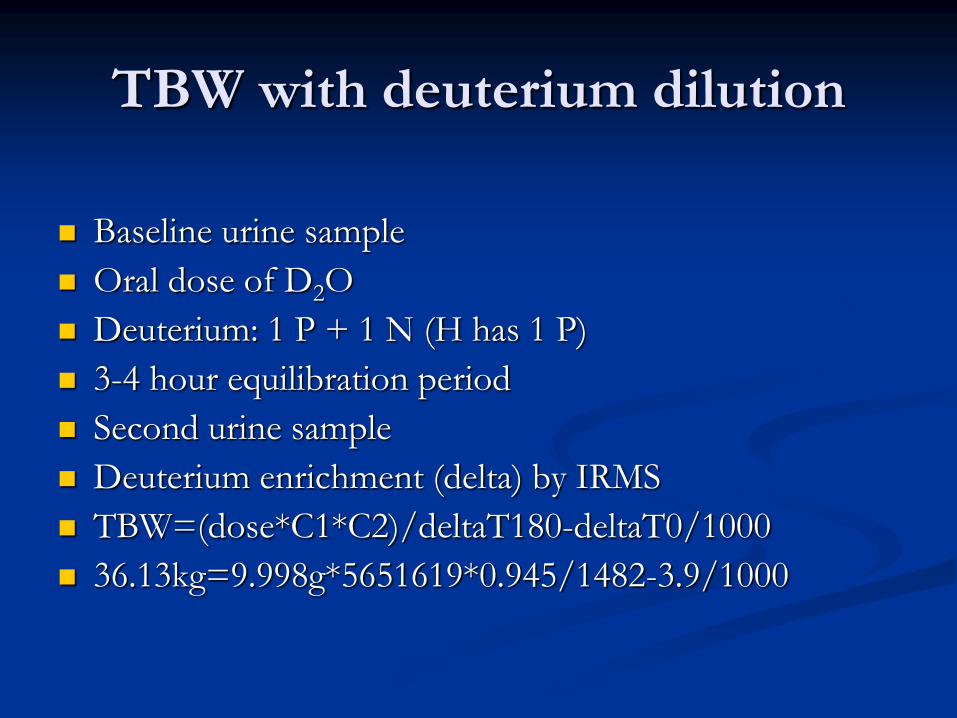
TBW with deuterium dilution
Baseline urine sample
Oral dose of D2O
Deuterium: 1 P + 1 N (H has 1 P)
3-4 hour equilibration period
Second urine sample
Deuterium enrichment (delta) by IRMS
TBW=(dose*C1*C2)/deltaT180-deltaT0/1000
36.13kg=9.998g*5651619*0.945/1482-3.9/1000

Multi-compartment modeling
% Fat = (equation)
Total body water (isotope dilution)
Total body bone mineral content (DXA)
Body density (Bod Pod)
Multiple direct measures
Fewest assumptions

4-compartment model
Baumgartner et al.
Fat mass (kg) =
2.05 * weight (kg) * ((1.34/Db) – (0.35 *
(TBW/weight) + (0.71624 * (bone/weight)) – 1)
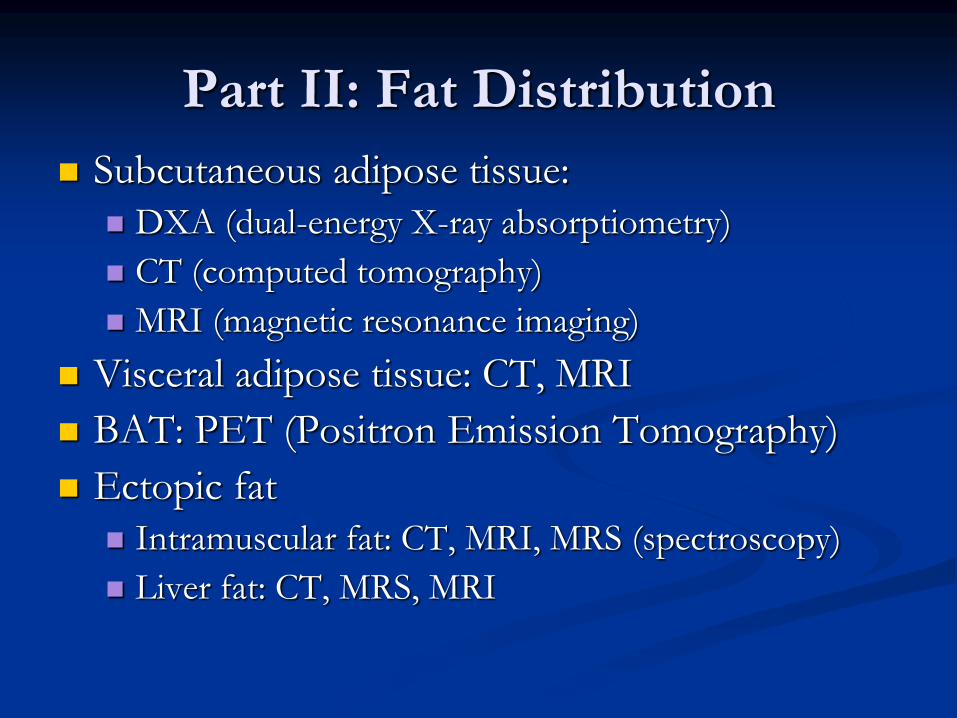
Part II: Fat Distribution
Subcutaneous adipose tissue:
DXA (dual-energy X-ray absorptiometry)
CT (computed tomography)
MRI (magnetic resonance imaging)
Visceral adipose tissue: CT, MRI
BAT: PET (Positron Emission Tomography)
Ectopic fat
Intramuscular fat: CT, MRI, MRS (spectroscopy)
Liver fat: CT, MRS, MRI

Regional body composition with
DXA
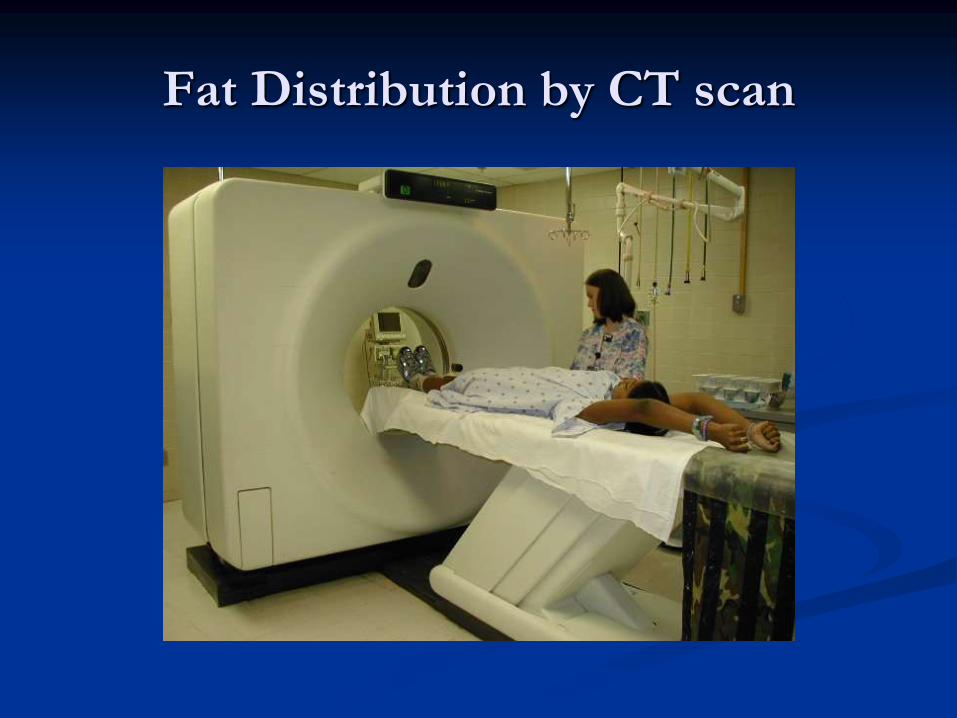
Fat Distribution by CT scan

CT Scan Image

Computed tomography scanning
Single slice X-ray; 5 mm, 2 sec
Attenuation of beam in Houndsfield units
Denser tissue = greater attenuation
Bone > Lean mass > fat mass

Computed tomography scanning
Adipose tissue = -190 to -30 HU
Muscle = 0 – 80 HU
Low-density muscle = 0 - 20 HU
Indicates lipid infiltration
High-density muscle = 21-80 HU

Skeletal Muscle Fat
Magnetic resonance spectroscopy (MRS)
1H methylene proton resonance
Intramyocellular (IMCL)
Extramyocellular (EMCL)
Magnetic resonance imaging (MRI)
Visualize fat depots
Computed tomography (CT)
Attenuation value; lower density = more fat
Biopsy
Oil red O staining; microscopy

Magnetic Resonance Spectroscopy
for IMCL

MRS Measurement
1H-MRS of right soleus
on a 4.1T magnet
IMCL – 6x6 voxel
average
Extramocellular lipid
(EMCL) – total soleus
voxel average
Normalized to an oil
phantom

MRS
IMCLEMCL
Cr
Water-suppressed 1H spectra collected with a 9.5 cm surface coil
EMCL=extramyocellular lipid; IMCL=intramyocellular lipid;
Cr=creatine.
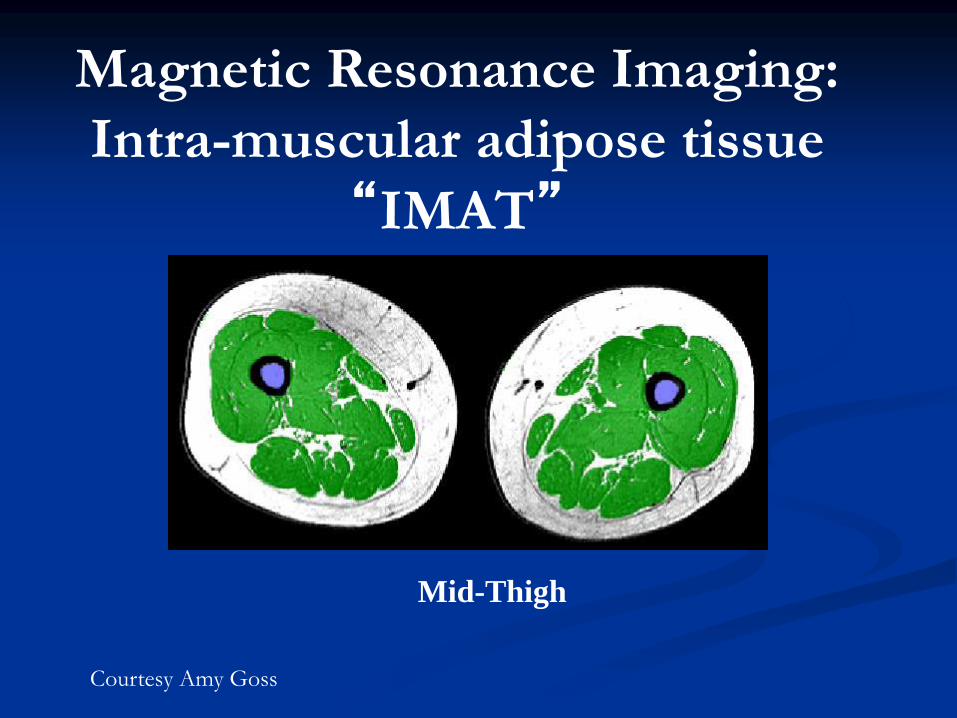
Mid-Thigh
Magnetic Resonance Imaging:
Intra-muscular adipose tissue
“IMAT”
Courtesy Amy Goss

MRI for abdominal fat
Courtesy Amy Goss

MRI for liver fat
Courtesy Amy Goss
Attenuation of 5 ROI is used as an index of liver fat

PET

PET scanning for BAT
Cold-induced BAT activity using 18F-fluorodeoxyglucose
Lee, P et al. 2012 Osteoporosis Int.

Part III: Energy Expenditure
Indirect calorimetry
Resting: Vmax ENCORE 29N Systems metabolic monitor (SensorMedics)
24-h whole room
Doubly-labelled water
Deuterium
Oxygen-18

Indirect calorimetry
Oxygen consumption
Carbon dioxide production
30-min canopy method
Resting energy expenditure
24-hour room method
Total (24-h), resting, and sleeping EE
Total includes PA and TEF

Resting Energy Expenditure Indirect Calorimetry
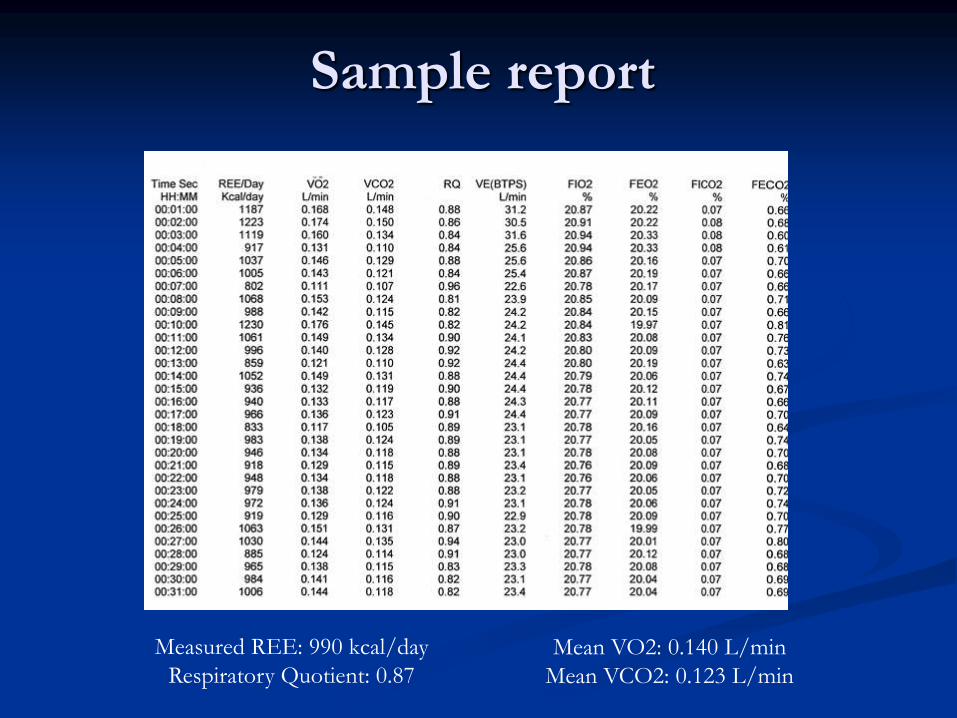
Sample report
Measured REE: 990 kcal/day
Respiratory Quotient: 0.87
Mean VO2: 0.140 L/min
Mean VCO2: 0.123 L/min

Calculation of energy expenditure
REE = [VO2 (3.94) + VCO2 (1.11)] 1440
min/day
De Weir 1949. New methods for calculating
metabolic rate with special reference to protein
metabolism. J. Physiol. Lond. 109:1-9.

24-h Energy Expenditure Room Calorimetry

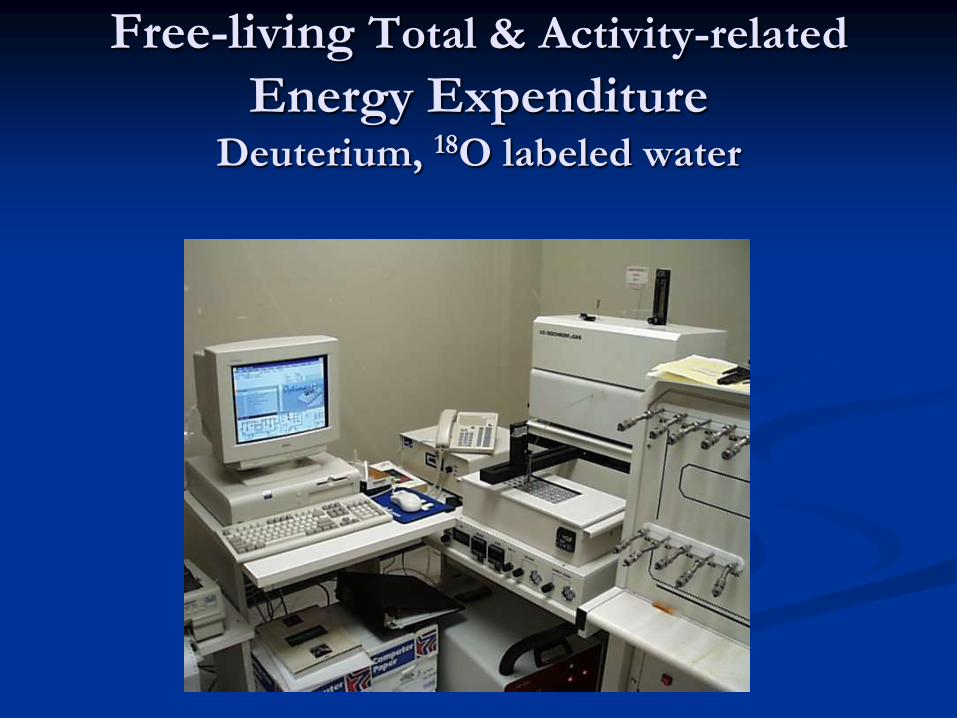
Free-living Total & Activity-related
Energy Expenditure Deuterium, 18O labeled water

Doubly-Labeled Water
Baseline urine collection
Oral dose of D2O18
Day 1 urine collection
Day 14 urine collecton
Deuterium and 18O enrichment by IRMS

Time (days) 1 14
C18O2
(oxygen)
D2O
(hydrogen)
Isotopic enrichment in urine
Baseline
enrichment
• O equilibrates between water and CO2
• Oxygen eliminated as both water and CO2
• Hydrogen eliminated only as water
• Differential=CO2 flux
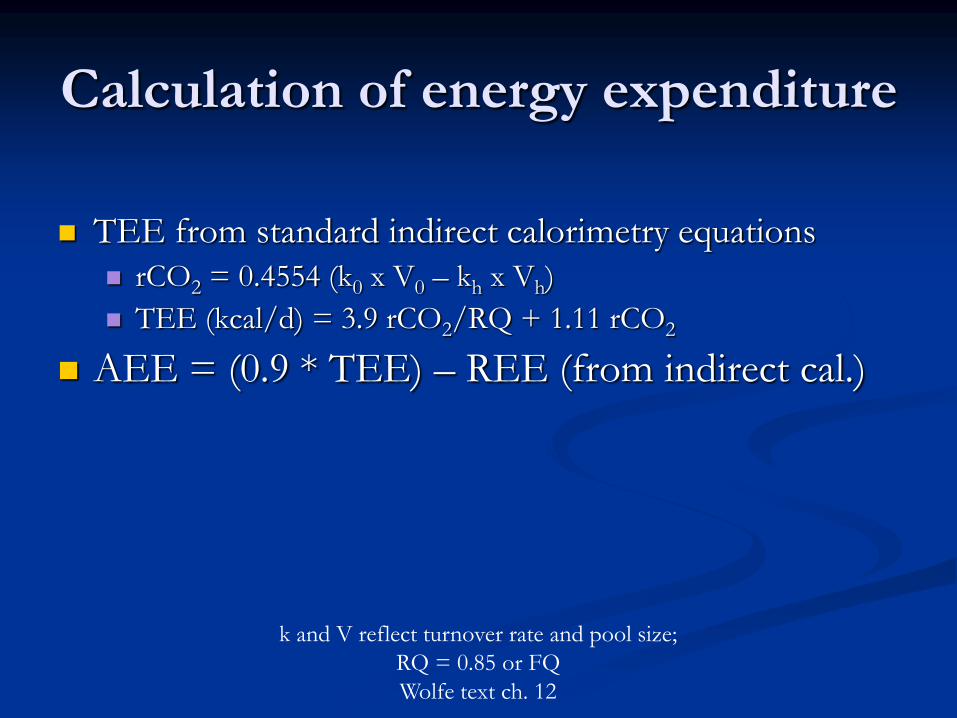
Calculation of energy expenditure
TEE from standard indirect calorimetry equations
rCO2 = 0.4554 (k0 x V0 – kh x Vh)
TEE (kcal/d) = 3.9 rCO2/RQ + 1.11 rCO2
AEE = (0.9 * TEE) – REE (from indirect cal.)
k and V reflect turnover rate and pool size;
RQ = 0.85 or FQ
Wolfe text ch. 12

Questions?