hira.hope.ac.ukhira.hope.ac.uk/id/eprint/786/1/8 (17-2)the curvature effect_in... · web viewa...
TRANSCRIPT

Running title: Preference for curvature
The curvature effect:
a comparison between preference tasks.
Letizia Palumbo and Marco Bertamini
Department of Psychological Sciences, University of Liverpool, UK
Correspondence:
Letizia Palumbo
Department of Psychological Sciences, University of Liverpool
Eleanor Rathbone Building
Bedford Street South
L69 7ZA, Liverpool, UK
Fax: +44 1517942172
Abstract
Empirical work on visual aesthetics has found a strong preference for smooth curvature. The
use of different tasks and exposures can clarify whether such a preference reflects immediate
visual responses or higher cognitive processes, such as semantic associations. In three
experiments we used abstract irregular shapes and manipulated the contour (polygons vs.
smoothed versions of polygons), but matched the stimuli for number of vertices (vertices or
curvature extrema) and number of concavities. In Experiment 1 a shape was presented for
120ms and observers produced a 2-alternative forced-choice response (like or dislike). In
Experiment 2 and 3 we used rating scales measuring liking and attractiveness respectively,
and the stimulus was presented until response. Overall smooth curved contours were
preferred over angular contours, especially with immediate responses (Experiment 1).
Moreover, shapes were preferred when contained a balance between number of vertices and
concavities (middle level of complexity). However, a preference for shapes with the highest
number of vertices and the least number of concavities occurred in the two-alternative forced
choices task (Experiment 1). In contrast, the reverse combination (star-like shapes) emerged
with rating scales (Experiment 2 and 3). We conclude that the curvature effect is stable across
tasks, although some parametric variations (vertices and concavities) related to visual
complexity introduced subtle modulations.
Keywords: shape-contour effect, forced choice responses, rating scale, preference formation,
aesthetics.
2
Introduction
It has been suggested that smoothly curved contours contain something special that is
processed as pleasant. We refer to this phenomenon as the smooth curvature effect on
preference (Bertamini, Palumbo, Gheorghes, and Galatsidas, 2015). Although it is still
debated what makes curvature special, these findings confirm Hogarth’s analysis (1973) of
the curved lines as an expression of grace and beauty. In this study we employed abstract
irregular polygons with different contours (more angular vs. curved), but matched in other
aspects. Previous work used rating scales for explicit liking (Bertamini et al., 2015) as well as
implicit indirect measures of preference, such as the Implicit Association Test and the
Manikin task (Palumbo, Ruta, and Bertamini, submitted). The main outcomes from these
studies are summarized in 4 points: (1) observers tend to like curvature, either when it forms
the contour of an abstract shape or as an element embedded within a pattern of lines; (2)
preference for curvature is present relative to angular lines, but also relative to straight lines;
(3) observers show an approach response to curved shapes and not an avoidance of angular
shapes; (4) preference for curvature is not directly linked to visual complexity (obtained by
varying the number of vertices).
Taken together these findings are in contrast with the hypothesis that angles convey a
sense of threat due to their spiky transitions and as a consequence observers tend to dislike
them (Bar and Neta, 2006; 2007). The threat hypothesis for angular stimuli is supported by
fMRI data showing a bilateral activation of the amygdala (Bar and Neta; 2007; Larson,
Aronoff, and Stearns, 2007; Larson, Aronoff, Sarinopoulos, and Zhu, 2009), which in
addition to the processing of positive emotions is also involved in the processing of fear
(Ledoux, 2003; Morris, Ohman, and Dolan, 1999). In their study Bar and Neta (2006) used
meaningful stimuli as well as abstract shapes. They presented the stimulus for a brief duration
3
(85ms) and used a two-forced choice response (“like” or “dislike”). The rational was that this
paradigm is appropriate to capture immediate responses in preference formation, namely
responses which are not mediated by higher cognitive processes. Therefore, although
participants attended to the stimulus presentation, they were not necessarily aware of how the
features of the stimulus influenced their impression. In this case preference would be directly
instantiated by low-level sensory information (Bar, 2003). They interpreted the dislike
response for angularity as an immediate “aversive” reaction to the angles as potential
“dangerous” stimuli.
More recently Vartanian et al. (2013) reported a curvature effect using a two-
alternative forced-choice task with fMRI. Observers were asked to judge whether curvilinear
or rectilinear architectural environments were ‘“beautiful” or “not beautiful”. The advantage
for curvature was confirmed with ecologically-valid stimuli from architecture and design.
Moreover, the authors found activation of the anterior cingulate cortex, which is typically
involved in the processing of emotional aspects of stimuli and reward. The effect of curvature
in interior design applies also to cars (Leder and Carbon, 2005) and across the last two
decades car design has moved towards more curvilinear appearance. However, in the
Vartanian’s study the stimuli were presented for a long duration (3sec). Therefore it is
difficult to ascribe such as a preference solely to the visual properties of the stimuli. In the
study by Leder and Carbon (2005) observers judged attractiveness using a rating scale.
So far the results on the curvature effect were obtained with different class of stimuli
and with different procedures. The main focus of the present work was to compare the use of
a two-alternative forced-choice response (“like” or “dislike”) with the use of rating scales to
measure preference for the same abstract shapes. The aim is to disentangle the role played by
immediate visual responses and by higher cognitive processes in preference formation.
4
The current study: preference for curvature comparing different tasks
In the current study the curvature effect was tested using abstract irregular shapes,
which varied in terms of contour (angular vs. curved), but were matched for number of
vertices and concavities. We used abstract stimuli because they minimise the role of valance,
familiarity or semantic meaning (see Leder, Tinio, and Bar 2011). Three experiments were
performed: in Experiment 1 the shape was presented for 120ms and observers performed a
forced-choice response (like or dislike). In Experiment 2 and 3 we used rating scales
measuring liking and attractiveness respectively, and the stimulus was presented until
response. This comparison would inform whether these two concepts measure the same
aesthetic dimension. For instance, attractiveness also defined as “appealing to the senses”
might be associated to arousal or arousing interest in aesthetics (Berlyne, 1974).
There were two research aims. The first aim was to compare the curvature effect
using the same stimuli but three different tasks. This will test the robustness of the effect and
also whether the same parameters affect all types of responses. Bertamini et al. (2015; see
also Palumbo et al., submitted) found a preference for curvature using explicit (rating scales)
and implicit (indirect measure of preference) measures. They concluded that this effect did
not derive from a dislike for angularity. We reasoned that liking should increase for shapes
with a “blobby” appearance (i.e. fewer vertices or concavities). Conversely, liking should
decrease for shapes with a “spikier” appearance (i.e. more vertices or concavities). However,
if a modulation of the number of vertices or concavities occurs only for curved shapes then
this would strengthen the claim that smooth curvature is preferred because it is visually
pleasant.
The second research question relates to visual complexity. Different number of
vertices and concavities affect visual complexity and complexity can modulate aesthetic
evaluations (Nadal, Munar, Marty, and Cela-Conde, 2010). Typically observers prefer
5
low/middle levels of visual complexity when this concerns details, amount of information to
process or arousal (Berlyne, 1970; 1974), especially for naïve observers (Silvia and Barona,
2009). A recent study by Friedenberg and Bertamini (2015) showed that irregular polygons
with more concavities were rated as more attractive. This result suggests a preference for
greater complexity but the polygons used were extremely simple.
To our knowledge, this is the first attempt to study the curvature effect by comparing
different explicit responses. This is important to understand the underlying processes of
preference formation. Moreover, it has relevant implications for the empirical study of the
Art as similar processes are likely to apply to other aesthetics dimensions.
Experiment 1. Curved or angular shapes: thumbs up or thumbs down?
In Experiment 1 we tested immediate liking responses. Each shape was flashed on the
screen for 120ms. Participants indicated if they liked the shape or if they disliked it by
pressing one of two buttons. A specific feature of this study is that we varied the number of
vertices so that for each contour type (curved or angular) there were three sets of vertices (10,
20 and 30). Moreover, for each set the relative percentage of convexities and concavities was
varied. Concavities were 30%, 40% or 50%. For instance for 30 vertices the concavities were
either 9, 12, or 15. Therefore, depending on the combination of numbers of vertices and
concavities the shapes were more angular or rounded. We formulated two predictions.
We reasoned that if the curvature is preferred for its configuration then we expect the
number of liking responses to increase for shapes with a “blobby” appearance (i.e. fewer
vertices and fewer concavities), especially if the combination of vertices and concavities
would only modulate the liking response for smooth curvature. An alternative prediction is
based on visual complexity. In line with a recent study using polygons we expected that the
6
most preferred shapes would be those with more concavities (Friedenberg and Bertamini,
2015).
Method
Participants. Twenty-four participants took part in the experiment (age range: 19 –
23, average age 19.9 years, 19 females; 4 left handed). All participants had normal or
corrected to normal vision. They provided a written consent for taking part and received
course credits. The experiment was approved by the Ethics Committee of the University of
Liverpool and was conducted in accordance with the Declaration of Helsinki (2008).
Stimuli and apparatus. Stimuli consisted of irregular shapes with a black contour of
0.5 px and a grey fill. The outline could be curved or angular (straight edges). Stimuli and
experiment were created using python and Psychopy (Peirce, 2007). The stimuli were
generated starting from polygons that were based on sampling points along a function.
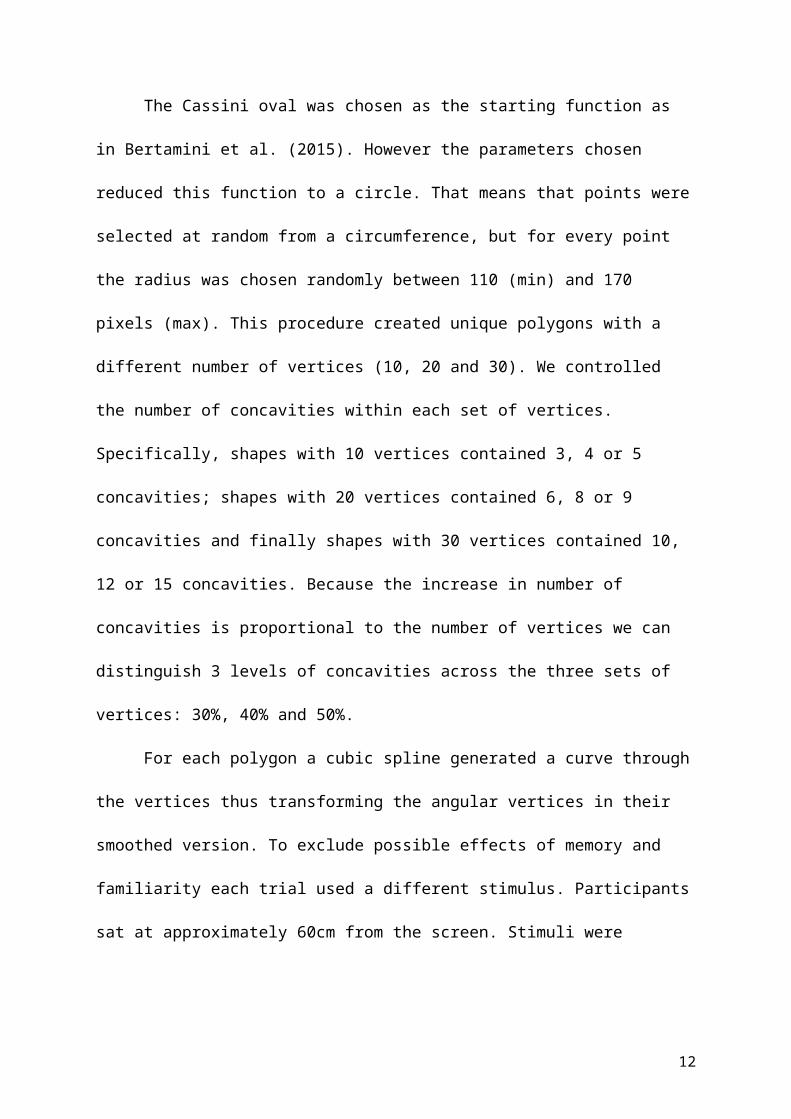
The Cassini oval was chosen as the starting function as in Bertamini et al. (2015).
However the parameters chosen reduced this function to a circle. That means that points were
selected at random from a circumference, but for every point the radius was chosen randomly
between 110 (min) and 170 pixels (max). This procedure created unique polygons with a
different number of vertices (10, 20 and 30). We controlled the number of concavities within
each set of vertices. Specifically, shapes with 10 vertices contained 3, 4 or 5 concavities;
shapes with 20 vertices contained 6, 8 or 9 concavities and finally shapes with 30 vertices
contained 10, 12 or 15 concavities. Because the increase in number of concavities is
proportional to the number of vertices we can distinguish 3 levels of concavities across the
three sets of vertices: 30%, 40% and 50%.
7
For each polygon a cubic spline generated a curve through the vertices thus
transforming the angular vertices in their smoothed version. To exclude possible effects of
memory and familiarity each trial used a different stimulus. Participants sat at approximately
60cm from the screen. Stimuli were presented on a CTX Vl 950T 19" CRT monitor (1600 X
1200 at 75Hz).
Figure 1. Experiment 1: Examples of the stimuli. These are chosen to illustrate the conditions, in the experiment
each trial presented a different shape. Panel A: Angular polygons with Vertices (10, 20, 30) and Concavity
(30%, 40%, 50%). Panel B: Curved polygons with Vertices (10, 20, 30) and Concavity (30%, 40%, 50%).
Procedure. A 2x3x3 within-subjects design was employed with Contour (angular vs.
curved), Vertex (10 vs. 20 vs. 30) and Concavity (30%, 40%, 50%) as the within-subjects
factors.
Each trial started with a fixation cross which was presented at the centre of the screen
for 500ms. The shape was presented for 120ms, and masked by a grey rectangle that covered
8

the whole shape for 120ms. As soon as the shape disappeared participants needed to indicate
whether they liked or disliked it (see figure 2). Half of participants pressed key “A” for liking
and key “L” for disliking on a keyboard. The response mapping was reversed for the other
half of the sample. Participants were instructed to give the response as fast as possible. The
experiment started with a practice block (8 trials) followed by 162 experimental trials
randomized within one block. The experiment took 15 minutes to complete.
Figure 2. Experiment 1: The structure of a trial.
Data analysis
The data were analyzed with a repeated measures ANOVA. The dependent variable
was the proportion of liking responses out of the total amount of responses (like/like +
dislike). The Greenhouse-Geisser correction was applied if sphericity was not assumed.
Results
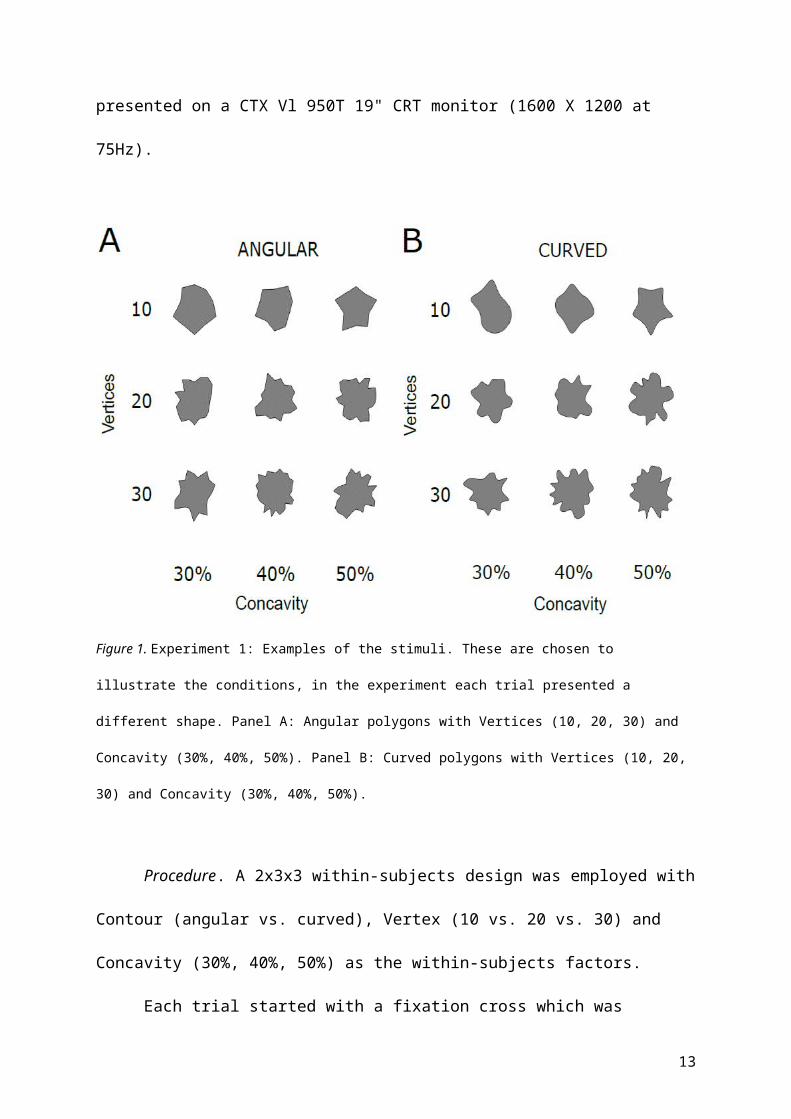
Results are illustrated in Figure 3. The ANOVA confirmed a main effect of Contour
(F(1, 23) = 47.94, p= .000 ηp2 = .676), meaning that the proportion of liking responses was
9
higher for curved shapes (M=.74, SD=.04) as compared to angular ones (M=.31, SD=.04).
All the other main effects were not significant.
Importantly, the interaction Contour by Vertex was statistically significant (F(2,
46)=7.02, p=.002 ηp2 =.234). Post-hoc analyses revealed that the curved shape with 10 vertices
were preferred over those with 20 or 30 vertices (10 vs. 20: t(1,23)=3.19, p=.004; 10 vs. 30:
t(1,23)=2.78, p=.01). Therefore, as predicted, for the curved shapes the majority of liking
responses were found for the shapes with a more “blobby” appearance (10 vertices: M=.80,
SD=.04; 20 vertices: M=.74 , SD=.04 ; 30 vertices: M=.67, SD=.05). Crucially, there was no
modulation of the number of vertices on the liking response for the angular shapes (10
vertices: M=.31, SD=.05; 20 vertices: M=.29, SD=.04; 30 vertices: M=.33, SD=.05) (all
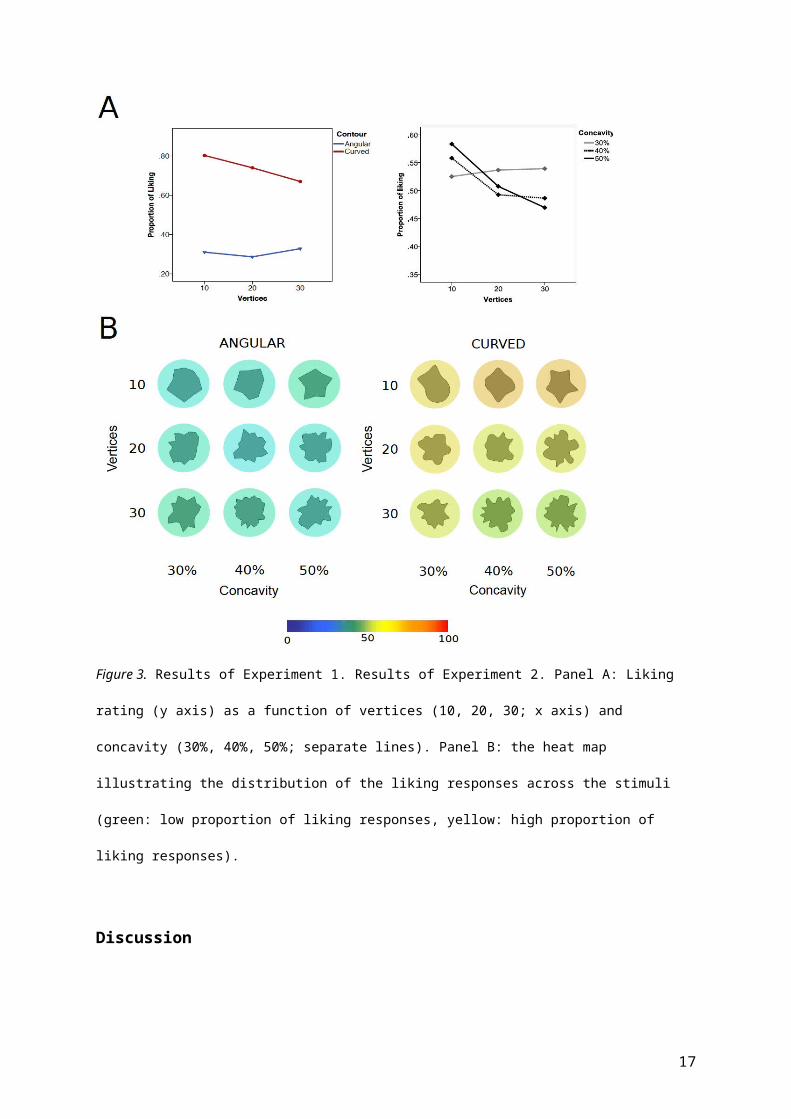
ps>.05). This is visually illustrated in the heat map that shows changes of colour according to
the distribution of the proportion of liking responses (Figure 3, panel B).
The two-way interaction of Vertices by Concavity was significant (F(2, 46)=3.77,
p=.007 ηp2 =.141). In both curved and angular conditions when the shapes contained 30
vertices observers preferred 30% as compared to 50% concavities (t(1,23)=2.21, p=.031). All
other interactions were not significant. Finally it is worth to mention that responses (in sec)
for the curved shapes (M=.51, SD=.18) were faster compared to responses for the angular
shapes (M=.55, SD=.20) (t(1,23)=3.30, p=.003).
10

Figure 3. Results of Experiment 1. Results of Experiment 2. Panel A: Liking rating (y axis) as a function of
vertices (10, 20, 30; x axis) and concavity (30%, 40%, 50%; separate lines). Panel B: the heat map illustrating
the distribution of the liking responses across the stimuli (green: low proportion of liking responses, yellow:
high proportion of liking responses).
Discussion
The use of a forced-choice procedure in Experiment 1 confirmed the well-established
and systematic preference for curved shapes. In addition, the combination of different
numbers of vertices and concavities revealed interesting interaction effects. The proportion of
liking responses increased for the shapes with fewer vertices as compared to those with more
11
vertices. This suggests that preference for curvature is related to the amount of smoothness in
the shape. As predicted, the modulation of number of vertices only occurred for smooth
curvature, in other words it did not influence preference for the angular shapes. This finding
does not support the threat hypothesis related to angles (Bar and Neta, 2006; 2007). If angles
signals a threat than this should be more evident with shapes containing more vertices (as
they would appear spikier). The other interaction effect between vertices and concavities
suggests that when shapes contain many vertices (and therefore are perceived as more
complex, see Bertamini et al. 2015) observers tend to appreciate them more if they contain
fewer concavities. In line with Berlyne’s model this result can be read as a tendency of the
observers to prefer shapes with a balanced/middle level of complexity.
Experiment 2. Liking responses on the rating scale
In Experiment 2 we tested the same hypotheses using the same stimuli as for
Experiment 1, but a different task. Here the shapes were displayed until participants provided
a response on a scale ranging from 0=dislike to 100=like. The comparison between the two
tasks is important. In a forced choice task the liking response is immediate and perhaps based
on basic sensory information. In contrast the use of a rating scale could reflect a response
mediated by higher order cognitive factors. We cannot exclude that these two ways of
measuring preference might reveal some inconsistency, although we predict that differences
will be small.
Method
Participants. Sixteen participants took part in the experiment (age range: 18 – 40, average
age 20.8 years, 13 females; 2 left handed). All participants had normal or corrected to normal
12
vision. They provided a written consent for taking part and received course credits. The
experiment was approved by the Ethics Committee of the University of Liverpool and was
conducted in accordance with the Declaration of Helsinki (2008).
Stimuli and apparatus. The stimuli and the apparatus were the same as for Experiment 1.
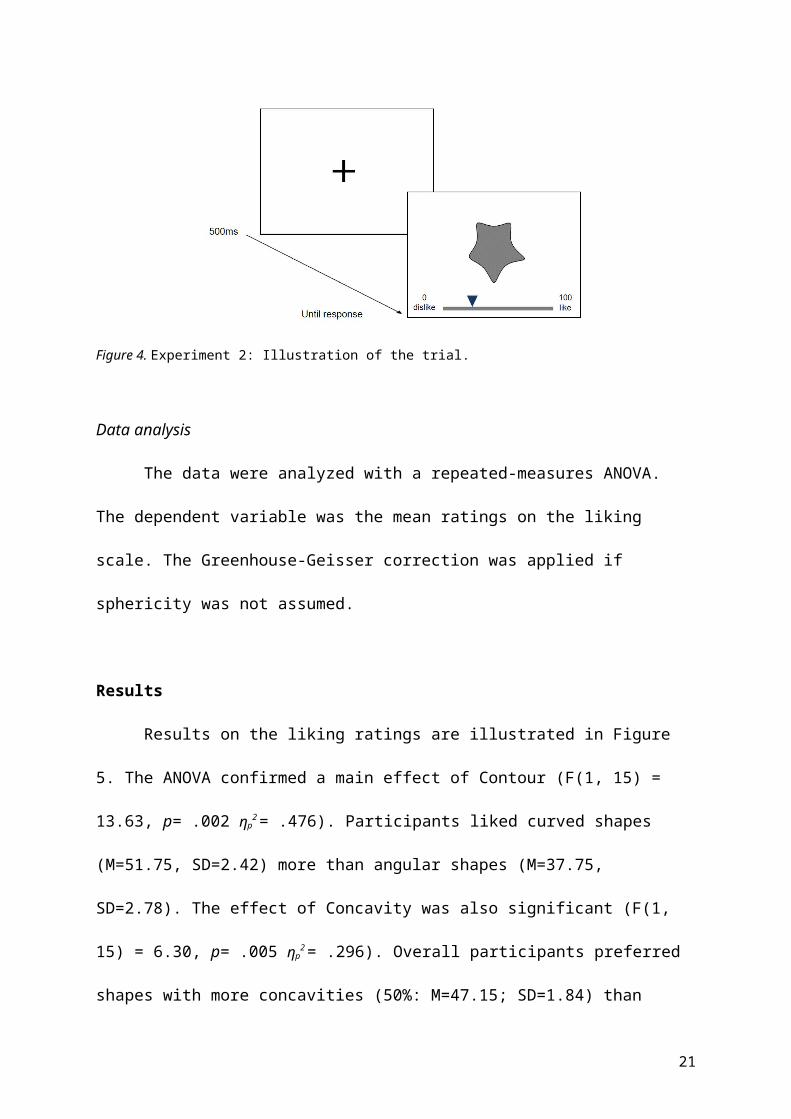
Experimental Design and Procedure. The experimental design was the same as for
Experiment 1. Each trial started with a fixation cross which was presented at the centre of the
screen for 500ms. Following the shape was displayed and remained on screen until
participants expressed how much they liked the pattern using a rating scale (0=dislike to
100=like), see Figure 4. The experiment started with a practice block (8 trials) followed by
162 experimental trials randomized within one block. The experiment lasted 20 minutes.
Figure 4. Experiment 2: Illustration of the trial.
Data analysis
The data were analyzed with a repeated-measures ANOVA. The dependent variable
was the mean ratings on the liking scale. The Greenhouse-Geisser correction was applied if
sphericity was not assumed.
13

Results
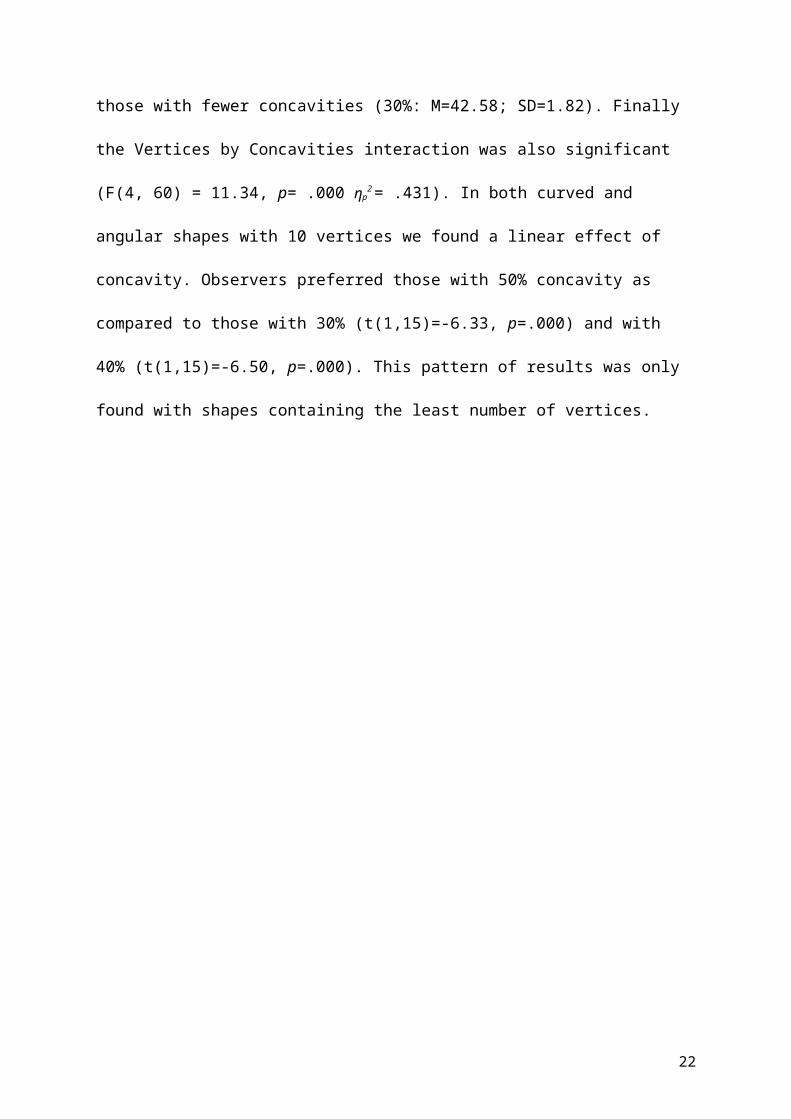
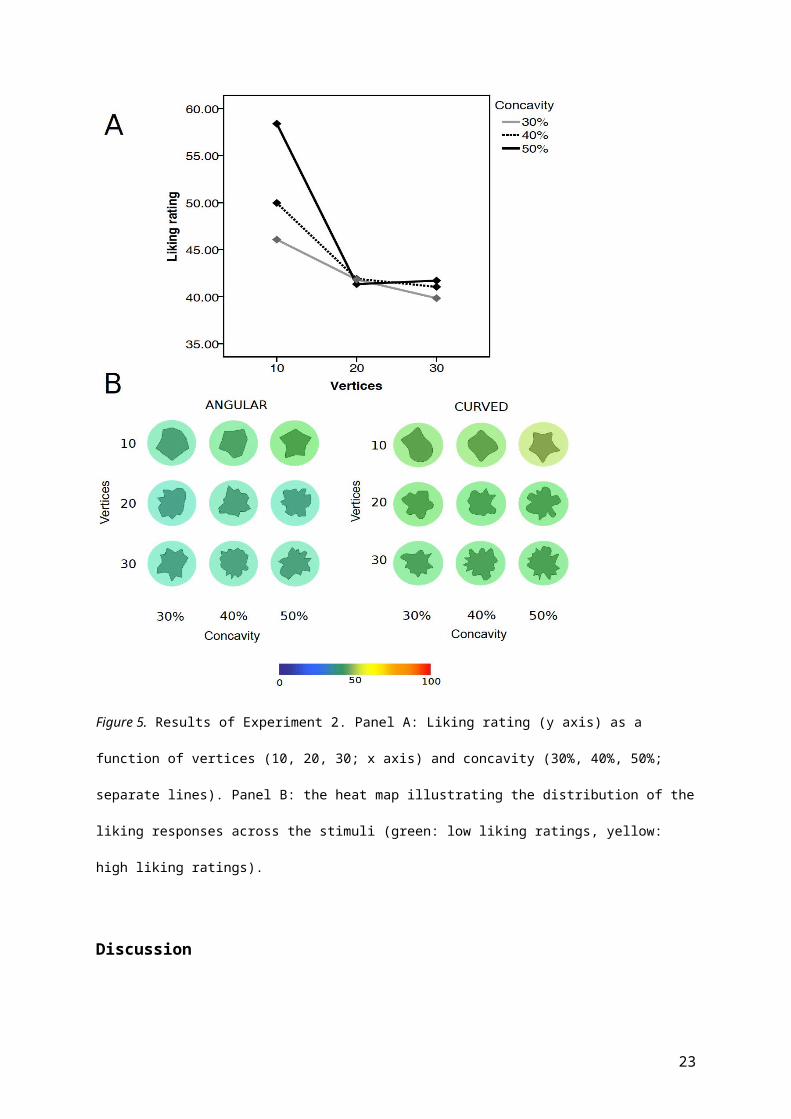
Results on the liking ratings are illustrated in Figure 5. The ANOVA confirmed a
main effect of Contour (F(1, 15) = 13.63, p= .002 ηp2 = .476). Participants liked curved shapes
(M=51.75, SD=2.42) more than angular shapes (M=37.75, SD=2.78). The effect of
Concavity was also significant (F(1, 15) = 6.30, p= .005 ηp2 = .296). Overall participants
preferred shapes with more concavities (50%: M=47.15; SD=1.84) than those with fewer
concavities (30%: M=42.58; SD=1.82). Finally the Vertices by Concavities interaction was
also significant (F(4, 60) = 11.34, p= .000 ηp2 = .431). In both curved and angular shapes with
10 vertices we found a linear effect of concavity. Observers preferred those with 50%
concavity as compared to those with 30% (t(1,15)=-6.33, p=.000) and with 40% (t(1,15)=-
6.50, p=.000). This pattern of results was only found with shapes containing the least number
of vertices.
14
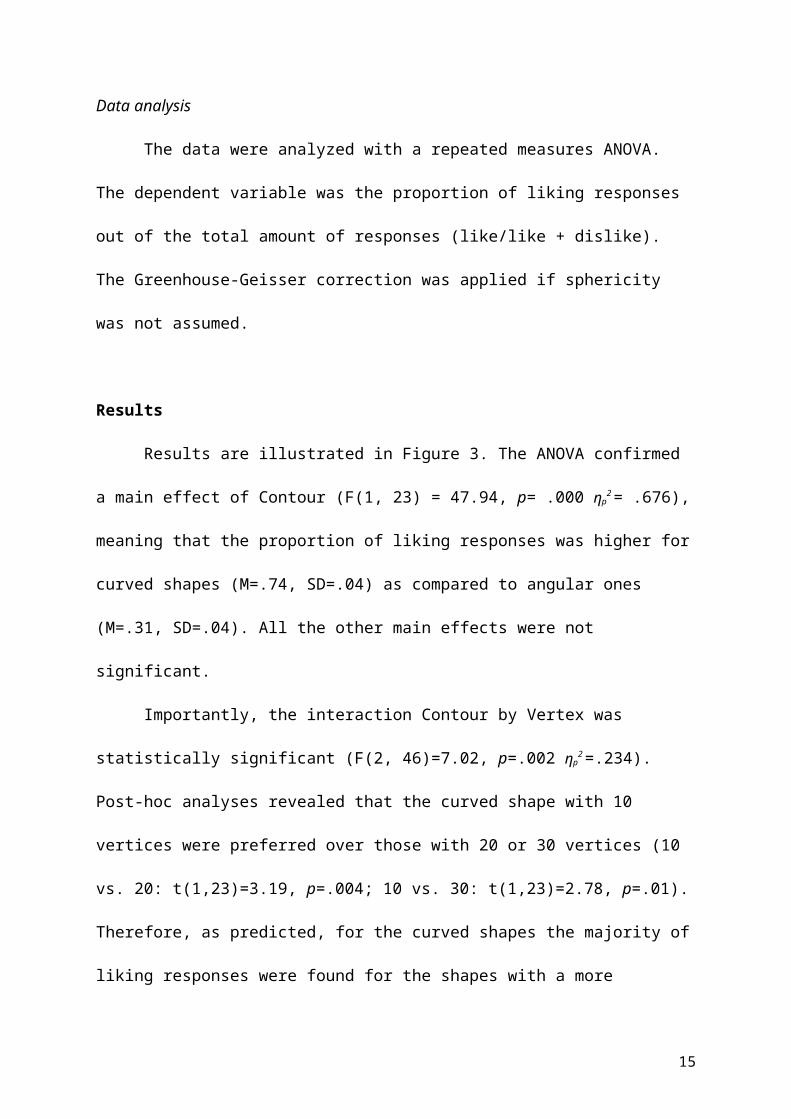
Figure 5. Results of Experiment 2. Panel A: Liking rating (y axis) as a function of vertices (10, 20, 30; x axis)
and concavity (30%, 40%, 50%; separate lines). Panel B: the heat map illustrating the distribution of the liking
responses across the stimuli (green: low liking ratings, yellow: high liking ratings).
Discussion
The results of Experiment 2 partially overlap those found in Experiment 1. The
curvature effect was confirmed, although with the two-alternative forced-choice task
(Experiment 1) the effect was stronger. Possible explanations are reported in the general
discussion as they also apply to Experiment 3.
15

As in Experiment 1 the interaction of vertex by concavity was significant in
Experiment 2. However, the direction of the effect is slightly different. In Experiment 2 the
most preferred shapes were those with the least number of vertices (10) and the most number
of concavities (50%). Looking at panel B in Figure 5, this cluster of shapes can be defined as
“star-like” shapes (Friedenberg and Bertamini, 2015). In contrast, Experiment 1 showed a
preference for shapes with the reverse vertices-concavity combination, although a (no-
significant) tendency for a star-like effect was present also in Experiment 1 (see the heat map
in Figure 3). Why did the star-like shape effect emerge more prominently in Experiment 2? It
is possible that the number of vertices was not per se playing a major role in determining the
liking rates. It seems that participants appreciated more subtle changes and differences
conveyed by the concavity factor as reflected by the main effect of concavity, which was
found only in Experiment 2.
Overall in terms of visual complexity the results of the two experiments go hand in
hand: observer preferred middle levels of complexity, whether this was generated by
increasing the number of vertices (Experiment 1) or the number of concavities (Experiment
2).
Experiment 3. Attractiveness responses on the rating scale
In Experiment 3, all the parameters and stimuli were the same as for Experiment 2,
with the exception that we used a rating scale measuring attractiveness instead of liking. This
was done to clarify whether the liking response can be ascribed to the concept of
attractiveness and vice versa. Assuming the link between attractiveness and arousal, it is
plausible that more complex shapes might increase attractiveness rating (Friedenberg and
Bertamini, 2015). The use of abstract, meaningless stimuli, which prevent memory or
16
familiarization effects, might shed light on this issue. If the results of Experiment 2 and 3
overlap than these two scales may measure the same underlying response.
Method
Participants. Sixteen participants took part in the experiment (age range: 18 – 24,
average age 20.4 years, 11 females; 2 left handed). All participants had normal or corrected to
normal vision. They provided a written consent for taking part and received course credits.
The experiment was approved by the Ethics Committee of the University of Liverpool and
was conducted in accordance with the Declaration of Helsinki (2008).
Stimuli and apparatus. The stimuli and the apparatus were the same as for the
previous experiments.
Experimental Design and Procedure. The experimental design and the procedure
were similar as for Experiment 2. The only exception concerned the task. Participants were
asked to rate attractiveness instead of liking for each shape, using a similar scale
(0=unattractive to 100=attractive), see Figure 4.
Data analysis.
A repeated-measures ANOVA with Shape (Angular vs. Curved), Vertices (10 vs. 20
vs. 30) and Concavities (30%, 40%, 50%) as the within-subjects factors was performed on
the attractiveness rates.
Results
Results are illustrated in Figure 6. The ANOVA reported a main effect of Contour
17

(F(1, 15) = 10.86, p= .005 ηp2 = .420), reflecting the curvature effect (curved contour:
M=50.36, SD=4.43; angular contour (M=33.51, SD=3.86). All the other main effects were
not significant. The interaction Vertices by Concavity was significant (F(4, 60) = 9.31,
p= .000 ηp2 = .383. In both curved and angular shapes with 10 vertices we found a linear effect
of concavity. Observers preferred 50% concavities as compared to 30% (t(1,15)=-3.22,
p=.006) and with 40% (t(1,15)=-3.24, p=.005). This result reflects the star-like effect (see the
heat map in Figure 6, panel B). All other two-way interactions were not significant.
Finally the three-way interaction Contour by Vertices by Concavities was significant
(F(4, 60) = 4.71, p= .002 ηp2 = .239). For both angular and curved shapes the most attractive
were those with 10 vertices and 50% concavities (the star-like effect). However, this effect
appeared clearer for the angular shapes than for the curved ones. For the other two levels of
vertices (20, 30), concavity influenced the attractiveness response in a slightly different way
depending on the shape (see the heat map in Figure 6).
18

Figure 6. Results of Experiment 3. Liking rating (y axis) as a function of vertices (10, 20, 30; x axis) and
concavity (30%, 40%, 50%; separate lines). Panel B: the heat map illustrating the distribution of the liking
responses across the stimuli (green: low attractiveness ratings, yellow: high attractiveness ratings).
Discussion
Experiment 3 assessed whether asking observers to rate attractiveness instead of
liking would generate the same pattern of results as found in Experiment 2. The answer is
19

that there is a clear similarity in the two outcomes, although with the attractiveness scale we
found a more complex pattern. The main finding is that, similarly to what we found with the
liking response, curved shapes were rated as more attractive than the angular shapes. Another
result concerns the star-like effect: observers found the shapes with fewer vertices and more
concavities as more attractive. In both Experiment 2 and 3 this effect was significant. Finally
the more complicated three-way interaction found with the attractiveness scale might be
explained by a less clear definition of attractiveness as compared to the definition of liking
which is reflected in more variability in the data.
General discussion
In empirical aesthetics the preference for smooth curvature is a phenomenon which
has been confirmed with a variety of visual stimuli from abstract meaningless shapes or
patterns (Bertamini et al., 2015; Silvia and Barona, 2009) to more articulated displays such as
pictures or drawings of interior design spaces (Leder and Carbon, 2005; Vartanian et al.,
2013) or even familiar objects (Bar and Neta, 2006). The majority of these studies made use
of different explicit measures of preference. For example, Bertamini et al. (2015) used mainly
rating scales of liking; Leder and Carbon (2005) also used a rating scale measuring
attractiveness. Vartanian et al. (2013) opted for a two-alternative forced-choice response on
beauty, similarly Bar and Neta (2006) used a two-alternative forced-choice response on
liking.
Although preference for curvature over angularity was consistent across these studies
there were some claims about the critical importance of the procedure. Bar and Neta (2006)
highlighted the importance of using brief presentations and forced-choice responses to
examine immediate gut reactions. This would minimise effects of cognitive processes on
20
preference formation. The authors described the angles as primitives as they can be extracted
quickly from the image.
However, the use of such methodology is not always feasible, especially when the
stimulus material entails complex scenes. The general aim of the current study was to verify
whether in the preference formation for curvature, forced-choice response methods differ
from rating scales, and whether it matters whether the question is about liking or about
attractiveness.
In Experiment 1 we presented abstract curved or angular shapes for a short duration
(120ms) and observers indicated whether they liked or disliked each shape. The polygons
varied in terms of number of vertices (10, 20 and 30) and concavities (30%, 40% and 50%).
In Experiment 2 we used the same stimuli but participants indicated how much they liked
each shape on a visual scale ranging from 0=dislike to 100=like. The stimuli were on screen
until participant provided the response. Finally Experiment 3 had the same procedure of
Experiment 2 with the exception that we asked participants to rate attractiveness.
In relation to the shapes used in our design, the combination of number of vertices and
concavities allowed us to test two important issues on preference for smooth curvature.
The first one relates to the question whether observers like curvature or dislike
angularity. More precisely we verified (1) whether curvature is preferred even more when its
appearance becomes more rounded (i.e. fewer vertices and concavities); (2) whether the
angular shapes are disliked more when they appear “spikier” (i.e. more vertices and
concavities); or whether only (1) or (2) would occur. This would clarify if smooth curvature
is preferred for its visual properties (Bertamini et al., 2015; Palumbo et al., submitted) and to
what extent the threat hypothesis related to angles is a plausible explanation for liking curved
objects (Bar and Neta, 2006; 2007). The second aspect relates to visual complexity. The
shapes with more vertices and concavities presented a complex configuration (Bertamini et
21
al., 2015). One prediction is that observers prefer shapes middle levels of complexity
(Berlyne, 1970). However, Friedenberg and Bertamini (2015) found that observers rated the
shapes with more concavities as the most attractive ones.
We start with the discussion of the first issue. In all three experiments we found that
curved shapes were preferred. This confirmed previous reports (Bar and Neta, 2006, 2007;
Bertamini et al., 2015; Friedenberg and Bertamini, 2015; Leder and Carbon, 2005; Vartanian
et al., 2013). However there were some differences across experiments. As shown in the heat
map, the strength of preference in Experiment 1 (forced-choice task) was higher in
comparison to Experiments 2 and 3 (liking and attractiveness ratings respectively) (see
Figures 3, 5 and 6, panel B). There are two possible explanations for this. The first one
concerns the nature of forced-choice response methods: the lack of middle range selection
boosts the preference response. The second concerns statistical power, as in Experiment 2
and 3 we tested fewer participants. However, this explanation is unlikely. In previous studies
(see Bertamini et al., 2015) we tested the same number of participants as in Experiment 1,
with the same scale and similar stimuli and the liking ratings (and effects sizes) were similar
to those reported in Experiment 2 and 3. Therefore there is consistency across experiments
using the rating scales. What is interesting is that only the preference for curvature was more
enhanced in Experiment 1 (0.74; SD=.04) than in Experiment 2 (51.75; SD=2.42) and
Experiment 3 (50.36; SD=4.43). In contrast the dislike for angularity was similar across
experiments. This suggests that when participants are forced to select between two options, it
is curvature that drives their response. This is consistent with the finding that participants
tend to approach curved shapes and not to avoid angular ones (Palumbo et al., submitted).
Another interesting effect was that in Experiment 1 number of vertices or concavities only
mattered for curved shapes (see point 2 in the predictions section). Together these results
confirm a preference for curvature based on visual structure.
22
The second issue concerned the combined effect of vertices and concavities. In
Experiment 1 observers preferred shapes containing the highest number of vertices (30) with
the least number of concavities (30%). In line with Friedenberg and Bertmini (2015), in
Experiment 2 as well as in Experiment 3, we obtained a star-like effect: observers liked more
the shapes with less vertices (10) but only if they contained more concavities (50%). Despite
this difference on preference for shape-configuration across tasks, which requires further
investigation, these results confirm a preference for shapes with a balance between number of
convexities and concavities. Overall these data support previous evidence for an inverted U-
shape relation between visual complexity and preference (Berlyne, 1970).
Finally we found some isolated effects that should be interpreted with caution. For
example, the effect of concavity was only present in Experiment 2. The shapes with more
concavities were liked more than those with fewer concavities independently of type of
contour or number of vertices. The fact that this result was only found with the liking scale is
surprising in relation to Friedenberg and Bertmini’s study, where the effect on polygons was
found using an attractiveness scale. More investigations are needed to shed light on this issue.
Conclusions
Preference for smooth curvature was confirmed using irregular abstract shapes with
different procedures (forced-choice task on liking with brief presentation, and rating scales on
liking and attractiveness with longer presentation). Overall the results across experiments
confirmed the preference for smooth curvature, and this was most evident with immediate gut
reactions (Experiment 1). The combination of number of vertices and concavities revealed
that shapes with a balanced number of vertices and concavities (middle level of complexity)
were preferred across tasks. However, a preference for more concavities (star-like shapes)
emerged only with the use of rating scales (Experiment 2 and 3). We conclude that the
23
curvature effect is stable across tasks, and that parametric manipulations of complexity
produce small but interesting effects. In particular more concavities within smooth shapes
introduce more changes in curvature (and higher curvature magnitude) which decrease liking,
Acknowledgements
This work was supported by the Economic and Social Research Council (ESRC, Ref.
ES/K000187/1)
24

References
Bar, M. (2003). A cortical mechanism for triggering top-down facilitation in visual object
recognition. Journal of Cognitive Neuroscience, 15, 600-609.
Bar, M. and Neta, M. (2006). Humans Prefer Curved Visual Objects. Psychological Science,
17(8), 645-648.
Bar, M. and Neta, M. (2007). Visual elements of subjective preference modulate amygdala
activation. Neuropsychologia, 45(10), 2191-2200.
Berlyne, D. E. (Ed.). (1974). Studies in the new experimental aesthetics: steps toward an
objective psychology of aesthetic appreciation. London:Wiley.
Berlyne, D. E. (1970). Novelty, complexity, and hedonic value. Perception and
Psychophysics, 8, 279-286.
Bertamini, M. Helmy M.S. and Bates, D. (2013). Attention is allocated preferentially to
corners of surfaces (not just locations near a corner). Attention, Perception and
Psychophysics, 75, 1748-1760.
Bertamini, M., Palumbo, L., Gheorghes, T. N., and Galatsidas, M. (in press). Do observers
like curvature or do they dislike angularity? British Journal of Psychology.
Cole, G. G., Skarratt, P. A., and Gellatly, A. R. H. (2007). Object and spatial representations
in the corner enhancement effect. Perception and Psychophysics, 69, 400-412.
Friedenberg, J. and Bertamini, M. (2015). Contour Variation and Perceived Attractiveness of
Polygon Shape. Empirical Studies of the Art.
Gómez-Puerto, G., Munar, E., Acedo, C., and Gomila, A. (2013). Is the human initial
preference for rounded shapes universal? Preliminary results of an ongoing cross-
cultural research. Perception, 42, ECVP Abstract Supplement, 102.
Hogarth, W. (1753). The analysis of Beauty: written with a view of fixing the fluctuating.
Ideas of Taste, London: Reeves.
25
Larson, C. L., Aronoff, J., Sarinopoulos, I. C., and Zhu, D. C. (2009). Recognizing threat: A
simple geometric shape activates neural circuitry for threat detection. Journal of
cognitive neuroscience, 21(8), 1523-1535.
Larson, C.L., Aronoff, J., and Stearns, J. (2007). The shape of threat: Simple geometric forms
evoke rapid and sustained capture of attention. Emotion, 7, 526- 534.
Leder, H., and Carbon, C. C. (2005). Dimensions in Appreciation of Car Interior Design.
Applied Cognitive Psychology, 19, 603-618.
Leder, H., Tinio, P. P., and Bar, M. (2011). Emotional valence modulates the preference for
curved objects. Perception, 40(6), 649.
Ledoux, J. (2003). The Emotional Brain, Fear, and the Amygdala. Cellular and Molecular
Neurobiology, 23 (4/5), 727–38.
Morris, J. S., Ohman, A., Dolan, R. J. (1999). A Subcortical Pathway to the Right Amygdala
Mediating ‘Unseen Fear’. Proceedings of the National Academy of Sciences, 96(4),
1680–5.
Nadal, M., Munar, E., Marty, G., and Cela-Conde, C. J. (2010). Visual complexity and
beauty appreciation: explaining the divergence of results. Empirical Stud Arts 28, 173–
191. doi: 10.2190/EM.28.2.d
Palumbo, L., Gheorghes, T. N., Galatsidas, M., Bertamini, M. (2014). Do observers like
curvature or do they dislike angularity? International Association of Empirical
Aesthetics (IAEA). New York, USA. 22-24 August.
Palumbo, L., Ruta, N., Bertamini, M. Comparing angular and curved shapes in terms of
implicit associations and approach/avoidance responses. Manuscript submitted.
Silvia, P. J., and Barona, C. M. (2009). Do people prefer curved objects? Angularity,
expertise, and aesthetic preference. Empirical studies of the arts, 27, 25-42.
26
Vartanian, O., Navarrete, G., Chatterjee, A., Brorson Fich, L., Leder, H., Modroño, C., Nadal,
M., Rostrup, N., and Skovi, M. (2013). Impact of contour on aesthetic judgments and
approach-avoidance decisions in architecture. PNAS, 110, 10446-10453.
27