high-precision measurement of electronic stopping powers for heavy ions using high-resolution...
TRANSCRIPT

High-precision measurement of electronic stopping powersfor heavy ions using high-resolution time-of-flight
spectrometry
Yanwen Zhang *
Division of Ion Physics, �AAngstr€oom Laboratory, Uppsala University, Box 534, SE-751 21 Uppsala, Sweden
Received 14 March 2002
Abstract
A new technical and analysis approach based on using time-of-flight (ToF) to determine energy loss has been de-
veloped and used to improve the precision of measuring heavy-ion electronic stopping powers from a continuous energy
spectrum of particles provided by a typical elastic recoil detection analysis geometry. The particle energies entering and
exiting the stopping foil are determined using ToF spectrometry data, with and without the stopping foil. The Si de-
tector is only used to tag identical energies and screen out the extraneous components from the spectrum. This ap-
proach, which is applicable to continuous energy measurements, eliminates the well-known calibration problem of Si
detectors associated with heavy ions that is shown to lead to a clear deviation in the measured stopping power.
Consequently, the stopping powers and the energy dependence are determined with higher precision. In this study, the
stopping powers of a number of heavy ions (3P atomic number6 53) in amorphous C, Al and Au have been deter-
mined with an absolute uncertainty of less than 2.5%. In some energy regimes, data are provided for the first time. In
other energy ranges, the present data exhibit good agreement with most existing data. SRIM stopping power values
show a reasonable agreement with experimental data in most cases; however, some deviations from the measured
values, up to 15%, are observed around stopping maximum.
� 2002 Elsevier Science B.V. All rights reserved.
PACS: 61.85; 34.50.Bw; 29.40.Wk; 29.30.Ep
Keywords: Energy-loss; Stopping power; Elastic recoil detection analysis; Time of flight; Si detector
1. Introduction
With rapidly expanding applications in ion-
beam-based materials analysis, materials modifica-
tion, device fabrication, implantation technology,
nuclear physics, radiation damage and radiation
therapy, heavy-ion stopping in matter is currently
attracting renewed interest [1–15]. For many ions,
no stopping power data exist for many energy re-
gimes of interest, and theoretical values come from
an extrapolation of analytical fits of higher or lower
energy data. Available theories produce stop-
ping powers with varying levels of agreement withexperimental data. In some cases, widely used
Nuclear Instruments and Methods in Physics Research B 196 (2002) 1–15
www.elsevier.com/locate/nimb
*Tel.: +46-18-4713058; fax: +46-18-555736.
E-mail address: [email protected] (Y. Zhang).
0168-583X/02/$ - see front matter � 2002 Elsevier Science B.V. All rights reserved.
PII: S0168-583X(02 )01246-6

stopping power predictions are in error, e.g. Li [3].
An improved predictive theory is highly desired,
but advances in theory demand accurate experi-
mental data on energy loss and stopping powers forswift heavy ions, which makes this a important area
for renewed research [8–15].
Experimental study of the stopping power using
time-of-flight (ToF) techniques can be traced back
to the 1970s [16,17]. The standard ToF approach is
to directly measure the energy loss of monoener-
getic particles with a ToF spectrometry that is
placed after the stopping medium [15–17]; such amethod provides only a single data point for each
energy and particle type. Moreover, as scattering
foils are normally used to divert the monoenergetic
beam, the energy spread of the primary beam, due
to straggling and modification of the scattering
foils, results in uncertainty in the energy of the
impinging monoenergetic ions. There can be a
significant advantage to measure stopping powersover a continuous range of energies, rather than
point by point, and several groups are employing
different techniques (e.g. recoil of atoms, scattering
target) to produce a broad continuous range of
particle energies and simultaneously measure the
stopping powers over the continuous range of
energies [8–11]. In a previous collaborative study
[8], a time-of-flight-energy elastic recoil detectionanalysis (ToF-E ERDA) set-up was modified to
simultaneously measure stopping powers of heavy
particles in the same area of the stopping me-
dium with a ToF spectrometry placed in front of
the stopping medium, and the energy loss of the
particles was measured over a continuous energy
range, which represented a significant advantage
over single-energy ion approaches. A similar ap-proach, but based on a scattering approach to
produce a continuous energy range of particles,
has been recently employed by a Finnish group
[11]. Since Si detectors, which exhibit considerable
error in measuring heavy-ion energies due to a
non-linear response [3,18–20], are generally used in
these and other approaches to measure the particle
energies exiting the stopping media [8,10–13], thestopping powers determined by these methods
have a comparable systematic error.
The present paper employs an approach [21],
which takes advantage of the continuous energy
spectra, to determine energy loss in the stopping
medium based only on ToF data in the ToF-E
ERDA configuration. This approach eliminates
much of the error resulting from the Si detectorsand improves the precision of stopping power
measurements. In this study, the stopping powers
of a number of heavy ions (3P atomic number
6 53) in amorphous C, Al and Au have been de-
termined. In some energy regimes, data are pro-
vided for the first time.
2. Experimental
2.1. Experimental setup
A modified ToF-E ERDA set-up, as shown in
Fig. 1, was utilized for the stopping measurements.
The system consists of two carbon-foil time detec-
tors separated by a 437.5 mm flight length (LToF)that is followed by a Si p–i–n charged particle de-
tector with a collimator (8 mm in diameter) in front
of it [8]. Stopping foils are mounted on a push-rod
that can be reproducibly moved into and out of the
ion path between the second time detector and
the Si detector. Up to four foils can be loaded on
the push-rod, and the energy loss in each foil can be
measured separately. Moreover, the push-rod canbe rotated, so that the thickness of the stopping foil
can be increased [9] and any effect of channeling in
the crystalline foil can be circumvented.
The Uppsala 6 MV EN-tandem van de Graaff
accelerator was used to produce 50 MeV 127I10þ,
48 MeV 79Br8þ and 1.5–4.0 MeV 4Heþ ions as
projectile beams. Elemental bulk samples and
simple compounds were used as targets to create
Fig. 1. Schematic illustration of the experimental configura-
tion. The removable stopping foils can be reproducibly moved
into and out of the ion path and rotated from both directions.
2 Y. Zhang / Nucl. Instr. and Meth. in Phys. Res. B 196 (2002) 1–15

energetic target recoils, and bulk Au was used to
forward scattered the I and Br ions. Target recoils
and scattered projectiles were detected in a for-
ward direction at / ¼ 43:5� to the primary beamdirection with a wide energy distribution. It should
be stressed that the recoil and scattering processes
are only used to generate a secondary beam with a
large energy distribution but low intensity. In such
a way, direct beam exposure of the stopping foil is
avoided; the beam modification to the stopping
foil is, therefore, negligible. Ninety different ion
species (7Li, Be, 11B, C, N, O, F, Na, Mg, Al, Si,Cr, Mn, Fe, Co, Ni, Cu, Br and I) with a contin-
uous range of energies from a few tens to hundreds
keV per nucleon were produced. These ions were
recorded in the system with the stopping foil both
in and out. It is worth noting that most of parti-
cles, which have larger scattering angles after
penetrating the stopping foil, will not be registered
in the Si detector nor considered in the furtheranalysis. Therefore, the effect of low-probability,
large-angle energy-loss straggling in the stopping
foil is negligible. The data analysis procedure is
described using Br in amorphous C, which illus-
trates the general behavior for the other ions.
2.2. Data analysis procedure
Fig. 2(a) shows the time versus energy diagram
for the continuous energy range of Br particles that
are registered in the ToF-E system with and with-
out the amorphous carbon stopping foil (101
lg cm�2). A schematic illustration of the analysis
procedure is shown, as an insert, in the figure. In
the previous approach [8], only the lower curve was
obtained, and the impinging and exiting particleenergies were determined from the ToF data and
the Si detector, respectively. The novel aspect of the
present approach over the previous procedure [8] is
that, instead of using the Si detector, the ToF data
obtained without the stopping foil present is used
to determine the exit energies. As shown in Fig.
2(a), the energy of individual recoils prior to im-
pingement on the stopping foil, E1 is determinedusing the ToF data, T1(ch) from the lower curve,
and the exit energy is tagged by the Si detector as E
(channel). The exit energy, E2 is determined from
the corresponding ToF data without the stopping
foil present, T2(ch) from the upper curve in Fig.
2(a), based on particles that have been tagged as
having the same signal response, E, in the Si de-
tector as those passing through the stopping foil in
the lower curve. Using the Si detector spectrum to
only tag identical energy with and without the
stopping foil present, allows the energy of theparticles exiting the stopping foil to be accurately
determined from the ToF data (without the stop-
ping foil). This approach is conceptually different
from another approach [11] that also uses contin-
uous ToF versus Si detector energy curves but in-
stead relies on spectrum fits and Si detector
calibration to determine the energy difference with
and without a stopping medium. The impingingand exit energies in keV are given by
Fig. 2. (a) The time (from ToF spectrometry) versus energy
(from Si detector) spectra of Br ions with (lower curve) and
without (upper curve) the carbon stopping foil (101 lg cm�2).
The insert is a schematic illustration for the data analysis pro-
cedure. (b) The energy loss data of Br in C determined from the
two ToF-E curves of (a) together with the trend line (white
dashed line) using the sixth-order polynomial fit (Eq. (8)).
Y. Zhang / Nucl. Instr. and Meth. in Phys. Res. B 196 (2002) 1–15 3
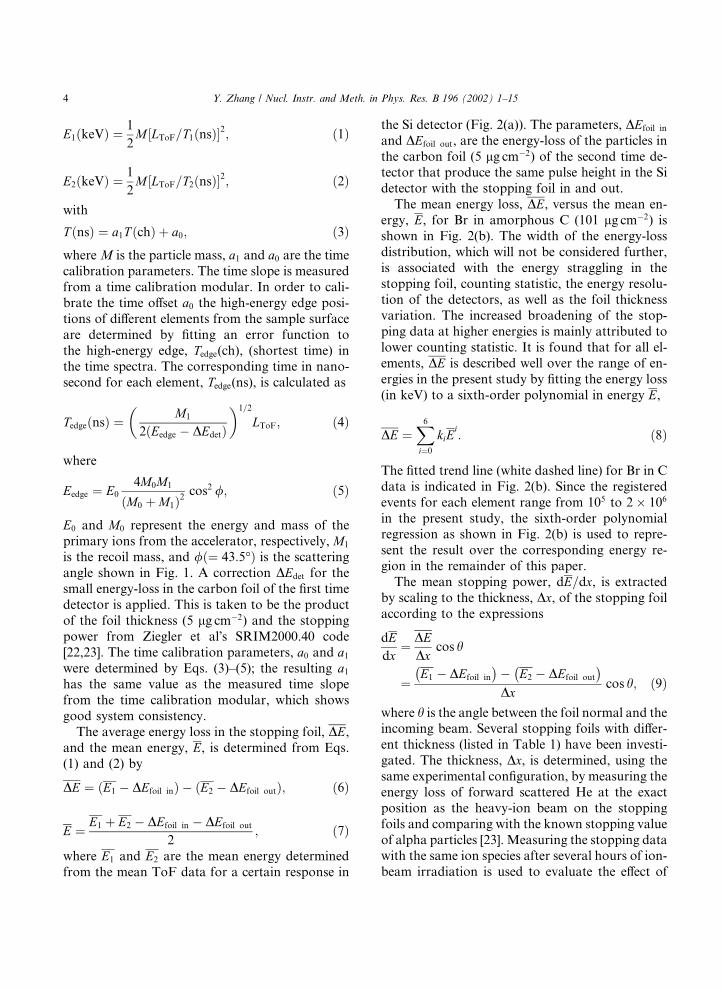
E1ðkeVÞ ¼1
2M ½LToF=T1ðnsÞ�2; ð1Þ
E2ðkeVÞ ¼1
2M ½LToF=T2ðnsÞ�2; ð2Þ
with
T ðnsÞ ¼ a1T ðchÞ þ a0; ð3Þwhere M is the particle mass, a1 and a0 are the time
calibration parameters. The time slope is measured
from a time calibration modular. In order to cali-
brate the time offset a0 the high-energy edge posi-
tions of different elements from the sample surface
are determined by fitting an error function to
the high-energy edge, Tedge(ch), (shortest time) inthe time spectra. The corresponding time in nano-
second for each element, Tedge(ns), is calculated as
TedgeðnsÞ ¼M1
2ðEedge � DEdetÞ
� �1=2
LToF; ð4Þ
where
Eedge ¼ E0
4M0M1
ðM0 þM1Þ2cos2 /; ð5Þ
E0 and M0 represent the energy and mass of the
primary ions from the accelerator, respectively, M1
is the recoil mass, and /ð¼ 43:5�Þ is the scatteringangle shown in Fig. 1. A correction DEdet for the
small energy-loss in the carbon foil of the first time
detector is applied. This is taken to be the product
of the foil thickness (5 lg cm�2) and the stopping
power from Ziegler et al�s SRIM2000.40 code
[22,23]. The time calibration parameters, a0 and a1were determined by Eqs. (3)–(5); the resulting a1has the same value as the measured time slope
from the time calibration modular, which shows
good system consistency.
The average energy loss in the stopping foil, DE,and the mean energy, E, is determined from Eqs.
(1) and (2) by
DE ¼ ðE1 � DEfoil inÞ � ðE2 � DEfoil outÞ; ð6Þ
E ¼ E1 þ E2 � DEfoil in � DEfoil out
2; ð7Þ
where E1 and E2 are the mean energy determined
from the mean ToF data for a certain response in
the Si detector (Fig. 2(a)). The parameters, DEfoil in
and DEfoil out, are the energy-loss of the particles in
the carbon foil (5 lg cm�2) of the second time de-tector that produce the same pulse height in the Si
detector with the stopping foil in and out.
The mean energy loss, DE, versus the mean en-
ergy, E, for Br in amorphous C (101 lg cm�2) is
shown in Fig. 2(b). The width of the energy-loss
distribution, which will not be considered further,
is associated with the energy straggling in the
stopping foil, counting statistic, the energy resolu-tion of the detectors, as well as the foil thickness
variation. The increased broadening of the stop-
ping data at higher energies is mainly attributed to
lower counting statistic. It is found that for all el-
ements, DE is described well over the range of en-
ergies in the present study by fitting the energy loss
(in keV) to a sixth-order polynomial in energy E,
DE ¼X6i¼0
kiEi: ð8Þ
The fitted trend line (white dashed line) for Br in C
data is indicated in Fig. 2(b). Since the registered
events for each element range from 105 to 2� 106
in the present study, the sixth-order polynomialregression as shown in Fig. 2(b) is used to repre-
sent the result over the corresponding energy re-
gion in the remainder of this paper.
The mean stopping power, dE=dx, is extracted
by scaling to the thickness, Dx, of the stopping foil
according to the expressions
dEdx
¼ DEDx
cos h
¼E1 � DEfoil in
� �� E2 � DEfoil out
� �Dx
cos h; ð9Þ
where h is the angle between the foil normal and theincoming beam. Several stopping foils with differ-
ent thickness (listed in Table 1) have been investi-
gated. The thickness, Dx, is determined, using the
same experimental configuration, by measuring the
energy loss of forward scattered He at the exact
position as the heavy-ion beam on the stopping
foils and comparing with the known stopping value
of alpha particles [23]. Measuring the stopping datawith the same ion species after several hours of ion-
beam irradiation is used to evaluate the effect of
4 Y. Zhang / Nucl. Instr. and Meth. in Phys. Res. B 196 (2002) 1–15
beam modification to the stopping foils. No no-
ticeable effect of beam modification is detected;
thus, impact on stopping power measurements is
negligible. The small energy corrections, DEfoil in
and DEfoil out, due to different particle energies
passing through the second time detector are de-
termined by applying Eqs. (6)–(9) iteratively, be-
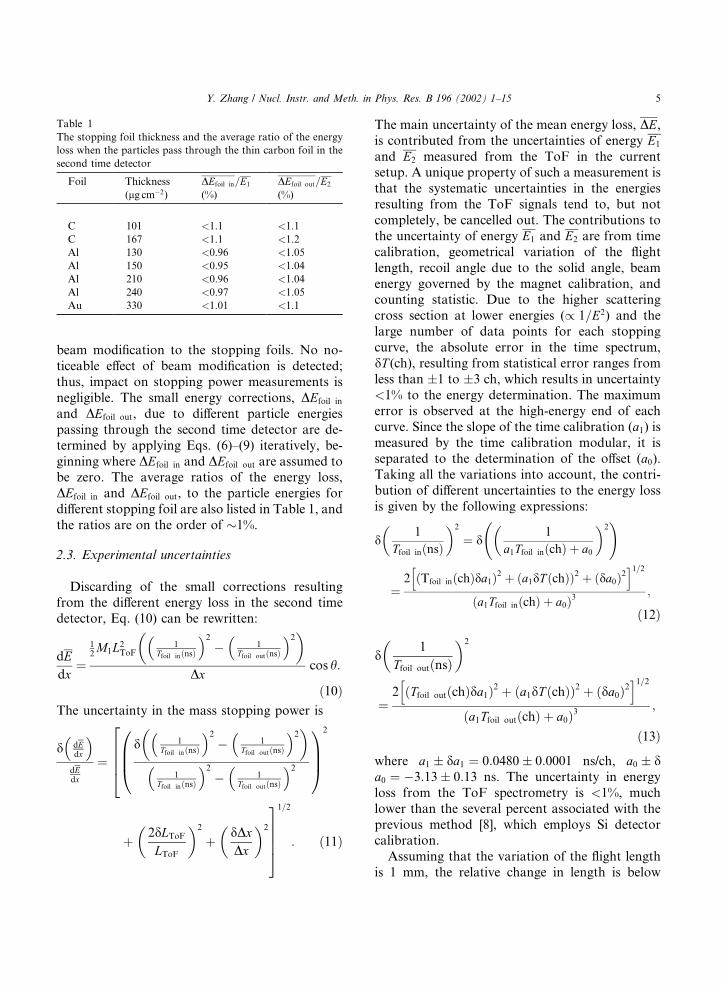
ginning where DEfoil in and DEfoil out are assumed tobe zero. The average ratios of the energy loss,
DEfoil in and DEfoil out, to the particle energies for
different stopping foil are also listed in Table 1, and
the ratios are on the order of 1%.
2.3. Experimental uncertainties
Discarding of the small corrections resultingfrom the different energy loss in the second time
detector, Eq. (10) can be rewritten:
dEdx
¼12M1L2
ToF1
Tfoil inðnsÞ
� �2� 1
Tfoil outðnsÞ
� �2� �Dx
cos h:
ð10ÞThe uncertainty in the mass stopping power is
d dEdx
� �dEdx
¼d 1
Tfoil inðnsÞ
� �2� 1
Tfoil outðnsÞ
� �2� �1
Tfoil inðnsÞ
� �2� 1
Tfoil outðnsÞ
� �20BB@
1CCA
226664
þ 2dLToF
LToF
� �2
þ dDxDx
� �2
37775
1=2
: ð11Þ
The main uncertainty of the mean energy loss, DE,is contributed from the uncertainties of energy E1
and E2 measured from the ToF in the currentsetup. A unique property of such a measurement is
that the systematic uncertainties in the energies
resulting from the ToF signals tend to, but not
completely, be cancelled out. The contributions to
the uncertainty of energy E1 and E2 are from time
calibration, geometrical variation of the flight
length, recoil angle due to the solid angle, beam
energy governed by the magnet calibration, andcounting statistic. Due to the higher scattering
cross section at lower energies (/ 1=E2) and the
large number of data points for each stopping
curve, the absolute error in the time spectrum,
dT (ch), resulting from statistical error ranges from
less than �1 to �3 ch, which results in uncertainty
<1% to the energy determination. The maximum
error is observed at the high-energy end of eachcurve. Since the slope of the time calibration (a1) ismeasured by the time calibration modular, it is
separated to the determination of the offset (a0).Taking all the variations into account, the contri-
bution of different uncertainties to the energy loss
is given by the following expressions:
d1
Tfoil inðnsÞ
� �2
¼ d1
a1Tfoil inðchÞ þ a0
� �2 !
¼2 Tfoil inðchÞda1ð Þ2 þ a1dT ðchÞð Þ2 þ da0ð Þ2h i1=2
a1Tfoil inðchÞ þ a0ð Þ3;
ð12Þ
d1
Tfoil outðnsÞ
� �2
¼2 Tfoil outðchÞda1ð Þ2 þ a1dT ðchÞð Þ2 þ da0ð Þ2h i1=2
a1Tfoil outðchÞ þ a0ð Þ3;
ð13Þ
where a1 � da1 ¼ 0:0480� 0:0001 ns/ch, a0 � da0 ¼ �3:13� 0:13 ns. The uncertainty in energy
loss from the ToF spectrometry is <1%, much
lower than the several percent associated with the
previous method [8], which employs Si detectorcalibration.
Assuming that the variation of the flight length
is 1 mm, the relative change in length is below
Table 1
The stopping foil thickness and the average ratio of the energy
loss when the particles pass through the thin carbon foil in the
second time detector
Foil Thickness
(lg cm�2)
DEfoil in=E1
(%)
DEfoil out=E2
(%)
C 101 <1.1 <1.1
C 167 <1.1 <1.2
Al 130 <0.96 <1.05
Al 150 <0.95 <1.04
Al 210 <0.96 <1.04
Al 240 <0.97 <1.05
Au 330 <1.01 <1.1
Y. Zhang / Nucl. Instr. and Meth. in Phys. Res. B 196 (2002) 1–15 5
0.5%. From Eq. (11), the dominant contribution to
the total uncertainty arises from the uncertainty in
the stopping foil thickness, which is determined
from known stopping power of alpha particles. Ifit is assumed that the uncertainty in the alpha
stopping [23] is 2%, the total uncertainty (Eq.
(11)) from the foil thickness, the flight length and
the energy-loss determinations is <2.5%.
3. Results and discussions
3.1. Deviation of electronic stopping using Si
detector
The novel aspect of the present approach overthe previous procedure [8], as described recently
[21], is that, instead of using the Si detector in-
formation, the ToF data obtained without the
stopping foil is used to determine the exit energies.
In the previous procedure, the energy calibration
of the Si-detectors was established individually for
each element by fitting the energy in keV, E2(keV),
derived from the ToF (Eq. (2)) to the energy sig-nals E(ch) from the Si detector (Fig. 2(a)). As the
atomic number of particles increases, energy de-
tection becomes more problematic due to the pro-
gressive degradation of the resolution. The energy
response of the detector is affected by the surface
dead layer and non-ionizing processes [3,18–20]
which lead to a non-linear response of several
percent divergence in energy per channel for agiven particle. It was found that for light recoils
with Z1 6 7 and energies >200 keV per nucleon,
the data could be described by a linear relationship
[8] given by
E2ðkeVÞ ¼ b1EðchÞ þ b0: ð14ÞHowever, due to the non-linear response of the
Si detector for heavy recoils with Z1 P 8, a second-
order polynomial is needed, which is given by the
expression
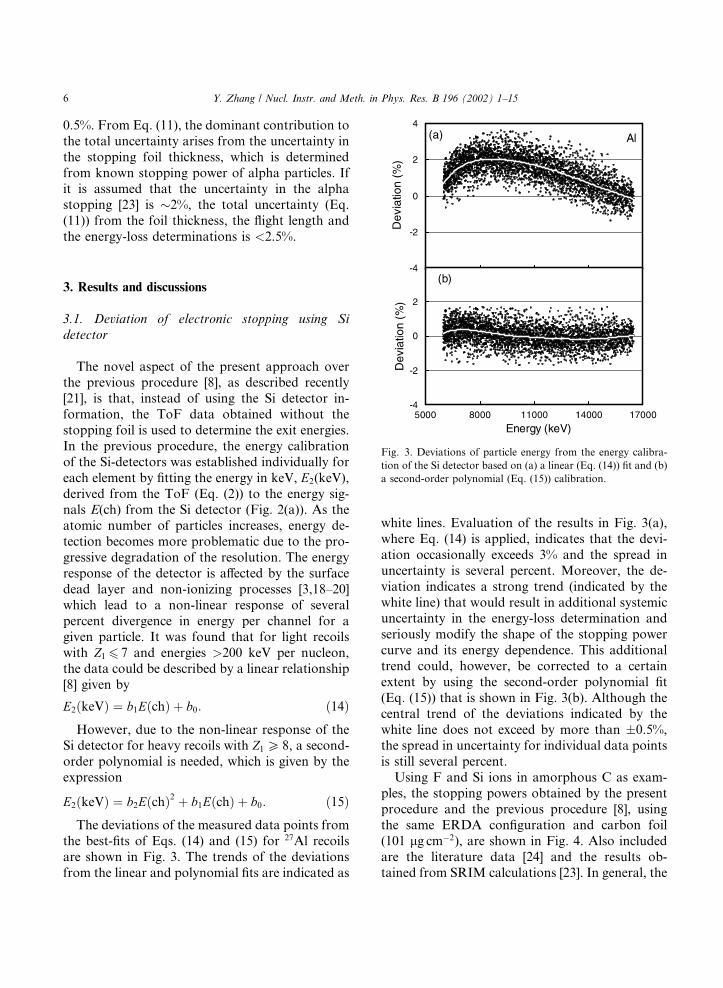
E2ðkeVÞ ¼ b2EðchÞ2 þ b1EðchÞ þ b0: ð15ÞThe deviations of the measured data points from
the best-fits of Eqs. (14) and (15) for 27Al recoils
are shown in Fig. 3. The trends of the deviations
from the linear and polynomial fits are indicated as
white lines. Evaluation of the results in Fig. 3(a),
where Eq. (14) is applied, indicates that the devi-
ation occasionally exceeds 3% and the spread in
uncertainty is several percent. Moreover, the de-
viation indicates a strong trend (indicated by the
white line) that would result in additional systemicuncertainty in the energy-loss determination and
seriously modify the shape of the stopping power
curve and its energy dependence. This additional
trend could, however, be corrected to a certain
extent by using the second-order polynomial fit
(Eq. (15)) that is shown in Fig. 3(b). Although the
central trend of the deviations indicated by the
white line does not exceed by more than �0.5%,the spread in uncertainty for individual data points
is still several percent.
Using F and Si ions in amorphous C as exam-
ples, the stopping powers obtained by the present
procedure and the previous procedure [8], using
the same ERDA configuration and carbon foil
(101 lg cm�2), are shown in Fig. 4. Also included
are the literature data [24] and the results ob-tained from SRIM calculations [23]. In general, the
Fig. 3. Deviations of particle energy from the energy calibra-
tion of the Si detector based on (a) a linear (Eq. (14)) fit and (b)
a second-order polynomial (Eq. (15)) calibration.
6 Y. Zhang / Nucl. Instr. and Meth. in Phys. Res. B 196 (2002) 1–15

experimental data agree well with SRIM predic-
tions. Most stopping values from the database lieon the low energy side. The stopping powers de-
termined from the previous procedure [8], where
the Si detector is used to measure the exit energy,
are considerably less than the present stopping
powers over much of the energy range because of
the particle-dependent non-linear calibration re-
sponse of the Si detector. The curvature of the
previous data in Fig. 4 is also attributed to thenon-linear response of the Si detector [19,20],
which was calibrated using a second-order poly-
nomial fit (Eq. (15)), shown as the white line in
Fig. 3(b). As the non-linear response of the de-
tector modifies the magnitude of the stopping
power curve, the energy dependence of the stop-
ping curve indicates a systematic error. The new
approach avoids the complexities of Si detectorcalibration that are associated with heavy ions
[3,19,20]. Since only the ToF signals, which have
much higher energy resolution compared to Si
detectors, are used to obtain the energy loss of ions
in the stopping foil, the stopping power and its
energy dependence are determined more accu-
rately. The new data procedure overcomes the
major difficulties with Si detectors in terms of (i)improved precision through dramatic reduction of
the uncertainty in the determination of exit energy,
(ii) insensitivity to irradiation-induced damage in
the Si detector and (iii) extended range of appli-
cation to lower energies, as the energy resolution
at low exit energies is much better for a ToF
measurement than with a Si detector. Further-
more, the uncertainty due to the carbon foil in thefirst time detector is eliminated. Likewise, as the
incident beam is composed of recoiled or scattered
particles with a relatively low beam density, the
modification of the stopping medium is negligible
[9]. As an additional benefit, the energy loss of
several elements can be measured simultaneously
with high precision using compound targets in the
ERDA geometry. As the ERDA is a well-estab-lished technique in most accelerator laboratories
and the measurement time for one stopping curve
is only about 30 min, similar type measurements
can be easily carried out for a large range of ion/
target combinations.
3.2. Analysis of raw data
Stopping data for Al ions in amorphous foils of
C, Al and Au over a continuous range of energies
are shown in Fig. 5. While only the results for a
single C or Au foil of given thickness are shown,
the results for four Al foils of different thickness
are provided to evaluate the effect of foil thickness.
Also included in Fig. 5 are other experimental data
taken from H. Paul�s database [24] and SRIM-2000 predictions [23]. The registered Al particles in
each plot shown in Fig. 5 are between 2 and
4� 105. The relative scatter of the data points is
representative of the general behavior of the
stopping data for the other ion species. Inspection
of the Al stopping data in Fig. 5 indicates that the
scatter in the data is relatively small due to the low
experimental errors.It is clear in Fig. 5 that for Al ions in amorphous
C (Al in C), the present data is higher than the
SRIM predictions, especially at energies from 220
to 460 keV per nucleon. The maximum deviation
Fig. 4. Comparison of the trend fits for the stopping power
data for F and Si ions in amorphous carbon (101 lg cm�2)
obtained from the ToF spectrometry (�) and the previous
procedure [8] (}). Also included the literature values (M) taken
from the H. Paul�s database as well as the SRIM predictions
(––).
Y. Zhang / Nucl. Instr. and Meth. in Phys. Res. B 196 (2002) 1–15 7
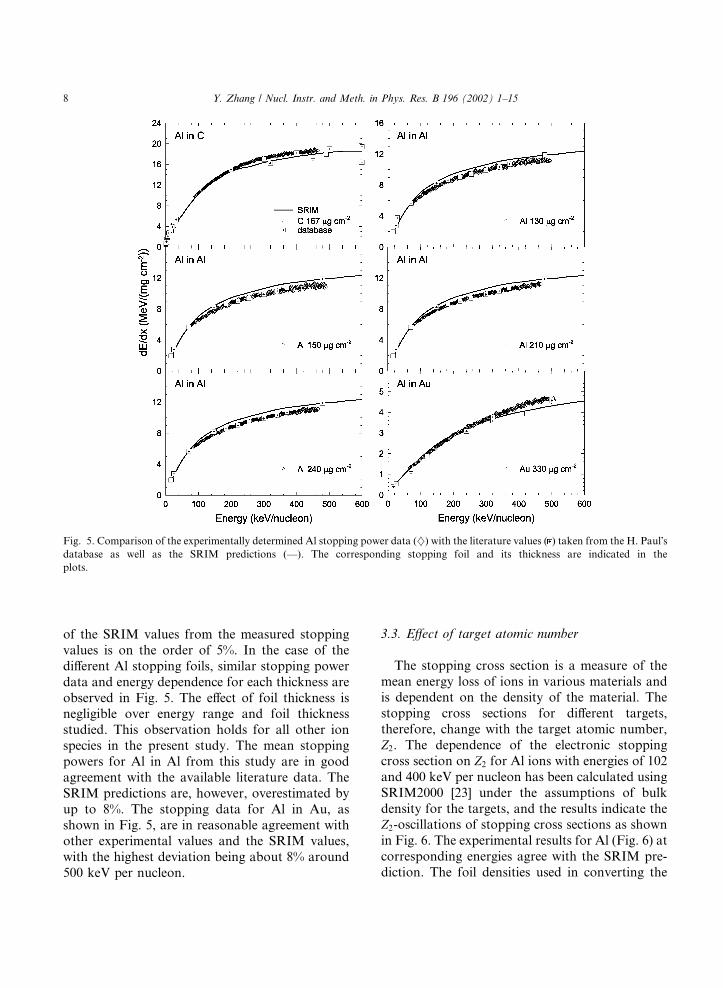
of the SRIM values from the measured stopping
values is on the order of 5%. In the case of the
different Al stopping foils, similar stopping power
data and energy dependence for each thickness are
observed in Fig. 5. The effect of foil thickness isnegligible over energy range and foil thickness
studied. This observation holds for all other ion
species in the present study. The mean stopping
powers for Al in Al from this study are in good
agreement with the available literature data. The
SRIM predictions are, however, overestimated by
up to 8%. The stopping data for Al in Au, as
shown in Fig. 5, are in reasonable agreement withother experimental values and the SRIM values,
with the highest deviation being about 8% around
500 keV per nucleon.
3.3. Effect of target atomic number
The stopping cross section is a measure of the
mean energy loss of ions in various materials andis dependent on the density of the material. The
stopping cross sections for different targets,
therefore, change with the target atomic number,
Z2. The dependence of the electronic stopping
cross section on Z2 for Al ions with energies of 102
and 400 keV per nucleon has been calculated using
SRIM2000 [23] under the assumptions of bulk
density for the targets, and the results indicate theZ2-oscillations of stopping cross sections as shown
in Fig. 6. The experimental results for Al (Fig. 6) at
corresponding energies agree with the SRIM pre-
diction. The foil densities used in converting the
Fig. 5. Comparison of the experimentally determined Al stopping power data (}) with the literature values ( ) taken from the H. Paul�sdatabase as well as the SRIM predictions (––). The corresponding stopping foil and its thickness are indicated in the
plots.
8 Y. Zhang / Nucl. Instr. and Meth. in Phys. Res. B 196 (2002) 1–15
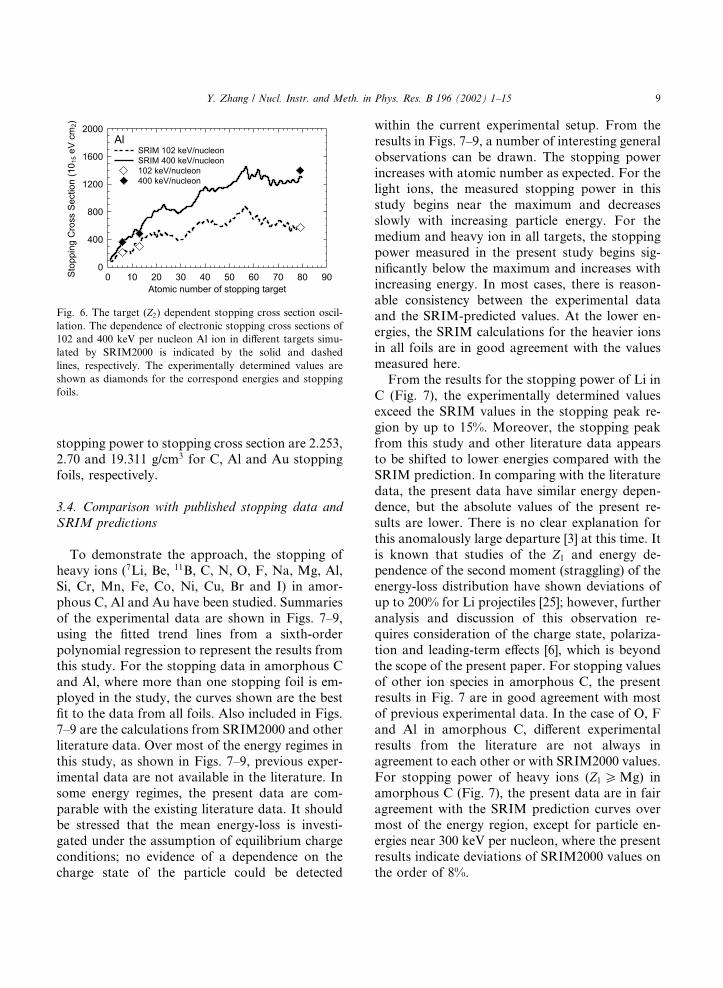
stopping power to stopping cross section are 2.253,2.70 and 19.311 g/cm3 for C, Al and Au stopping
foils, respectively.
3.4. Comparison with published stopping data and
SRIM predictions
To demonstrate the approach, the stopping of
heavy ions (7Li, Be, 11B, C, N, O, F, Na, Mg, Al,Si, Cr, Mn, Fe, Co, Ni, Cu, Br and I) in amor-
phous C, Al and Au have been studied. Summaries
of the experimental data are shown in Figs. 7–9,
using the fitted trend lines from a sixth-order
polynomial regression to represent the results from
this study. For the stopping data in amorphous C
and Al, where more than one stopping foil is em-
ployed in the study, the curves shown are the bestfit to the data from all foils. Also included in Figs.
7–9 are the calculations from SRIM2000 and other
literature data. Over most of the energy regimes in
this study, as shown in Figs. 7–9, previous exper-
imental data are not available in the literature. In
some energy regimes, the present data are com-
parable with the existing literature data. It should
be stressed that the mean energy-loss is investi-gated under the assumption of equilibrium charge
conditions; no evidence of a dependence on the
charge state of the particle could be detected
within the current experimental setup. From the
results in Figs. 7–9, a number of interesting general
observations can be drawn. The stopping power
increases with atomic number as expected. For thelight ions, the measured stopping power in this
study begins near the maximum and decreases
slowly with increasing particle energy. For the
medium and heavy ion in all targets, the stopping
power measured in the present study begins sig-
nificantly below the maximum and increases with
increasing energy. In most cases, there is reason-
able consistency between the experimental dataand the SRIM-predicted values. At the lower en-
ergies, the SRIM calculations for the heavier ions
in all foils are in good agreement with the values
measured here.
From the results for the stopping power of Li in
C (Fig. 7), the experimentally determined values
exceed the SRIM values in the stopping peak re-
gion by up to 15%. Moreover, the stopping peakfrom this study and other literature data appears
to be shifted to lower energies compared with the
SRIM prediction. In comparing with the literature
data, the present data have similar energy depen-
dence, but the absolute values of the present re-
sults are lower. There is no clear explanation for
this anomalously large departure [3] at this time. It
is known that studies of the Z1 and energy de-pendence of the second moment (straggling) of the
energy-loss distribution have shown deviations of
up to 200% for Li projectiles [25]; however, further
analysis and discussion of this observation re-
quires consideration of the charge state, polariza-
tion and leading-term effects [6], which is beyond
the scope of the present paper. For stopping values
of other ion species in amorphous C, the presentresults in Fig. 7 are in good agreement with most
of previous experimental data. In the case of O, F
and Al in amorphous C, different experimental
results from the literature are not always in
agreement to each other or with SRIM2000 values.
For stopping power of heavy ions (Z1 PMg) in
amorphous C (Fig. 7), the present data are in fair
agreement with the SRIM prediction curves overmost of the energy region, except for particle en-
ergies near 300 keV per nucleon, where the present
results indicate deviations of SRIM2000 values on
the order of 8%.
Fig. 6. The target (Z2) dependent stopping cross section oscil-
lation. The dependence of electronic stopping cross sections of
102 and 400 keV per nucleon Al ion in different targets simu-
lated by SRIM2000 is indicated by the solid and dashed
lines, respectively. The experimentally determined values are
shown as diamonds for the correspond energies and stopping
foils.
Y. Zhang / Nucl. Instr. and Meth. in Phys. Res. B 196 (2002) 1–15 9

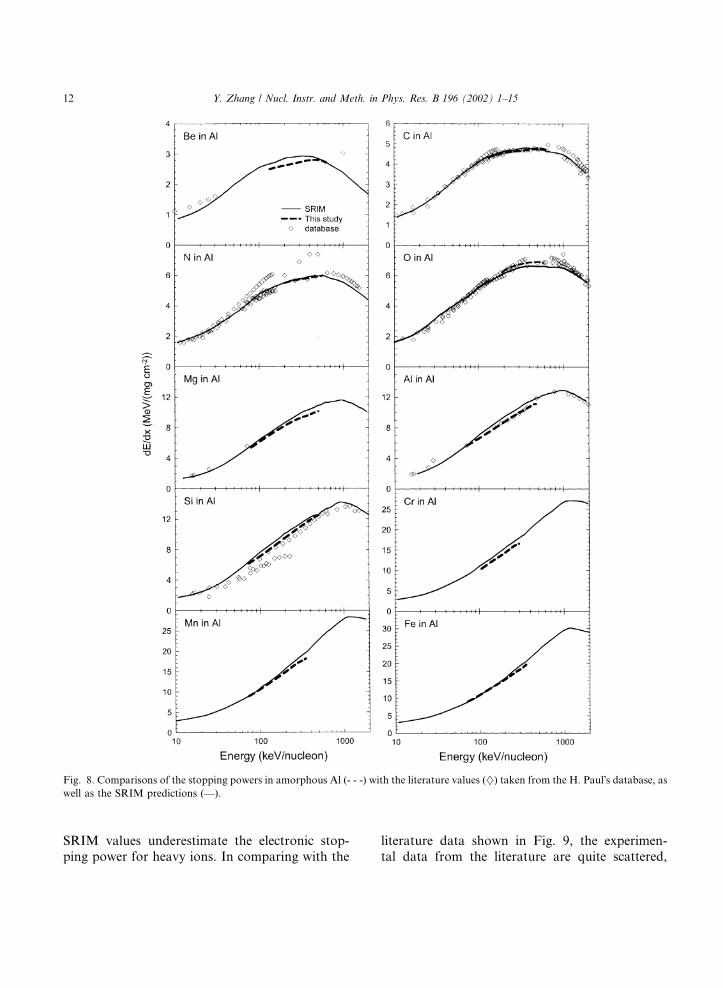
As seen from Fig. 8, the stopping powers of C,N, O and Si in Al are relatively well studied, and
much more data exist for comparison. However,the literature data are quite scattered (e.g. N in Al
Fig. 7. Comparisons of the stopping powers in amorphous C (- - -) with the literature values (}) taken from the H. Paul�s database, aswell as the SRIM predictions (––).
10 Y. Zhang / Nucl. Instr. and Meth. in Phys. Res. B 196 (2002) 1–15

and Si in Al), and do not agree within the statedexperimental uncertainty. The SRIM values are
much closer to the stopping powers determined in
this studied. For Al in Al, the present data agree
well with the literature data; however, the SRIM
values appear to overestimate the stopping power
in the energy region studied here. For ions of Be,
Mg, Cr, Mn, Fe, Co, Ni, Cu and I, the stopping
data are determined for the first time over most ofthe energy region, and agree, within several per-
cent, with the SRIM values, except a larger dif-
ference is observed for Be (up to 9%).
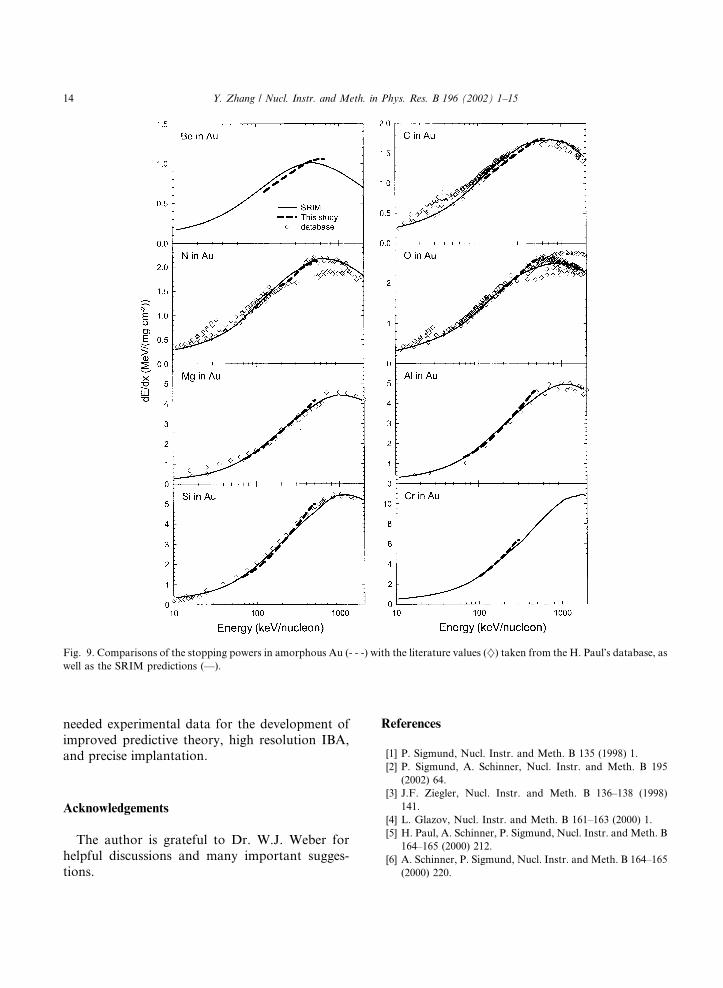
The stopping data in amorphous Au is shownin Fig. 9. There is reasonable agreement be-
tween the present data, other experimental data
and the values determined by SRIM2000. How-
ever, there is a tendency for faster increases in the
stopping power with increasing particle energies
for the present data compared to the SRIM pre-
diction. At lower ion energies, as shown in Fig. 9,
the SRIM curve overestimates the stopping power,but the SRIM predictions increase slower than
the present results with increasing energy. For the
higher energy range covered in this study, the
Fig. 7 (continued)
Y. Zhang / Nucl. Instr. and Meth. in Phys. Res. B 196 (2002) 1–15 11
SRIM values underestimate the electronic stop-ping power for heavy ions. In comparing with the
literature data shown in Fig. 9, the experimen-tal data from the literature are quite scattered,
Fig. 8. Comparisons of the stopping powers in amorphous Al (- - -) with the literature values (}) taken from the H. Paul�s database, aswell as the SRIM predictions (––).
12 Y. Zhang / Nucl. Instr. and Meth. in Phys. Res. B 196 (2002) 1–15

and more than 20% broadening can be seen inthe cases of C, N and O ions. The experimen-
tal stopping powers for C, N, O, Mg, Al and
Si are in good agreement with the literature
data in the limited energy region covered by
this study. The stopping powers of Be and Cr in
Au provide data that are not previously avail-
able.
4. Conclusions
The present study has demonstrated a new ap-
proach to determine high-precision stopping
powers, based on a ToF spectrometry, for a wide
range of elements in the energy region where most
ion beam analysis (IBA) techniques are employed.This simple analysis procedure takes advantage of
the continuous energy spectra to eliminate the
calibration uncertainties associated with the use of
Si detectors, and greatly improves the precision of
the stopping power measurements. The key im-
provement and novelty of the present approach is
to use the ToF spectrometry placed in front of the
stopping medium to obtain ToF data that is tag-ged by the Si detector with and without the stop-
ping foil present. By using the analysis approach
described in this paper, it is possible to obtain
high-precision stopping power data without rely-
ing on any energy calibration of the Si detector.
The stopping powers of some heavy ions (3Patomic number6 53) in amorphous C, Al and Au
have been determined. In some energy regimes,new data are provided for the first time. The ex-
perimental data are in reasonable agreement with
SRIM stopping powers in most cases; however,
SRIM values exhibit some deviation from the
measured values, up to 15%, around stopping
maximum.
By simply replacing the stopping foil with any
self-supporting foil, stopping power in elemental orcompound, amorphous or crystalline targets can be
investigated with high precision in terms of energy
and atomic number dependence. This approach
can measure the stopping power of a few ele-
ments simultaneously and be easily applied to a
great majority of ion-target combinations over a
wide continuous energy range. These provide much
Fig. 8 (continued)
Y. Zhang / Nucl. Instr. and Meth. in Phys. Res. B 196 (2002) 1–15 13
needed experimental data for the development of
improved predictive theory, high resolution IBA,and precise implantation.
Acknowledgements
The author is grateful to Dr. W.J. Weber for
helpful discussions and many important sugges-
tions.
References
[1] P. Sigmund, Nucl. Instr. and Meth. B 135 (1998) 1.
[2] P. Sigmund, A. Schinner, Nucl. Instr. and Meth. B 195
(2002) 64.
[3] J.F. Ziegler, Nucl. Instr. and Meth. B 136–138 (1998)
141.
[4] L. Glazov, Nucl. Instr. and Meth. B 161–163 (2000) 1.
[5] H. Paul, A. Schinner, P. Sigmund, Nucl. Instr. and Meth. B
164–165 (2000) 212.
[6] A. Schinner, P. Sigmund, Nucl. Instr. and Meth. B 164–165
(2000) 220.
Fig. 9. Comparisons of the stopping powers in amorphous Au (- - -) with the literature values (}) taken from the H. Paul�s database, aswell as the SRIM predictions (––).
14 Y. Zhang / Nucl. Instr. and Meth. in Phys. Res. B 196 (2002) 1–15

[7] P. Sigmund, Phys. Rev. A 56 (1997) 3781.
[8] Y. Zhang, G. Possnert, H.J. Whitlow, Nucl. Instr. and
Meth. B 183 (2001) 34.
[9] Y. Zhang, G. Possnert, Nucl. Instr. and Meth. B 190 (2002)
69.
[10] R. Liguori Neto, N. Added, F.A.S. Coutinho, Nucl. Instr.
and Meth. B 161–163 (2000) 159.
[11] W.H. Trzaska, T. Alanko, V. Lyapin, J. R€aais€aanen, Nucl.
Instr. and Meth. B 183 (2001) 203.
[12] T. Alanko, J. Hyv€oonen, V. Kyll€oonen, J. R€aais€aanen, A.
Virtanen, Nucl. Instr. and Meth. B 168 (2000) 139.
[13] X. Lu, Z. Xia, T. Zheng, Y. Shen, Nucl. Instr. and Meth. B
168 (2000) 287.
[14] K. Arstila, Nucl. Instr. and Meth. B 168 (2000) 473.
[15] J. Jokinen, Nucl. Instr. and Meth. B 124 (1997)
447.
[16] H.R. Andrews, W.N. Lennard, I.V. Mitchell, D. Ward, D.
Phillips, R.B. Walker, N. Rud, IEEE Trans. Nucl. Sci. NS-
26 (1979) 1326.
[17] W.N. Lennard, H.R. Andrews, M. Freeman, I.V. Mitchell,
D. Phillips, D.A.S. Walker, D. Ward, Nucl. Instr. and
Meth. 203 (1982) 565.
[18] D. Comedi, J. Davies, Nucl. Instr. and Meth. B 67 (1992)
93.
[19] Y. Zhang, H.J. Whitlow, IBA-15 conference, Nucl. Instr.
and Meth. B 190 (2002) 383.
[20] H.J. Whitlow, Y. Zhang, IBA-15 conference, Nucl. Instr.
and Meth. B 190 (2002) 375.
[21] Y. Zhang, G. Possnert, W.J. Weber, APL 80 (2002) 4662.
[22] J.F. Ziegler, in: J.F. Ziegler, J.P. Biersack, U. Littmark
(Eds.), The Stopping and Ranges of Ions in Matter, Vol. 1,
Pergamon Press, New York, 1985.
[23] J.F. Ziegler, SRIM-2000, v. 2000.40, http://www.srim.org.
[24] H. Paul, Stopping Power for Light Ions; Collection of
Graphs, Data and Comments. http://www.uni-linz.ac.at/
fak/TNF/atomphys/STOPPING/welcome.htm.
[25] Q. Yang, D.J. O�Connor, Z. Wang, Nucl. Instr. and Meth.
B 61 (1991) 149.
Y. Zhang / Nucl. Instr. and Meth. in Phys. Res. B 196 (2002) 1–15 15