high resolution mass spectrometry imaging of plant tissues
TRANSCRIPT
Analyst
PAPER
Cite this: Analyst, 2015, 140, 7696
Received 28th May 2015,Accepted 28th August 2015
DOI: 10.1039/c5an01065a
www.rsc.org/analyst
High resolution mass spectrometry imaging ofplant tissues: towards a plant metabolite atlas†
Dhaka Ram Bhandari,a Qing Wang,b Wolfgang Friedt,b Bernhard Spengler,a
Sven Gottwald*b and Andreas Römpp*‡a
Mass spectrometry (MS) imaging provides spatial and molecular information for a wide range of com-
pounds. This tool can be used to investigate metabolic changes in plant physiology and environmental
interactions. A major challenge in our study was to prepare tissue sections that were compatible with high
spatial resolution analysis and therefore dedicated sample preparation protocols were established and
optimized for the physicochemical properties of all major plant organs. We combined high spatial resolu-
tion (5 µm), in order to detect cellular features, and high mass accuracy (<2 ppm root mean square error),
for molecular specificity. Mass spectrometry imaging experiments were performed in positive and nega-
tive ion mode. Changes in metabolite patterns during plant development were investigated for germination
of oilseed rape. The detailed localization of more than 90 compounds allowed assignment to metabolic
processes and indicated possible functions in plant tissues. The ‘untargeted’ nature of MS imaging allows the
detection of marker compounds for the physiological status, as demonstrated for plant–pathogen inter-
actions. Our images show excellent correlation with optical/histological examination. In contrast to pre-
vious MS imaging studies of plants, we present a complete workflow that covers multiple species, such
as oilseed rape, wheat seed and rice. In addition, different major plant organs and a wide variety of
compound classes were analyzed. Thus, our method could be used to develop a plant metabolite atlas
as a reference to investigate systemic and local effects of pathogen infection or environmental stress.
1 Introduction
Plants are major suppliers of food and natural resources usedin pharmaceuticals, cosmetics, and fine chemicals. As sessileorganisms, plants cannot escape their environment, instead(progressive) acclimatization by specific metabolic adjust-ments is the only response to changing conditions.1 Thisresulted in a complex metabolism with over 200 000 knownprimary and secondary metabolites.2
As part of the ‘omics’ field, metabolic studies have beenapplied to a wide spectrum of topics in plant science. Theseinclude basic research in model plants such as Arabidopsis todiscover fundamental biosynthetic processes and metabolicnetworks3 as well as applied research in crop plants such as
wheat (Triticum aestivum) and oilseed rape (Brassica napus) touncover biochemical mechanisms behind complex agronomi-cal traits and phenotypes.4 Important current issues in cropplant research are developmental plasticity,5 and responses toabiotic6 and biotic stress.7 In contrast to genes, metabolitesare the end products of cellular processes and therefore, canserve as direct signatures of biochemical activity.8 Metabolo-mics studies are typically based on mass spectrometry (MS),hyphenated with techniques such as gas and liquid chromato-graphy, covering an extensive variety of compound classes andconcentration ranges. In these studies, usually homogenizedsamples are used, resulting in a loss of spatial information. Onthe other hand, visualization has become an important topic inplant science, because detailed knowledge on metabolite distri-butions in plants is fundamental for the understanding of localregulatory networks, which underlay selected traits.9 Visualiza-tion is usually achieved by fluorescence microscopy, in situhybridization or immunohistochemistry,10 techniques whichprovide high spatial resolution, but chemical information istypically limited to very few compounds per experiment.
Mass spectrometry (MS) imaging combines spatial infor-mation and molecular information for a wide range of com-pounds. This method can, therefore, complement the classicalapproaches of metabolomics studies and microscopic
†Electronic supplementary information (ESI) available. See DOI: 10.1039/c5an01065a‡Current address: University of Bayreuth, Department of Food Analysis E.-C.-Baumann-Str. 20, 95326 Kulmbach, Germany. E-mail: [email protected], Tel: 09221/87803111.
aJustus Liebig University Giessen, Institute of Inorganic and Analytical Chemistry,
Schubertstrasse 60, Building 16, 35392 Giessen, GermanybJustus Liebig University Giessen, Department of Plant Breeding, IFZ, Justus Liebig
University Giessen, Heinrich-Buff-Ring 26–32, 35392 Giessen, Germany.
E-mail: [email protected]; Tel: +49641-9937426
7696 | Analyst, 2015, 140, 7696–7709 This journal is © The Royal Society of Chemistry 2015
Ope
n A
cces
s A
rtic
le. P
ublis
hed
on 1
6 Se
ptem
ber
2015
. Dow
nloa
ded
on 4
/2/2
022
1:08
:16
PM.
Thi
s ar
ticle
is li
cens
ed u
nder
a C
reat
ive
Com
mon
s A
ttrib
utio
n 3.
0 U
npor
ted
Lic
ence
.
View Article OnlineView Journal | View Issue
methods. MS imaging is the method of scanning a sample ofinterest and generating images of the intensity distribution ofanalyte ions. In contrast to classical histochemical methods,MS imaging is a label free technique and thus, can be usedwithout prior knowledge of the analyte. Due to this untargetednature, hundreds of compounds can be detected simul-taneously. While numerous studies have been published in thefield of clinical research, plant research is a relatively newapplication of MS imaging which, however, offers importantadvantages for the detailed investigation of metabolites fromcomplex plant tissues.7,11
The first studies using MALDI imaging on plants analyzedthe distribution of agrochemical compounds in soya bean(Glycine max)12 and carbohydrates in wheat (Triticum aestivum)stem.13 Subsequent studies included applications on rice(Oryza sativa) seeds,14,15 flowers and roots of the model plantArabidopsis thaliana16–19 and barley (Hordeum vulgare) seeds.20
However, most MS imaging studies in plants were performedwith MALDI-TOF instruments, which provide lower massresolution data, possibly leading to ambiguous results. Onlyrecently, high mass resolution orbital trapping mass analyzerswere applied.16,21–24 A pixel size of 25 µm25,26 and 5 µm27 wasobtained in selected experiments, but most studies were per-formed at 100 to 200 µm spatial resolution. A related methodis laser desorption ionization (LDI) which was used for theanalysis of plant tissue with a TOF mass spectrometer at a10 µm pixel size.28 This approach does not require any matrixapplication, but is limited to compounds with UV-absorbingfunctional groups.
We have introduced a MS imaging method that combinesfor the first time high selectivity (1 ppm mass accuracy) andhigh spatial resolution (3 to 10 µm pixel size) in one experi-ment.29 This results in a significantly improved reliability ofcompound identification and provides molecular informationon a cellular level. This technique was initially developed formammalian tissues,30 but has now been further developedand optimized for non-mammalian tissues. Recently, wehave demonstrated the applicability of MS imaging for meta-bolite characterization of wine (Vitis vinifera) grapes,31 thebird’s nest fungus Cyathus striatus32 and the licorice (Glycyr-rhiza glabra) rhizome33 at 20 µm, 15 µm and 10 µm pixel size,respectively.
Previous MS imaging studies of plants were limited to aselected organ in a particular species and typically focused ona certain class of compounds. In this publication we presentnew developments in MS imaging of plant tissues that enablea comprehensive investigation of the plant metabolome. Thesedevelopments include the first MS imaging experiments at a5 µm pixel size which reveal the detailed structure of metabolitesin plant organs. We were able to image a wide range of com-pound classes including different phenolic compounds, phos-pholipids and other lipid species, carbohydrates, phenoliccholine esters, glycosides, and glycerides in mature and germi-nating oilseed rape. These data probably represent the mostcomprehensive spatially resolved information about meta-bolites in plants, so far.
To establish a plant metabolome atlas, it is necessary toanalyze all relevant plant organs and to cover different plantspecies. This primarily concerns the development of dedicatedsample preparation techniques. In plants, different organs andtissues are specialized and modified for specific functions.Thus sample preparation techniques need to be designedaccording to the different plant organs and (metabolic) stages.Consequently, we also present developments in MS imaging,which concern sectioning procedures that were optimized forhigh spatial resolution analysis in a variety of tissues withspecific physicochemical properties.
The methodological approach and obtained information ofMS imaging is discussed in detail in a case study comparingthe mature and germinating seeds of oilseed rape (section2.1). Subsequently additional plant species and organs are dis-cussed. This includes experiments in negative ion mode andwith a 5 µm pixel size for wheat seed (section 2.2). Samplepreparation is the focus for wheat rachis (section 2.3), wheatstem base (section 2.4) and rice root (section 2.5). Finally, wehave provided an example in which a wheat seed infected bythe fungal pathogen, Fusarium graminearum, is compared toan uninfected seed and cultured fungal mycelium (section2.6). Details of the experimental procedure for each experi-ment, particularly sample preparation, are discussed in theExperimental section (section 3).
In the Conclusions section (section 4) we have includedmeasurements of additional plant organs (distal root, leaf andstem). We also discuss the idea of how our MS imagingapproach could be used to build up an atlas of the plant meta-bolome as a reference to detect the systemic and local meta-bolic changes.
2 Results and discussion2.1 Mapping of metabolic processes in seed development
Maturity and germination are metabolically highly activestages during the development with significant implicationsfor subsequent plant performance34,35 and nutritional qualityof seed products.36 Therefore, these stages were chosen toestablish high resolution MS imaging as a tool for mappingmetabolites.
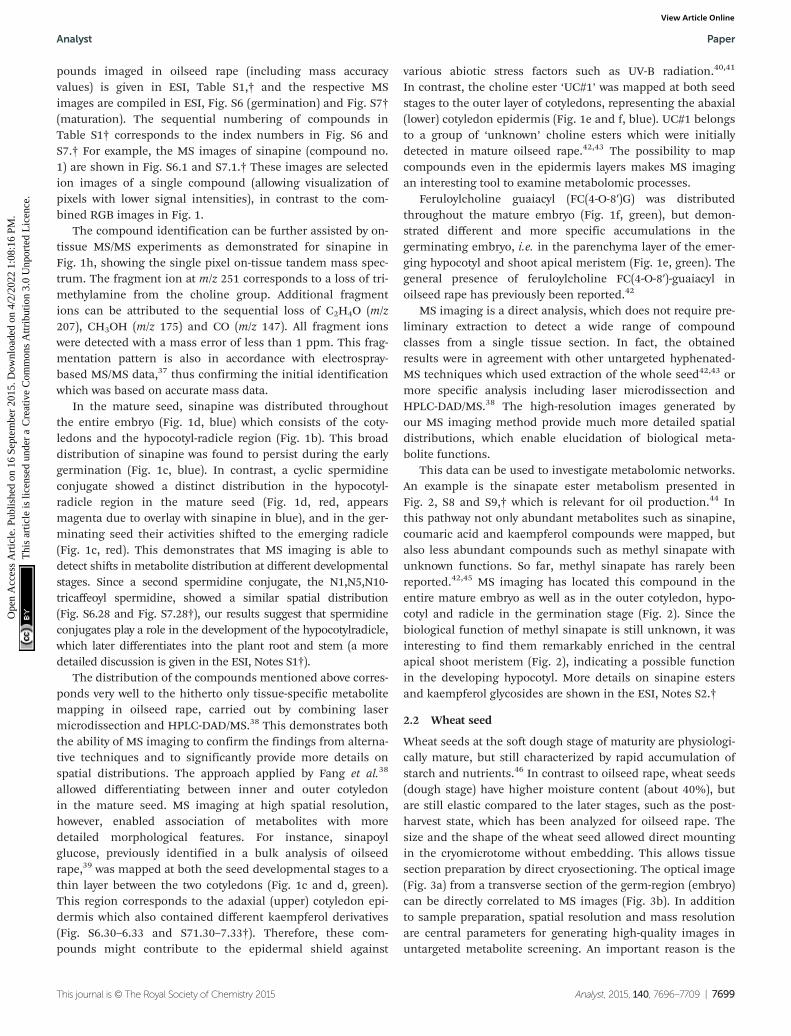
Seeds of oilseed rape are 2–3 mm in diameter, which makesdirect cryosectioning challenging. Therefore, cellulose (CMC) car-boxymethyl cellulose solution was used as an embeddingmaterial as described in the Experimental section. The opticalimages of both the stages (Fig. 1a and b) can be directly corre-lated to the respective ion images (Fig. 1c, e, d and f). A massspectrum acquired from a single 10 µm pixel in the shoot apicalmeristem region of a germinating seed is shown in Fig. 1g. Theexact location of this pixel and the zoomed-in mass spectrum areprovided in ESI, Fig. S1.† Additional single 10 µm spectra fromcotyledon vasculature, nucellar tissue (putative), seed coat, andemerging radicle are shown in the ESI, Fig. S2–S5.† Several com-pounds such as sinapine, methyl sinapate, cyclic spermidine con-jugate, triacylglycerols and phosphatidylcholines were detected.
Analyst Paper
This journal is © The Royal Society of Chemistry 2015 Analyst, 2015, 140, 7696–7709 | 7697
Ope
n A
cces
s A
rtic
le. P
ublis
hed
on 1
6 Se
ptem
ber
2015
. Dow
nloa
ded
on 4
/2/2
022
1:08
:16
PM.
Thi
s ar
ticle
is li
cens
ed u
nder
a C
reat
ive
Com
mon
s A
ttrib
utio
n 3.
0 U
npor
ted
Lic
ence
.View Article Online
These compounds were identified based on accurate massmeasurements. For example, sinapine (choline ester of sinapicacid) was detected with a mass error of −0.83 ppm (Fig. 1g)and the corresponding image is shown in Fig. 1c (blue). Theroot mean square error (RMSE), calculated from 52 523 spectraover the full image, was 1.0 ppm. The mass accuracy wasbetter than 2 ppm for all compounds assigned in this article.
This demonstrated a reliable detection of compounds alsounder imaging conditions. Using high resolution and highmass accuracy, it is possible to generate MS images with anarrow bin width of Δm/z = ±5 ppm, thus preventing inter-ference from the neighboring peaks (an example is discussedfor the MS imaging on a wheat seed). This bin width was usedfor all MS images presented in this study. A list of 93 com-
Fig. 1 Comparative mass spectrometry imaging of oilseed rape at maturation and early germination stages. Optical images of seeds at (a) the earlygermination and (b) the maturation stage: root tip (RT) containing the root apical meristem (RAM); epidermis tissue (Ep), parenchyma tissue (Pa); vas-cular tissue (Va); shoot apical meristem (SAM); seed coat (S); endosperm (E); putative nucellar tissue (NT); outer and inner cotyledon (OC and IC);abEp (abaxial cotyledon epidermis); adEp (adaxial cotyledon epidermis); hypocotyl (H); radicle (R); hypocotyl-radicle region (HR); and the seed coat-endosperm region (SE). Scale bar, 500 µm. Overlay of m/z images from early germinating (c) and mature (d) seeds showing the tissue- and stage-specific spatial distributions of the cyclic spermidine conjugate [M + H]+, m/z 496.24421 (red); the sinapoly glucose [M + H − H2O]+, m/z 369.11801(green); and sinapine [M + H]+, m/z 310.16490 (blue). Overlay of ion images from early germinating (e) and mature (f ) seeds showing the tissue- andstage-specific spatial distributions of the tricaffeoyl spermidine [M + K]+, m/z 534.20009 (red); feruloylcholine FC(4-O-8’)G [M + H]+, m/z 476.22789(green); and the phenolic choline ester UC#1 [M + H]+, m/z 328.24824 (blue). (g) Single pixel MS spectrum obtained at 10 µm pixel size measure-ment in the early germinating seed. Different classes of compounds, such as sinapine, carbohydrate and lipids were identified based on high massaccuracy. (h) On tissue MS/MS of sinapine from a 10 µm pixel. R = mass resolution.
Paper Analyst
7698 | Analyst, 2015, 140, 7696–7709 This journal is © The Royal Society of Chemistry 2015
Ope
n A
cces
s A
rtic
le. P
ublis
hed
on 1
6 Se
ptem
ber
2015
. Dow
nloa
ded
on 4
/2/2
022
1:08
:16
PM.
Thi
s ar
ticle
is li
cens
ed u
nder
a C
reat
ive
Com
mon
s A
ttrib
utio
n 3.
0 U
npor
ted
Lic
ence
.View Article Online
pounds imaged in oilseed rape (including mass accuracyvalues) is given in ESI, Table S1,† and the respective MSimages are compiled in ESI, Fig. S6 (germination) and Fig. S7†(maturation). The sequential numbering of compounds inTable S1† corresponds to the index numbers in Fig. S6 andS7.† For example, the MS images of sinapine (compound no.1) are shown in Fig. S6.1 and S7.1.† These images are selectedion images of a single compound (allowing visualization ofpixels with lower signal intensities), in contrast to the com-bined RGB images in Fig. 1.
The compound identification can be further assisted by on-tissue MS/MS experiments as demonstrated for sinapine inFig. 1h, showing the single pixel on-tissue tandem mass spec-trum. The fragment ion at m/z 251 corresponds to a loss of tri-methylamine from the choline group. Additional fragmentions can be attributed to the sequential loss of C2H4O (m/z207), CH3OH (m/z 175) and CO (m/z 147). All fragment ionswere detected with a mass error of less than 1 ppm. This frag-mentation pattern is also in accordance with electrospray-based MS/MS data,37 thus confirming the initial identificationwhich was based on accurate mass data.
In the mature seed, sinapine was distributed throughoutthe entire embryo (Fig. 1d, blue) which consists of the coty-ledons and the hypocotyl-radicle region (Fig. 1b). This broaddistribution of sinapine was found to persist during the earlygermination (Fig. 1c, blue). In contrast, a cyclic spermidineconjugate showed a distinct distribution in the hypocotyl-radicle region in the mature seed (Fig. 1d, red, appearsmagenta due to overlay with sinapine in blue), and in the ger-minating seed their activities shifted to the emerging radicle(Fig. 1c, red). This demonstrates that MS imaging is able todetect shifts in metabolite distribution at different developmentalstages. Since a second spermidine conjugate, the N1,N5,N10-tricaffeoyl spermidine, showed a similar spatial distribution(Fig. S6.28 and Fig. S7.28†), our results suggest that spermidineconjugates play a role in the development of the hypocotylradicle,which later differentiates into the plant root and stem (a moredetailed discussion is given in the ESI, Notes S1†).
The distribution of the compounds mentioned above corres-ponds very well to the hitherto only tissue-specific metabolitemapping in oilseed rape, carried out by combining lasermicrodissection and HPLC-DAD/MS.38 This demonstrates boththe ability of MS imaging to confirm the findings from alterna-tive techniques and to significantly provide more details onspatial distributions. The approach applied by Fang et al.38
allowed differentiating between inner and outer cotyledonin the mature seed. MS imaging at high spatial resolution,however, enabled association of metabolites with moredetailed morphological features. For instance, sinapoylglucose, previously identified in a bulk analysis of oilseedrape,39 was mapped at both the seed developmental stages to athin layer between the two cotyledons (Fig. 1c and d, green).This region corresponds to the adaxial (upper) cotyledon epi-dermis which also contained different kaempferol derivatives(Fig. S6.30–6.33 and S71.30–7.33†). Therefore, these com-pounds might contribute to the epidermal shield against
various abiotic stress factors such as UV-B radiation.40,41
In contrast, the choline ester ‘UC#1’ was mapped at both seedstages to the outer layer of cotyledons, representing the abaxial(lower) cotyledon epidermis (Fig. 1e and f, blue). UC#1 belongsto a group of ‘unknown’ choline esters which were initiallydetected in mature oilseed rape.42,43 The possibility to mapcompounds even in the epidermis layers makes MS imagingan interesting tool to examine metabolomic processes.
Feruloylcholine guaiacyl (FC(4-O-8′)G) was distributedthroughout the mature embryo (Fig. 1f, green), but demon-strated different and more specific accumulations in thegerminating embryo, i.e. in the parenchyma layer of the emer-ging hypocotyl and shoot apical meristem (Fig. 1e, green). Thegeneral presence of feruloylcholine FC(4-O-8′)-guaiacyl inoilseed rape has previously been reported.42
MS imaging is a direct analysis, which does not require pre-liminary extraction to detect a wide range of compoundclasses from a single tissue section. In fact, the obtainedresults were in agreement with other untargeted hyphenated-MS techniques which used extraction of the whole seed42,43 ormore specific analysis including laser microdissection andHPLC-DAD/MS.38 The high-resolution images generated byour MS imaging method provide much more detailed spatialdistributions, which enable elucidation of biological meta-bolite functions.
This data can be used to investigate metabolomic networks.An example is the sinapate ester metabolism presented inFig. 2, S8 and S9,† which is relevant for oil production.44 Inthis pathway not only abundant metabolites such as sinapine,coumaric acid and kaempferol compounds were mapped, butalso less abundant compounds such as methyl sinapate withunknown functions. So far, methyl sinapate has rarely beenreported.42,45 MS imaging has located this compound in theentire mature embryo as well as in the outer cotyledon, hypo-cotyl and radicle in the germination stage (Fig. 2). Since thebiological function of methyl sinapate is still unknown, it wasinteresting to find them remarkably enriched in the centralapical shoot meristem (Fig. 2), indicating a possible functionin the developing hypocotyl. More details on sinapine estersand kaempferol glycosides are shown in the ESI, Notes S2.†
2.2 Wheat seed
Wheat seeds at the soft dough stage of maturity are physiologi-cally mature, but still characterized by rapid accumulation ofstarch and nutrients.46 In contrast to oilseed rape, wheat seeds(dough stage) have higher moisture content (about 40%), butare still elastic compared to the later stages, such as the post-harvest state, which has been analyzed for oilseed rape. Thesize and the shape of the wheat seed allowed direct mountingin the cryomicrotome without embedding. This allows tissuesection preparation by direct cryosectioning. The optical image(Fig. 3a) from a transverse section of the germ-region (embryo)can be directly correlated to MS images (Fig. 3b). In additionto sample preparation, spatial resolution and mass resolutionare central parameters for generating high-quality images inuntargeted metabolite screening. An important reason is the
Analyst Paper
This journal is © The Royal Society of Chemistry 2015 Analyst, 2015, 140, 7696–7709 | 7699
Ope
n A
cces
s A
rtic
le. P
ublis
hed
on 1
6 Se
ptem
ber
2015
. Dow
nloa
ded
on 4
/2/2
022
1:08
:16
PM.
Thi
s ar
ticle
is li
cens
ed u
nder
a C
reat
ive
Com
mon
s A
ttrib
utio
n 3.
0 U
npor
ted
Lic
ence
.View Article Online

lack of chromatographic separation, which makes analyteassignments in MS imaging more complicated compared tometabolomic analysis based on GC/MS or LC/MS.16 We com-bined high mass resolution (which allows generating imageswith a narrow m/z bin width of ±5 ppm) with high spatialresolution (5 µm pixel size). This enabled us to represent thegrain architecture with a reliable assignment of imaged meta-bolites to their respective in situ locations. For example, it waspossible to demonstrate the specific location of a polyphenolglycoside in the protection sheath coleoptile/coleorhizae(Fig. 3b, green), suggesting a function in protecting the emer-ging shoot, plumules and/or radicle against UV-B radiation,pathogens or herbivores.47 In addition, a phosphatidylcholine,PC(36:4), was specifically located in the scutellum (Fig. 3b,blue), while a phosphatidylglycerol, PG(38:2), was restricted tothe pericarp-seed coat region (Fig. 3b, red). PG membranelipids are vital for normal embryo development as they are
involved in formation of chloroplast thylakoid membranes,which are the primary site of photosynthesis.48 By contrast, ahigh mass resolution (±5 ppm) combined with a low spatialresolution results in a loss of spatial information (Fig. 3c),which shows the same measurement with a recalculated pixelsize of 50 µm. A critical loss of information is also observedusing a bin width of 0.1, typically used for MALDI-TOFimaging experiments. Here, the low mass resolution affects theimage generation due to the interference of the neighboringpeaks (Fig. 3d). Consequently, a combination of high massresolution with high spatial resolution is needed to resolve thecomplexity of metabolites in plant tissue sections.
Negative ion mode measurements provide a possibility toobtain complementary information on identification of thecompounds. A section of the wheat germ similar to Fig. 3a wasscanned in negative ion mode (Fig. 4a). For example, the poly-phenol glycoside in Fig. 3b (green) was confirmed to have the
Fig. 2 Scheme of metabolomic network associated with sinapate ester metabolism, localized by high-resolution MS imaging in mature and earlygerminating oilseed rape. Spatial distributions are shown in the ion images below the respective metabolites (left image: mature seed; right imageearly germinating seed). Blue boxes marked by a white cross indicate that the metabolite has not been detected at that developmental seed stage.Localized key metabolites are marked in bold letters. The sinapate ester metabolism is highlighted as a grey box. The shikimate pathway as agateway to the displayed branch of phenylpropanoid metabolism is indicated as light blue box. The scheme was redrawn based on Clauss et al.42
Abbreviations: G, guaiacyl moiety; Glc, glucoside; Hex, unknown hexose moieties (commonly Glc); S, syringyl moiety; Soph, sophorose.
Paper Analyst
7700 | Analyst, 2015, 140, 7696–7709 This journal is © The Royal Society of Chemistry 2015
Ope
n A
cces
s A
rtic
le. P
ublis
hed
on 1
6 Se
ptem
ber
2015
. Dow
nloa
ded
on 4
/2/2
022
1:08
:16
PM.
Thi
s ar
ticle
is li
cens
ed u
nder
a C
reat
ive
Com
mon
s A
ttrib
utio
n 3.
0 U
npor
ted
Lic
ence
.View Article Online

same spatial distribution in negative ion mode (Fig. 4b, green).Similar distribution of additional polyphenol glycosidesis demonstrated by comparing positive and negative ionmeasurements (Fig. S10†). Moreover, the negative mode experi-ment enables imaging of additional compound classes such asa phosphatidylinositol [PI(34:2)–H]− located in the scutellumand endosperm of the wheat seed (Fig. 4b, red). PI is a keymembrane constituent and an important participant in signal-
ing processes in seed and vegetative tissue,49,50 responsible fornormal plant growth, stress response and seedgermination.51,52
2.3 Wheat spike rachis
The rachis is the primary axis of a cereal spike, which bearsthe spikelets containing flowers. The spike rachis consists oflow-density tissues, resulting in floating of the specimen in
Fig. 3 Mass spectrometry imaging of a wheat seed section at the soft dough stage with different mass and spatial resolutions. (a) Optical image of a20 µm cross section taken from the germ. The image shows the coleoptile/coleorhiza (Co), the scutellum (Sc), and the pericarp-seed coat region(PS). Scale bar, 500 µm. (b) Overlay of three ion images generated with high mass resolution (±5 ppm) and high spatial resolution (5 µm). The overlayshows the tissue-specific spatial distributions of a polyphenol glycoside [M + K]+, m/z 603.11107 (green) in the protective sheath coleoptile/coleo-rhiza covering the main compartments shoot, plumules (first true leaves) and radicle; a phosphatidylcholine [PC(36:4) + K]+, m/z 820.52531 (blue) inthe scutellum (monocot cotyledon); and a phosphatidylglycerol [PG(38 : 2) − H2O + H]+, m/z 785.56910 (red) in the pericarp-seed coat region. MSimages were acquired in positive ion mode with 320 × 180 pixels; 5 µm pixel size; and m/z bin width: Δm/z = ±5 ppm. (c) Overlay of three ionimages generated with high mass resolution (±5 ppm) and low spatial resolution (50 µm pixel size) resulting in a loss of spatial information. (d)Overlay of three ion images generated with low mass resolution (Δm/z = 0.1 bin width) and high spatial resolution (5 µm) resulting in a much lessdistinct resolution, due to neighboring peaks of similar masses which interfere with the image generation.
Fig. 4 Mass spectrometry imaging in negative ion mode of wheat seed at the soft dough stage. (a) The optical image of the 20 µm seed crosssection shows the coleoptile/coleorhiza (Co), scutellum (Sc), the endosperm (E), the pericarp-seed coat region (PS), and crease (Cr). Scale bar500 µm. (b) Overlay of ion images shows the tissue-specific spatial distributions of a polyphenol glycoside [M − H]−, m/z 563.14063 (green) detectedin the embryonic protection sheath coleoptile/coleorhiza covering the main compartments namely shoot, plumules (first true leaves) and radicle;and a phosphatidylinositol [PI(34 : 2) − H]−, m/z 833.51855 (red) located in the scutellum and endosperm, but absent in the crease. MS images weregenerated with 150 × 150 pixels; 15 µm pixel size; m/z bin width: Δm/z = ±5 ppm.
Analyst Paper
This journal is © The Royal Society of Chemistry 2015 Analyst, 2015, 140, 7696–7709 | 7701
Ope
n A
cces
s A
rtic
le. P
ublis
hed
on 1
6 Se
ptem
ber
2015
. Dow
nloa
ded
on 4
/2/2
022
1:08
:16
PM.
Thi
s ar
ticle
is li
cens
ed u
nder
a C
reat
ive
Com
mon
s A
ttrib
utio
n 3.
0 U
npor
ted
Lic
ence
.View Article Online
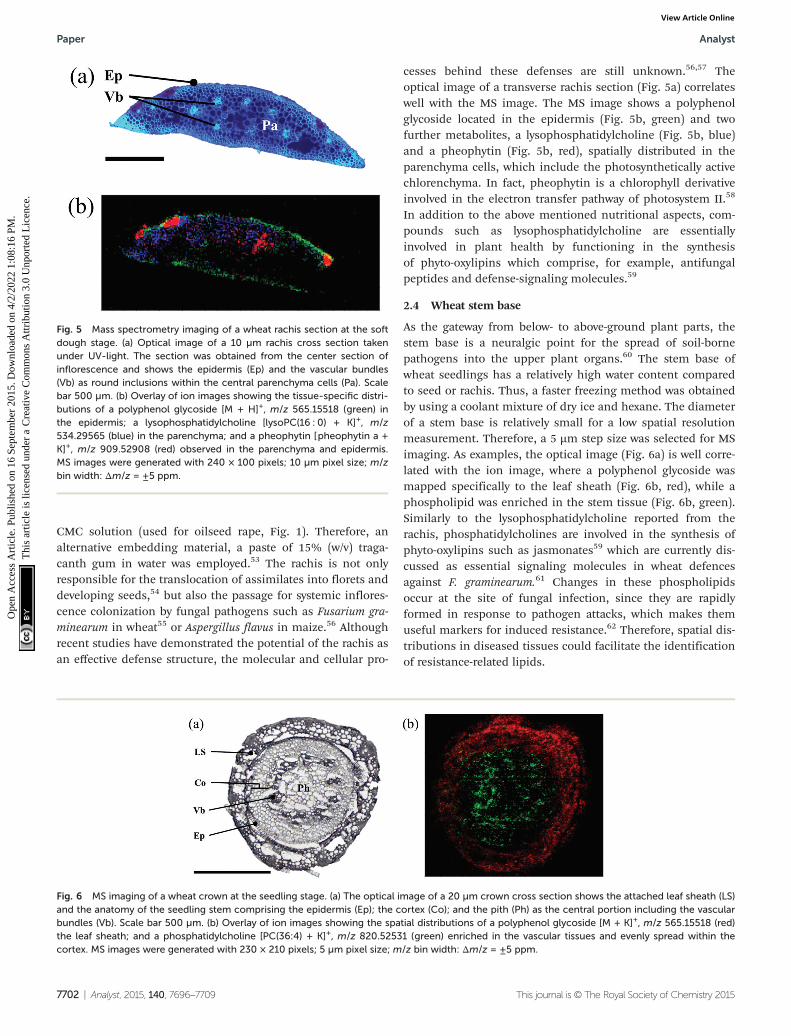
CMC solution (used for oilseed rape, Fig. 1). Therefore, analternative embedding material, a paste of 15% (w/v) traga-canth gum in water was employed.53 The rachis is not onlyresponsible for the translocation of assimilates into florets anddeveloping seeds,54 but also the passage for systemic inflores-cence colonization by fungal pathogens such as Fusarium gra-minearum in wheat55 or Aspergillus flavus in maize.56 Althoughrecent studies have demonstrated the potential of the rachis asan effective defense structure, the molecular and cellular pro-
cesses behind these defenses are still unknown.56,57 Theoptical image of a transverse rachis section (Fig. 5a) correlateswell with the MS image. The MS image shows a polyphenolglycoside located in the epidermis (Fig. 5b, green) and twofurther metabolites, a lysophosphatidylcholine (Fig. 5b, blue)and a pheophytin (Fig. 5b, red), spatially distributed in theparenchyma cells, which include the photosynthetically activechlorenchyma. In fact, pheophytin is a chlorophyll derivativeinvolved in the electron transfer pathway of photosystem II.58
In addition to the above mentioned nutritional aspects, com-pounds such as lysophosphatidylcholine are essentiallyinvolved in plant health by functioning in the synthesisof phyto-oxylipins which comprise, for example, antifungalpeptides and defense-signaling molecules.59
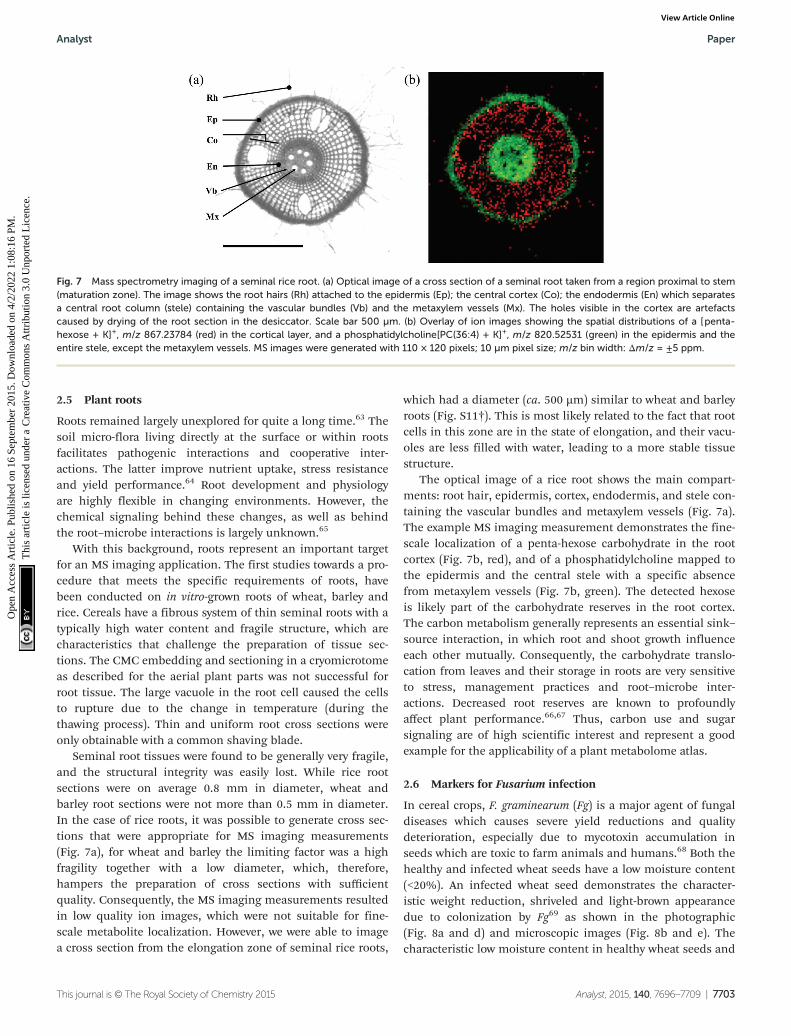
2.4 Wheat stem base
As the gateway from below- to above-ground plant parts, thestem base is a neuralgic point for the spread of soil-bornepathogens into the upper plant organs.60 The stem base ofwheat seedlings has a relatively high water content comparedto seed or rachis. Thus, a faster freezing method was obtainedby using a coolant mixture of dry ice and hexane. The diameterof a stem base is relatively small for a low spatial resolutionmeasurement. Therefore, a 5 µm step size was selected for MSimaging. As examples, the optical image (Fig. 6a) is well corre-lated with the ion image, where a polyphenol glycoside wasmapped specifically to the leaf sheath (Fig. 6b, red), while aphospholipid was enriched in the stem tissue (Fig. 6b, green).Similarly to the lysophosphatidylcholine reported from therachis, phosphatidylcholines are involved in the synthesis ofphyto-oxylipins such as jasmonates59 which are currently dis-cussed as essential signaling molecules in wheat defencesagainst F. graminearum.61 Changes in these phospholipidsoccur at the site of fungal infection, since they are rapidlyformed in response to pathogen attacks, which makes themuseful markers for induced resistance.62 Therefore, spatial dis-tributions in diseased tissues could facilitate the identificationof resistance-related lipids.
Fig. 5 Mass spectrometry imaging of a wheat rachis section at the softdough stage. (a) Optical image of a 10 µm rachis cross section takenunder UV-light. The section was obtained from the center section ofinflorescence and shows the epidermis (Ep) and the vascular bundles(Vb) as round inclusions within the central parenchyma cells (Pa). Scalebar 500 µm. (b) Overlay of ion images showing the tissue-specific distri-butions of a polyphenol glycoside [M + H]+, m/z 565.15518 (green) inthe epidermis; a lysophosphatidylcholine [lysoPC(16 : 0) + K]+, m/z534.29565 (blue) in the parenchyma; and a pheophytin [pheophytin a +K]+, m/z 909.52908 (red) observed in the parenchyma and epidermis.MS images were generated with 240 × 100 pixels; 10 µm pixel size; m/zbin width: Δm/z = ±5 ppm.
Fig. 6 MS imaging of a wheat crown at the seedling stage. (a) The optical image of a 20 µm crown cross section shows the attached leaf sheath (LS)and the anatomy of the seedling stem comprising the epidermis (Ep); the cortex (Co); and the pith (Ph) as the central portion including the vascularbundles (Vb). Scale bar 500 µm. (b) Overlay of ion images showing the spatial distributions of a polyphenol glycoside [M + K]+, m/z 565.15518 (red)the leaf sheath; and a phosphatidylcholine [PC(36:4) + K]+, m/z 820.52531 (green) enriched in the vascular tissues and evenly spread within thecortex. MS images were generated with 230 × 210 pixels; 5 µm pixel size; m/z bin width: Δm/z = ±5 ppm.
Paper Analyst
7702 | Analyst, 2015, 140, 7696–7709 This journal is © The Royal Society of Chemistry 2015
Ope
n A
cces
s A
rtic
le. P
ublis
hed
on 1
6 Se
ptem
ber
2015
. Dow
nloa
ded
on 4
/2/2
022
1:08
:16
PM.
Thi
s ar
ticle
is li
cens
ed u
nder
a C
reat
ive
Com
mon
s A
ttrib
utio
n 3.
0 U
npor
ted
Lic
ence
.View Article Online
2.5 Plant roots
Roots remained largely unexplored for quite a long time.63 Thesoil micro-flora living directly at the surface or within rootsfacilitates pathogenic interactions and cooperative inter-actions. The latter improve nutrient uptake, stress resistanceand yield performance.64 Root development and physiologyare highly flexible in changing environments. However, thechemical signaling behind these changes, as well as behindthe root–microbe interactions is largely unknown.65
With this background, roots represent an important targetfor an MS imaging application. The first studies towards a pro-cedure that meets the specific requirements of roots, havebeen conducted on in vitro-grown roots of wheat, barley andrice. Cereals have a fibrous system of thin seminal roots with atypically high water content and fragile structure, which arecharacteristics that challenge the preparation of tissue sec-tions. The CMC embedding and sectioning in a cryomicrotomeas described for the aerial plant parts was not successful forroot tissue. The large vacuole in the root cell caused the cellsto rupture due to the change in temperature (during thethawing process). Thin and uniform root cross sections wereonly obtainable with a common shaving blade.
Seminal root tissues were found to be generally very fragile,and the structural integrity was easily lost. While rice rootsections were on average 0.8 mm in diameter, wheat andbarley root sections were not more than 0.5 mm in diameter.In the case of rice roots, it was possible to generate cross sec-tions that were appropriate for MS imaging measurements(Fig. 7a), for wheat and barley the limiting factor was a highfragility together with a low diameter, which, therefore,hampers the preparation of cross sections with sufficientquality. Consequently, the MS imaging measurements resultedin low quality ion images, which were not suitable for fine-scale metabolite localization. However, we were able to imagea cross section from the elongation zone of seminal rice roots,
which had a diameter (ca. 500 µm) similar to wheat and barleyroots (Fig. S11†). This is most likely related to the fact that rootcells in this zone are in the state of elongation, and their vacu-oles are less filled with water, leading to a more stable tissuestructure.
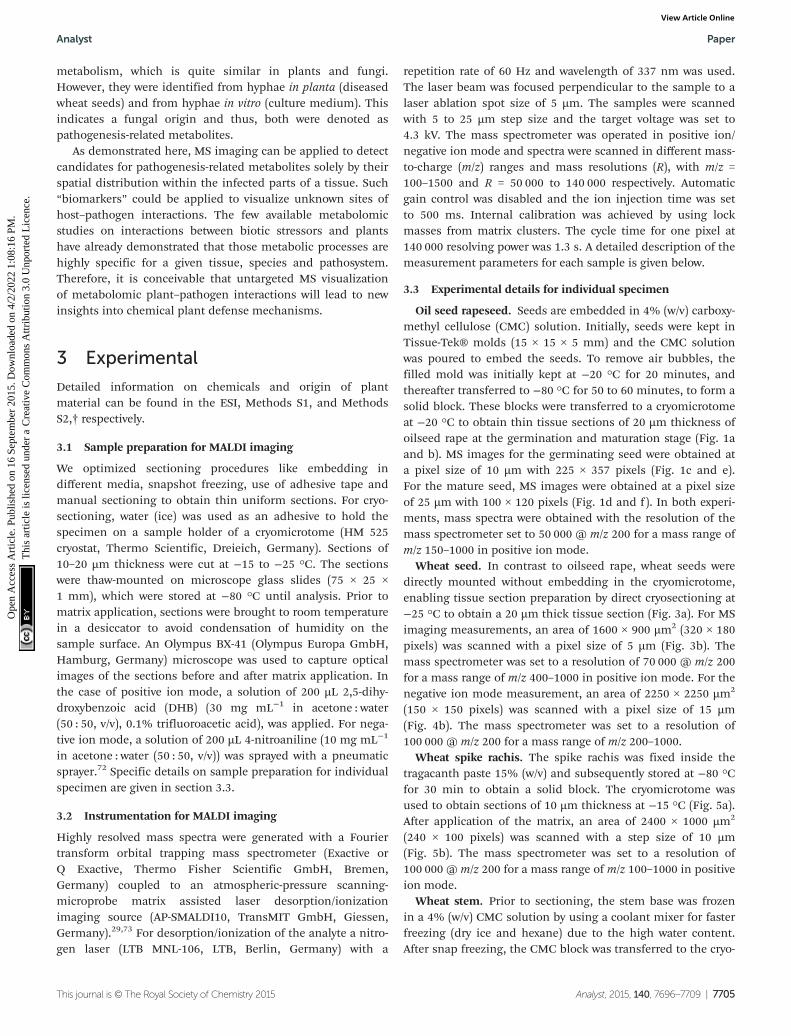
The optical image of a rice root shows the main compart-ments: root hair, epidermis, cortex, endodermis, and stele con-taining the vascular bundles and metaxylem vessels (Fig. 7a).The example MS imaging measurement demonstrates the fine-scale localization of a penta-hexose carbohydrate in the rootcortex (Fig. 7b, red), and of a phosphatidylcholine mapped tothe epidermis and the central stele with a specific absencefrom metaxylem vessels (Fig. 7b, green). The detected hexoseis likely part of the carbohydrate reserves in the root cortex.The carbon metabolism generally represents an essential sink–source interaction, in which root and shoot growth influenceeach other mutually. Consequently, the carbohydrate translo-cation from leaves and their storage in roots are very sensitiveto stress, management practices and root–microbe inter-actions. Decreased root reserves are known to profoundlyaffect plant performance.66,67 Thus, carbon use and sugarsignaling are of high scientific interest and represent a goodexample for the applicability of a plant metabolome atlas.
2.6 Markers for Fusarium infection
In cereal crops, F. graminearum (Fg) is a major agent of fungaldiseases which causes severe yield reductions and qualitydeterioration, especially due to mycotoxin accumulation inseeds which are toxic to farm animals and humans.68 Both thehealthy and infected wheat seeds have a low moisture content(<20%). An infected wheat seed demonstrates the character-istic weight reduction, shriveled and light-brown appearancedue to colonization by Fg69 as shown in the photographic(Fig. 8a and d) and microscopic images (Fig. 8b and e). Thecharacteristic low moisture content in healthy wheat seeds and
Fig. 7 Mass spectrometry imaging of a seminal rice root. (a) Optical image of a cross section of a seminal root taken from a region proximal to stem(maturation zone). The image shows the root hairs (Rh) attached to the epidermis (Ep); the central cortex (Co); the endodermis (En) which separatesa central root column (stele) containing the vascular bundles (Vb) and the metaxylem vessels (Mx). The holes visible in the cortex are artefactscaused by drying of the root section in the desiccator. Scale bar 500 µm. (b) Overlay of ion images showing the spatial distributions of a [penta-hexose + K]+, m/z 867.23784 (red) in the cortical layer, and a phosphatidylcholine[PC(36:4) + K]+, m/z 820.52531 (green) in the epidermis and theentire stele, except the metaxylem vessels. MS images were generated with 110 × 120 pixels; 10 µm pixel size; m/z bin width: Δm/z = ±5 ppm.
Analyst Paper
This journal is © The Royal Society of Chemistry 2015 Analyst, 2015, 140, 7696–7709 | 7703
Ope
n A
cces
s A
rtic
le. P
ublis
hed
on 1
6 Se
ptem
ber
2015
. Dow
nloa
ded
on 4
/2/2
022
1:08
:16
PM.
Thi
s ar
ticle
is li
cens
ed u
nder
a C
reat
ive
Com
mon
s A
ttrib
utio
n 3.
0 U
npor
ted
Lic
ence
.View Article Online

additionally the substantial disease-related physical changesrepresent a specific challenge for the preparation of thinuniform sections from wheat seeds.
To overcome this intrinsic problem, a tape-based method70
was adapted, which assists the generation of thin completesections from hard specimens. A specially prepared adhesivetape, functioning at low temperatures, was attached to the cutsurface of the sample to support the sectioning. The seed, sur-rounded by CMC as a block, was formed by freezing CMC in amold using a cooling mixture. For a comparative MS imaging,healthy and diseased seeds of the highly Fusarium head blight(FHB) susceptible wheat cultivar Florence-Aurore were used.The overlay ion images of a healthy (Fig. 8c) and an infectedwheat bran (Fig. 8f) show uniform distributions of a tetra-
hexose metabolite in the endosperm (Fig. 8f, red). However,several compounds were specifically detected in the bran ofthe infected seed, e.g. 4-(trimethylammonio)but-2-enoate(Fig. 8f, green). This distribution indicates a relationship withthe pathogen infection since Fg preferably colonizes this peri-pheral tissue in mature seeds.71 The localization of Fg in thisparticular sample was confirmed by fluorescence microscopy(Fig. S12†). The chemical identity of the fungus-related meta-bolite (4-(trimethylammonio)but-2-enoate) was confirmed byMS/MS analysis (Fig. S13f†). MALDI MS spectra of Fg hyphaealso resulted in the same metabolite signals (Fig. S13e†). Inaddition, a carnitine metabolite was detected in the infectedwheat bran (Fig. S13a and b†) and in fungal hyphae(Fig. S13e†). Both metabolites are a result of the carnitine
Fig. 8 Comparative mass spectrometry imaging of the uninfected and F. graminearum-infected wheat seeds at the ripening stage. The photo-graphic images show a healthy seed (a) and a seed infected by the fungal pathogen F. graminearum (d) a causal agent of the head blight disease. Theseeds were sampled from the highly FHB susceptible spring wheat cv. Florence-Aurore. Scale bars 500 µm. The optical images show 20 µm trans-verse sections of a healthy (b) and infected seed (e), which were prepared by using the Kuwamoto method. Scale bars 500 µm. Both the photo-graphic (d) and the optical image (e) of the infected seed demonstrate the characteristic weight reduction, shriveled and light-brown appearanceassociated with a highly susceptible reaction to the FHB disease. The overlay of ion images of healthy (c) and infected seeds (f ) show the spatial dis-tribution of a [tetra-hexose + K]+ metabolite, m/z 705.18502 (red) in the entire endosperm. In contrast, the metabolite 4-(trimethylammonio)but-2-enoate [M + K]+, m/z 182.05779 (green) located in the entire seed bran and germ was only detected in F. graminearum infected seeds. MS images ofthe healthy seed were generated with 205 × 170 pixels; 20 µm pixel size; m/z bin width: Δm/z = ±5 ppm. MS images of the infected seed were gen-erated with 155 × 105 pixels; 15 µm pixel size; m/z bin width: Δm/z = ±5 ppm.
Paper Analyst
7704 | Analyst, 2015, 140, 7696–7709 This journal is © The Royal Society of Chemistry 2015
Ope
n A
cces
s A
rtic
le. P
ublis
hed
on 1
6 Se
ptem
ber
2015
. Dow
nloa
ded
on 4
/2/2
022
1:08
:16
PM.
Thi
s ar
ticle
is li
cens
ed u
nder
a C
reat
ive
Com
mon
s A
ttrib
utio
n 3.
0 U
npor
ted
Lic
ence
.View Article Online
metabolism, which is quite similar in plants and fungi.However, they were identified from hyphae in planta (diseasedwheat seeds) and from hyphae in vitro (culture medium). Thisindicates a fungal origin and thus, both were denoted aspathogenesis-related metabolites.
As demonstrated here, MS imaging can be applied to detectcandidates for pathogenesis-related metabolites solely by theirspatial distribution within the infected parts of a tissue. Such“biomarkers” could be applied to visualize unknown sites ofhost–pathogen interactions. The few available metabolomicstudies on interactions between biotic stressors and plantshave already demonstrated that those metabolic processes arehighly specific for a given tissue, species and pathosystem.Therefore, it is conceivable that untargeted MS visualizationof metabolomic plant–pathogen interactions will lead to newinsights into chemical plant defense mechanisms.
3 Experimental
Detailed information on chemicals and origin of plantmaterial can be found in the ESI, Methods S1, and MethodsS2,† respectively.
3.1 Sample preparation for MALDI imaging
We optimized sectioning procedures like embedding indifferent media, snapshot freezing, use of adhesive tape andmanual sectioning to obtain thin uniform sections. For cryo-sectioning, water (ice) was used as an adhesive to hold thespecimen on a sample holder of a cryomicrotome (HM 525cryostat, Thermo Scientific, Dreieich, Germany). Sections of10–20 µm thickness were cut at −15 to −25 °C. The sectionswere thaw-mounted on microscope glass slides (75 × 25 ×1 mm), which were stored at −80 °C until analysis. Prior tomatrix application, sections were brought to room temperaturein a desiccator to avoid condensation of humidity on thesample surface. An Olympus BX-41 (Olympus Europa GmbH,Hamburg, Germany) microscope was used to capture opticalimages of the sections before and after matrix application. Inthe case of positive ion mode, a solution of 200 µL 2,5-dihy-droxybenzoic acid (DHB) (30 mg mL−1 in acetone : water(50 : 50, v/v), 0.1% trifluoroacetic acid), was applied. For nega-tive ion mode, a solution of 200 µL 4-nitroaniline (10 mg mL−1
in acetone : water (50 : 50, v/v)) was sprayed with a pneumaticsprayer.72 Specific details on sample preparation for individualspecimen are given in section 3.3.
3.2 Instrumentation for MALDI imaging
Highly resolved mass spectra were generated with a Fouriertransform orbital trapping mass spectrometer (Exactive orQ Exactive, Thermo Fisher Scientific GmbH, Bremen,Germany) coupled to an atmospheric-pressure scanning-microprobe matrix assisted laser desorption/ionizationimaging source (AP-SMALDI10, TransMIT GmbH, Giessen,Germany).29,73 For desorption/ionization of the analyte a nitro-gen laser (LTB MNL-106, LTB, Berlin, Germany) with a
repetition rate of 60 Hz and wavelength of 337 nm was used.The laser beam was focused perpendicular to the sample to alaser ablation spot size of 5 µm. The samples were scannedwith 5 to 25 µm step size and the target voltage was set to4.3 kV. The mass spectrometer was operated in positive ion/negative ion mode and spectra were scanned in different mass-to-charge (m/z) ranges and mass resolutions (R), with m/z =100–1500 and R = 50 000 to 140 000 respectively. Automaticgain control was disabled and the ion injection time was setto 500 ms. Internal calibration was achieved by using lockmasses from matrix clusters. The cycle time for one pixel at140 000 resolving power was 1.3 s. A detailed description of themeasurement parameters for each sample is given below.
3.3 Experimental details for individual specimen
Oil seed rapeseed. Seeds are embedded in 4% (w/v) carboxy-methyl cellulose (CMC) solution. Initially, seeds were kept inTissue-Tek® molds (15 × 15 × 5 mm) and the CMC solutionwas poured to embed the seeds. To remove air bubbles, thefilled mold was initially kept at −20 °C for 20 minutes, andthereafter transferred to −80 °C for 50 to 60 minutes, to form asolid block. These blocks were transferred to a cryomicrotomeat −20 °C to obtain thin tissue sections of 20 µm thickness ofoilseed rape at the germination and maturation stage (Fig. 1aand b). MS images for the germinating seed were obtained ata pixel size of 10 µm with 225 × 357 pixels (Fig. 1c and e).For the mature seed, MS images were obtained at a pixel sizeof 25 µm with 100 × 120 pixels (Fig. 1d and f). In both experi-ments, mass spectra were obtained with the resolution of themass spectrometer set to 50 000 @ m/z 200 for a mass range ofm/z 150–1000 in positive ion mode.
Wheat seed. In contrast to oilseed rape, wheat seeds weredirectly mounted without embedding in the cryomicrotome,enabling tissue section preparation by direct cryosectioning at−25 °C to obtain a 20 µm thick tissue section (Fig. 3a). For MSimaging measurements, an area of 1600 × 900 µm2 (320 × 180pixels) was scanned with a pixel size of 5 µm (Fig. 3b). Themass spectrometer was set to a resolution of 70 000 @ m/z 200for a mass range of m/z 400–1000 in positive ion mode. For thenegative ion mode measurement, an area of 2250 × 2250 µm2
(150 × 150 pixels) was scanned with a pixel size of 15 µm(Fig. 4b). The mass spectrometer was set to a resolution of100 000 @ m/z 200 for a mass range of m/z 200–1000.
Wheat spike rachis. The spike rachis was fixed inside thetragacanth paste 15% (w/v) and subsequently stored at −80 °Cfor 30 min to obtain a solid block. The cryomicrotome wasused to obtain sections of 10 µm thickness at −15 °C (Fig. 5a).After application of the matrix, an area of 2400 × 1000 µm2
(240 × 100 pixels) was scanned with a step size of 10 µm(Fig. 5b). The mass spectrometer was set to a resolution of100 000 @ m/z 200 for a mass range of m/z 100–1000 in positiveion mode.
Wheat stem. Prior to sectioning, the stem base was frozenin a 4% (w/v) CMC solution by using a coolant mixer for fasterfreezing (dry ice and hexane) due to the high water content.After snap freezing, the CMC block was transferred to the cryo-
Analyst Paper
This journal is © The Royal Society of Chemistry 2015 Analyst, 2015, 140, 7696–7709 | 7705
Ope
n A
cces
s A
rtic
le. P
ublis
hed
on 1
6 Se
ptem
ber
2015
. Dow
nloa
ded
on 4
/2/2
022
1:08
:16
PM.
Thi
s ar
ticle
is li
cens
ed u
nder
a C
reat
ive
Com
mon
s A
ttrib
utio
n 3.
0 U
npor
ted
Lic
ence
.View Article Online
stat for sectioning, and sections of 20 µm thickness wereobtained at −20 °C (Fig. 6a), scanning an area of 1150 × 1050 µm2
(230 × 210 pixels) with a step size of 10 µm (Fig. 6b). The massspectrometer was set to a resolution of 70 000 @ m/z 200 for amass range of m/z 250–1000 in positive ion mode.
Rice roots. Root cross sections were taken from the matu-ration zone of seminal roots. A common shaving blade was usedto obtain thin sections. Thereby, a root was held in between ahalved Styrofoam®, and afterwards the blade was moved fromtop to bottom tangential to the Styrofoam®. The obtained thinsection was placed on a glass slide (Fig. 7a). MS imaging analysison root sections was performed in an area of 1100 × 1200 µm2
(110 × 120 pixels) with a 10 µm step size (Fig. 7b). The massspectrometer was set to a resolution of 50 000 @ m/z 200 for amass range ofm/z 100–1200 in positive ion mode.
Fusarium graminearum infected wheat seed. Wheat seedswere embedded in a 4% CMC solution followed by snap freez-ing using a coolant mixture (dry ice and hexane). Sub-sequently, the block was placed in a cryomicrotome sampleholder. Tissue sections of 20 µm thickness were obtained at−20 °C. The adhesive tape was kept over the trimmed sample.Then a uniform smooth surface was used to give light pressureso that the adhesive tape sticks to the surface of the sample.Then a twister was used to hold the tape while the cryomicro-tome blade was slowly moved to obtain the tissue section onthe adhesive tape (Fig. 8b and e). Then the adhesive tape withthe section was fixed on a glass slide, using a double-sidedtape. A matrix was applied on the tissue while the sample wasattached to the adhesive tape. In the case of the healthy wheatseed, an area of 4100 × 3400 µm2 (205 × 170 pixels) wasscanned with a step size of 20 µm (Fig. 8c). In the case of theinfected seed, which is comparatively smaller in dimension, astep size of 15 µm was used (Fig. 8f). In both cases, the massresolution was set at 100 000 @ m/z 200 for a mass range ofm/z 100–1000 in positive ion mode.
3.4 Data processing and image generation
Ion images of selected m/z values were generated using the in-house developed MIRION software package74 with a m/z binwidth of Δm/z = ± 5 ppm. The ion images were normalized tothe highest intensity for each ion species separately. RGBimages of three different m/z values were overlaid and demon-strated simultaneously. Other data processing steps like inter-polation, smoothing or normalization to the matrix signals werenot needed and were not applied during the image generationprocess. The MS images in ESI, Fig. S6 and Fig S7,† were gen-erated by converting the raw files from the Orbitrap instru-ment to the imzML format.75 Images were then generated withan MSiReader version 0.0476 in the batch processing option,based on a predefined theoretical m/z value list. Mass accu-racies for Table S1† were calculated by77 using intensity-weighted average values from all spectra of one image.
Literature and METLIN search was used to identify com-pounds. The compounds were identified using high mass accu-racy (<2 ppm). For subsequent biological interpretation,annotated metabolites were assigned to appropriate metabolome
categories and pathways by consulting the web applications,KEGG Pathway Maps,78 MetaCyc Pathway,79 and LIPID MAPS.80
4 Conclusions
In this study, we present an approach for MS imaging of plantmetabolites that cover multiple mono- and dicot species,major plant organs and a wide variety of compound classes.The results were in excellent agreement with previous reportsincluding bulk sample MS studies and in addition providednew information on the detailed spatial distribution of impor-tant plant metabolites. In contrast to classical imagingmethods, the analytes in MS imaging do not have to be knownupfront. All presented MS imaging measurements are basedon accurate mass determination (mass accuracy better than2 ppm) for reliable identification, and were performed at 5 to25 µm pixel size in order to visualize small spatial features.
Previous MS imaging studies of plants were limited to aselected organ in a particular species and focused on a certaincompound class. In order to cover a wider range of plantorgans, we optimized different preparation methods, whichwere designed according to the physicochemical properties ofthe varying plant organs and tissues. Fig. 9 summarizes theresults presented in this manuscript and also includesadditional plant tissues (distal root, leaf and stem) which arediscussed in the ESI (Fig. S11, S14 and S15†). This demon-strates that MS imaging is now applicable to the entire plantfrom head to roots. It covers all the plant organs with relevancefor current and future studies towards a comprehensive under-standing of physiological and molecular mechanisms behindcomplex traits and environmental adaptations. One appli-cation is to investigate the changes in metabolites duringplant development as shown for mature and germinatingseeds of oilseed rape. The detailed localization of morethan 90 compounds allowed assignments to certain metabolicprocesses and the first clues to functions in plant tissues. Thewide range of analyzed compounds also enabled us to describemetabolic pathways, as demonstrated for example by thehitherto unseen spatio-temporal distributions of 22 phenyl-propanoids representing a metabolomic network associatedwith sinapate esters which is considered a major componentof oilseed rape meal quality.
The ‘untargeted’ nature of MS imaging allows the detectionof marker compounds for a specific physiological status, forexample to investigate or predict the quality of plant–pathogeninteractions. For Fusarium head blight, one of the most devas-tating diseases affecting grain crops, fungus-specific com-pounds were detected in the infected wheat seeds and theirdistribution matched with florescence labeling.
These examples demonstrate the wealth of information thatcan be obtained from high resolution MS imaging of plantmetabolites. If this approach is combined with the classicalLC-MS/MS approaches and applied on a larger scale it couldbe used to build up an inventory of the plant metabolome.The long-term goal would be to establish a plant metabolome
Paper Analyst
7706 | Analyst, 2015, 140, 7696–7709 This journal is © The Royal Society of Chemistry 2015
Ope
n A
cces
s A
rtic
le. P
ublis
hed
on 1
6 Se
ptem
ber
2015
. Dow
nloa
ded
on 4
/2/2
022
1:08
:16
PM.
Thi
s ar
ticle
is li
cens
ed u
nder
a C
reat
ive
Com
mon
s A
ttrib
utio
n 3.
0 U
npor
ted
Lic
ence
.View Article Online

atlas for different species similar to the human proteomeatlas81 or the Drosophila melanogaster metabolome atlas.82
Similar to the insect field, the first step would be to establish ametabolome atlas for selected species, e.g. wheat as an impor-tant crop plant and Arabidopsis thaliana as a frequently usedplant model. The initial generation of a baseline tissue map asinitiated with the presented study would be an important stepin this direction. Metabolites are the end products of cellularprocesses and therefore, can provide comprehensive infor-mation on a plant’s physiological status. Therefore an atlas ofbiochemical networks can lead to novel insights into meta-bolic capacities of cells,83 or can be used as reference for pro-filing studies. For example, in pathogen-interaction studies MSimaging data from the infected plants (as shown in section2.6) could be compared with the atlas data to identify com-pounds which are specific for this plant physiological status.
In general this kind of information can be used as a referenceto investigate systemic and local effects of stress (biotic orabiotic), developmental stages as well as wildtype/genotypestudies. In addition, the distribution of these markers couldgive a first indication about their functional role.
Therefore the authors are convinced that high resolutionMS imaging will provide new valuable insights into manyareas of plant research in the future.
Acknowledgements
The authors would like to acknowledge Fateme Mirzajani(Department of Phytochemistry, Shahid Beheshti University,Iran) for the rice root samples and Christian Obermeier(Department of Plant Breeding, IFZ, Justus Liebig University
Fig. 9 Overview on the different plant structures which have been made available for high resolution MS imaging. Scale bars in all images 500 µm.(a) Sketch of a plant. (b) MS image of wheat inflorescence rachis measured at 10 µm pixel size, details are given in Fig. 5. (c) MS image of a seminalproximal rice root (maturation zone) measured at 10 µm pixel size; details are given in Fig. 7. (d) MS image of a seminal distal rice root (elongationzone) measured at 10 µm pixel size, details are given in ESI, Fig. S11.† (e) MS image of a wheat leaf blade measured at 10 µm pixel size, details aregiven in ESI, Fig. S14.† (f ) MS image of germinating oilseed rape at 10 µm pixel size, details are given in Fig. 1. (g) MS image of oilseed rape stem at20 µm pixel size, details are given in ESI, Fig. S15.† (h) MS image of wheat stem base at 5 µm pixel size, details are given in Fig. 6.
Analyst Paper
This journal is © The Royal Society of Chemistry 2015 Analyst, 2015, 140, 7696–7709 | 7707
Ope
n A
cces
s A
rtic
le. P
ublis
hed
on 1
6 Se
ptem
ber
2015
. Dow
nloa
ded
on 4
/2/2
022
1:08
:16
PM.
Thi
s ar
ticle
is li
cens
ed u
nder
a C
reat
ive
Com
mon
s A
ttrib
utio
n 3.
0 U
npor
ted
Lic
ence
.View Article Online
Giessen, Germany) for providing seeds and stem of oilseedrape. This work was funded by the Hessian Ministry of Scienceand Arts (HMWK) through LOEWE focus “Ambiprobe” and bythe Deutsche Forschungsgemeinschaft DFG Sp314/13-1.
References
1 R. M. Pérez-Clemente, V. Vives, S. I. Zandalinas,M. F. López-Climent, V. Muñoz and A. Gómez-Cadenas,BioMed Res. Int., 2013, 2013, 654120.
2 R. A. Dixon and D. Strack, Phytochemistry, 2003, 62, 815–816.
3 R. Nakabayashi and K. Saito, Anal. Bioanal. Chem., 2013,405, 5005–5011.
4 N. Carreno-Quintero, H. J. Bouwmeester andJ. J. Keurentjes, Trends Genet., 2013, 29, 41–50.
5 C. Brunetti, R. M. George, M. Tattini, K. Field andM. P. Davey, J. Exp. Bot., 2013, 64, 4011–4020.
6 T. Obata and A. R. Fernie, Cell. Mol. Life Sci., 2012, 69,3225–3243.
7 D. Balmer, V. Flors, G. Glauser and B. Mauch-Mani, Front.Plant Sci., 2013, 4, 82.
8 G. J. Patti, O. Yanes and G. Siuzdak, Nat. Rev. Mol. CellBiol., 2012, 13, 263–269.
9 T. Neuberger, H. Rolletschek, A. Webb and L. Borisjuk, inLipidomics, ed. D. Armstrong, Humana Press, 2009, vol.579, ch. 24, pp. 485–496.
10 S. L. Shaw and D. W. Ehrhardt, Annu. Rev. Plant Biol., 2013,64, 351–375.
11 Y. J. Lee, D. C. Perdian, Z. Song, E. S. Yeung andB. J. Nikolau, Plant J., 2012, 70, 81–95.
12 A. K. Mullen, M. R. Clench, S. Crosland and K. R. Sharples,Rapid Commun. Mass Spectrom., 2005, 19, 2507–2516.
13 S. Robinson, K. Warburton, M. Seymour, M. Clench andJ. Thomas-Oates, New Phytol., 2007, 173, 438–444.
14 Y. Yoshimura, N. Zaima, T. Moriyama and Y. Kawamura,PLoS One, 2012, 7, e31285.
15 N. Zaima, N. Goto-inoue, T. Hayasaka and M. Setou, RapidCommun. Mass Spectrom., 2010, 2723–2729.
16 J. H. Jun, Z. Song, Z. Liu, B. J. Nikolau, E. S. Yeung andY. J. Lee, Anal. Chem., 2010, 82, 3255–3265.
17 R. Shroff, F. Vergara, A. Muck, A. Svatos and J. Gershenzon,Proc. Natl. Acad. Sci. U. S. A., 2008, 105, 6196–6201.
18 V. Vrkoslav, A. Muck, J. Cvačka and A. Svatoš, J. Am. Soc.Mass Spectrom., 2010, 21, 220–231.
19 J. Sarsby, M. W. Towers, C. Stain, R. Cramer andO. A. Koroleva, Phytochemistry, 2012, 77, 110–118.
20 M. Peukert, A. Matros, G. Lattanzio, S. Kaspar, J. Abadíaand H.-P. Mock, New Phytol., 2012, 193, 806–815.
21 P. Franceschi, Y. Dong, K. Strupat, U. Vrhovsek andF. Mattivi, J. Exp. Bot., 2012, 63, 1123–1133.
22 P. J. Horn, A. R. Korte, P. B. Neogi, E. Love, J. Fuchs,K. Strupat, L. Borisjuk, V. Shulaev, Y. J. Lee andK. D. Chapman, Plant Cell Online, 2012, 24, 622–636.
23 A. R. Korte, Z. Song, B. J. Nikolau and Y. J. Lee, Anal.Methods, 2012, 4, 474.
24 R. J. R. Jaeger, M. Lamshöft, S. Gottfried, M. Spiteller andP. Spiteller, J. Nat. Prod., 2013, 76, 127–134.
25 N. Goto-Inoue, M. Setou and N. Zaima, Anal. Sci., 2010, 26,821–825.
26 P. J. Horn, J. E. Silva, D. Anderson, J. Fuchs, L. Borisjuk,T. J. Nazarenus, V. Shulaev, E. B. Cahoon andK. D. Chapman, Plant J., 2013, 76, 138–150.
27 A. Korte, M. Yandeau-Nelson, B. Nikolau and Y. Lee, Anal.Bioanal. Chem., 2015, 407, 2301–2309.
28 D. Holscher, R. Shroff, K. Knop, M. Gottschaldt,A. Crecelius, B. Schneider, D. G. Heckel, U. S. Schubert andA. Svatos, Plant J., 2009, 60, 907–918.
29 A. Römpp, S. Guenther, Y. Schober, O. Schulz, Z. Takats,W. Kummer and B. Spengler, Angew. Chem., Int. Ed., 2010,49, 3834–3838.
30 A. Römpp and B. Spengler, Histochem. Cell Biol., 2013, 139,759–783.
31 A. Berisha, S. Dold, S. Guenther, N. Desbenoit, Z. Takats,B. Spengler and A. Römpp, Rapid Commun. Mass Spectrom.,2014, 28, 1779–1791.
32 D. Bhandari, T. Shen, A. Römpp, H. Zorn and B. Spengler,Anal. Bioanal. Chem., 2014, 406, 695–704.
33 B. Li, D. R. Bhandari, C. Janfelt, A. Römpp and B. Spengler,Plant J., 2014, 80, 161–171.
34 M. J. Holdsworth, W. E. Finch-Savage, P. Grappin andD. Job, Trends Plant Sci., 2008, 13, 7–13.
35 R. Angelovici, G. Galili, A. R. Fernie and A. Fait, TrendsPlant Sci., 2010, 15, 211–218.
36 P. Koehler, G. Hartmann, H. Wieser and M. Rychlik,J. Agric. Food Chem., 2007, 55, 4678–4683.
37 U. Thiyam, P. Claudia, U. Jan and B. Alfred, Eur. Food Res.Technol., 2009, 229, 825–831.
38 J. Fang, M. Reichelt, W. Hidalgo, S. Agnolet andB. Schneider, PloS One, 2012, 7, e48006.
39 A. Baumert, C. Milkowski, J. Schmidt, M. Nimtz, V. Wrayand D. Strack, Phytochemistry, 2005, 66, 1334–1345.
40 D. Meissner, A. Albert, C. Böttcher, D. Strack andC. Milkowski, Planta, 2008, 228, 663–674.
41 P. Burchard, W. Bilger and G. Weissenböck, Plant CellEnviron., 2000, 23, 1373–1380.
42 K. Clauss, E. von Roepenack-Lahaye, C. Bottcher,M. R. Roth, R. Welti, A. Erban, J. Kopka, D. Scheel,C. Milkowski and D. Strack, Plant Physiol., 2011, 155, 1127–1145.
43 J. Mittasch, C. Böttcher, A. Frolov, D. Strack andC. Milkowski, Plant Physiol., 2013, 161, 1656–1669.
44 A. Hüsken, A. Baumert, D. Strack, H. C. Becker,C. Möllers and C. Milkowski, Mol. Breed., 2005, 16,127–138.
45 M. Noda and M. Matsumoto, Biochim. Biophys. Acta, 1971,231, 131–133.
46 B. Manning, K. Schulze and T. McNee, in Wheat growth &development, ed. J. White and J. Edwards, NSW Departmentof Primary Industries, 2007, pp. 71–86.
Paper Analyst
7708 | Analyst, 2015, 140, 7696–7709 This journal is © The Royal Society of Chemistry 2015
Ope
n A
cces
s A
rtic
le. P
ublis
hed
on 1
6 Se
ptem
ber
2015
. Dow
nloa
ded
on 4
/2/2
022
1:08
:16
PM.
Thi
s ar
ticle
is li
cens
ed u
nder
a C
reat
ive
Com
mon
s A
ttrib
utio
n 3.
0 U
npor
ted
Lic
ence
.View Article Online

47 J. B. Harborne and C. A. Williams, Phytochemistry, 2000, 55,481–504.
48 R. Tanoue, M. Kobayashi, K. Katayama, N. Nagata andH. Wada, FEBS Lett., 2014, 588, 1680–1685.
49 X. Wang, Curr. Opin. Plant Biol., 2004, 7, 329–336.50 H. Xue, X. Chen and G. Li, Current Opin. Plant Biol., 2007,
10, 483–489.51 J. A. Engelman, J. Luo and L. C. Cantley, Nat. Rev. Genet.,
2006, 7, 606–619.52 J. Liu, J. Zhou and D. Xing, PLoS One, 2012, 7, e33817.53 F. Brignole-Baudouin, N. Desbenoit, G. Hamm, H. Liang,
J.-P. Both, A. Brunelle, I. Fournier, V. Guerineau,R. Legouffe, J. Stauber, D. Touboul, M. Wisztorski,M. Salzet, O. Laprevote and C. Baudouin, PLoS One, 2012,7, e50180.
54 R. Metzner, M. R. Thorpe, U. Breuer, P. Blumler, U. Schurr,H. U. Schneider and W. H. Schroeder, Plant Cell Environ.,2010, 33, 1393–1407.
55 N. A. Brown, C. Bass, T. K. Baldwin, H. Chen, F. Massot,P. W. Carion, M. Urban, A. M. van de Meene andK. E. Hammond-Kosack, J. Pathog., 2011, 2011, 626345.
56 Z. Magbanua, W. Williams and D. Luthe, Maydica, 2013,58, 182–188.
57 N. A. Brown, M. Urban, A. M. van de Meene andK. E. Hammond-Kosack, Fungal Biol., 2010, 114, 555–571.
58 Y. Saga and H. Tamiaki, Chem. Biodiversity, 2012, 9, 1659–1683.
59 L. C. van Loon, M. Rep and C. M. J. Pieterse, Annu. Rev.Phytopathol., 2006, 44, 135–162.
60 A. M. Mudge, R. Dill-Macky, Y. Dong, D. M. Gardiner,R. G. White and J. M. Manners, Physiol. Mol. Plant Pathol.,2006, 69, 73–85.
61 S. Gottwald, B. Samans, S. Lück and W. Friedt, BMC Geno-mics, 2012, 13, 1–22.
62 C. Tayeh, B. Randoux, F. Laruelle, N. Bourdon, D. Renard-Merlier and P. Reignault, Lipids as Markers of InducedResistance in Wheat: A Biochemical and Molecular Approach,2013.
63 J. Raaijmakers, T. Paulitz, C. Steinberg, C. Alabouvette andY. Moënne-Loccoz, Plant Soil, 2009, 321, 341–361.
64 J. S. Singh, V. C. Pandey and D. P. Singh, Agric. Ecosyst.Environ., 2011, 140, 339–353.
65 J. Shen, C. Li, G. Mi, L. Li, L. Yuan, R. Jiang and F. Zhang,J Exp. Bot., 2013, 64, 1181–1192.
66 Y. L. Ruan, Annu. Rev. Plant Biol., 2014, 65, 33–67.
67 L. V. Kravchenko, A. I. Shapozhnikov, N. M. Makarova,T. S. Azarova, K. A. L’vova, I. I. Kostyuk, O. A. Lyapunovaand I. A. Tikhonovich, Russ. J. Plant Physiol., 2011, 58, 936–940.
68 K. Kazan, D. M. Gardiner and J. M. Manners, Mol. PlantPathol., 2012, 13, 399–413.
69 S. Walter, P. Nicholson and F. M. Doohan, New Phytol.,2010, 185, 54–66.
70 T. Kawamoto, Arch. Histol. Cytol., 2003, 66, 123–143.71 E. M. Del Ponte, J. M. C. Fernandes and G. C. Bergstrom,
J. Phytopathol., 2007, 155, 577–581.72 W. Bouschen, O. Schulz, D. Eikel and B. Spengler, Rapid
Commun. Mass Spectrom., 2010, 24, 355–364.73 M. Koestler, D. Kirsch, A. Hester, A. Leisner, S. Guenther
and B. Spengler, Rapid Commun. Mass Spectrom., 2008, 22,3275–3285.
74 C. Paschke, A. Leisner, A. Hester, K. Maass, S. Guenther,W. Bouschen and B. Spengler, J. Am. Soc. Mass Spectrom.,2013, 24, 1296–1306.
75 T. Schramm, A. Hester, I. Klinkert, J.-P. Both,R. M. A. Heeren, A. Brunelle, O. Laprévote, N. Desbenoit,M.-F. Robbe, M. Stoeckli, B. Spengler and A. Römpp, J. Pro-teomics, 2012, 75, 5106–5110.
76 G. Robichaud, K. P. Garrard, J. A. Barry andD. C. Muddiman, J. Am. Soc. Mass Spectrom., 2013, 24, 718–721.
77 A. G. Brenton and A. R. Godfrey, J. Am. Soc. Mass Spectrom.,2010, 21, 1821–1835.
78 M. Kanehisa, S. Goto, S. Kawashima, Y. Okuno andM. Hattori, Nucleic Acids Res., 2004, 32, D277–D280.
79 R. Caspi, T. Altman, K. Dreher, C. A. Fulcher, P. Subhraveti,I. M. Keseler, A. Kothari, M. Krummenacker,M. Latendresse, L. A. Mueller, Q. Ong, S. Paley, A. Pujar,A. G. Shearer, M. Travers, D. Weerasinghe, P. Zhang andP. D. Karp, Nucleic Acids Res., 2012, 40, D742–D753.
80 E. Fahy, M. Sud, D. Cotter and S. Subramaniam, NucleicAcids Res., 2007, 35, W606–W612.
81 M. Uhlen, P. Oksvold, L. Fagerberg, E. Lundberg,K. Jonasson, M. Forsberg, M. Zwahlen, C. Kampf,K. Wester, S. Hober, H. Wernerus, L. Bjorling andF. Ponten, Nat. Biotechnol., 2010, 28, 1248–1250.
82 V. R. Chintapalli, M. Al Bratty, D. Korzekwa, D. G. Watsonand J. A. Dow, PLoS One, 2013, 8, e78066.
83 M. Arita, Proc. Natl. Acad. Sci. U. S. A., 2004, 101, 1543–1547.
Analyst Paper
This journal is © The Royal Society of Chemistry 2015 Analyst, 2015, 140, 7696–7709 | 7709
Ope
n A
cces
s A
rtic
le. P
ublis
hed
on 1
6 Se
ptem
ber
2015
. Dow
nloa
ded
on 4
/2/2
022
1:08
:16
PM.
Thi
s ar
ticle
is li
cens
ed u
nder
a C
reat
ive
Com
mon
s A
ttrib
utio
n 3.
0 U
npor
ted
Lic
ence
.View Article Online