optimizing high-resolution mass spectrometry for the
TRANSCRIPT

1
Optimizing High-Resolution Mass Spectrometry for the Identification of Low-Abundance Post-Translational Modifications of Intact Proteins
Lisa E. Kilpatrick*,1 and Eric L. Kilpatrick1
1National Institute of Standards and Technology, Material Measurement Laboratory, Biomolecular Measurement Division, 100 Bureau Drive, Stop 8314, Gaithersburg, Maryland, 20899, USA. *corresponding author Phone: 301-975-5323, Fax: 301-975-8505, E-mail: [email protected].
2
Abstract Intact protein analysis by liquid chromatography-mass spectrometry (LC-MS) is now possible due to the improved capabilities of mass spectrometers yielding greater resolution, mass accuracy, and extended mass ranges. Concurrent measurement of post-translational modifications (PTMs) during LC-MS of intact proteins is advantageous while monitoring critical proteoform status, such as for clinical samples or during production of reference materials. However, difficulties exist for PTM identification when the protein is large or contains multiple modification sites. In this work, analyses of low abundance proteoforms of proteins of clinical or therapeutic interest, including C-reactive protein, vitamin D-binding protein, transferrin, and immunoglobulin G (NISTmAb), were performed on an Orbitrap Elite mass spectrometer. This work investigated the effect of various instrument parameters including source temperatures, in-source CID, microscan type and quantity, resolution, and automatic gain control on spectral quality. The signal-to-noise ratio was found to be a suitable spectral attribute which facilitated identification of low abundance PTMs. Source temperature and CID voltage were found to require specific optimization for each protein. This study identifies key instrumental parameters requiring optimization for improved detection of a variety of PTMs by LC-MS and establishes a methodological framework to ensure robust proteoform identifications, the first step in their ultimate quantification.
Keywords: Orbitrap; LC-MS; proteoform; intact protein; post-translational modification
3
Introduction Mass spectrometry by bottom-up analysis has been the workhorse of proteomics experiments by offering the ability to identify tens of thousands of peptides within a single LC-MS/MS separation.1-2 However, analysis of intact proteins by LC-MS and LC-MS/MS is becoming more common as mass spectrometers with greater resolution, mass accuracy, extended m/z ranges and improved data analysis software are becoming available. Bottom-up LC-MS/MS of digested proteins is currently a superior approach to identify sites of PTMs on peptides due to better fragmentation and fewer possibilities of localization, however, this technique destroys information regarding the relationship of multiple PTMs on a given protein species. In contrast, analysis of intact proteins has the advantage that multiple sites of PTMs are preserved with the result that different forms of the protein, i.e. proteoforms,3 can be detected in the same analysis. These proteoforms may include differences in amino acid sequence and post-translational modifications in various combinations. Compared to bottom-up experiments, analysis of intact proteins also has the advantage of simpler and more rapid sample preparation which therefore reduces the potential for experimentally induced PTMs such as deamidation and oxidation.
Characterization of proteoforms and their modifications by LC-MS and MS/MS allows determination of biologically relevant groupings which increases understanding of the regulation, function and intracellular localization of proteins.4-6 In the biopharmaceutical industry, characterization of proteoforms is also important in monitoring the stability, efficacy, and immunogenicity of therapeutic proteins during production.7-8 Analysis of intact proteins is frequently performed by top-down MS/MS which differs from LC-MS analysis by performing fragmentation on the protein during the subsequent tandem MS analysis. While top-down analysis may be used in a high-throughput manner, as protein size increases it becomes difficult to efficiently fragment the ionized protein and resolve fragment peaks,9-12 making PTM identification and site localization difficult. Therefore, top-down MS/MS has typically focused on smaller proteins (less than about 50 kDa) due to insufficient fragmentation along with other issues as protein size increases such as solubility, the inherent difficulty in LC separation, and limits in mass spectrometer performance. However, recent publications have shown successful MS analysis of large proteins, such as antibodies13-16 at about 150 kDa and large protein complexes in the mega-Daltons.17-20 Other limitations on top-down analysis for PTMs exist where the modification may be of low abundance, there are many modifications present, or there is a complex mixture of proteins being analyzed. In these cases, slow scan speeds or low ion intensity may preclude selection and subsequent analysis of product ions during an automated LC-MS/MS run. A recent interlaboratory comparison highlighted some of these difficulties.21
Intact protein analysis without fragmentation may be preferred in cases where high-throughput MS/MS does not perform optimally or when subtle changes in proteoform profiles need to be monitored across time or between samples. For instance, time-of-flight (TOF) mass spectrometers are currently being used to analyze proteins in patient samples to detect markers for disease.22-27 For these types of analyses, high spectral quality is needed to ensure reproducible and reliable comparisons of the data. Several review articles describe this issue for the TOF instruments.28-30 While efforts have also been made to improve data quality and reproducibility for bottom-up proteomic data,31-38 more work is needed for optimizing and

4
determining the reproducibility of intact protein measurements by LC-MS or MS/MS on the Orbitrap class of instruments.
For proteins having molecular masses greater than a few thousand Daltons, optimization of the MS method is crucial to obtaining high quality spectra required for the identification of proteoforms, particularly those having low abundance. This can be a complex and time-consuming task and there is an absence of guidance in the literature for best practices to accomplish this. Therefore, this study undertook an examination of the instrument parameters which are available for optimization. These parameters were systematically analyzed and a generalized approach was developed for various proteins of various size, structure and potential modifications. Rather than using available commercial protein mixtures, the study selected several human proteins that are diagnostically relevant or of therapeutic interest. The proteins selected are C-reactive protein (CRP), vitamin D-binding protein (VDBP), transferrin, and immunoglobulin G (IgG), several of which have been the focus of intact MS analysis in previous work.14, 39-44 These proteins represent a range of characteristics including molecular weight, purity, and types/abundances of PTMs. Patterns of proteoform detection were monitored following changes in MS settings, including source temperatures, in-source CID voltage, resolution, automatic gain control (AGC) and number of microscans, to determine suitable, reliable LC-MS methods for intact proteoform identification. This study offers a systematic method for the evaluation and optimization of MS parameters and data analysis for intact protein analysis which are critical to the characterization and quantification of purified proteins for biopharmaceutical or reference material applications. Materials and Methods
Human proteins were from the following sources: CRP (NMIJ CRM6201-b, Wako USA, Richmond, VA), VDBP (Athens Research & Technology, Athens, GA), holo-transferrin (Sigma Aldrich, St. Louis, MO), and IgG (NISTmAb, candidate reference material 8670, National Institute of Standards and Technology, Gaithersburg, MD). Samples were prepared for intact mass analysis by adding solution with volume fractions of 89.98 % water, 10 % acetonitrile, and 0.02 % trifluoroacetic acid (TFA).
For intact mass analysis, measurements were performed on the Orbitrap Elite mass spectrometer (ThermoFisher Scientific, Waltham, MA) equipped with a heated ESI (HESI) source and an Ultimate 3000 RSLC system (ThermoFisher Scientific, Waltham, MA). The regular flow LC-MS gave improved data quality compared to nanoLC in preliminary testing and allowed for automated sample processing and so was selected for use in this study. Samples were desalted
and concentrated on either a 2.1 x 150 mm (Bio Wide Pore C8, 3 m, Sigma Aldrich, St. Louis, MO) or a 1.0 x 250 mm ID column (ProSwift RP-4H, Thermo Scientific, Sunnyvale, CA) with the
temperature set to 60 ⁰C. Samples were eluted at 200 L/min with a gradient of 10-50 % B over 20 minutes (or 10 minutes for the 1 mm ID column) where A is a volume fraction of 0.02 % TFA in water and B is a volume fraction of 0.02 % TFA in acetonitrile. The mass spectrometer tuning and calibration in the low mass range was performed with the Pierce™ LTQ Velos ESI Positive Ion Calibration Solution (ThermoFisher Scientific, Waltham, MA, catalog number 88323). External calibration in the high mass range was performed using 3.5 μg/μL poly(propylene glycol) (PPG2700) and 7 mmol/L sodium acetate (Sigma Aldrich, St. Louis, MO). Orbitrap parameters
5
that were used in the experiments include the following: sheath gas flow rate 40, auxiliary gas flow 10, source voltage 3.5 kV, and S-lens RF level 70 %. Parameters that were tested included the following variations in settings: HESI temperature (250, 300, 350, 400) ⁰C; capillary temperature (300, 350, 380) ⁰C; and in-source collision-induced dissociation (CID) (0, 20, 40, 60, 80) V. Resolution and microscan numbers were varied in the instrument method between settings of 15 000 to 240 000 (at m/z 400) and 1 to 20, respectively. The AGC setting for the Orbitrap MS scan was also set to values of 1x10⁵, 5x10⁵, 1x10⁶, and 5x10⁶ with a constant maximum Orbitrap ion injection time (500 ms). The pressure (p) in the higher-energy collisional dissociation (HCD) cell was also changed in some experiments by adjusting the N2 gas flow.
For comparison to an Orbitrap class instrument, LC-MS data was also collected on a quadrupole time-of-flight (Q-TOF, Agilent model 6550, Santa Clara, CA) with a Waters (Milford,
MA) Atlantis RP column (300 m x 100 mm, 5 m) without heating. A gradient from 5 % B to 90
% B over 16 minutes was used (with a flow rate of 7 L/min) where A was a volume fraction of 0.1% formic acid in water and B was a volume fraction of 0.1% formic acid in acetonitrile. The MS2 spectra were collected in the extended mass range (2 GHz) and the slicer was set to high resolution mode. Other Q-TOF parameter settings that were used include the following: gas temperature 290 °C, drying gas 14 L/min, nebulizer 35 psig, sheath gas temperature 350 °C (flow rate 11 L/min), capillary 3.5 kV and nozzle voltage 2 kV. Methods for the Q-TOF were optimized, but not tested to the same extent as those in the Orbitrap.
Theoretical masses of the proteins were calculated with the NIST Mass and Fragment Calculator,45 http://www.nist.gov/mml/bmd/bioanalytical/massfragcalc.cfm. Deconvolution of the Orbitrap mass spectra was performed with Protein Deconvolution version 2.0 (ThermoFisher Scientific, Waltham, MA). Proteoforms with > 95% confidence were identified using at least 7 ions of adjacent charge states with a tolerance less than 0.05 m/z. BioConfirm (Agilent) was used for deconvolution of the Q-TOF MS spectra. Signal-to-noise ratios (S/N) of the MS spectra were calculated by exporting the spectra from the raw file and calculating the ratio of the maximum to the median peak heights31, 46 using Microsoft Excel. Modifications corresponding to the low abundance proteoforms in VDBP and transferrin were confirmed using bottom-up methods and are described in the Supporting Information. Results and Discussion Optimizing Instrument Parameters
a) Mass Spectrum Averaging
Spectral quality was found to be sensitive to the number of MS scans averaged in the analysis.
In the Orbitrap, there are two ways to average scans during online LC-MS. The first is to average the MS scans as they are collected by the instrument (microscans). The second is to manually average the MS scans across the LC peak. For each of the proteins, both parameter conditions were tested and the spectral quality was assessed from the S/N calculated from the ratio of the maximum to median intensity in the spectrum. For the smallest protein, CRP, an increase in S/N was observed up to 5 microscans and resulted in reduced signal variability (Figures S-1 and S-2, respectively). Averaging MS scans across the LC peak at full width at half maximum (FWHM)
6
results in the highest S/N (~500) regardless of the number of microscans used. For the other proteins, similar results were observed, i.e. simply increasing the number of microscans did not result in the highest S/N. For example, using at least 5 microscans along with averaging across the LC peak (Figures S-1 and S-3) was found to improve the spectral quality for IgG (S/N ~60). The overall S/N is likely lower for IgG compared to CRP due to proteoforms at low abundance which are not discriminated against when calculating S/N as the ratio of the maximum to median intensity. Based on these results, 10 microscans with spectral averaging at FWHM of the LC peak was used for all proteins for the remainder of the study.
These results show that S/N may be compared between runs for the same protein and may be useful for verifying that the instrument is working optimally between days or between labs; however, it may present a challenge in setting one threshold value for different proteins to pass quality control measures where chromatographic separation of protein impurities and/or proteoforms is limited. In cases where proteoforms are not completely resolved, the S/N will represent the most abundant form present. The results also have implications for top-down LC-MS/MS experiments where using a greater number of microscans will slow scan speeds, resulting in fewer MS/MS being collected for each protein; however, if the S/N is not high enough, the proteoforms at low abundance may not be detected and selected for subsequent interrogation by the mass spectrometer. Additionally, manual spectral averaging of LC peaks is not possible in high-throughput, top-down MS/MS experiments. Therefore, LC-MS analysis with spectral averaging across the peak at FWHM may be preferred for experiments where high sensitivity is required.
b) Automatic Gain Control (AGC)
Another parameter investigated was the AGC which, by limiting the total number of ions
trapped, reduces space-charge effects on the ions and can lead to improved resolution and mass accuracy.47 The AGC, along with the maximum ion injection time, limit the total length of each MS scan; therefore, in these experiments, the ion injection time was held constant at 500 ms in order to ensure that only AGC values were influencing the results. AGC values of 1x10⁵, 5x10⁵, 1x10⁶, and 5x10⁶ were tested for the two largest proteins, transferrin and IgG, and changes in the intensity, proteoforms and mass accuracy were monitored. Increasing the AGC value generally had only slight effects on the mass accuracy, with median values of 22.2, 29.2, 27.0, and 26.3 ppm from the lowest to highest AGC setting (Fig. S-4). This is likely due to the inherit limits in accuracy for proteins of this size. However, at the lowest and highest settings, 1x10⁵ and 5x10⁶, there were three proteoforms with errors in the expected mass > 60 ppm (S3, G1F/G2F+2Hex–GlcNAc, G2F/G2F+2Hex).
Additionally, as AGC values were increased, there was an overall decrease in the abundances of the protein ions likely due to loss of coherence or increased chance of collision with residual N2 gas in the C-trap resulting in fragmentation and/or scattering.47-48 This resulted in the number of proteoforms detected at low abundance to vary with the AGC setting. One of the IgG proteoforms (G0F/G1F+2Lys) was only detected at the lowest two AGC settings tested likely due to the high signal intensity. Several other IgG proteoforms were only detected as the AGC was increased (G2F/G2F+2Hex, G0F, and G1F). While it is possible that the partially glycosylated IgG proteoforms may arise due to fragmentation of the glycans at the higher AGC settings, the slight
7
shift in the charge state envelope toward higher m/z values (lower charge states) that also occurred when changing the AGC may instead aid in detection of the additional proteoforms. Because there were minimal gains observed in changing the AGC setting, a value 1 x 10⁶ was used for the remainder of the experiments in order to detect the majority of the proteoforms with abundant signal.
c) Source Parameters
The quality of MS spectra was found to be sensitive to the settings of the electrospray source.
It is particularly important to optimize these parameters to achieve the S/N levels necessary for the detection of low abundance ions. For the MS instrument used in these studies, the protein eluting from the LC is desolvated primarily by the combined action of the nebulizing gas, HESI source temperature, and heated ion transfer capillary. Under a constant gas flow rate, temperatures for the capillary and HESI probe of the Orbitrap were used with values above and below those recommended by the manufacturer (350 ⁰C for the capillary and 250 ⁰C to 350 ⁰C
for the HESI source are recommended for a constant LC flow rate of 200 L/min). Another tested setting was the in-source CID voltage which may be used for the removal of non-covalently bound solvent or salt adducts. In these experiments, the in-source CID setting was tested at 20 V increments over a range of 0 V to 80 V. For each of the mass spectra collected in these experiments, the signal-to-noise ratio (S/N) was calculated from the spectra averaged at FWHM of the LC peak.
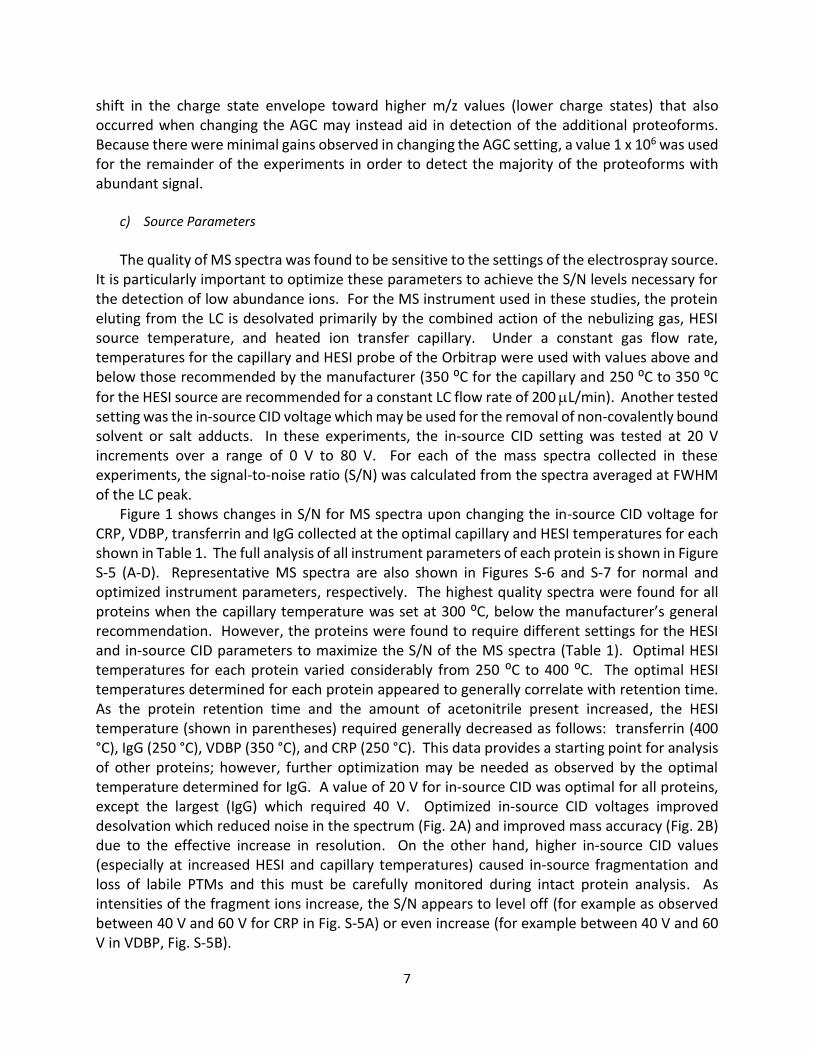
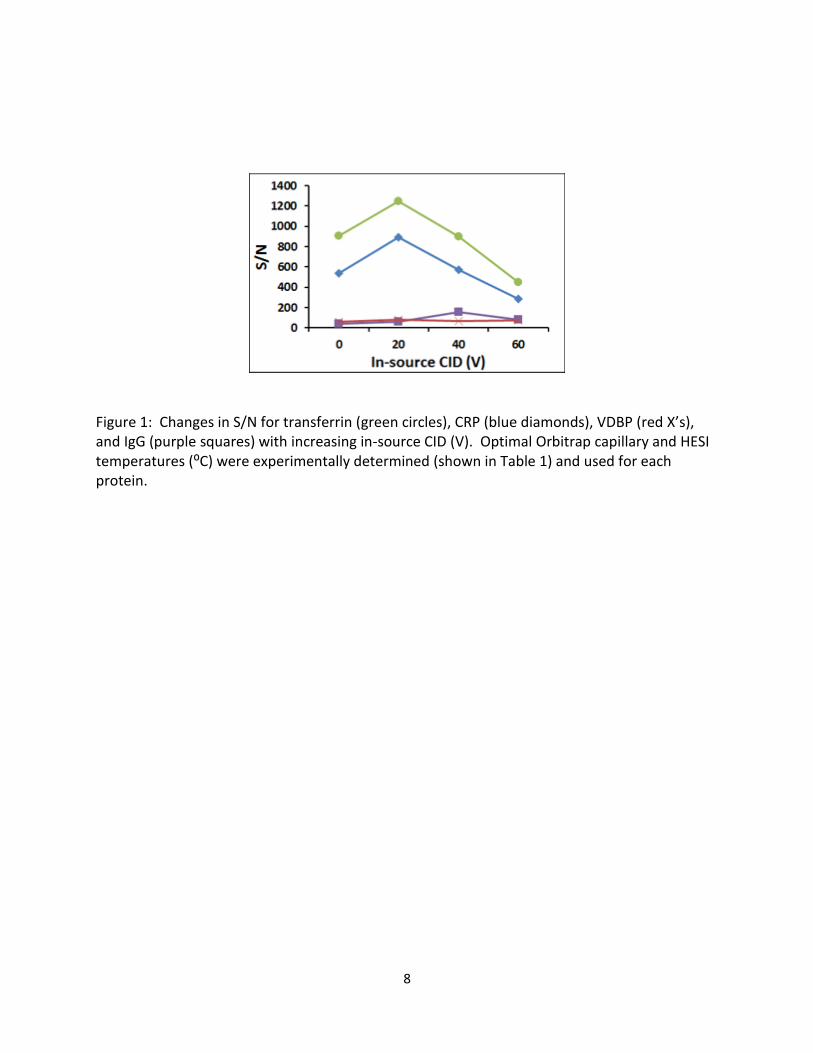
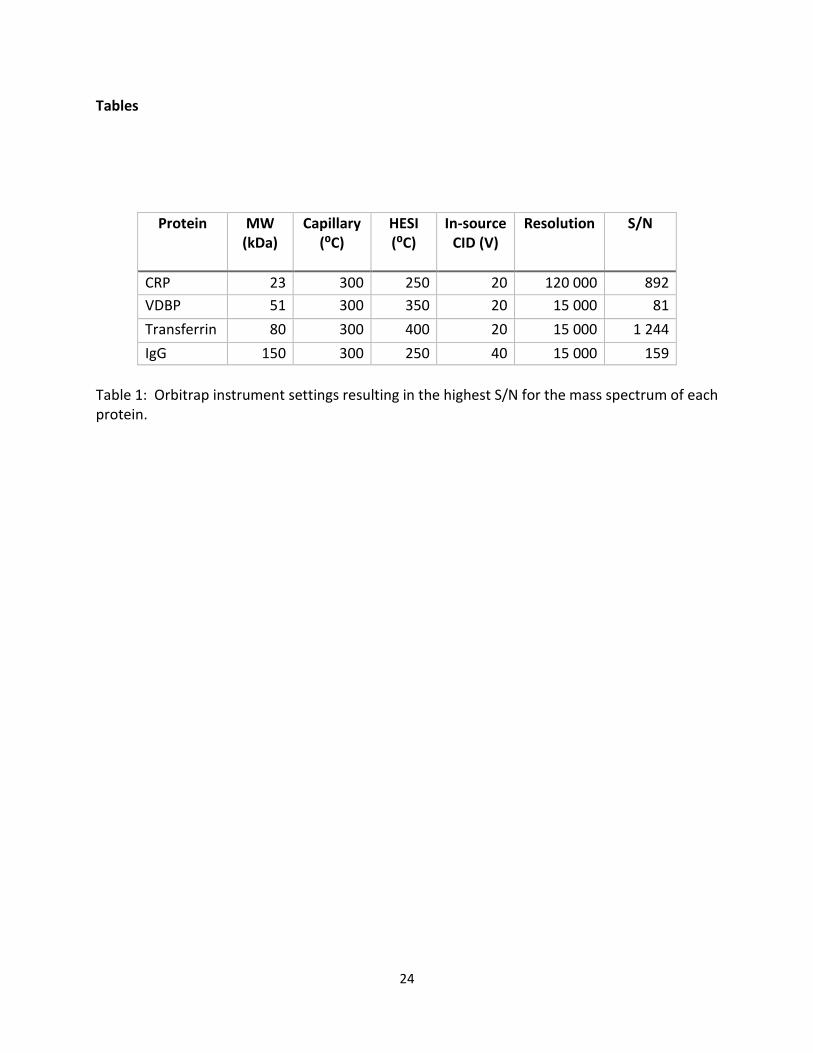
Figure 1 shows changes in S/N for MS spectra upon changing the in-source CID voltage for CRP, VDBP, transferrin and IgG collected at the optimal capillary and HESI temperatures for each shown in Table 1. The full analysis of all instrument parameters of each protein is shown in Figure S-5 (A-D). Representative MS spectra are also shown in Figures S-6 and S-7 for normal and optimized instrument parameters, respectively. The highest quality spectra were found for all proteins when the capillary temperature was set at 300 ⁰C, below the manufacturer’s general recommendation. However, the proteins were found to require different settings for the HESI and in-source CID parameters to maximize the S/N of the MS spectra (Table 1). Optimal HESI temperatures for each protein varied considerably from 250 ⁰C to 400 ⁰C. The optimal HESI temperatures determined for each protein appeared to generally correlate with retention time. As the protein retention time and the amount of acetonitrile present increased, the HESI temperature (shown in parentheses) required generally decreased as follows: transferrin (400 °C), IgG (250 °C), VDBP (350 °C), and CRP (250 °C). This data provides a starting point for analysis of other proteins; however, further optimization may be needed as observed by the optimal temperature determined for IgG. A value of 20 V for in-source CID was optimal for all proteins, except the largest (IgG) which required 40 V. Optimized in-source CID voltages improved desolvation which reduced noise in the spectrum (Fig. 2A) and improved mass accuracy (Fig. 2B) due to the effective increase in resolution. On the other hand, higher in-source CID values (especially at increased HESI and capillary temperatures) caused in-source fragmentation and loss of labile PTMs and this must be carefully monitored during intact protein analysis. As intensities of the fragment ions increase, the S/N appears to level off (for example as observed between 40 V and 60 V for CRP in Fig. S-5A) or even increase (for example between 40 V and 60 V in VDBP, Fig. S-5B).
8
Figure 1: Changes in S/N for transferrin (green circles), CRP (blue diamonds), VDBP (red X’s), and IgG (purple squares) with increasing in-source CID (V). Optimal Orbitrap capillary and HESI temperatures (⁰C) were experimentally determined (shown in Table 1) and used for each protein.
9
Figure 2A: Orbitrap mass spectra showing the most abundant peaks for IgG proteoforms with in-source CID voltage set at the following voltages from top to bottom: 0, 40, 60, or 80 V. The spectrum shown at the top has a different m/z range due to a shift of the most abundant peaks. Changes in resolution, measured at FWHM of the largest peak, were 6412, 6257, 5963, and 5137 (top to bottom).
10
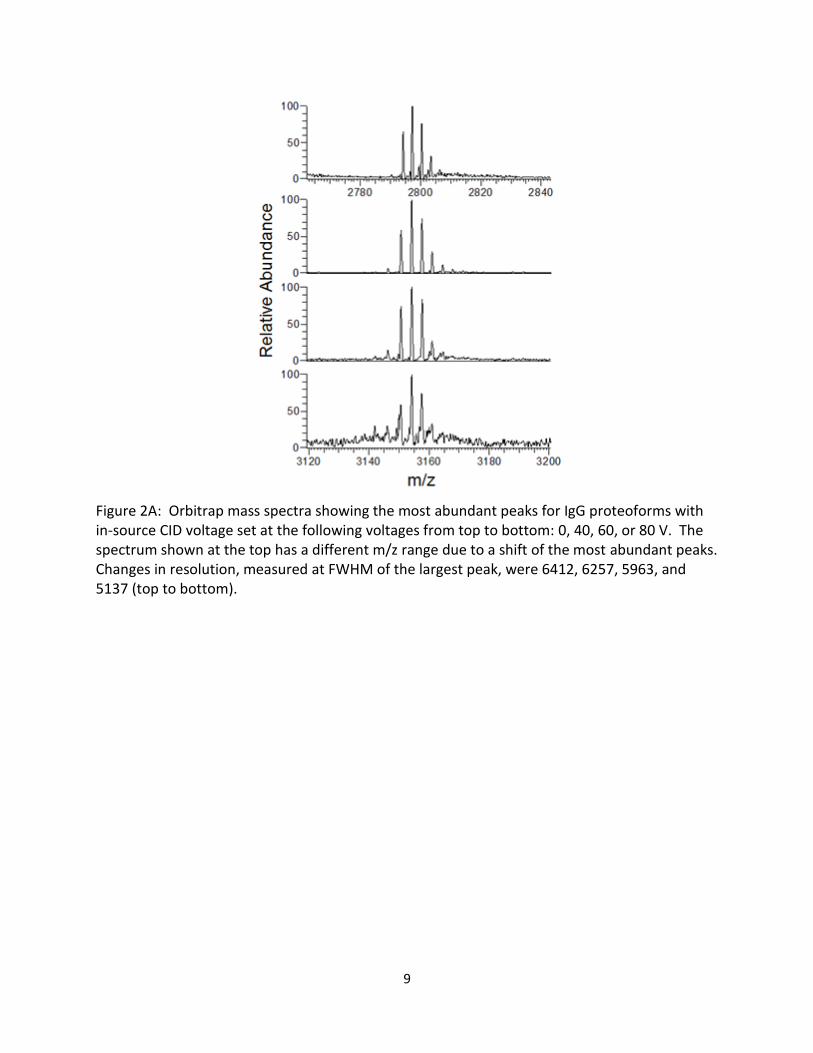
Figure 2B: Changes in mass accuracy for IgG proteoforms are shown for increasing in-source CID voltages. As voltage is increased, the signal decreases due to in-source fragmentation of the proteoforms; therefore, G2F/G2F was not observed at 80 V and the mass accuracy could not be determined.
Interestingly, the two largest proteins studied have several local maxima in S/N for different
instrument parameter settings (Fig. S-5C and S-5D). This may be attributed to the presence of several charge state envelopes in the spectrum for each protein. Transferrin has two charge state envelopes centered near m/z 2000 and m/z 2600 and at the recommended capillary temperature (350 ⁰C), they are approximately at the same intensity (Fig. S-6C). Upon varying the capillary temperature, HESI temperature and in-source CID voltage, one envelope becomes dominant and is reflected in increased S/N for various parameter settings (Fig. S-7C). Similar to transferrin, the optimal instrument parameter settings result in a shift in the IgG charge states to one dominant envelope (Fig. S-6D and S-7D). These shifts in charge states for transferrin and IgG are significant upon changing parameters at the front-end of the instrument and are due to changes in protein conformation which has been previously reported for MS analysis of proteins with variations in temperature, solvents, or pH.49-55
d) Resolution
For each of the four proteins, another set of experiments was performed where the
resolution was varied from 15 000 to 240 000 at m/z 400. For CRP, no isotopic resolution of the peaks was found for 15 000 or 30 000. Partial resolution is observed at an instrument setting of 60 000 while baseline separation of the peaks is observed at the two highest resolution settings (120 000 to 240 000). These settings are in agreement with expected values required for a protein of this size.56 The optimal S/N was found for a setting of 120 000 (Table 1) rather an 240 000 likely due to the decrease in signal with increasing resolution. For the other proteins, VDBP, transferrin and IgG, separation of the isotopic peaks is not possible due to their large molecular weights. Therefore, resolution of the peaks containing post-translational modifications (PTMs) was investigated. Using the lowest resolution settings (15 000) works well and was found to give the highest S/N for all three largest proteins. As anticipated, increasing the resolution setting led
11
to decreases in S/N,47-48 though, it was found that higher resolutions can be used to give acceptable results. No improvements were noted in the VDBP spectra by increasing the resolution, but using a resolution of 30 000 for transferrin and IgG was possible despite the decreased S/N. As the resolution is increased to 60 000, only IgG was found to give MS spectra that could be deconvoluted by the software. The changes in IgG proteoforms observed are described in Identification of Proteoforms below. Considerations for Data Interpretation
The identification of existing proteoforms in a purified protein sample is accomplished by
comparing a deconvoluted spectra against a list of known/predicted proteoform masses. The success of the identification is affected by several factors including the mass accuracy and resolution of the mass spectrometer, deconvolution of the spectra and the presence of unexpected proteoforms in the sample. In bottom-up proteomics, the calculation of theoretical values for masses of peptides and their fragments is made by summing monoisotopic elemental masses. Many programs are available for this calculation and produce equivalent results.45, 57-62 However, for intact proteins, it was observed that the values for the theoretical average molecular weight were not consistent among all tested molecular mass software.16 The principal reasons for this are likely due to different values of elemental average masses which may exist and the presence of rounding errors in the calculation. The average mass value is dependent upon the isotopic abundances of the elements within the protein which have been shown to be influenced by biological activity. Thus, isotopic distribution differences may exist between organic and inorganic elemental sources45, 63-64 producing small differences in average mass values. While this difference is insignificant for a single amino acid, accumulation over several hundred residues becomes discernable on high mass accuracy instruments. An existing program45 (see Materials and Methods) was updated to include average elemental masses derived using isotopic abundances from organic sources to generate the theoretical values for each of the proteoforms (Table S-1). Using the weighted average atomic masses of the organic elements for the four proteins analyzed in this study resulted in a 5 ppm mass shift of the theoretical masses for all proteoforms. Comparison of the proteoform masses for all four proteins from the deconvoluted Orbitrap spectra to the theoretical calculations using organic or inorganic masses gave median errors of 7.7 and 12.7 ppm, respectively, showing an improved agreement between the theoretical and experimental values and an increase in confidence of the assignments.
Because deconvolution of each proteoform mass includes the contribution of several different charge states across the m/z range, there is an error associated with the derived values and intensities. For the Protein Deconvolution software, variations between the different charge state values used in the calculations were typically found to have less than 50 ppm standard deviation for the data collected in these experiments and tend to be greater for proteoforms at low abundance possibly due to noise or overlap of ions at similar m/z which may be due to incomplete desolvation or residual salt adducts. For example, the masses of the 5 major proteoforms and all other minor forms in the IgG sample have median standard deviations of 10.4 ppm and 35.7 ppm, respectively.
12
The mass accuracy may also be affected by the presence of proteoforms with similar molecular weights. For example, the transferrin data was initially a concern since the experimental value was lower by 161 ppm and 136 ppm for the Orbitrap and Q-TOF data, respectively, compared to the amino acid sequence provided by UniProtKB. Upon further investigation, bottom-up analysis revealed that the amino acid variation I448V was present in the greatest abundance (Table S-2). Four other amino acid variations (TF*C1, TF*C2, TF*C3, and Q->E) and were also identified in the pooled transferrin sample. The peptide spectral counts of the tryptic peptide containing V at position 448 was identified about six times more often than the peptide found in the other isoforms containing I. Because the mass spectrometers used in this study were unable to fully resolve these sequence variants (+14, +4 +44 Da mass differences for C1, C2, and C3, respectively, compared to I448V), only the most abundant form is observed in the deconvoluted spectrum for the intact protein. When comparing the experimental data to the most abundant sequence variant, the Orbitrap and Q-TOF mass values have respective errors of 15 ppm and 40 ppm (Table S-1). Therefore, the mass of the experimental data is likely a weighted average of these values and while the mass error is relatively low for this source of transferrin, these results should be kept in mind while analyzing other proteins from pooled sources. Identification of Proteoforms
Protein MS spectra were processed with Protein Deconvolution (or BioConfirm for Q-TOF
data) and proteoforms were identified. Proteoform masses were generally within 30 ppm of the theoretical values (a full list of the major and minor proteoforms identified with both instruments are listed in Table S-1). Data collected on the Q-TOF were used to verify presence of the proteoforms and the reproducibility of their measurement. However, some proteoforms could not be identified in the Q-TOF spectra (Table S-1) possibly due to lower resolution, instrument parameters not being completely optimized or differences in the deconvolution software. Measurements were relatively straightforward for CRP measured on the Orbitrap. The deconvoluted mass was 23 027.878 Da which is within 2 ppm of the theoretical mass calculated from the organic source corrected average masses for the elements and includes the expected disulfide bond and an N-terminal pyro-glutamic acid (see Table S-3 for a summary of the protein sources, PTMs and amino acid sequence variations). The mass from the Q-TOF agrees with the Orbitrap value giving an error of 15 ppm. Changes in the Orbitrap parameters do not appear to significantly affect the MS or deconvoluted spectra of CRP until the highest temperatures or voltages are used leading to in-source fragmentation.
The VDBP used in this study was isolated from pooled human plasma and therefore is much more complex than the CRP sample. Additionally, 25 other proteins were identified by bottom-up analysis (Table S-3). Deconvolution of the VDBP MS spectra confirms the presence of the 3 common sequence variants (GC-1F, GC-1S, and GC-2)65 along with the previously reported major O-linked trisaccharide (HexNAc-Hex-NeuAc, +656) for GC-1F and GC-1S39 (Fig. S-8). Also at lower abundance, peaks that match the most abundant form, GC-1F, plus an additional hexose (Hex, +162), N-acetylhexoseamine (HexNAc, +203) or both (+365) were identified. Although the addition of HexNAc to VDBP is known to occur, it has not been previously reported during intact LC-MS analysis. These proteoforms at low abundance are not found if MS parameters are not

13
optimized. Data from the Q-TOF is in agreement with the Orbitrap (Table S-1); however, due to the lower resolution there is only a shoulder peak for the lowest abundant variant, GC-2 with an expected mass of 51 215.0 Da (Fig. S-8). The similarity of the Q-TOF and Orbitrap spectra show the changes in glycosylation detected are likely not due to fragmentation of the labile glycan. Additionally, these PTMs were confirmed by bottom-up analysis (Table S-4). Data collected from different lots of protein shows that changes in protein abundance can be detected semi-quantitatively (Fig. S-9) due to the abundance being determined as the sum of the individual ions detected. Similar to the CRP data, changes in instrument settings near the ones giving the greatest S/N result in few changes in the identification of the major proteoforms until in-source fragmentation and losses of labile glycan groups occur.
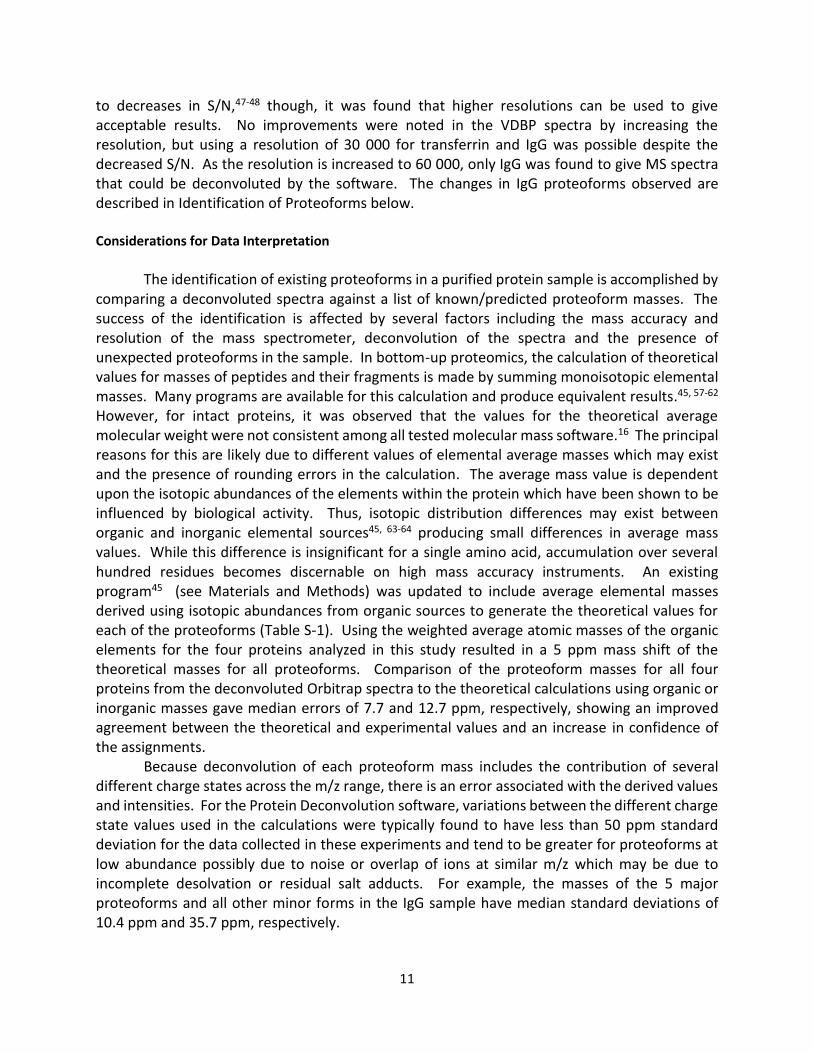
The transferrin used in this study was also from pooled human plasma and was found to vary in amino acid sequence (discussed above and shown in Table S-2). It was confirmed during LC-MS analysis to contain 19 disulfide bonds along with 2 or 3 sites of complex N-linked glycosylation. The most abundant form of glycosylated transferrin identified is the tetrasialo form of the biantennary N-glycan (S4), shown in Figure 3, as was found in other studies of the normal population.43 For optimized instrument parameters, minor forms of the protein due to differences in glycosylation were detected (S3, S5) along with additional Hex (+162), HexNAc (+203), and deoxyhexose (fucose, +146) residues which have been reported during bottom-up analysis of glycopeptides66 and released glycans67 from transferrin, but the relative amounts of these modifications have not been previously reported during intact MS analysis of the protein due to either lack of resolution or interpretation of the data. Q-TOF data allow detection of the same proteoforms (Table S-1) indicating that results are reproducible and is not likely due to degradation of the glycan. Bottom-up analyses also confirm the presence of the PTMs that can combine to create the proteoforms observed (see extracted ion chromatograms in the Supporting Information). Changes in instrument parameters at or near the two local maxima in S/N (marked as points a and c in Fig. S-5C) resulted in changes in the minor proteoforms identified (Fig. 3). As the capillary temperature was increased to 380 ⁰C or the in-source CID voltage was not applied for the optimal capillary and HESI temperatures, one of the glycoforms (S2, having only one of the sites of glycosylation occupied) was no longer identified in the deconvoluted spectra (Fig. 3). Source conditions in these cases did not appear to cause loss of the S2 glycoforms from the protein since the relative abundance of S2 did not increase and new peaks did not appear in the deconvoluted spectrum due to fragmentation of the glycoforms due to higher temperatures. The optimized LC-MS analysis of intact transferrin is relatively sensitive for detection of proteoforms at low abundance since the S2 proteoform has been previously been found to be present at about 1 % of the total serum transferrin in the normal population.68
14
Figure 3: Deconvoluted spectra of transferrin collected with different Orbitrap parameters. Spectra are ordered starting with the highest S/N at the top and correspond from top to bottom with data in Figure S-4C. Proteoforms with different glycan structures (S2, S3, S4, and S5) along with the addition other sugars (fucose, +146; hexose, +162; HexNAc, +203) or TFA adducts are shown. Source settings for each spectrum are shown as capillary (⁰C)/HESI (⁰C)/ in-source CID (V).
Even though the IgG sample analyzed was not from a pooled source, it was a complex sample due to the large number of PTMs present. It is comprised of two heavy and two light chains with a total of 16 disulfide bonds, 2 N-terminal pyroglutamates, loss of the C-terminal K from both heavy chains and glycans (G0F, G1F, or G2F) attached to an asparagine (N) residue in the constant region of each heavy chain.16 It should also be noted that in these studies, it is not possible to determine the exact glycan structure and there may be more than one glycan form present for each mass. Similar to the transferrin data, the IgG sample had three regions of locally maximized S/N for different instrument temperatures and voltages (Fig. S-5D). In comparing the deconvoluted spectra for these three regions, it was found that using a capillary temperature of 350 ⁰C or 380 ⁰C caused the loss of several proteoforms at low abundance (G0F, G1F, G0F/G0F-2HexNAc, G2F/G2F+3Hex shown in Fig. S-10). Under optimized instrument parameters (300 ⁰C
15
capillary temperature, 250 ⁰C HESI temperature, and 40 V in-source CID), several differences were observed during LC-MS analysis of the intact protein compared to previous data.16 The differences in this work include the addition of 3 hexose residues identified on the intact protein. The proteoforms with only one N glycosylation site occupied (G0F and G1F) were also not previously detected by an Orbitrap class instrument. Additionally, proteoforms with a loss of HexNAc were identified based on accurate mass assignment; however, these proteoforms are difficult to distinguish from proteoforms containing the addition of one C-terminal lysine and both are expected to be present. The Q-TOF was unable to detect or resolve eight of the IgG proteoforms at low abundance (Table S-1), but did confirm the presence of G1F/G1F-HexNAc and G0F/G1F+K observed in the Orbitrap data. All proteoforms shown in Fig. S-10 are consistent with those previously identified in bottom-up measurements of the glycopeptides16, 69-70 and released glycans71 and analysis of the intact protein show the relationship between these modifications.
Another interesting observation was made for deglycosylated IgG measured at different gas pressures in the HCD cell. For the typical pressure used during intact protein analysis, the addition of one or two hexoses on the protein were identified along with the addition of C-terminal lysine which is similar to previous results.16 When the pressure was reduced so that Δp= -1.3x10⁻⁹ Pa (-1.0x10¹¹ Torr), up to 3 additional Hex residues (5 total) could be identified (Fig.
S-11). The additional hexose residues are likely due to additions of terminal -galactose to the glycan69-71 and non-enzymatic glycation of the protein at lysine residues which has been previously shown.16, 70 No differences were observed in fully glycosylated IgG upon using a lower pressure for analysis. With the exception of IgG, no significant differences could be detected in the proteoforms for the other proteins at lowered HCD cell pressures. However, for VDBP, an increase in S/N occurred at lower pressures due to decreased intensities of the unassigned peaks present which may be related to protein impurities.
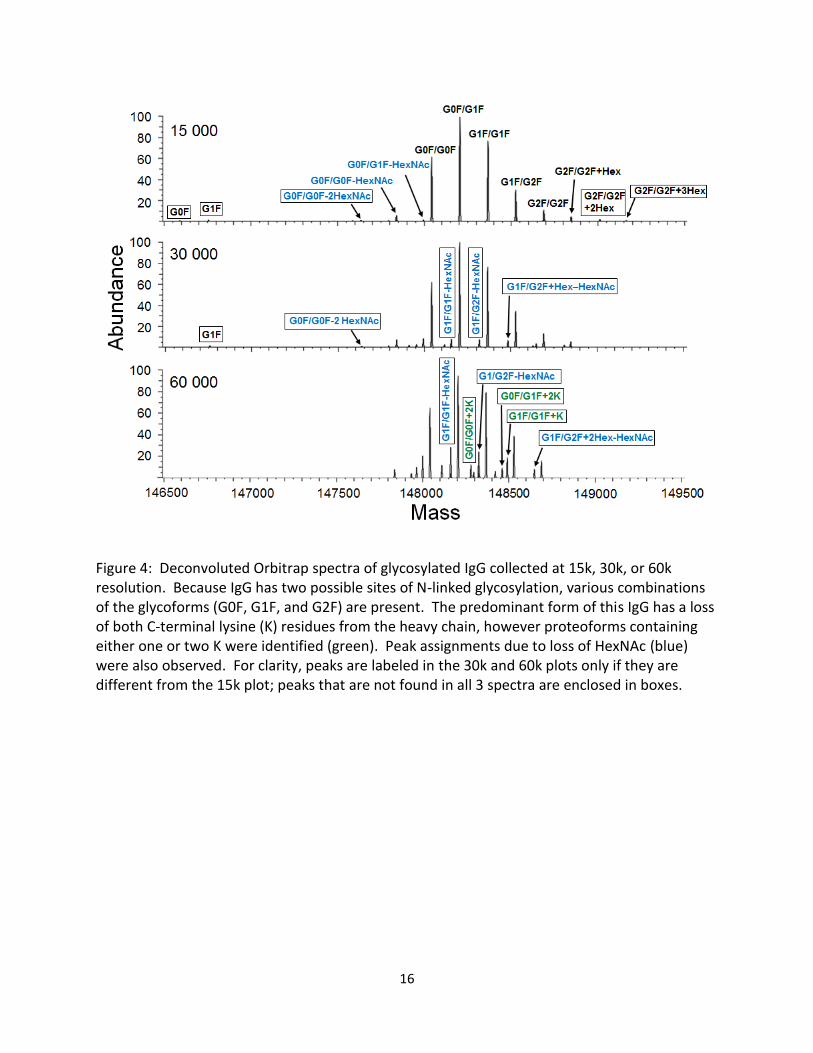
Deconvolution of the IgG spectra for different resolutions (Fig. 4) was also found to result in changes in the proteoform assignments based on mass accuracy. The lowest resolution, 15 000, allowed identification of the 5 major forms (mixtures of G0F, G1F, and G2F glycans) along with only one N glycosylation site occupied (G0F or G1F), one or two losses of HexNAc from G0F/G0F, and G2F/G2F with the addition of up to three hexose residues. Increasing the resolution to 30 000 allowed similar proteoforms to be identified and additional PTMs were found at lower abundance (additional losses of HexNAc from the glycan structures). At the highest resolution, 60 000, proteoforms at the lower and higher mass range were no longer found, but additional identifications were made (unprocessed forms containing the C-terminal K residue on one or both heavy chains). As resolution is increased, the proteoform intensity decreases as it is inversely proportional to the square root of m/z.47-48 However, changing values for the instrument parameters does not necessarily result in quantitative changes in proteoform intensity due to new or different charge states included in the deconvolution. Therefore, relative intensities between different resolutions of the proteoforms in Fig. 4 should be interpreted with caution. Additionally, analysis of IgG at different resolutions shows that some of the low abundance proteoforms may not be reproducibly identified; therefore, it may be useful to test this parameter when analyzing other large proteins.
16
Figure 4: Deconvoluted Orbitrap spectra of glycosylated IgG collected at 15k, 30k, or 60k resolution. Because IgG has two possible sites of N-linked glycosylation, various combinations of the glycoforms (G0F, G1F, and G2F) are present. The predominant form of this IgG has a loss of both C-terminal lysine (K) residues from the heavy chain, however proteoforms containing either one or two K were identified (green). Peak assignments due to loss of HexNAc (blue) were also observed. For clarity, peaks are labeled in the 30k and 60k plots only if they are different from the 15k plot; peaks that are not found in all 3 spectra are enclosed in boxes.
17
Conclusions
The reproducibility of bottom-up proteomics has been under investigation in recent work31-32, 34 and implementing standard operating procedures has been shown to reduce variability between labs.33 However, few studies have examined the reproducibility of intact protein identifications from LC-MS or MS/MS experiments and limited work has been published describing optimized MS methods for detection of proteoforms, especially those with labile post-translational modifications present at low abundance. In this study, intact proteins of different sizes and containing different types and degrees of PTMs were used to investigate the influence of instrument parameters on the quality of collected MS spectra and the effect on identified proteoforms. As shown, these settings are crucial for meaningful data to be collected and interpreted to increase our understanding of intact proteins. Investigations of intact proteins, more so than for peptides, have many difficulties to overcome, such as achieving good chromatographic separation, resolution of multiple potential proteoforms and selecting source settings for sufficient desolvation. Along with these factors are sources of error which may be involved in calculating intact protein theoretical masses and deconvolution of the data. Therefore, any improvement to the analysis achieved by optimization is crucial to the success of the experiment.
This study demonstrates the effectiveness of monitoring the quality of the MS spectra by the S/N averaged at FWHM of the LC peak. This attribute was useful to ascertain the effect of changes in the instrument settings in seeking optimum values. A key finding was that use of a lower capillary temperature than recommended by the manufacturer (300 ⁰C instead of 350 ⁰C) improved S/N for all proteins in this study which aided proteoform stability and retention of labile PTMs. Additionally, the optimal HESI temperatures determined for each protein appeared to generally correlate with retention time due to the amount of acetonitrile present during elution from the column. Similar to the principle of native MS,72 optimal instrument parameters under the “denaturing” conditions used in this study were found to result in the coalescence of the protein signal into fewer charge states due to changes in protein conformation which increased the detection of proteoforms at low concentrations. As the data show, the capillary and HESI temperatures and in-source CID voltage are significant factors in the desolvation and adduct removal processes of the electrospray ionization source. A range of temperatures/voltages was demonstrated to allow for identification of the major expected proteoforms for these proteins. However, less-than-optimum settings resulted in incomplete desolvation of the intact proteins or low instrument sensitivity, resulting in decreased S/N values for the MS spectra and a loss of identifications at low abundance.
Our results show that optimum instrument settings are different for each protein investigated. The value of optimizing these parameters is shown by the first identifications of several proteoforms of intact VDBP, transferrin and IgG (NISTmAb) reported in this study. This highlights the difficulty in detection of different proteoforms within a mixture during a high-throughput top-down experiment, especially for those at low abundance. Therefore, optimized LC-MS analysis of purified (or at least well-resolved during chromatography) proteins may be preferred for a more complete analysis of the low abundance PTMs present. For a detailed analysis of complex mixtures of proteoforms by LC-MS, it would be beneficial for automatic selection of the optimized instrument parameters for each protein as it elutes. However, the
18
software that is available does not yet have this capability. While it may not be possible to change source temperatures on a chromatographic time-scale, other parameters such as voltage, the number of microscans or resolution may be changed during the LC gradient based on retention time. Alternatively, replicate analyses of samples may also be performed using different instrument parameters to improve detection of proteoforms by MS and MS/MS.
The proteoforms identified in this study are important for each of these proteins as they are all topics of current investigations in healthcare, diagnostic or therapeutic areas. These finding show the value in selecting appropriate source parameters for analysis of a given intact protein and provides a rational approach of optimizing the most important factors. Optimized parameters determined in this work also offer a starting point for the reproducible analysis of other proteins and a method for benchmarking MS performance during intact protein analysis. Additionally, these methods build a foundation for future work in quantification of intact proteins by LC-MS. Disclaimer This is an official contribution of the National Institute of Standards and Technology. Not subject to copyright in the United States. Certain commercial equipment, instruments, software or materials are identified in this document. Such identification does not imply recommendation or endorsement by the National Institute of Standards and Technology, nor does it imply that the products identified are necessarily the best available for the purpose. Supporting Information The Supporting Information is available free of charge at the ACS Publications website at http://pubs.acs.org: Kilpatrick LE Supporting Information.pdf.
Changes in S/N for single/averaged MS scans (Fig. S-1); MS spectra for CRP (Fig. S-2) and IgG (Fig. S-3) for single/averaged scans; mass errors for proteoform IDs at different AGC settings (Fig. S-4); S/N values at different instrument parameters for CRP (Fig. S-5A), VDBP (Fig. S-5B), transferrin (Fig. S-5C), and IgG (Fig. S-5D); MS spectra for proteins at instrument parameters recommended by manufacturer (Fig. S-6) and optimized parameters (Fig. S-7); VDBP deconvoluted spectra from Orbitrap and Q-TOF (Fig. S-8); VDBP deconvoluted spectra for two different lots (Fig. S-9); IgG deconvoluted spectra from different instrument parameters (Fig. S-10); deglycosylated IgG deconvoluted spectra at different HCD cell pressures (Fig. S-11); masses of proteoforms identified (Table S-1); methods for bottom-up analyses; transferrin peptides identified with differing amino acids (Table S-2); summary of protein sources, PTMs found and purity (Table S-3); modified peptides identified for VDBP (Table S-4); MS/MS for modified transferrin and VDBP peptides; extracted ion chromatograms for glycosylated transferrin peptides.
19
References (1) Nagaraj, N.; Kulak, N. A.; Cox, J.; Neuhauser, N.; Mayr, K.; Hoerning, O.; Vorm, O.; Mann, M. System-wide perturbation analysis with nearly complete coverage of the yeast proteome by single-shot ultra HPLC runs on a bench top Orbitrap. Mol. Cell. Proteomics 2012, 11 (3), M111.013722. (2) Thakur, S. S.; Geiger, T.; Chatterjee, B.; Bandilla, P.; Frohlich, F.; Cox, J.; Mann, M. Deep and highly sensitive proteome coverage by LC-MS/MS without prefractionation. Mol. Cell. Proteomics 2011, 10 (8), M110.003699. (3) Smith, L. M.; Kelleher, N. L.; Consortium for Top Down, P. Proteoform: a single term describing protein complexity. Nat. Methods 2013, 10 (3), 186-187. (4) Karve, T. M.; Cheema, A. K. Small Changes Huge Impact: The Role of Protein Posttranslational Modifications in Cellular Homeostasis and Disease. Journal of Amino Acids 2011, 2011, 207691. (5) Beltrao, P.; Bork, P.; Krogan, N. J.; van Noort, V. Evolution and functional cross‐talk of protein post‐translational modifications. Molecular Systems Biology 2013, 9, 714. (6) Knorre, D. G.; Kudryashova, N. V.; Godovikova, T. S. Chemical and Functional Aspects of Posttranslational Modification of Proteins. Acta Naturae 2009, 1 (3), 29-51. (7) Jenkins, N. Modifications of therapeutic proteins: challenges and prospects. Cytotechnology 2007, 53 (1-3), 121-125. (8) Walsh, G.; Jefferis, R. Post-translational modifications in the context of therapeutic proteins. Nat Biotech 2006, 24 (10), 1241-1252. (9) Parks, B. A.; Jiang, L.; Thomas, P. M.; Wenger, C. D.; Roth, M. J.; Boyne, M. T., 2nd; Burke, P. V.; Kwast, K. E.; Kelleher, N. L. Top-down proteomics on a chromatographic time scale using linear ion trap fourier transform hybrid mass spectrometers. Anal. Chem. 2007, 79 (21), 7984-7991. (10) Patrie, S. M.; Ferguson, J. T.; Robinson, D. E.; Whipple, D.; Rother, M.; Metcalf, W. W.; Kelleher, N. L. Top down mass spectrometry of < 60-kDa proteins from Methanosarcina acetivorans using quadrupole FRMS with automated octopole collisionally activated dissociation. Mol. Cell. Proteomics 2006, 5 (1), 14-25. (11) Fornelli, L.; Parra, J.; Hartmer, R.; Stoermer, C.; Lubeck, M.; Tsybin, Y. O. Top-down analysis of 30-80 kDa proteins by electron transfer dissociation time-of-flight mass spectrometry. Anal. Bioanal. Chem. 2013, 405 (26), 8505-8514. (12) Zhang, H.; Ge, Y. Comprehensive Analysis of Protein Modifications by Top-down Mass Spectrometry. Circulation. Cardiovascular Genetics 2011, 4 (6), 711-711. (13) Woods, R. J.; Xie, M. H.; Von Kreudenstein, T. S.; Ng, G. Y.; Dixit, S. B. LC-MS characterization and purity assessment of a prototype bispecific antibody. mAbs 2013, 5 (5), 711-722. (14) Bondarenko, P. V.; Second, T. P.; Zabrouskov, V.; Makarov, A. A.; Zhang, Z. Mass measurement and top-down HPLC/MS analysis of intact monoclonal antibodies on a hybrid linear quadrupole ion trap-Orbitrap mass spectrometer. J. Am. Soc. Mass Spectrom. 2009, 20 (8), 1415-1424. (15) Johnson, K. A.; Paisley-Flango, K.; Tangarone, B. S.; Porter, T. J.; Rouse, J. C. Cation exchange-HPLC and mass spectrometry reveal C-terminal amidation of an IgG1 heavy chain. Anal. Biochem. 2007, 360 (1), 75-83. (16) Formolo, T.; Ly, M.; Levy, M.; Kilpatrick, L.; Lute, S.; Phinney, K.; Marzilli, L.; Brorson, K.; Boyne, M.; Davis, D.; Schiel, J. Determination of the NISTmAb Primary Structure. In State-of-the-Art and Emerging Technologies for Therapeutic Monoclonal Antibody Characterization Volume 2. Biopharmaceutical Characterization: The NISTmAb Case Study; Scheil, J. E.; Davis, D. L.; Borisov, O. V., Eds; American Chemical Society: Washington, D.C., 2015; Vol. 1201, pp 1-62. (17) Sanglier, S.; Leize, E.; Van Dorsselaer, A.; Zal, F. Comparative ESI-MS study of approximately 2.2 MDa native hemocyanins from deep-sea and shore crabs: from protein oligomeric state to biotope. J. Am. Soc. Mass. Spectrom. 2003, 14 (5), 419-429.

20
(18) Keifer, D. Z.; Pierson, E. E.; Hogan, J. A.; Bedwell, G. J.; Prevelige, P. E.; Jarrold, M. F. Charge detection mass spectrometry of bacteriophage P22 procapsid distributions above 20 MDa. Rapid. Commun. Mass Spectrom. 2014, 28 (5), 483-488. (19) Bereszczak, J. Z.; Havlik, M.; Weiss, V. U.; Marchetti-Deschmann, M.; van Duijn, E.; Watts, N. R.; Wingfield, P. T.; Allmaier, G.; Steven, A. C.; Heck, A. J. Sizing up large protein complexes by electrospray ionisation-based electrophoretic mobility and native mass spectrometry: morphology selective binding of Fabs to hepatitis B virus capsids. Anal. Bioanal. Chem. 2014, 406 (5), 1437-1446. (20) van de Waterbeemd, M.; Fort, K. L.; Boll, D.; Reinhardt-Szyba, M.; Routh, A.; Makarov, A.; Heck, A. J. R. High-fidelity mass analysis unveils heterogeneity in intact ribosomal particles. Nat Meth 2017, 14 (3), 283-286. (21) Dang, X.; Scotcher, J.; Wu, S.; Chu, R. K.; Tolic, N.; Ntai, I.; Thomas, P. M.; Fellers, R. T.; Early, B. P.; Zheng, Y.; Durbin, K. R.; Leduc, R. D.; Wolff, J. J.; Thompson, C. J.; Pan, J.; Han, J.; Shaw, J. B.; Salisbury, J. P.; Easterling, M.; Borchers, C. H.; Brodbelt, J. S.; Agar, J. N.; Pasa-Tolic, L.; Kelleher, N. L.; Young, N. L. The first pilot project of the consortium for top-down proteomics: a status report. Proteomics 2014, 14 (10), 1130-1140. (22) Kiehntopf, M.; Siegmund, R.; Deufel, T. Use of SELDI-TOF mass spectrometry for identification of new biomarkers: potential and limitations. Clinical chemistry and laboratory medicine 2007, 45 (11), 1435-1449. (23) Herring, K. D.; Oppenheimer, S. R.; Caprioli, R. M. Direct tissue analysis by matrix-assisted laser desorption ionization mass spectrometry: application to kidney biology. Seminars in nephrology 2007, 27 (6), 597-608. (24) Eigner, U.; Holfelder, M.; Oberdorfer, K.; Betz-Wild, U.; Bertsch, D.; Fahr, A. M. Performance of a matrix-assisted laser desorption ionization-time-of-flight mass spectrometry system for the identification of bacterial isolates in the clinical routine laboratory. Clinical laboratory 2009, 55 (7-8), 289-296. (25) Fan, W. T.; Qin, T. T.; Bi, R. R.; Kang, H. Q.; Ma, P.; Gu, B. Performance of the matrix-assisted laser desorption ionization time-of-flight mass spectrometry system for rapid identification of streptococci: a review. European journal of clinical microbiology & infectious diseases : official publication of the European Society of Clinical Microbiology 2017, 36 (6), 1005-1012. (26) Hu, Y.; Zhang, S.; Yu, J.; Liu, J.; Zheng, S. SELDI-TOF-MS: the proteomics and bioinformatics approaches in the diagnosis of breast cancer. Breast (Edinburgh, Scotland) 2005, 14 (4), 250-255. (27) Wenke, J. L.; Rose, K. L.; Spraggins, J. M.; Schey, K. L. MALDI Imaging Mass Spectrometry Spatially Maps Age-Related Deamidation and Truncation of Human Lens Aquaporin-0. Investigative Ophthalmology & Visual Science 2015, 56 (12), 7398-7405. (28) Kaletas, B. K.; van der Wiel, I. M.; Stauber, J.; Guzel, C.; Kros, J. M.; Luider, T. M.; Heeren, R. M. Sample preparation issues for tissue imaging by imaging MS. Proteomics 2009, 9 (10), 2622-2633. (29) Albrethsen, J. Reproducibility in Protein Profiling by MALDI-TOF Mass Spectrometry. Clinical chemistry 2007, 53 (5), 852-858. (30) Croxatto, A.; Prod'hom, G.; Greub, G. Applications of MALDI-TOF mass spectrometry in clinical diagnostic microbiology. FEMS microbiology reviews 2012, 36 (2), 380-407. (31) Rudnick, P. A.; Clauser, K. R.; Kilpatrick, L. E.; Tchekhovskoi, D. V.; Neta, P.; Blonder, N.; Billheimer, D. D.; Blackman, R. K.; Bunk, D. M.; Cardasis, H. L.; Ham, A. J.; Jaffe, J. D.; Kinsinger, C. R.; Mesri, M.; Neubert, T. A.; Schilling, B.; Tabb, D. L.; Tegeler, T. J.; Vega-Montoto, L.; Variyath, A. M.; Wang, M.; Wang, P.; Whiteaker, J. R.; Zimmerman, L. J.; Carr, S. A.; Fisher, S. J.; Gibson, B. W.; Paulovich, A. G.; Regnier, F. E.; Rodriguez, H.; Spiegelman, C.; Tempst, P.; Liebler, D. C.; Stein, S. E. Performance metrics for liquid chromatography-tandem mass spectrometry systems in proteomics analyses. Mol. Cell. Proteomics 2010, 9 (2), 225-241.
21
(32) Tabb, D. L.; Vega-Montoto, L.; Rudnick, P. A.; Variyath, A. M.; Ham, A. J.; Bunk, D. M.; Kilpatrick, L. E.; Billheimer, D. D.; Blackman, R. K.; Cardasis, H. L.; Carr, S. A.; Clauser, K. R.; Jaffe, J. D.; Kowalski, K. A.; Neubert, T. A.; Regnier, F. E.; Schilling, B.; Tegeler, T. J.; Wang, M.; Wang, P.; Whiteaker, J. R.; Zimmerman, L. J.; Fisher, S. J.; Gibson, B. W.; Kinsinger, C. R.; Mesri, M.; Rodriguez, H.; Stein, S. E.; Tempst, P.; Paulovich, A. G.; Liebler, D. C.; Spiegelman, C. Repeatability and reproducibility in proteomic identifications by liquid chromatography-tandem mass spectrometry. Journal of proteome research 2010, 9 (2), 761-776. (33) Abbatiello, S. E.; Schilling, B.; Mani, D. R.; Zimmerman, L. J.; Hall, S. C.; MacLean, B.; Albertolle, M.; Allen, S.; Burgess, M.; Cusack, M. P.; Gosh, M.; Hedrick, V.; Held, J. M.; Inerowicz, H. D.; Jackson, A.; Keshishian, H.; Kinsinger, C. R.; Lyssand, J.; Makowski, L.; Mesri, M.; Rodriguez, H.; Rudnick, P.; Sadowski, P.; Sedransk, N.; Shaddox, K.; Skates, S. J.; Kuhn, E.; Smith, D.; Whiteaker, J. R.; Whitwell, C.; Zhang, S.; Borchers, C. H.; Fisher, S. J.; Gibson, B. W.; Liebler, D. C.; MacCoss, M. J.; Neubert, T. A.; Paulovich, A. G.; Regnier, F. E.; Tempst, P.; Carr, S. A. Large-Scale Interlaboratory Study to Develop, Analytically Validate and Apply Highly Multiplexed, Quantitative Peptide Assays to Measure Cancer-Relevant Proteins in Plasma. Molecular & cellular proteomics : MCP 2015, 14 (9), 2357-2374. (34) Addona, T. A.; Abbatiello, S. E.; Schilling, B.; Skates, S. J.; Mani, D. R.; Bunk, D. M.; Spiegelman, C. H.; Zimmerman, L. J.; Ham, A. J.; Keshishian, H.; Hall, S. C.; Allen, S.; Blackman, R. K.; Borchers, C. H.; Buck, C.; Cardasis, H. L.; Cusack, M. P.; Dodder, N. G.; Gibson, B. W.; Held, J. M.; Hiltke, T.; Jackson, A.; Johansen, E. B.; Kinsinger, C. R.; Li, J.; Mesri, M.; Neubert, T. A.; Niles, R. K.; Pulsipher, T. C.; Ransohoff, D.; Rodriguez, H.; Rudnick, P. A.; Smith, D.; Tabb, D. L.; Tegeler, T. J.; Variyath, A. M.; Vega-Montoto, L. J.; Wahlander, A.; Waldemarson, S.; Wang, M.; Whiteaker, J. R.; Zhao, L.; Anderson, N. L.; Fisher, S. J.; Liebler, D. C.; Paulovich, A. G.; Regnier, F. E.; Tempst, P.; Carr, S. A. Multi-site assessment of the precision and reproducibility of multiple reaction monitoring-based measurements of proteins in plasma. Nature biotechnology 2009, 27 (7), 633-641. (35) Paulovich, A. G.; Billheimer, D.; Ham, A. J.; Vega-Montoto, L.; Rudnick, P. A.; Tabb, D. L.; Wang, P.; Blackman, R. K.; Bunk, D. M.; Cardasis, H. L.; Clauser, K. R.; Kinsinger, C. R.; Schilling, B.; Tegeler, T. J.; Variyath, A. M.; Wang, M.; Whiteaker, J. R.; Zimmerman, L. J.; Fenyo, D.; Carr, S. A.; Fisher, S. J.; Gibson, B. W.; Mesri, M.; Neubert, T. A.; Regnier, F. E.; Rodriguez, H.; Spiegelman, C.; Stein, S. E.; Tempst, P.; Liebler, D. C. Interlaboratory study characterizing a yeast performance standard for benchmarking LC-MS platform performance. Molecular & cellular proteomics : MCP 2010, 9 (2), 242-254. (36) Ruderman, D. Designing Successful Proteomics Experiments. Methods in molecular biology 2017, 1550, 271-288. (37) Bereman, M. S. Tools for monitoring system suitability in LC MS/MS centric proteomic experiments. Proteomics 2015, 15 (5-6), 891-902. (38) Tabb, D. L. Quality assessment for clinical proteomics. Clinical biochemistry 2013, 46 (6), 411-420. (39) Borges, C. R.; Jarvis, J. W.; Oran, P. E.; Nelson, R. W. Population studies of Vitamin D Binding Protein microheterogeneity by mass spectrometry lead to characterization of its genotype-dependent O-glycosylation patterns. J. Proteome Res. 2008, 7 (9), 4143-4153. (40) Borges, C. R.; Jarvis, J. W.; Oran, P. E.; Rogers, S. P.; Nelson, R. W. Population studies of intact vitamin D binding protein by affinity capture ESI-TOF-MS. J. Biomol. Tech. 2008, 19 (3), 167-176. (41) Sturiale, L.; Barone, R.; Garozzo, D. The impact of mass spectrometry in the diagnosis of congenital disorders of glycosylation. J. Inherit. Metab. Dis. 2011, 34 (4), 891-899. (42) Kohler, I.; Augsburger, M.; Rudaz, S.; Schappler, J. New insights in carbohydrate-deficient transferrin analysis with capillary electrophoresis-mass spectrometry. Forensic Sci. Int. 2014, 243, 14-22. (43) Wada, Y. Mass spectrometry for congenital disorders of glycosylation, CDG. J. Chromatogr. B Analyt. Technol. Biomed Life Sci. 2006, 838 (1), 3-8. (44) Beck, A.; Wagner-Rousset, E.; Ayoub, D.; Van Dorsselaer, A.; Sanglier-Cianferani, S. Characterization of therapeutic antibodies and related products. Anal. Chem. 2013, 85 (2), 715-736.
22
(45) Kilpatrick, E. L.; Liao, W. L.; Camara, J. E.; Turko, I. V.; Bunk, D. M. Expression and characterization of 15N-labeled human C-reactive protein in Escherichia coli and Pichia pastoris for use in isotope-dilution mass spectrometry. Protein Expr. Purif. 2012, 85 (1), 94-99. (46) Yang, X.; Neta, P.; Stein, S. E. Quality control for building libraries from electrospray ionization tandem mass spectra. Anal. Chem. 2014, 86 (13), 6393-6400. (47) Perry, R. H.; Cooks, R. G.; Noll, R. J. Orbitrap mass spectrometry: instrumentation, ion motion and applications. Mass Spectrom. Rev. 2008, 27 (6), 661-699. (48) Scigelova, M.; Hornshaw, M.; Giannakopulos, A.; Makarov, A. Fourier transform mass spectrometry. Mol. Cell. Proteomics 2011, 10 (7), M111.009431. (49) Konermann, L.; Rodriguez, A. D.; Liu, J. On the formation of highly charged gaseous ions from unfolded proteins by electrospray ionization. Anal. Chem. 2012, 84 (15), 6798-6804. (50) Konermann, L.; Douglas, D. J. Equilibrium unfolding of proteins monitored by electrospray ionization mass spectrometry: distinguishing two-state from multi-state transitions. Rapid Commun. Mass Spectrom. 1998, 12 (8), 435-442. (51) Konermann, L.; Douglas, D. J. Unfolding of proteins monitored by electrospray ionization mass spectrometry: a comparison of positive and negative ion modes. J. Am. Soc. Mass Spectrom. 1998, 9 (12), 1248-1254. (52) Konermann, L.; Douglas, D. J. Acid-induced unfolding of cytochrome c at different methanol concentrations: electrospray ionization mass spectrometry specifically monitors changes in the tertiary structure. Biochemistry 1997, 36 (40), 12296-12302. (53) Liu, J.; Konermann, L. Irreversible thermal denaturation of cytochrome C studied by electrospray mass spectrometry. J. Am. Soc. Mass Spectrom. 2009, 20 (5), 819-828. (54) Yan, X.; Watson, J.; Ho, P. S.; Deinzer, M. L. Mass spectrometric approaches using electrospray ionization charge states and hydrogen-deuterium exchange for determining protein structures and their conformational changes. Mol. Cell. Proteomics 2004, 3 (1), 10-23. (55) Iavarone, A. T.; Jurchen, J. C.; Williams, E. R. Effects of solvent on the maximum charge state and charge state distribution of protein ions produced by electrospray ionization. J. Am. Soc. Mass Spectrom. 2000, 11 (11), 976-985. (56) Ruan, Q.; Ji, Q. C.; Arnold, M. E.; Humphreys, W. G.; Zhu, M. Strategy and its implications of protein bioanalysis utilizing high-resolution mass spectrometric detection of intact protein. Anal. Chem. 2011, 83 (23), 8937-8944. (57) Eng, J. K.; McCormack, A. L.; Yates, J. R. An approach to correlate tandem mass spectral data of peptides with amino acid sequences in a protein database. J. Am. Soc. Mass Spectrom. 1994, 5 (11), 976-989. (58) Perkins, D. N.; Pappin, D. J.; Creasy, D. M.; Cottrell, J. S. Probability-based protein identification by searching sequence databases using mass spectrometry data. Electrophoresis 1999, 20 (18), 3551-3567. (59) Wilkins, M. R.; Lindskog, I.; Gasteiger, E.; Bairoch, A.; Sanchez, J. C.; Hochstrasser, D. F.; Appel, R. D. Detailed peptide characterization using PEPTIDEMASS--a World-Wide-Web-accessible tool. Electrophoresis 1997, 18 (3-4), 403-408. (60) Fenyo, D.; Beavis, R. C. A method for assessing the statistical significance of mass spectrometry-based protein identifications using general scoring schemes. Anal. Chem. 2003, 75 (4), 768-774. (61) Geer, L. Y.; Markey, S. P.; Kowalak, J. A.; Wagner, L.; Xu, M.; Maynard, D. M.; Yang, X.; Shi, W.; Bryant, S. H. Open mass spectrometry search algorithm. J. Proteome Res. 2004, 3 (5), 958-964. (62) Chalkley, R. J.; Baker, P. R.; Huang, L.; Hansen, K. C.; Allen, N. P.; Rexach, M.; Burlingame, A. L. Comprehensive analysis of a multidimensional liquid chromatography mass spectrometry dataset acquired on a quadrupole selecting, quadrupole collision cell, time-of-flight mass spectrometer: II. New developments in Protein Prospector allow for reliable and comprehensive automatic analysis of large datasets. Mol. Cell. Proteomics 2005, 4 (8), 1194-1204.
23
(63) Zhang, Z.; Pan, H.; Chen, X. Mass spectrometry for structural characterization of therapeutic antibodies. Mass Spectrom. Rev. 2009, 28 (1), 147-176. (64) Coplen, T. B.; Böhlke, J. K.; Bièvre, P. D.; Ding, T.; Holden, N. E.; Hopple, J. A.; Krouse, H. R.; Lamberty, A.; Peiser, H. S.; Revesz, K.; Rieder, S. E.; Rosman, K. J. R.; Roth, E.; Taylor, P. D. P.; R. D. Vocke, J. R.; Xiao, Y. K. Isotope-abundance variations of selected elements. Pure and Applied Chemistry 2002, 74 (10), 1987-2017. (65) Christiansen, M.; Jorgensen, C. S.; Laursen, I.; Hirschberg, D.; Hojrup, P.; Houen, G. Protein chemical characterization of Gc globulin (vitamin D-binding protein) isoforms; Gc-1f, Gc-1s and Gc-2. Biochim. Biophys. Acta 2007, 1774 (4), 481-492. (66) Satomi, Y.; Shimonishi, Y.; Hase, T.; Takao, T. Site-specific carbohydrate profiling of human transferrin by nano-flow liquid chromatography/electrospray ionization mass spectrometry. Rapid Commun. Mass Spectrom. 2004, 18 (24), 2983-2988. (67) Xia, B.; Zhang, W.; Li, X.; Jiang, R.; Harper, T.; Liu, R.; Cummings, R. D.; He, M. Serum N-glycan and O-glycan analysis by mass spectrometry for diagnosis of congenital disorders of glycosylation. Anal. Biochem. 2013, 442 (2), 178-185. (68) Bergstrom, J. P.; Helander, A. Influence of alcohol use, ethnicity, age, gender, BMI and smoking on the serum transferrin glycoform pattern: implications for use of carbohydrate-deficient transferrin (CDT) as alcohol biomarker. Clin. Chim. Acta 2008, 388 (1-2), 59-67. (69) Dong, Q.; Yan, X.; Liang, Y.; Stein, S. E. In-Depth Characterization and Spectral Library Building of Glycopeptides in the Tryptic Digest of a Monoclonal Antibody Using 1D and 2D LC-MS/MS. Journal of proteome research 2016, 15 (5), 1472-1486. (70) Li, W.; Kerwin, J. L.; Schiel, J.; Formolo, T.; Davis, D.; Mahan, A.; Benchaar, S. A. Structural Elucidation of Post-Translational Modifications in Monoclonal Antibodies. In State-of-the-Art and Emerging Technologies for Therapeutic Monoclonal Antibody Characterization Volume 2. Biopharmaceutical Characterization: The NISTmAb Case Study; Scheil, J. E.; Davis, D. L.; Borisov, O. V., Eds; American Chemical Society: Washington, D.C., 2015; Vol. 1201, pp 119-183. (71) Prien, J. M.; Stöckmann, H.; Albrecht, S.; Martin, S. M.; Varatta, M.; Furtado, M.; Hosselet, S.; Wang, M.; Formolo, T.; Rudd, P. M.; Schiel, J. E. Orthogonal Technologies for NISTmAb N-Glycan Structure Elucidation and Quantitation. In State-of-the-Art and Emerging Technologies for Therapeutic Monoclonal Antibody Characterization Volume 2. Biopharmaceutical Characterization: The NISTmAb Case Study; Scheil, J. E.; Davis, D. L.; Borisov, O. V., Eds; American Chemical Society: Washington, D.C., 2015; Vol. 1201, pp 185-235. (72) Heck, A. J. Native mass spectrometry: a bridge between interactomics and structural biology. Nat. Methods 2008, 5 (11), 927-933.
24
Tables
Protein MW (kDa)
Capillary (⁰C)
HESI (⁰C)
In-source CID (V)
Resolution S/N
CRP 23 300 250 20 120 000 892
VDBP 51 300 350 20 15 000 81
Transferrin 80 300 400 20 15 000 1 244
IgG 150 300 250 40 15 000 159
Table 1: Orbitrap instrument settings resulting in the highest S/N for the mass spectrum of each protein.
25
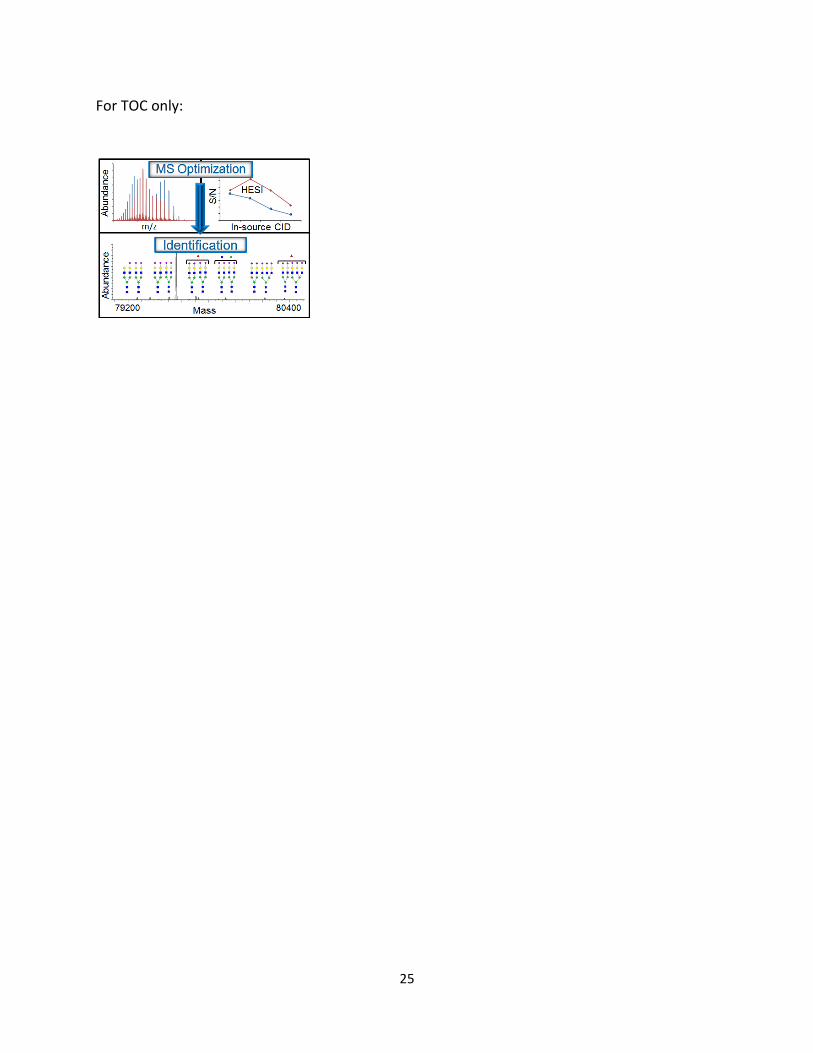
For TOC only: