guidelines for realizing the its-90 - omega engineering · 1 the comité consultatif...
TRANSCRIPT

Z-158
Z
Guidelines for Realizing the
International Temperature Scale of 1990 (ITS-90)
B. W. MangumNational Institute of Standards and Technology
Gaithersburg, MD 20899
and
G. T. FurukawaGuest Scientist
National Institute of Standards and TechnologyGaithersburg, MD 20899
1. INTRODUCTION
The Comité Consultatif de Thermométrie (CCT) is one of eight specialized technical subcommittees of the Comité International des Poids et Mesures (CIPM).The CIPM is a committee of the Conférence Générale des Poids et Mesures (CGPM).These eight subcommittees are:
1 The Comité Consultatif d’Électricité (CCE), established in 1927,2 The Comité Consultatif de Photométrie et Radiométrie (CCPR),
assigned this name in 1971; the previous name was the Comité Consultatif de Photométrie, established in 1933,
3. The Comité Consultatif de Thermométrie (CCT), established in 1937,4. The Comité Consultatif pour la Définition du Métre (CCDM),
established in 1952,5. The Comité Consultatif pour la Définition de la Seconde (CCDS),
established in 1956,6. The Comité Consultatif pour les Étalons de Mesure des Rayonnements
Ionisants (CCEMRI), established in 1958,7. The Comité Consultatif des Unités (CCU), established in 1964, and8. The Comité Consultatif pour la Masse et les grandeurs apparentées
(CCM), established in 1980.
The CCT is composed presently of members from the following laboratories:
1 Amt für Standardisierung, Messwesen und Warenprufung [ASMW], Berlin, DDR,
2. Bureau National de Metrologie, Paris, France: Institut National deMetrologie [INM], du Conservatoire National des Arts et Métiers,
3. Ceskoslovensky Metrologicky Ustav [CSMU], Bratislava Czechoslovakia,
4. National Research Council [NRC], Ottawa, Canada,5. CSIRO, Division of Applied Physics [CSIRO], Lindfield, Australia,6. D.I. Mendeleyev Institute for Metrology [VNIIM), Leningrad, USSR;
Physico-Technical and Radio-Technical Measurements Institute [PRMI], Moscow, USSR,
7. National Institute of Metrology [NIM], Beijing, PRC, 8. Istituto di Metrologia G. Colonnetti [IMGC], Turin, Italy,9. Kamerlingh Onnes Laboratorium [KOL], Leiden, The Netherlands,10. Korea Standards Research Institute [KSRI], Seoul, Korea,
11. National Institute of Standards and Technology [NIST], Gaithersburg, MD, USA,
12. National Physical Laboratory [NPLj, Teddington, UK,13. National Research Laboratory of Metrology [NRLM), Ibaraki, Japan,14. Physikalisch-Technische Bundesanstalt [PTB], Braunschweig, FRG,15. Van Swinden Laboratorium [VSL], Delft, The Netherlands,16. Iowa State University, Ames, Iowa, USA, and17. Bureau International des Poids et Mesures [BIPM], Sevres, France.
Shortly after the adoption of the International Practical Temperature Scale of1968 (IPTS-68) [100], it was realized that the scale had many deficiencies andlimitations. These included its lower limit of 13.81 K, its inaccuracy relativeto thermodynamic temperatures, and its non-uniqueness and irreproducibility,especially in the temperature region from T 68 - 903.89 K (630.74 ˚C) toT68 - 1337.58 K (1064.43 ˚C, the region in which the Pt-10%Rh/Pt thermocouplewas the standard interpolating instrument. Consequently, the CCT undertook thedevelopment of a new scale, and completed it in accordance with Resolution 7 ofthe 18th Conference Generale des Poid et Mesures [29], which met in October 1987(see appendices).
The CCT met 12-14 September 1989 at the Bureau International des Poids et Mesures(BIPM) in its 17th Session [14] and completed the final details of the newtemperature scale, the International Temperature Scale of 1990 (ITS-90) [66,83].The CCT then recommended to the CIPM, which met [84] on 26-28 September 1989 atthe BIPM, that the ITS-90 be adopted and made the official scale (seeappendices). Upon considering this recommendation, the CIPM adopted the newtemperature scale (see appendices), and the ITS-90 became the officialinternational temperature scale on 1 January 1990, the same date on which changesaffecting certain electrical reference standards were implemented [12]. TheITS-90 supersedes the IPTS-68, the International Practical Temperature Scale of1968, Amended Edition of 1975 [IPTS - 68 (75)][101], and the 1976 Provisional 0.5K to 30 K Temperature Scale (EPT-76) [99].
The ITS-90 was implemented at the NIST on 1 January 1990. The purpose of thisdocument is to describe the new scale, to give some guidelines for itsrealization and use, to facilitate its implementation, to give the differencesbetween temperatures on it and those on the IPTS-68(75) and on the EPT-76, andto describe how the NIST realizes the scale.
The ITS-90 extends upward from 0.65 K and temperatures on this scale are in muchbetter agreement with thermodynamic values than are those on the IPTS-68(75) andthe EPT-76. The new scale has subranges and alternative definitions in certainranges that greatly facilitate its use. Furthermore, its continuity, non-uniqueness and reproducibility throughout its ranges are much improved over thecorresponding characteristics of the previous scales. The biggest improvementin reproducibility results from the replacement of thermocouple thermometry withplatinum resistance thermometry in the range 630 ˚C to the freezing-pointtemperature of silver, and with radiation thermometry in the range from thefreezing-point temperature of silver to that of gold.
The change in the temperature scale affects not only technical interests involveddirectly in thermometry but also those involved with other reference standards,
Guidelines for Realizing the ITS-90
Figure 1. The temperature difference (t 90 - t 68)/°C in the range between the triple point ofequilibrium hydrogen (-259.3467 °C) and the freezing point of gold (1064.18°C) [83, 85].
0.4
Tem
per
atu
re d
iffe
ren
ce (
t 90-
t 68)
/°C
t90/°C
-200
-0.2
0
-0.04
-0.02
0
0.02
0
0
-0.01
-0.02
100
200 400
-200 0 200 400
600 800 1000
0.2
0
-0.2
* Reproduced with permission of National Institute of Standards and Technology

Z-159
Guidelines for Realizing the ITS-90 Cont’d
such as electrical standards, that are sensitive to temperature. As examples,standard resistors and standard cells are sensitive to temperature and generallyare maintained in constant-temperature environments, at least in nationalstandards laboratories,. At the present time, the temperatures of thoseenvironments are normally determined with thermometers that were calibrated onthe IPTS-68(75). A given thermodynamic temperature expressed on the ITS-90,however, has a value that is different from that expressed on the IPTS-68(75),except at absolute zero (0 K), at the triple-point temperature of water(273.16 K), and at a few other points at which the temperatures on the two scalesare fortuitously the same . This difference is shown in figure 1 [83]. A tableof differences between temperatures on the ITS-90, i.e., T 90 or T 90,and those onthe IPTS-68(75), i.e. , T 68 or t 68 and those on the EPT-76, T 76, is given in thetext of the ITS-90 and is presented here in table 1. Although temperature valuesexpressed on the two scales are different, the change is only in the expressionof the value of temperature and not in the temperature itself . That is to say,the Kelvin thermodynamic temperature (the hotness) of a material at any givenpoint is independent of the use of any of the ‘practical’ temperature scales.The better the ‘practical’ scale is, the closer the values of temperature on thatscale are to the thermodynamic temperature values. Needless to say, the Kelvinthermodynamic temperature values are experimentally determined, and they may havesignificant error. Since temperature values expressed on the thermodynamic and‘practical’ scales are different, if the temperature of the environment of areference standard is adjusted so that its value when expressed on the ITS-90 hasthe same value as had been used on the IPTS-68(75), there will have been a changeof the thermodynamic temperature and the value of the reference standard willusually change. Of course, one may not want to change the thermodynamictemperature of the reference standard. In that case, the thermodynamictemperature, as expressed an the IPTS-68(75), can simply be expressed on the ITS-90 (a numerical value different from that on the IPTS-68(75)) and the referencestandards will be unaffected. For more details on the effects of the change ofthe temperature scale on electrical standards, see National Institute ofStandards and Technology (NIST) Technical Note 1263 [12].
In addition to the effect on reference standards for measurements, alltemperature-sensitive properties, e.g., tables of thermodynamic properties,that are presently expressed on the IPTS-68(75) may require changes in values.
2. DEFINITION OF THE ITS-90
The ITS-90 was designed by the CCT in such a manner that temperature valuesobtained on it do not deviate from the Kelvin thermodynamic temperature values bymore than the uncertainties of the latter values at the time the ITS-90 wasadopted. Thermodynamic temperature is indicated by the symbol T and has the unitknown as the kelvin, symbol K. The size of the kelvin is defined to be 1/273.16of the thermodynamic temperature of the triple point of water. This definition ofthe Kelvin Thermodynamic Temperature Scale (KTTS) that is based on the value of asingle finite temperature is not new; the CCT proposed it in 1954, the CIPMrecommended it, and the Tenth CGPM adopted it that same year [30].
Because temperatures on previous temperature scales were expressed relative tothe ice point (271.15 K), temperature, symbol t , on the Celsius Temperature Scaleis defined by:
0.10.1 0.30.3 0.50.5 1 3 55 10 30 50 100100 300 500 1000 3000
CalibrationPoints
Bounds of Helium VaporPressure Calibration
Bounds of Helium VaporPressure Thermometry
4HePoint
4He
3He CVGT
CVGT
4He VPEQN
3He VPEQN
SPRT
e-H TP, VP2
e-H 2TP
e-H 2
e-H 2
17K
20.3K
Ne TP
TPO2
Ar TP
H2OTP
HgTP
GaMP
InFP
SnFP
ZnFP
AlFP
AgFP
Au FP
Cu FP
SPRT
Planck'sRadiation Equation
Temperature, K (ITS-90)
5000 10000
Figure 2. A schematic representation of the ITS-90 showing the temperatures of the defining fixed points (or phaseequilibrium states) on the scale and temperature ranges defined by interpolation instruments and equations.
Table 1. Differences between T90 and T68 (and t90 and t68), and between T90 and T76
(T90 - T76) /mK
T90 /K 0 1 2 3 4 5 6 7 8 9
0 -0.1 -0.2 -0.3 -0.4 -0.510 -0.6 -0.7 -0.8 -1.0 -1.1 -1.3 -1.4 -1.6 -1.8 -2.020 -2.2 -2.5 -2.7 -3.0 -3.2 -3.5 -3.8 -4.1
(T90 - T68) /K
T90 / K 0 1 2 3 4 5 6 7 8 9
10 -0.006 -0.003 -0.004 -0.006 -0.008 -0.00920 -0.009 -0.008 -0.007 -0.007 -0.006 -0.005 -0.004 -0.004 -0.005 -0.00630 -0.006 -0.007 -0.008 -0.008 -0.008 -0.007 -0.007 -0.007 -0.006 -0.00640 -0.006 -0.006 -0.006 -0.006 -0.006 -0.007 -0.007 -0.007 -0.006 -0.00650 -0.006 -0.005 -0.005 -0.004 -0.003 -0.002 -0.001 0.000 0.001 0.00260 0.003 0.003 0.004 0.004 0.005 0.005 0.006 0.006 0.007 0.00770 0.007 0.007 0.007 0.007 0.007 0.008 0.008 0.008 0.008 0.00880 0.008 0.008 0.008 0.008 0.008 0.608 0.008 0.008 0.008 0.00890 0.008 0.008 0.008 0.008 0.008 0.008 0.008 0.009 0.009 0.009
T90 /K 0 10 20 30 40 50 60 70 80 90
100 0.009 0.011 0.013 0.014 0.014 0.014 0.014 0.013 0.012 0.012200 0.011 0.010 0.009 0.008 0.007 0.005 0.003 0.001
(T90 - T68) / °C
T90 / °C 0 -10 -20 -30 -40 -50 -60 -70 -80 -90
-100 0.013 0.013 0.014 0.014 0.014 0.013 0.012 0.010 0.008 0.0080 0.000 0.002 0.004 0.006 0.008 0.009 0.010 0.011 0.012 0.012
T90 / °C 0 10 20 30 40 50 60 70 80 90
0 0.000 -0.002 -0.005 -0.007 -0.010 -0.013 -0.016 -0.018 -0.021 -0.024100 -0.026 -0.028 -0.030 -0.032 -0.034 -0.036 -0.037 -0.038 -0.039 -0.039200 -0.040 -0.040 -0.040 -0.040 -0.040 -0.040 -0.040 -0.039 -0.039 -0.039300 -0.039 -0.039 -0.039 -0.040 -0.040 -0.041 -0.042 -0.443 -0.045 -0.046400 -0.048 -0.051 -0.053 -0.056 -0.059 -0.062 -0.065 -0-068 -0.072 -0.075500 -0.079 -0.083 - 0. 087 -0.090 -0.094 -0.098 -0.101 -0.105 -0.106 -0.112600 -0.115 -0.118 -0.122 -0.125 -0.08 -0.03 0.02 0.06 0.11 0.16700 0.20 0.24 0.28 0.31 0.33 0.35 0.36 0.36 0.36 0.35800 0.34 0.32 0.29 0.25 0.22 0.18 0.14 0.10 0.06 0.03900 -0.01 -0.03 -0.06 -0.08 -0.10 -0.12 -0.14 -0.16 -0.17 -0.18
1000 -0.19 -0.20 -0.21 -0.22 -0.23 -0.24 -0.25 -0.25 -0.26 -0.26
T90 / ° C 0 100 200 300 400 500 600 700 800 900
1000 -0.26 -0.30 -0.35 -0.39 -0.44 -0.49 -0.54 -0.60 -0.662000 -0.72 -0.79 -0.85 -0.93 -1.00 -1.07 -1.15 -1.24 -1.32 -1.413000 -1.50 -1.59 -1.69 -1.78 -1.89 -1.99 -2.10 -2.21 -2.32 -2.43

Z-160
Z
t / ˚ C = T/K - 273.15. (1)
The unit of temperature t is the degree Celsius, symbol ˚ C, and it is by definition the same size as the kelvin. A difference of temperature may beexpressed either in kelvins or in degrees Celsius.
Temperatures on the ITS-90 are expressed, in terms of the International KelvinTemperatures, with the symbol, T90, or, in terms of the International Celsius Temperatures, with the symbol t 90. The unit of the temperature T90 is the kelvin,symbol K, and the unit of the temperature t 90 is the degree Celsius, symbol ˚C.The relation between T90 and t 90 is:
t 90/˚C = T90/K - 273.15. (2)
The ITS-90 extends upward from 0.65 K. There are alternative definitions of T90in certain temperature ranges and they have equal status. In measurements of thehighest precision made at the same temperature, the alternative definitions willyield detectable temperature differences. Also, at any given temperature betweendefining f ixed points, dif ferent interpolat ing thermometers that meetthe specifications of the ITS-90 will indicate different temperature values.These latter differences are referred to as the non-uniqueness in the definitionof the ITS-90, The magnitude of the differences that result from these twosources is sufficiently small to be negligible for all practical purposes.
Temperatures on the ITS-90 are defined in terms of equilibrium phase states ofpure substances (defining fixed points), interpolating instruments, and equationsthat relate the measured property of the instruments to T90. The equilibriumphase states of the pure substances and the assigned temperatures used asdefining fixed points of the ITS-90 are listed in table 2. Figure 2 showsschematically the defining phase states and temperature ranges defined by thevarious interpolating instruments and equations. For comparison purposes, wegive in table 3 the defining fixed points, and their assigned temperatures, ofthe ITS-90 and of all the previous internationally agreed-upon scales.
2.1 BETWEEN 0.65 K AND 5.0 K: 3He and 4He VAPOR PRESSURE THERMOMETRY
The ITS-90 is defined between 0.65 K and 3.2 K by the vapor-pressure-temperature relation of 3He, and between 1.25 K and 2.1768 K (the λ point) and between2.1768 K and 5.0 K by the vapor-pressure-temperature relations of 4He. T90 isdefined by the vapor-pressure equations of the form:
9T90/K = A 0 + ∑ Ai [ δn( p/Pa) - B] /C) 1. (3)
i=1
The values of the coefficients A i and of the constants A 0, B and C of the vapor-pressure equations for 3He and 4He are given in table 4.
a e-H 2 indicates equil ibr ium hydrogen, that is, hydrogen with theequilibrium distribution of its ortho and para states at the correspondingtemperatures. Normal hydrogen at room temperature contains 25% para and75% ortho hydrogen.
b VP indicates vapor pressure point or equation; CVGT indicates constantvolume gas thermometer point; TP indicates tr iple point (equi l ibr iumtemperature at which the sol id, l iquid and vapor phases coexist); FPindicates freezing point and MP indicates melting point (the equilibriumtemperatures at which the solid and liquid phases coexist under a pressureof 101,325 Pa, one standard atmosphere). The isotopic composition is thatnaturally occurring.
c Previously, these were secondary fixed points.
d Previously, these were alternative fixed points.
e From reference functions, equations (14) and (22).
Material a Equilibrium State b Temperature W r ( T90) e
T90(K) t 90 (˚C)
He VP 3 to 5 - 270.15 to- 268.15
e-H 2 TP 13.8033 - 259.3467 0.00119007e-H 2 (or He) VP (or CVGT) ≈ 17 ≈- 256.15e-H 2 (or He) VP (or CVGT) ≈ 20.3 ≈- 252.85
Nec TP 24.5561 - 248.5939 0.00844974O2 TP 54.3584 - 218.7916 0.09171804Ar d TP 83.8058 - 189.3442 0.21585975Hgc TP 234.3156 38.8344 0.84414211H2O TP 273.16 0.01 1.00000000Gac MP 302.9146 29.7646 1.11813889In c FP 429.7485 156.5985 1.60980185Snd FP 505.078 231.928 1.89279768Zn FP 692.677 419.527 2.56891730 Al c FP 933.473 660.323 3.37600860Ag FP 1234.93 961.78 4.28642053Au FP 1337.33 1064.18Cuc FP 1357.77 1084.62
Table 3. Comparison of temperatures of fixed points assigned on variousscales. Temperatures are expressed in kelvins on the KTTS or eqviivalent scales
Point NHS a ITS-27 b ITS-48 b IPTS-48 b IPTS-68 IPTS-68(75) EPT-76 ITS-90
Au FP c - 1336.15 1336.15 1336.15 1337.58 1337.58 - 1337.33
Ag FP - 1233.65 1233.95 1233.95 1235.08 1235.08 - 1234.93
Al FP - - - - - - - 933.473
S BP d - 717.75 717.75 717.75 - - - -
Zn FP - - - (692.655) 692.73 692.73 - 692.677
Sn FP - - - - (505.1181) (505.1181) - 505.078
In FP - - - - - - - 429.7485
H2O BP 373 373.15 373.15 373.15 373.15 373.15 - -
Ga TP - - - - - - - 302.9146
H2O TPe - - - (273.16) 273.16 273.16 - 273.16
H2O FP 273 273.15 273.15 - - - - -
Hg TP - - - - - - - 234.3156
02 BPf - 90.18 90.18 90.18 90.188 90.188 - -
Ar TP - - - - - (83.798) - 83.8058O2 TP - - - - 54.361 54.361 - 54.3584
Ne BP - - - - 27.102 27.102 21.102 -24.5561
Ne TP - - - - - - 24.5591
H2 BP - - - - 20.28 20.28 20.2734 20.3
H2 BPg - - - - 17.042 17.042 17.0373 17.0
H2 TP - - - - 13.81 13.81 13.8044 13.8033
Pb SP h - - - - - - 7.1999 -4He BP - - - - - - 4.2221 4.2
In SP - - - - - - 3.4145 -3He BP - - - - - - - 3.2
Al SP - - - - - - 1.1796 -
Zn SP - - - - - - 0.851 -
Cd SP - - - - - - 0.519 -
a NHS = Normal hydrogen scale [25].b For a time, the ice point Was taken to be 273.16 K. Here, the value 273.15 K
was used to convert temperature values in degrees Centigrade or Celsius tokelvins in order to be as consistent as possible throughout the table.
c FP = Freezing point.d BP = Boiling point at 101,325 Pa.e TP = Triple point.f Changed in 1975 to the condensation point.g Reduced-pressure boiling point, at P = 33,330.6 Pa.h SP = Superconductive transition point.
2.2 BETWEEN 3.0 K AND 24.5561 K (THE TRIPLE POINT OF Ne): 3He and 4He CONSTANT VOLUME GAS THERMOMETRY
Between 3.0 K and 24.5561 K, the ITS-90 is defined in terms of the 3He or 4Heconstant volume gas thermometer(CVGT). The thermometer is calibrated at threetemperatures - at the triple point of neon (24.556,1 K), at the triple point ofequilibrium hydrogen (13.8033 K), and at a temperature between 3.0 K and 5.0 K, thevalue of which is determined by using either a 3He or a 4He vapor-pressurethermometer as described in section 2.1.
For a 4He CVGT that is used between 4.2 K and the triple point of neon(24.5561 K), T90 is defined by the equation:
T90 = a + b p + c p2 (4)
where p is the CVGT pressure and a, b, and c are coefficients that are determinedfrom calibrations at the three specified temperatures, but with the additionalrequirement that the calibration with the vapor-pressure thermometer be made ata temperature between 4.2 K and 5.0 K
For a 4He CVGT that is used between 3.0 K and 4.2 K, and for a 3He CVGT that is usedbetween 3.0 K and 24.5561 K, the non-ideality of the gas must be accounted for,using the respective second virial coefficients, B4( T90) or B3( T90). T90 is definedin this range by the equation:
a + b p + cp 2 (5)T90 =
1 + B x ( T90) N/ V
Table 4. Values of the coefficients A 1 and of the constants B and C for the 3He and 4Hevapor-pressure equations and the temperature range for which each equation is valid
Coef. or 3He 4He 5HeConstant 0.65 K to 3.2 K 1.25 K to 2.1768 K 2.1768 K to 5.0 K
A0 1.053 447 1.392 408 3.146 631A1 0.980 106 0.527 153 1.357 655A2 0.676 380 0.166 756 0.413 923
A3 0.372 692 0.050 988 0.091 159A4 0.151 656 0.026 514 0.016 349A5 -0.002 263 0.001 975 0.001 826
A6 0.006 596 -0.017 976 -0.004 325A7 0.088 966 0.005 409 -0.004 973A8 -0.004 770 0.013 259 0
A9 -0.054 943 0 0B 7.3 5.6 10.3C 4.3 2.9 1.9
Table 2. Defining fixed points of the ITS-90

Z-161
Guidelines for Realizing the ITS-90 Cont’d
where p is the CVGT pressure; a, b, and c are coefficients that are determinedfrom calibrations at the three defining temperatures; Bx( T90) refers to B3( T90) orB4( T90), and N/V is the gas density, in moles per cubic meter, in the CVGT bulb.The values of the second virial coefficients are given by the followingequations:
for 3He,
B3( T90)/m 3mol -1 = [16.69 - 336.98 ( T90/K) -1
+ 91.04 ( T9O/K) -2 - 13.82 ( T90/K) -3 ] 10 -6 , (6)
and for 4He,
B4( T90)/m 3mol -1 = [16.708 - 374.05 ( T90/K) -1 - 383.53 ( T90/K) -2
+ 1799.2 ( T90/K) -3 - 4033.2 ( T90/K) -4 + 3252.8 ( T90/K) -5 ] 10 -6 . (7)
The accuracy of realization of T90 by using a CVGT is dependent upon the CVGTdesign and the gas density used.
2.3 BETWEEN 13.8033 K (THE TRIPLE POINT OF EQUILIBRIUM HYDROGEN) AND 1234.93 K(THE FREEZING POINT OF SILVER): PLATINUM RESISTANCE THERMOMETRY
Between 13.8033 K (-259.3467 ˚C) and l234.93 K (961.78 ˚C),the ITS-90 is defined interms of specified fixed points to which temperature values have been assigned,by resistance ratios of platinum resistance thermometers obtained by calibrationat specified sets of the fixed points, and by reference functions and deviationfunctions of resistance ratios which relate to T90 between the fixed points.(Henceforth, for convenience, the standards type platinum resistancethermometers will be referred to by the acronym SPRT.)
2.3.1 GENERAL RELATION BETWEEN RESISTANCE RATIOS AND T90
Temperatures on the ITS-90 in the above-indicated range are expressed in terms ofthe ratio of the resistance R( T90) at temperature T90 and the resistance R(273.16 K) at the triple-point temperature of water. (Hereinafter, forconvenience, the terms triple-point temperature, freezing-point temperature andmelting-point temperature will be expressed as triple point, freezing point andmelting point, respectively.) The resistance ratio W( T90) is:
W( T90) = R( T90)/ R(273.16 K). (8)
The temperature T90 is calculated from the resistance ratio relation:
W( T90) - W r ( T90) = ∆W( T90) (9)
where W( T90) is the observed value, Wr ( T90) is the value calculated from thereference functions, and ∆W( T90) is the deviation of the observed W( T90) value of theparticular SPRT from the reference function value. The official version of theITS-90 [83] does not indicate the difference [ W( T90) - Wr ( T90)] by ∆W( T90).
Note that in the earlier international scales, W( T) was defined with reference tothe SPRT resistance 273.15K, not 273.16 K .
There are two reference functions Wr ( T90), one for the range 13.8033 K to273.16 K and another for the range 273.15 K to 1234.93 K. These referencefunctions will be described in the discussion of the two ranges (secs. 2.3.3 and2 3 4).
The deviation ∆W( T90) is obtained as a function of T90 for various ranges andsubranges by calibration at specified fixed points. The form of the deviationfunction depends upon the temperature range of calibration.
A schematic representation of the ITS-90 in the range of temperature specifiedfor SPRT’s is given in figure 3. Shown in figure 3 are the temperatures of thedefining fixed points in this region of the scale and the various subrangesspecified by the scale.
2.3.2 SPRT SPECIFICATIONS
The SPRT sensing element must be made from pure platinum and be strain-free. Thefinished SPRT must meet one of the following criteria:
W(302.9146 K) ≥ 1.118 07, or (10)
W(234.3156 K) ≤ 0.844 235. (11)
These criteria are equivalent to a requirement on the slope, namely,
[d W( T90)/d T90] ≥ 3.986 x 10 -3 K-1 at 273.16 K. (12)
An SPRT that is acceptable for use to the freezing point of silver must meet thefollowing additional criterion:
W(1234.93 K) ≥ 4.2844. (13)
The temperature range over which an SPRT can be used depends upon the thermometer design,but no single design of SPRT can be used over the whole temperature range with highaccuracy. For measurements at temperatures from 13.8033 K (-259.3467 ˚C) to429.7485 K (156.5985 ˚C), or perhaps to as high as 505.078 K (231.928 ˚C) ,capsule-type SPRT’s that have a nominal resistance of 25.5 Ω at 273.16 K may beused. Long-stem type SPRT’s of the same nominal resistance may be used in therange from about 77 K to 933.473 K (660.323 ˚C) . For temperatures above about 660˚C and to as high as 1234.93 K (961.78 ˚C), long-stem type SPRT’s having anominal resistance of 0.25 Ω (or possibly 2.5 Ω) at 273.16 K should be used. WhenSPRT’s are used at the highest temperatures, leakage currents through theinsulation supports of the platinum wire become significant and these result Inshunting of the resistor. The effect of this shunting is reduced by using lowvoltages with low resistance SPRT’s.
If the sheath of the long-stem type SPRT is borosilicate glass or stainlesssteel, the SPRT should not be used above the upper calibration temperature limitof 42˚C. If the sheath is Inconel, the upper temperature limit becomes about
10 100Temperature, K (ITS-90)
13.8
033,
e-H
2 T
P
17, e
-H2
VP
20.3
, e-H
2 V
P
24.5
561,
Ne
TP
54.3
584,
O2
TP
83.8
058,
Ar T
P
234.
3156
, Hg
TP
302.
9146
, Ga
MP
429.
7485
, In
FP
505.
078,
Sn
FP
692.
677,
Zn
FP
933.
473,
Al F
P
1234
.93,
Ag
FP
273.16H2O TP
Calibration Points
Interpolation Range
1000 10000
Figure 3. A schematic representation of the ITS-90 in the range specified for the platinumresistance thermometer, showing the various defined subranges and the temperatures of the defining

Constant or Value Constant or ValueCoefficient Coefficient
A0 -2.135 347 29 B 0 0.183 324 722A1 3.183 247 20 B 1 0.240 975 303A2 -1.801 435 97 B 2 0.209 108 771A3 0.717 272 04 B 3 0.190 439 972
A4 0.503 440 27 B 4 0.142 648 498A5 -0.618 993 95 B 5 0.077 993 465A6 -0.053 323 22 B 6 0.012 475 611A7 0.280 213 62 B 7 -0.032 267 127
A8 0.107 152 24 B 8 -0.075 291 522A9 -0.293 028 65 B 9 -0.056 470 670A10 0.044 598 72 B 10 0.076 201 285A11 0.118 686 32 B 11 0.123 893 204
A12 -0.052 481 34 B 12 -0.029 201 193B13 -0.091 173 542B14 0.001 317 696B15 0.026 025 526
C0 2.781 572 54 D 0 439.932 854C1 1.646 509 16 D 1 472.418 020C2 -0.137 143 90 D 2 37.684, 494C3 -0.006 497 67 D 3 7.472 018
C4 -0.002 344 44 D 4 2.920 828C5 0.005 118 68 D 5 0.005, 184C6 0.001 879 82 D 6 -0.963 864C7 -0.002 044 72 D 7 -0.188 732
C8 -0.000 461 22 D 8 0.191 203C9 0.000 457 24 D 9 0.049 025
Z-162
Z
660 ˚ C. If the sheath is fused silica, temperature measurements can be made up to962˚ C.
For measurements up to about 630 ˚ C, mica is just barely adequate as an electricalinsulator for the temperature sensing element and leads of SPRT’s. Starting atabout 500˚C, muscovite mica begins to decompose, evolving water thatelectrically shunts the thermometer resistor, Phlogopite mica is adequatelystable to 630˚C. For measurements up to 962˚C, refractory materials such as fusedsilica and sapphire are used for electrical insulation.
2.3.3 RANGE 13.8033 K TO 273.16 K
In the range 13.8033 K to 273.16 K, the reference function W r (T 90) is given by:
12,n[Wr (T 90)] = A 0 + ∑ Ai ([, n(T 90/273.16 K) + 1.5]/1.5) i (14)
i=I
A specified,, approximate inverse [83] of this equation, equivalent to within± 0.000 1 K, is:
12T90/273.16 K = B 0 + ∑ Bi ([W r (T 90)] 1/6 - 0.65)/0.35 i (15)
i=I
The values of the constants A 0 and B 0, and of the coefficients A i and B i ofequations (14) and (15) are listed in table 5.
If an SPRT is to be used throughout the range from 13.8033 K to 273.16 K, it mustbe calibrated at the triple points of equilibrium hydrogen (13.8033 K), neon(24.5561 K), oxygen (54.3584 K) argon (83.8058 K), mercury (234.3156 k), andwater (273.16 K), and at two additional temperatures close to 17.0 K and 20.3 K.The temperatures of calibration near 17.0 K and 20.3 K maybe determined by usingeither a CVGT as defined in section 2.2 or the specified vapor - pressure -temperature relation of equilibrium hydrogen.
When the CVGT is used, the two temperatures must be within the ranges 16.9 K to17.1 K and 20.2 K to 20.4 K, respectively. When the equilibrium hydrogen vapor-pressure thermometer is used, the two temperatures must be within the ranges17.025 K to 17.045 K and 20.26 K to 20.28 K, respectively. The temperatures ofthe equilibrium hydrogen vapor-pressure thermometer are determined from thevalues of the hydrogen vapor pressure, p, and the equations:
T90/K - 17.035 = (p/kPa - 33.3213)/13.32 (16)
T90/K - 20.27 = (p/kPa - 101.292)/30. (17)
where 13.32 and 30 are, values of -(dp/dT 90)/(kPa/K) at 17.035 K and 20.27 K,respectively.
Depending upon the’ temperature range of use, the SPRT may be calibrated from273.16 K down to 13.8033 K (the triple point of equilibrium hydrogen), down to
24.5561 K (the triple point of neon), down. to 54.3584 K (the triple point ofoxygen), or down to 83.8058 K (the triple point of argon).
The deviation function for calibration over the range 13,8033 K to 273.16 K isgiven by the relation:
5
∆W1(T90) = a 1[W(T 90) - 1] + b 1[W(T 90) - 1] 2 + ∑ c1[, nW(T90)] i+n , (18)
i=I
with n = 2. The coefficients a 1, b 1, and the five c 1 ‘s are obtained by
calibration at all eight of the above temperatures, including that at the triplepoint of water, The values of Wr ,( T90) are obtained from the reference function
[eq (14)].
The official version of the ITS-90 [83] does not indicate the difference[ W( T90) - Wr ( T90)] by ∆ W,( T90), does not use the subscript m, where in eq (18),
m = 1, nor does it label the coefficients a and b with subscript m. However, weadopt this subscript notation to identify the subranges. Additionally, thisnotation is useful when reporting calibration results.
If an SPRT is not to be used over the entire 13.8033 K to 273.16 K range, but itsuse restricted to one of the subranges, the deviation functions and thecalibration points are as follows.
2.3.3.1 SUBRANGE 24.5561 K TO 273.16 K
The deviation function for calibration in the subrange 24.5561 K to 273.16 K isgiven by the relation:
3∆W2 (T 90) a 2[W(T 90) - 1] + b 2[W(T 90) - 1] 2 + ∑ c i [, n[W(T 90)] i+n , (19)
i=I
with n = 0. The coefficients a 2, b 2, and the three, c 1’s are obtained by
calibrating,the SPRT at the triple points of equilibrium hydrogen (13.8033 K),neon (24.5561 K), oxygen (54.35 84 K), argon (81.8058 K), mercury (234.3156 K)and water (273.16 K). The, values of Wr ( T90), are obtained from the reference
function [eq (14)]. Note that for this subrange, temperatures are measured onlydown to the triple point of neon, although the-thermometer must be calibratedat the triple point of equilibrium hydrogen.
2.3.3.2 SUBRANGE 54.3584 K TO 273.16 K
The deviation function for calibration in the subrange 54.3584 K to 273 16 K isgiven by the relation:
∆ W2 ( T90) a 3[ W( T90) - 1] + b 3[ W( T90) - 1] 2 + c i [, nW( T90)] i+n , (20)
with n - 1. The coefficients a 3, b 3, and c 1 are obtained by calibrating the SPRTat the triple points of oxygen (54.3584 K), argon (83.8058 K), mercury(234.3156 K), and water (273.16 K). The values of W r ( T90) are obtained from the
reference function [eq (14)].
2.3.3.3 SUBRANGE 83.8058 K TO 273.16 K
The deviation function for calibration in the subrange 83.8058 K to 273.16 K isgiven-by the relation:
∆ W4 ( T90) a 4[ W( T90) - 1] + b 4[ W( T90) - 1]l nW( T90). (21)
The coefficients a 4 and b 4 are obtained by calibrating the SPRT at the triple
points of argon (83.8058 K), mercury (234.3156 K), and water (273.16 K). Thevalues of W r ( T90) are obtained from the reference function [eq (14)].
2.3.4 RANGE 273.15 K (O˚C) TO 1234.93 K (961.78 ˚C)
In the range 273.15. K. to 12341.93 K, the equation for the reference functionWr ( T90) is given by:
9Wr (T 90) = C 0 + ∑ C1[(T 90/K - 754.15)/481] i (22)
i=I
A specified, approximate inverse [83] of this equation, equivalent to within± 0.000 13 K, is:
9T90/K - 273.15 = D 0 + ∑ Di ([W r (T 90) - 2.64]/1.64] i (23)
i=I
The values of the constants C 0 and D 0 and of the coefficients C i and D i of eqs
(22) and (23) are, listed in table 5.
If the SPRT is to be used over the entire range 273.15 K to 1234.93 K, it must becalibrated at the triple point of water (273.16 K) and at the freezing points oftin (505.078 K), zinc (692.677 K), aluminum (933.473 K), and silver, (1234.93 K).
The deviation function is given by the relation:
∆ W6( T90) = a 6[ W( T90) - 1] + b 6[ W( T90) - 1] 2
+ c 6[ W( T90) - 1] 3 + d[ W( T90) - W(933.473 K)] 2 (24)
The values of a 6, b 6, and c 6 are determined from the measured deviations ∆ W( T90)
of W( T90) from the reference values W,( T90) [obtained from eq (22)] at the
freezing points :of tin (505.078 K), zinc (692.677 K), and aluminum, (933.473 K),ignoring the term involving d. Then, d is determined-from these values of a 6, b 6,
c 6 and the deviation ∆ W6( T90) of W( T90) from the reference value Wi ( T90) at the
freezing point of silver (1234.93 K). The coefficient d is, used only fortemperature measurements in the range from the freezing point of aluminum to thefreezing point of silver. For temperature measurements below the freezing point ofaluminum, d = 0.
SPRT’s may be calibrated for use throughout the whole range 273.15 K to 1234.93 Kor for shorter subranges by calibrations at fixed points between 273.15 K andthe upper limit of 933.473 K (freezing point of aluminum,. 660.323 ˚C), of692.677 K (freezing point of zinc, 419.527 °C), of 505.078 K (freezing point oftin, 231.928 ˚C) of 429.7485 K (freezing point of indium, 156.5985 °C), or of302.9146 K (melting point of gallium, 29.7646 °C).
The deviat ion function ∆ W5( T90 ) wi l l be discussed l i ter in the text.
Table 5. Values of the coefficients, A i , B i , C i and D i , and of the constants A 0,B0, C 0, and D 0 in the reference functions, eqs (14) and (22), and in thefunctions approximating them, given by eqs (15) and (23)

Z-163
If an SPRT is not to be used over the entire 273.15 K to 1234.93 K range, but itsuse restricted to one of the subranges, the deviation functions and thecalibration points are as follows.
2.3.4.1 SUBRANGE 273.15 K (0 ° C) TO 933.473 K (660.323 -C. FREEZING POINT OFALUMINUM)
For an SPRT used throughout the subrange 273.15 K to 933.473 K, the thermometer iscalibrated at the triple point of water (273.6 K) and at the freezing points of tin(505.078 K) zinc (692.677 K), and aluminum (9 33.473 K). The devi ation function isgiven by the relation:
∆W7(T 90) - a 7[W(T 90) - 1] + b 7(W(T 90) _ 1] 2 + C 7(WT90) - 1] 3. (25)
The coefficients a 7, b 7, and C 7, are identical to a 6, b 6, and C 6, respectively, aredetermined from the deviations ∆W(T90) of W(T 90) from the reference values W I ,(T 90) [eq(22)] at the freezing points of tin (505.078 K), zinc (692.677 K), and aluminum(933 . 473 K).
2.3.4.2 SUBRANGE 273.15 K (0 °C) TO 692.677 K (419.527 °C, FREEZING POINT OF ZINC)
For an SPRT used throughout the subrange 273.15 K to 692.677 K, the thermometer iscalibrated at the triple point of water (273.16 K); and at the freezing points of tin(505.078 K) and zinc (692.677 K). The deviation function is given by the relation:
∆W8(T 90) - a 8[W(T 90) - 1]+ b 8[W(T 90) - 1] 2 (26)
The coefficients a 8 and b a are determined from the deviations ∆W(T90) of W(T 90)from the reference values W r (T 90) [eq (22)] at the freezing points of tin (505.078K) and zinc (692.677 K).
2.3.4.3 SUBRANGE 273.15 K (0 °C) TO 505.078 K (231.928 °C. FREEZING POINT OF TIN)
For an SPRT used throughout the subrange 273.15 K to 505.078 K. the thermome ter iscalibrated at the triple point of.water)(273.16 K) , and at the freezing points ofindium (429.7485 K) and tin (505 078 K). The form of the deviation func tion is thesame as that for the subrange 273.15 K to 692.677 K, i.e.,
∆W9(T 90) - a 9[W(T 90) - 1] + b 9(W(T 90) - 1] 2. (27)
The coefficients a 8 and b 8 are determined from the deviations ∆W(T90) of W(T 90) fromthe reference values W r (T 90) [eq (22)] at the freezing points of indium (429.7485 K)and tin (505.078 K).
2.3.4.4 SUBRANGE 273.15 K (0 °C) To 429.7485 K (156.5985 °C, FREEZING POINT OFINDIUM)
For an SPRT used throughout the subrange 273.15 K to 429.7485 K. the thermom eter iscalibrated at the triple point of water (273.16 K) and at the freezing point ofindium (429.7485 K). The deviation function is:
∆W10(T 90) - a 9[W(T 90) -1] (28)
The coefficient a 10 is determined from the deviation ∆W(T90) of W(T 90) from thereference value W r (T 90) [eq (22)] at the freezing point of indium (429.7485 K).
2.3.4.5 SUBRANGE 273.15 K (0 °C) TO 302.9146 K (29.7646 °C. MELTING POINT OFGALLIUM)
For an SPRT used throughout the subrange 273.15 K to 302.9146 K, the the rmometer iscalibrated at the triple point of water (273.16 K) and at the melting point ofgallium (302.9146 K). The deviation function is:
∆W11(T 90) - a 11W(T90) - 1]. (29)
The coefficient a 11 is determined from the deviation ∆W(T90) of W(T 90) from thereference value W r (T 90) [eq (22)] at the melting point of gallium (302.9146 K)
2.3.5 SUBRANGE 234.3156 K (-38.8344 °C. TRIPLE POINT OF MERCURY) TO 302.9146 K(29.7646 THE MELTING POINT OF GALLIUM)
For an SPRT used throughout the subrange 234. 3156 K to 302.9146 K, the thermometeris calibrated at the triple points of mercury (234.3156 K) and water (273.16 K),and at the melting point of gallium (302.9146 K). The form of the deviationfunction is the sameas that for the subrange 273.15 K to 692.677 K, i.e.,
∆W5(T 90) - a 5[W(T 90) - 1] + b 5[W(T 90) -1.] (30)
The coefficients a 5 and b 5 are determined from the deviations ∆W(T90) of W(T 90)from the reference values W r (T 90) at the triple point of mercury (234.3156 K) and atthe melting point of gallium (302.9146 K) The reference values W r (T 90) must becalculated from the appropriate reference function [either eq (14) or eq ( 22)b o t h r e f e r e n c e f u n c t i o n s b e i n g r e q u i r e d t o c o v e r t h i s r a n g e .
2.4 ABOVE 1234.93 K (961.78 °C. FREEZING POINT OF SILVER): RADIATION THER MOMETRYRASED ON PLANCK’S LAW OF RADIATION
At temperatures above 1234.93 K, T 90 is defined by the relation:
Lλ (T 90) exp[c 2/ λT90(X)]-1——————————— - —————————————————Lλ [T 90(X)] exp[c 2/ λT90-1
in which L λ(T 90) and L λ[T 90(X)] are the spectral concentrations of the radiance of ablackbody at wavelength (in vacuum) at T 90 and at T 90(X), respectively. T 90(X)refers to either the silver freezing point [T 90(Ag) - 1234.93 K] , the gold freezingpoint (T 90 (Au) - 1337.33 K], or the copper freezing point [T 90 (Cu) -1357.77 K]. The second radiation constant, C 2 (-hc/k), of Planck’s radiationformula has the value C 2 - 0.0143 88 m-K. Although the freezing-point
temperature of silver is the Junction point of platinum resistance thermometry andradiation thermometry, it is believed that the T 90 values of the freezing pointsof silver, gold and copper are sufficiently self-consistent that the use of any oneof them as the reference temperature T 90(X) will not result in any significantdifference in the measured values of T 90 from what would be obtained if only thesilver freezing point were used.
3. REALIZATION OF THE ITS-90
3.1 VAPOR PRESSURE THERMOMETRY AND GAS THERMOMETRY
3.1.1 REALIZATION OF THE ITS-90 BELOW 273.16 K
The calibration of thermometers below the triple point of argon on the ITS -90, asdefined, is relatively complex It is expected that capsule-type SPRT’s, rhodium-iron resistance thermometers (RIRT’s), and other stable encapsulated resistancethermometers will be calibrated in terms of the defined ITS-90 and then used asreference thermometers to maintain the ITS-90 below about 84 K and used tocalibrate other resistance thermometers by the comparison method. The referencethermometers will be calibrated periodically in terms of the defined ITS-90.
By use of the term "realization of the ITS-90," reference is made to obtai ning theequilibrium states as defined by the scale, to having thermometers in thermalequilibrium with those equilibrium states, and to making accurate measurements andinterpretations of the requisite properties of those thermometers in terms of theITS-90.
Considerable effort has been expended to develop and realize the EPT-76, a scalewhich covered the range 0.5 K to 30 K. This scale has been widely dissem inated amonglow temperature scientists. At NIST, the EPT-76 has been maintained on reference-standard RIRT’s for use in calibrating customer thermometers. Upon introduction ofthe ITS-90, NIST converted the EPT-76 on the reference-standard RIRT’s to the ITS-90using the specified differences [83] between T 90 and T 76, This converted scale isbeing used to calibrate other thermometers until such time that NIST realizes theITS-90 in this temperature region directly as defined. It is recommended thatthose laboratories that have thermometers with calibrations on the EPT-76 adjusttheir T 76 values to conform to T 90 values. When NIST realizes the ITS-90 as definedin this range, the difference between the converted scale on the reference-standard RIRT’s (and, where appropriate, on capsule SPRT’s) and the realizedscale will be determined.
3.1.2 VAPOR PRESSURE THERMOMETRY AND THE CVGT RANGE
For most measurements below about 100 K, better precision can be obtained withcapsule-type SPRT’s than with the long-stem type. In the calibration of SPRT’s,however, long-stem type SPRT’s (immersion-type SPRT’s) can be calibrated easily bya direct immersion process down to the triple point of argon (83.8058 K) by moving theSPRT’s from one fixed-point device to another. Unless capsule-type SPRT’s andother capsule-type thermometers are installed inside long stem-like holders,however, they will require re-installation, and re-wiring whenever differentfixed-point apparatuses are used. (In this document, the phrase “capsule-typethermometers” means encapsulated resistance thermometers of small overal ldimensions.) It is desirable, therefore, to be able to calibrate capsule-typeSPRT’s and other capsule-type thermometers at the argon triple point and below (or,if possible, even at the triple point of water and below since calibrations ofSPRT’s require measurements at the triple point of water) in an integrated"multi-task" (multi- fixed-point) apparatus. Such a multi-task appa ratusrequires, in addition to wells for capsule thermometers (in thermal equilibriumin a "single cryostat block"), means for calibration using 3He, 4He, and e-H 2 vaporpressure thermometry, 3He and 4He CVGT’s, and triple points of e-H 2 Ne, O 2, Ar, Hg,and H 2O - A total of 11 chambers is required if all of the overlappingdefinitions of the ITS-90 are to be evaluated and if a "continuous calibration,"without re-installation and re-wiring of the SPRT’s, is desired from 0.65 K to273.16 K. In addition, unless high pressure sealed cells of the reference gasesare used, tubes to each of the chambers, except those for Hg and H 20, are required.
Since 3He and 4He vapor-pressure and CVGT ranges overlap to a large extentchambers for 4He vapor-pressure measurements and for 4He CVGT measurements could beeliminated and the ITS-90 could still be realized. Also, chambers for e-H 2 vapor-pressure and the e-H 2 triple-point realizations could be combined. The number ofchambers could be reduced further if the cryostat block could be allowed to warmto ambient temperature or higher for exchanging certain of the fixed-pointsubstances, or if it were permissible to perform the calibrations of the capsulethermometers at the triple points of argon, mercury, and water in otherapparatuses, using a long-stem type holder. This procedure, however, wouldrequire a longer time for calibration.
The number of chambers can also be reduced if suitable, highly stable capsulethermometers are available for correlating the scales; for this purpose, thecapsule SPRT’s would be calibrated in another, simpler, fixed-point apparatus. Itis expected that such a set of reference-standard resistance thermometers would becalibrated, and that routine calibrations of customer thermometers on the ITS-90would be by comparison with these reference thermometers. The referencethermometers would be checked occasionally against the defined ITS-90. It is hopedthat resistance thermometer devices will be more reproducible than the ability torealize the defined ITS-90. Depending upon the design of the cryostat, the definedITS-90 may lack the desired reproducibility when real ized in a multi-taskapparatus of high complexity. In order to achieve the best real ization of theITS-90, it may be more practical to limit the number of defining fixed pointsin a single cryostat block.
The greatest problem in realization of the fixed points and in calibrations ofcapsule thermometers is ensuring that the multi-task or a "single-task" cry ostatblock is isothermal. Depending upon the design, a thermal gradient can persist. Thepresence 3He, 4He, e-H 2, Ne, 0 2, and/or Ar gases in their respect ivechambers are expected to be beneficial in making the apparatus isothermal, but, thegases may be a source of thermal oscillation. (In designing an apparatus for lowtemperature gases, provisions should be made to avoid thermal oscillationsin the gas.) The vapor pressures of Ne and Ar are high at their respective triple-point temperatures so that thermal equilibrium should be easily attained at theirtriple points.
Guidelines for Realizing the ITS-90 Cont’d

Z-164
Z
For a practical cryostat block, the 3He and 4He CVGT’s must connect thermally the 3Heand 4He vapor-pressure scales and the fixed points of e-H 2 and Ne. Such a cryostatblock will require six chambers (separate 3He and 4He vapor-pressure chambers,separate 3He and 4He CVGT chambers, e-H 2 vapor-pressure and e-H 2 triple- point chamber,and a Ne chamber) to realize the ITS-90 in the most satisfa ctory manner at and belowthe Ne triple point. This arrangement will permit a direct comparison of thedifferent parts of the scale and/or calibration of thermometers. Since thecombination of 4He vapor-pressure thermometry and 4He constant volume gasthermometry are redundant with 3He vapor-pressure thermo metry and 3He constant volumegas thermometry, the 4He systems are not required. Hence, the number of chambersrequired could be reduced to four and the ITS-90 could still be realized. It shouldbe noted, however, that, depending upon the CVGT filling pressure, the dp/dT of a3He CVGT may be less sensitive than 4He vapor-pressure thermometry. Since SPRT’Scan be calibrated only down to the argon triple-point temperature using the long-stem SPRT apparatus, it would be most practical and useful to include an oxygentriple-point chamber in the low -temperature system, thereby increasing the numberof chambers,to five. Also, since it is highly desirable to overlap calibrationsobtained in a long-stem type SPRT apparatus with those obtained in a low-temperature apparatus, an argon triple-point chamber should be included. Thisincreases the number of chambers for the low temperature apparatus to six.
Although it is desirable to have as few tubes as possible going to the cryo statblock in order to minimize temperature gradients in the block, one must build intothe system enough redundant components to be able to check the system for properand accurate operation. For example, although the CVGT is calibrated at only thetriple-point temperatures of neon and hydrogen and at one point in the 3He or 4He vaporpressure range between 3.0 K and 5.,0 K, the system should have the capability forthe measurement of hydrogen vapor pressures at about 17 K and 20.3 K so thattemperatures measured by means of vapor pressures and by the CVGT may b ec o m p a r e d . O f c o u r s e , i f t h e s y s t e m i s o p e r a t i n g p r o p e r l y , t h etemperatures measured by the two techniques should agree. Similarly, there shouldbe the capability to measure the vapor pressures of both 3He and 4He so thattemperatures measured with the CVGT in the range from 3 K to 5 K and by means of3He and 4He vapor pressures may be compared for agreement. Also, it is desirable todesign the CVGT for absolute gas thermometry measurements; the CVGT can check theconsistency of the ITS-90 from about 3 K to 90 K.
3.1.3 REALIZATION OF THE VAPOR PRESSURE AND CVGT SCALES AT TEMPERATURES BELOW THENEON TRIPLE POINT
Since measurement of pressure is common to both vapor pressure and CVGTmeasurements, it will be discussed later in this section (see sec. 3.1.3.5).
In vapor pressure measurements, it is important that cold spots be absent along thegas-pressure transmitting tube. If cold spots are present, the observed vaporpressure will reflect the temperature of the condensation at the cold spot instead ofthat of the bulk bath. A separate vacuum jacket around the tube will maintain acontinuous heat flux to the sample bulb or bath and should free the tube of anycondensation [24]. The vacuum jacket should also reduce the occurrence ofthermal oscillation in the gas-pressure, sensing tube. If the rmal oscillations dooccur, they may be suppressed by either one or a combination of the following:increasing,the volume of the external gas-pressure space at the ambienttemperature, or by inserting a wad of wool or glass fiber or a piece of yarn in thegas-pressure sensing tube. The thermal oscillations may be suppressed alsoby “tuning” a variable volume device [36]. Thermocouples should be placed along thegas-pressure sensing tube in order to determine temperatures along that tube, thedistribution of those temperatures being required to determine the aerostatichead correction.
The vapor pressure may be determined over the bath of bulk liquid 3He, 4He, or e-H 2
with which the thermometer to be calibrated is in thermal equilibrium. Themeasurement can be made also by using a separate, small sample bulb with which thethermometer is in good thermal contact. The latter method is preferred with therather expensive 3He and with e-H 2 which requires a catalyst for theequilibrium ortho-para conversion of the sample [2,58,91].
3.1.3.1 3He Vapor-Pressure Measurements
Because of the relatively high cost of the sample, vapor-pressure measurements aremade with 3He contained in a small volume of about 5 cm . Likewise, the gas -pressure volume to the manometer should be kept relatively small, but large enoughto avoid large thermomolecular pressure effects and thermal oscillations.Thermomolecular-pressure-effect corrections depend on the sensing tube diameter,surface condition of the tube, temperature difference, and pressure [49,71,102].As mentioned above, thermal oscillations can be reduced by varying the gas-pressure volume at the ambient temperature or by introducing a wad of fiber oryarn (cotton, wool, or glass) in the gas-pressure tube.
In the past, 3He contained significant amounts of 4He and the observed vaporpressures of 3He required corrections for its presence. In recent years,however, 3He samples of 99.9995% purity have become available, eliminating therequirement for such corrections. At 0.65 K, the vapor pressure and thetemperature derivative of the vapor pressure are 115.9 Pa and 1.08 Pa/mK,respectively. At the upper limit of 3.2 K, the vapor pressure and the temperature derivative of the vapor pressure are 101,662.1 Pa and 106.83 Pa/mK,respectively. The required pressure resolution that corresponds to 0.1 mK ofvapor-pressure measurements varies from 0.108 Pa at 0.65 K to 10.7 Pa at 3.2 K.
Since the amount of 3He in the cryostat is small, and since the amount of 4He usedin cool ing is relat ively large, every effort should be made to avoidcontamination of the sample of 3He by the 4He through diffusion, particularlythrough any glass parts of the apparatus.
The sample bulb should contain enough 3He that the liquid surface temperature andthe cryostat block temperature can be correlated with the observed vapor pressure.The temperature of the cryostat block must be checked for consistency with theobserved dp/dT of the vapor pressure at the temperature of measurement.
Aerostatic-head corrections depend upon the density of the gas in the pressure-transmitting gas tube. Thermocouples must be distributed along the tube in order tomeasure the temperatures required for calculation of these corrections.
3.1.3.2 4He Vapor-Pressure Measurements
Since liquid 4He can be obtained easily, the vapor pressure can be determinedabove a bath of the liquid in which an apparatus containing the thermometer is immersed. or a technique using a smal l bulb of 4He sample, wi th thethermometer in good thermal contact, can be employed. The lower end of the gas-pressure tube should have a small orifice in order to reduce superfluid 4He filmflow at temperatures below 2.1768 K [61,91]. The 4He sample bulb must be inthermal equilibrium with the cryostat block. The cryostat block temperatureshould be checked for consistency with the observed dp/,dT of the va por pressureat the temperature of measurement.
At the lower temperature limit of 1.25 K, the vapor pressure of 4He is 114.7 Paand the temperature derivative of the vapor pressure is 0.76 Pa/.K. At theupper limit of 5 K, the vapor pressure and, the temperature derivative of thevapor pressure of 4He are 1946.29.7 Pa and 146.53 Pa/mK, respectively. Therequired pressure resolutions of the vapor pressure that corresponds to 0.1 mKare 0.076 Pa at 1.25 K and 14.7 Pa at 5.0 K [37,38].
3.1.3.3 e-H 2. Vapor Pressure Measurements
The equilibrium composition of the two molecular states of hydrogen (ortho andpara) is temperature dependent. The room temperature composition, about 75% orthoand 25% -para, is referred to as normal hydrogen (n-H 2). On liquefaction, thecomposition slowly changes toward the equilibrium composition corresponding toits temperature. ~ In the process, the heat of transition is released, resultingin the evaporation of some hydrogen. A catalyst, such as activated ferrichydroxide, hastens the equilibration. The catalyst must be placed in the samplechamber in order to ensure that the hydrogen has the appropriate equilibrium composition. Most of the conversion must be made before collectingthe liquid in the sample chamber since the heat of conversion (1664 J/mol) fromthe ortho to the -para,molecular state is larger than the heat of vaporization(900 J/mol) of normal hydrogen. The normal boiling point of e-H 2 (equilibriumcomposition: 0.21% ortho and 99.79% -para) is about 0.12 K lower than that ofn-H 2. The temperatures near 17.035 K and 20.27 K are determined from vapor-pressure measurements near 33,,321.3 Pa and 101,292 Pa, respectively [2,31,58].
3.1.3.4 Constant Volume Gas Thermometry
Some of the following precautions and corrections that are applicable to absoluteconstant-volume gas thermometry should be included in the calibration of the CVGTat the three specified temperatures of calibration:
1. The volume of the gas bulb should be sufficiently large relative to the gas-pressure-line volume to minimize the error in correcting for the "dead space."On the other hand, the diameter of the gas-pressure line should not be so smallas to cause large thermomolecular pressure corrections.
2. The temperature coefficient of volume expansion and the pressure expansion ofthe gas bulb should be known accurately. (It is desirable to check the calibration by using the,CVGT ih the absolute mode.)
Material T90 Pressure Effect of Fixed Point
K Pa - 1 mK/(meter of liquid)x108*
e-H2 TP 13.8033 34 0.25Ne TP 24.5561 16 1.9O2 TP 54.3584 12 1.5Ar TP 83.8058 25 3.3Hg TP 234.3156 5.4 7.1H2O TP 273.16 -7.5 -0.73Ga HP 302.9146 -2.0 -1.2In FP 429.7485 4.9 3.3Sn FP 505.078 3.3 2.2Zn FP 692.677 4.3 2.7Al FP 933.473 7.0 1.6Ag FP 1234.93 6.0 5.4Au FP 1337.33 6.1 10.Cu FP 1357.77 3.3 2.6
*Equivalent to millikelvins per standard atmosphere.
3. In order to be able to calculate the aerostatic head correction, thetemperature distribution along the connecting gas-presure transmitting tube(capillary) must be known. That temperature distribution may be determined by placing thermocouples along the tube.
4. The gas-bulb filling pressure should be sufficiently high to give anadequate dp/dT for measurement, but not so high as to require large correctionsfor non-ideality of the gas.
5. Higher pressures reduce the thermomolecular pressure gradients in the connecting gas-pressure tube.
6. The effect of adsorption can be reduced by designing the gas bulb so thatthe volume is large relative to the surface and by polishing the inside surfaceof the bulb.
For opt imiz ing the CVGT design, the ideal gas law may be appl ied.Differentiating the ideal gas relation,
Table 6. The effect of pressure on the temperatures of the defining fixed points.The reference pressure for the equil ibr ium states of freezing and melting points is one standard atmosphere (101,325 Pa). Triple points have thevapor pressure of the material when the solid, liquid and vapor phases are presentin equilibrium.

Z-165
Guidelines for Realizing the ITS-90 Cont’d
pV = nRT, (32)
yields
dp/dT R n/ V, (33)
where p is the pressure of n moles of gas contained in a volume of V m 3.
Equation (33) shows that the d p/d T sensitivity of the CVGT is directly related tothe gas density n/V . Expressing the gas constant R as 8.31441 Nm/mol • K or8.31441 Nm 3/(M 2•mol•K), the sensitivity d p/d T can be expressed in the units Pa/K.Thus,
dp/d T = 8.31441( n/V ) Pa/K, (34)
where n/V is given in mol/m 3. If a gas bulb of 1000 cm 3 is filled to fouratmospheres at 273.16 K, n/V would be approximately 178 mol/m 3, and dp/dTbecomes 1484 Pa/K. Since the resolution of many high quality mercury-manometersystems is about 0.03 Pa to 0.2 Pa, the temperature resolution is about 0.03 mKto 0.1 mK. It is to be noted that since
p/T = Rn/ V, (35)
the sensitivity d p/d T is “constant,: independent of the gas bulb volume, as longas the gas density at the filling temperature is constant. Hence, the gas-bulbvolume and the gas filling pressure should be chosen so that errors from theeffect of dead space, gas non-ideality effects and other effects are negligiblysmall. See references [6,13,49,60].
3.1.3.5 Pressure Measurements
Efforts have been made to minimize the requirement of highly precise andaccurate pressure measurements in the realization of the defining fixed pointsof the ITS-90 . The fixed points involving freezing and melting requireknowledge of the pressure only within the significance of the relative ly smallpressure effect ( cf. table 6). Accurate pressure measurements are required,however, to realize the vapor-pressure-temperature scales of 3He and 4He in therange 0.65 K to 5.0 K, and to realize the vapor-pressure-temperature scale of e-H2 close to 17.035 K and 20.27 K. To realize the CVGT scale using 3He or 4He gasin the range 3.0 K to the triple point of neon (24.5561 K), only accuratepressure-ratio measurements are required.
3.1.3.5.1 Mercury Manometry
Mercury manometry requires precise determination of the difference in height ofthe two mercury surfaces in a U-tube manometer. Traditionally, cathetometers havebeen used with a smallest imprecision of ab t 2 Pa. In recent years , the levelshave been sensed, in conjunction with length standards, by capacitive andinterferome tric. methods . The resolution of such mercury manometry systems isabout 0.05 Pa [19,50, 5 2,81] . (Note : the NIST manometry resolution has beenreported [50] to be about 0.0013 Pa.) For accurate pressure measurements, it isnecessary to know the density of mercury (which is pressure and temperaturedependent), the capillary depression at the mercury meniscus, the vapor pressureof mercury, the aerostatic head difference of the pressure transmitting gas orgases, and the local acceleration due to gravity. At one standard atmosphere,uncertainties as of absolute pressure measurements of about 3 ppm and pressureratios of about 1 ppm have been reported. See references [19,50,52,81].
3.1.3.5.2 Oil Manometry
The techniques and the requirements of oil manometry are similar to those ofmercury manometry.
3.1.3.5.3 Piston Gauges (Pressure Balances)
The pressure balanced by a dead-weight piston gauge is obtained from the mass ofthe piston and the applied weights, and the effective area of the freely rotatingpiston inside a closely-fitting cylinder. For determination of the absolutepressure, the gauge must be enclosed and evacuated by a high capacity pumpingsystem to minimize the back pressure from the gas leaking between the piston andthe cylinder [13,60,81,96]. The local acceleration due to gravity must be knownaccurately. Corrections must be applied for the effect of the streaming gas andfor any back pressure. It is advisable to check the readings of the piston gaugeagainst a primary mercury manometer. Also, the variation of the effective areawith pressure must be determined with a mercury manometer. The aerostatic head ofthe manometry system will change as gas leaks between the piston and the cylindercausing the piston to sink deeper into the cylinder. The position of the pistonmay be maintained by automatically pumping more gas into the system. Aresolution of 1 ppm [13] and an certainty of about 15 ppm have been reported inthe pressure range 2 kPa to 200 kPa [63,81].
3.1.3.5.4 D iaphragm Pressure Detector
The diaphragm pressure detector consists of a thin metal disk clamped undertension between two flat electrodes which form two capacitors, with the diskcommon to both capacitors. Any pressure differential across the metal diskcauses the disk to deflect , increasing the capacitance on one side whiledecreasing the capacitance on the other side. This change is detected bycapacitance bridge techniques. Instruments for absolute pressure measurements areavai lable; however, they require periodic recal ibrat ions to achieveuncertainties of 1 to 5 parts in 10 4 of the readings.
The diaphragm pressure detector is used in high precision manometry as pressurebalance detectors, i.e. , with the pressures equal on both sides of thediaphragm. The diaphragm pressure balance detector separates the gas of theapparatus (vapor pressure apparatus or GVGT) from the counter-balancing gas ofwhich the pressure is determined.
The resolution of diaphragm gauges has been reported [13] to be about 0.002 Pa.Instability due to different pressures, hysteresis temperature effects,andother causes may decrease the resolution ion to 0.02 Pa in actual pressuremeasurements [13].
3.1.3.5.5 Thermolecular Pressure Difference
Thermolecular pressure differences occur at low gas pressures in tubes withtemperature gradients when the tube diameter is not much larger than the meanfree path of the gas. The pressure difference depends upon the gas, thetemperature of the gas, the diameter of the tube, the tube material, and thesurface condit ion of the tube. The best procedure is either to use asufficiently large tube to minimize the thermomolecular pressure difference orto experimentally determine the difference by comparing the pressures between thesmall diameter tube being used in the cryostat and a large diameter tube[49,71,102]
3.2 REALIZATION OF THE FIXED POINTS OF THE ITS-90
3.2.1 EFFECT OF IMPURITIES
Except for the vapor-pressure-temperature points of helium and equilibriumhydrogen, the fixed points of the ITS-90 are freezing points. melting points,or triple points. The vapor-pressure measurements with 3He, 4He, and e-Hz must be performed with sufficiently pure samples to minimize the effect ofimpurities. The principal components of air impurity would be frozen. Neon inhydrogen, however, causes positive deviations from ideal behavior [93,97). In thevapor pressure measurements of 4He, it is very likely that the He will bepure but 3He may contain some 4He. For such a circumstance, Roberts, Sherman andSydoriak described a procedure for correcting for the presence of 4He in 3He[90].
The temperatures of freezing points (liquid-solid or liquid-solid-vaporequilibrium points) of substances are usually lowered by the presence of animpurity. This sometimes, however, is not the case when that impurity issoluble in both the liquid and the solid phases of the major component. If agiven impurity is known to be present or is suspected, one must consult the literature on the heterogeneous phase data of metal and non-metal systems toestimate the possible effect of that impurity on the freezing point [39,51,88].(Note: often in the analysis of the effect of impurities on freezing points,the impurity is assumed to be nonvolatile.)
Assuming that the ideal solution law holds and that the impurities remain inliquid solution, with no concentration gradients, then as the major componentslowly freezes, the depression in the freezing point, relative to the freezingpoint of the 100% pure material, is directly proportional to the overallimpurity concentration divided by the "first cryoscopic constant." This is expressed as:
T(pure) - T(obs) = x 2/A. (36)
In eq (36), T(obs) is the observed freezing point of the particular sample beinginvestigated, T(pure) is the freezing point of the 100% pure material, x 2 is the
mole fraction impurity concentration, and A is the first cryoscopic constant.A is given by the relation:
A = L/R[ T(pure)] 2, (37)
where L is the molar heat of fusion and R is the molar gas constant. (Note:eq (36) is an approximation. A more complete expression includes secondarycryoscopic constants. The term "first cryoscopic constant" is used here fordistinction. Also, in some cases, the term "cryoscopic constant" refers to thereciprocal of eq (37) and in other cases, to the effect of impurities per literor kilogram of solvent.) The first cryoscopic constants of metals are relativelysmaller than those of molecular substances and of the "cryogenic" gases ( 3He,4He, e-H 2, Ne, O 2, and Ar). Referring to eq (36), zinc, which has a firstcryoscopic constant of 0.0018/K, requires an overal l impurityconcentration of approximately 2 parts in 10 7 for the temperature of the half-frozen sample to be depressed by 0.0001 K, relative to the liquidus point. Onthe other hand, argon, with a first cryoscopic constant of 0.0203/K, requiresan impurity concentration close to 2 parts in 106 for the same temperaturedepression. Table 7 lists the heats of fusion and the first cryoscopic constants of substances specified for the defining fixed points. It is theusual practice at NIST to calibrate SPRT’s during the first 50% of the freeze.
3.2.2 TRIPLE POINTS OF e- H2, Ne, O 2. AND Ar
3.2.2.1 GENERAL CONSIDERATION OF APPARATUS DESIGN
The cryogenic fixed points (triple-points of pure gases equilibrium hydrogen,natural neon, oxygen, and argon) are best real ed in a calorimetric typeapparatus designed for calibrating capsule-type thermometer (SPRT’s, RIRT’s,germanium resistance thermometers (GRT’s), and others)[1, 2, 17, 18,20, 21,41,47, 58, 59, 78, 79, 80] . During calibration of the thermometers,
Substance Fixed Point Latent Heat First Cryoscopic ConstantTemperature of Fusion
T/K kJ/mole K -1
e-H 2 13.8033 0.117 0.0739Ne 24.5561 0.335 0.0668O2 54.3584 0.444 0.0181Ar 83.8058 1.188 0.0203Hg 234.3156 2.292 0.00502H2O 273.16 6.008 0.00968Ga 302.9146 5.585 0.00732In 429.7485 3.264 0.00213Sn 505.078 6.987 0.00329Zn 692.677 7.385 0.00185Al 933.473 10.79 0.00149Ag 1234.93 11.30 0.000891Au 1337.33 12.364 0.000831Cu 1357.77 13.14 0.000857
Table 7. Latent heats of fusion and first cryoscopic constants of definingfixed-point materials

Z-166
Z
Figure 4. A schematic drawing of the NIST argon triple-point apparatus for calibrating sevenlong-stem SPRT’s and six capsule SPRT’s. Six long-stem SPRT wells surround a central SPRT well,which is large enough to accommodate a holder for calibrating a capsule SPRT. At the bottom of thesample cell, six capsule SPRT wells are circularly arranged between the long-stem SPRT wells.
LIQUID NITROGEN
67 cm
56 cm
SUPER INSULATEDDEWAR
VACUUM CAN
CAPSULE SPRTWELLS (6)
BAFFLES
SAMPLE CELL
SAMPLE CELL SHIELD
PASSIVE SHIELD
TEMPERATURECONTROLLED SHIELD
HE GAS MANIFOLDTO SPRT WELLS
LONG STEM SPRTWELLS (7)
PORT FOR FILLINGLIQUID NITROGEN
TO HIGH VACUUMAND ELECTRICALLEAD TERMINALS
TO SAMPLERESERVOIR

Z-167
Guidelines for Realizing the ITS-90 Cont’d
Figure 5. A sealed cell suitable for containing cryogenic gases at high pressures. This cell of20 cm 3 volume was filled to 100 atmospheres with pure oxygen and used to realize the triple pointof oxygen. Another cell of the same outer dimensions, but of 16 cm 3 volume and with wells forthree capsule SPRT’s, was filled to 163 atmospheres with oxygen and also used to realize thetriple point of oxygen [47].
COPPERCAPILLARY
AUXILIARY ISOTHERMALSHELL, HELD WITH NUT
CELL HEATER
COPPER TEMPERINGSTRIPS
SAMPLE CELL
COPPER TUBES
HELICALLY GROOVEDCOPPER SLEEVE
PLATINUMRESISTANCETHERMOMETER
THERMOCOUPLECLIPS25.4
mm
94mm

Z-168
Z
the calorimeter system thermally isolates the vessel containing the pure gassample and the thermometers. The capsule thermometers should be installed inclose-fitting wells of the sample vessel, using stopcock grease to enhance thethermal contact. The wells should be vented for easy installation andsubsequent removal of the thermometers since such thermometers are sensitive toshock. The wells can be vented by designing the well tubes to extend completelythrough the sample cell or by machining a small groove along the length of thewell wall. The number of wells in.the vessel is limited only by the practicalsize of the vessel and of the calorimeter system. On the other hand, for largevessels, larger temperature gradients should be expected. The leads to thethermometers should be tempered on the sample vessel. (Note: the term "temper"refers to a process whereby sections of the leads or of the protective sheaths oflong-stem SPRT’s are placed in "steady-state thermal equilibrium" withselected parts of the apparatus.)
Since the triple point of argon is about 6 K above the normal boiling point ( NBP)of ni trogen and since l iquid ni trogen is readi ly avai lable in largequantities, long-stem type SPRT’s can be calibrated at the argon triple point inan apparatus cooled by liquid nitrogen. The apparatus should be designed tocool the upper part of the protective sheath of the long-stem SPRT’s to liquidnitrogen temperatures, and then to heat the intermediate section of the sheathabove the sensing element to the argon triple point so that the sensing coil willbe in thermal equilibrium with the argon at its triple point [42]. See figure 4for a schematic of such an apparatus presently in use at the NIST.
Sample vessels for the cryogenic fixed points could be ruggedly constructed forhigh pressures and sealed with a suitable amount of the pure gas [41,79]. These"sealed-sample vessels can be easily installed and removed from the calorimeter forreplacement of thermometers and also to be transported to other laboratories forcomparison (see fig.5).The amount of gas that can be sealed in suchvessels however,is rather limited and, hence,the calorimetric system must beoperated with sufficient adiabatic control that the small amount of heat offusion of the sample is adequate to realize the triple point and then calibratethe thermometers. Also, since the amount of sample gas is small, extra care must be taken to clean the vessel thoroughly before filling. The recommendedprocedure is to bake the vessel at high vacuum and then purge many times with thesample gas before finally filling and sealing the cell [41,47,79].
The vessel for a cryogenic fixed point can be installed in the calorimeter andconnected by a small diameter tube to a source of pure gas 1,2,31,32,44,58,59.In this design, enough condensed liquid could be used to nearly fill the vesseland thus, to provide an abundant supply of heat of fusion for calibration ofthermometers. The tube from the vessel must be connected to an "externalexpansion volume" of appropriate size so that when the system is at ambienttemperature the pressure is not excessive. The vessel could also be connected toan external rugged container into which all or nearly all of the sample can betransferred by cooling, and then contained bye high-pressure valve. Since underthese condit ions the "sample vessel" would not be subjected to highpressures, it can be constructed of thin copper parts. With appropriate gashandling and cleaning provisions, the same vessel could be used with all of thereference gases, stored in separate external rugged containers, and thethermometers calibrated at the fixed points of the gases without the necessity ofhaving to remove the thermometers from the vessel between fixed-point can have separate chambers for each of the gases. In the latter design,separate tubes for the gases must enter the calorimeter system. Although each ofthe chambers of a "multi-chamber sample vessel" would be relatively small, theamount of sample that could be condensed inside each chamber would still be morethan that which is normally used with the high pressure "sealed-sample vessel"Similar to the procedure used in filling sealed-sample vessels, a thoroughbaking, pumping, and purging procedure before filling should be followed withpermanently installed vessels.
3.2.2.2 REALIZATIONS OF THE TRIPLE POINTS AND THEIR APPLICATION TO CALIBRATION
The procedure for realizing a triple point of the cryogenic gases is to firstcompletely freeze the sample. If the triple point is being realized for the firsttime with the apparatus, the sample should be cooled sufficiently below thetriple point to determine the heat capacity of the system (sample, vessel, andthermometers) from about 5 K to 20 K below (depending on the gas) to about 20 Kabove the triple point, and to determine the heat of fusion of the sample duringthe same series of measurements [41,47]. (Note: check thermometers must becalibrated along with the test thermometers. The measurements on the checkthermometers will serve to guide the heating process during the calibration, aswell as to provide measurement statistics.)
After cooling to the required low temperature the vessel should be thermallyisolated by placing it under continuous adiabatic control. Then the followingseries of measurements should be performed:
1. the equilibrium temperature should be observed with the checkthermometer,
2. a measured amount of electrical energy should be added to thesystem.
3. a new equilibrium temperature should be established and measured4. steps 2 and 3 should be repeated until three heat capacity points
are obtained below the triple point.5. then,the sample should be completely melted by introducing a
measured amount of heat,6. next, the equilibrium temperature just above the triple point should
be measured7. then, three additional heat capacity points should be obtained above
the triple point in accordance with steps 2 and 3.
From the knowledge of the eight equilibrium temperatures (four below the triplepoint and four above the triple point) and the measured amounts of electricalenergies added, the heat capacities of the system below and above the triplepoint, and the heat of fusion, are calculated. If Q joules are added to thesystem from an initial equilibrium temperature Ti just below the triple point toheat the system to a final equilibrium temperature Tf Just above the triplepoint, the heat of fusion L is:
L=Q - C S( TO - T1) - C ,( Tf - TO), (38)
where C s and C t are the mean heat capacities in the temperature intervals in thesolid and liquid phases, respectively, and To is the triple-point temperature.
For calibration of SPRT’s, the sample should be completely frozen for the secondtime and the temperature set at about 1 K below the triple point, the samplethermally isolated, and the equilibrium temperature measured. From the knowledge of the previously determined heat capacity of the system below thetriple point and of the heat of fusion, add enough electrical energy to meltabout 10% of the sample. If T 1 is the initial equilibrium temperature just belowthe triple point, the required amount of electrical energy Q, to melt 10% of the sample is:
Q1= 0.1L. + C 8( T0 - T1). (39)
Once the system comes to equilibrium, measure the resistances of all of thethermometers. Repeat the measurements at 20%, 40%, 60%, 70%, and 80% melted. Ifthe sample is about 99.9999% pure, all measurements on each thermometerthroughout this melted range should agree to within 0.1 mK to 0.2 mK.
In using a temperature fixed point, one must make corrections for the hydrostatic head of the liquid and for the gas pressure on the defined equilibrium state. Table 6 gives the dT/dp for the defining fixed points of theITS-90, both in terms of the external gas pressure to which the fixed-pointmaterial is exposed and in terms of the column of liquid.
3.2.2.2.1 TRIPLE POINT OF EQUILIBRIUM HYDROGEN, 13,8033 K (-259.3467 °C)
Hydrogen gas samples of 99.9999% and higher purity are readily available. [Thef i rst cryoscopic constant of hydrogen is re lat ively high (0.040/K).Consequently, the liquidus point of an ideal hydrogen solution of 99.9999% puritywould be approximately 0.01 mK lower than that of 100% pure hydrogen. Except forhelium and deuterium, all other impurities would be either frozen or in solutionin very small amounts.] The commonly used catalyst for converting ortho hydrogento para hydrogen is hydrated ferr ic oxide (Fe 2O3+H2O or FeO+OH)Other oxides of magnetic elements, either pure or mixed-metal, such as those ofchromium, nickel, cobalt, and neodymium, also have been used as catalysts forortho to para hydrogen conversion. The hydrated ferric oxide catalyst is prepared by mixing at about 30°C relatively dilute solutions (about 2 molal) of ferric chloride and sodium hydroxide, with only a slight excess of sodiumhydroxide, washing the resulting gelatinous Fe(OH) 3 precipitate thoroughly with
distilled water, air drying at 140°C for 24 hours, vacuum baking at 110°C for 16to 20 hours, and back-filling with hydrogen while the catalyst is still hot[7,104). The catalyst is activated by flowing hydrogen through it for about 4hours while the catalyst is maintained at a temperature of about 150°C. The sample vessel and ancillary components should be designed to permit the whole of the hydrogen sample to come into contact with the catalyst at the equilibriumtemperature. See references [2,31,58].
3.2.2.2.2 TRIPLE POINT OF NATURAL NEON. 24,5561 K (-248,5939,˚C)
Neon gas samples of 99.999% purity are commercially available. Samples of higherpuri ty may be obtained by special arrangement with the suppl ier. The
Figure 6. Two types of triple point of water cells with wells for platinumresistance thermometers. The cel ls contain pure air-free water. Thethermometer wells are made of precision-bore tubing.
Type A Type B
yyyyyyyyyyyyyyyyyyyyyyyyyyyyyyyyyyyyyyyyyyyyyyyyyy
yyyyyyyyyyyyyyyyyyyyyyyyyyyyyyyyyyyyyyyyyyyyyyyyyyyyyyyyyyyyyyyyyyyyyyyyyyy

Z-169
principal impurities are CO, H 2, He, and N 2. The CO and the N 2 impurities can befrozen out by slowly flowing the sample through a coiled tube immersed in liquidneon; the H 2 and the He impurities can be removed by freezing the neon sample inliquid hydrogen and pumping, with care so that the lighter iso topes of neon are notpreferentially removed. [The first cryoscopic constant of neon is 0.0668/K.Consequently, the liquidus point of an ideal neon solution of 99.999% purity wouldbe approximately 0.1 mK lower than that of 100% pure neon.] The purified sampleshould be collected in a clean stainless-steel cylinder by cooling the cylinderin liquid hydrogen (or cooled with liquid helium). If desired, the purifiedsample can be collected directly in the cooled sample vessel. See references[1,79].
3.2.2.2.3 TRIPLE POINT OF OXYGEN. 54 .3584 K (-218,7916 ˚ C)
Oxygen gas samples of 99.999% purity are commercially available. Accuratechemical analysis of oxygen is difficult and, therefore, the claimed purity may notbe correct. Unknown or undetected impurities are chemically less reactive thanoxygen, e.g, the noble gases, and, in particular, argon, which forms a peritecticwith oxygen. Samples of purity greater than 99.999% may be obtained by specialarrangement with the supplier. [The first cryoscopic constant of oxygen is0.0181/K. Consequently, the liquidus point of an ideal oxygen solution of99.999% purity would be approximately 0.6 mK lower than that of 100% pure oxygen.]Careful preparation by thermal decomposition of potassium permanganate canyield samples of 99.99992% purity or better [47]. The oxygen sample should bestored in clean stainless-steel cylinders. See references [32,47,59,79,80].
3.2.2.2.4 TRIPLE POINT OF ARGON. 83,8058 K (-189.3442 ˚ C)
Argon gas samples of 99.9999% purity or better are readily available. The usualimpurities are the components of air, moisture, and hydrocarbons. [The firstcryoscopic constant of argon is 0.0203/K. Consequently, the liquidus point of anideal argon solution of 99.9999% purity would be approximately 0.05 mK lower thanthat of 100% pure argon.] To fill the sample vessel, the gas may be used directly orit may be dried first by slowly passing it through a coiled tube immersed ineither liquid oxygen or a Dry Ice/ethyl alcohol mixture. See references[17,41,42,59,79,80].
3.2.3 TRIPLE POINT OF WATER. 273.16.K (0.01 ˚ C)
The triple-point temperature of water is assigned the value 273.16 K on theKelvin Thermodynamic Temperature Scale and also on the ITS-90. It is thereference temperature for resistance ratios in platinum resistance thermometry.The water used in preparing triple point of water cells is pure water ofnaturally-occurring isotopic composition. Figure 6 shows two commonly usedtypes of triple point of water cells.
Triple point of water cells are usually prepared from river water that has beenpurified by chemical treatment and distillation. River water is expected to haveconcentrations of deuterium and the heavier isotopes of oxygen that are lowerthan that of ocean water. The extreme difference in the triple points ofnatu rally occurring water, including polar water, is given as 0.25 mK [100].
It is expected that differences among water triple-point cells of river waterwould be much smaller than 0.25 mK. (The isotopic composition differencebetween river water and ocean water [100] has been estimated to cause no morethan a 0.050 mK difference in the triple-point temperature.) While the basicmaterial is plentifully available, preparation of water triple-point cellsrequires a special effort [5,40]. Although the effect on the triple-pointtemperature is negligible, a trace of air always remains in most sealed triplepoint of water cells. When a cell at room temperature is gently inverted from oneend to the other and a sharp "click" is produced through the water hammer action,the amount of gas in the cell wi11 have negligible influence on the triple-pointtemperature.
3.2.3.1 REALIZATION AND APPLICATION OF THE TRIPLE POINT OF WATER
In preparation for producing an ice mantle that is required for realizing thetriple-point temperature of water, the thermometer well of the cell is wipedthoroughly dry, sealed with a rubber stopper, and the cell placed in an ice bath tocool to a few degrees above the ice point. When the cell has been cooled in thismanner, an ice mantle of fairly uniform thickness can be obtained. Withdrawthe cell from the ice bath, set it upright on a stand, and place one drop ofethyl alcohol at the bottom of the well. Introduce small amounts of crushed DryIce into the bottom of the well and continue to do so until a thick mantle is formedat the bottom. Then, fill the well with crushed Dry Ice to the water level of thecell. Continue to add crushed Dry Ice to the well so as to maintain the level ofDry Ice at the water level. If the Dry Ice level becomes low before more is added,the ice mantle may crack. If the cell were pre cooled as indicated above, a solidice bridge may form at the water level. If such a bridge forms, melt it immediatelywith heat from the hands while gently sha king the cell. The solid ice bridge cancompletely seal the cell at the top and any subsequent formation of ice couldproduce enough pressure to rupture the glass ce l l . When a mant le o fapproximately the desired thickness (4 to 8 mm) is formed, stop adding Dry Ice,replace the cell in the ice bath with the well opening slightly above the watersurface of the ice bath, and leave the cell there until all of the Dry Iceevaporates. Then, fill the well with ice water and store the cell in an ice bathor ice pack for a day before using it. When the ice mantle is frozen by using DryIce, a process that usually requires less than one hour, the strains in the icecause the "triple-point temperature" to be about 0.2 mK low. These are removed byletting the mantle anneal for one day.
Other methods can be used also to prepare the ice mantle. With ethyl alcohol inthe thermometer well, any "cold finger" technique can be used. This tec hniqueincludes successively insert ing l iquid nitrogen cooled rods, using aclosed-end tube containing crushed Dry Ice, or using a heat-pipe cooler. Thesemethods require more time to freeze the mantle,,but the strain produced in the icewill be less than those produced by the Dry Ice technique.
After the strains in the ice mantle have been relieved by storing the cell in anice bath for at least one day, insert momentarily a glass rod into the well inorder to melt a thin layer of ice next to the well. This forms an ice-w aterinterface immediately adjacent to the thermometer well. The test for this "innermelt" is made by giving the cell a rotatory impulse to determine whether
Figure 7. An SPRT in a Type A triple point of water cell immersed in an ice bath.
A - platinum resistance thermometer, B - heavy black felt to shield againstambient radiation, C - polyethylene tube for guiding the SPRT into thethermometer well (the tube has a small hole near the top of the thermometer well toallow water, but not ice, to enter the tube.), D - water vapor, E -borosilicate glass cell, F - water from the ice bath, G - thermometer well(precision bore glass), H – ice mantle I - air-free water, J - aluminumbushing with internal taper,at the upper end to guide the SPRT into its closefitting inner bore, K – polyurethane sponge for cushioning the SPRT, L –finely divided ice and water.
the ice mantle rotates freely about the axis of the thermometer well. The outer icewater in ter face guards and thermal ly s tabi l izes the inner ice-waterinterface temperature that is measured with the SPRT.
Figure 7 shows a triple point of water cell immersed in an ice bath with an SPRTinserted into the thermometer well. An SPRT should be precooled in a glass tube ofwater in an ice bath before it is inserted into the triple-point well so that thethickness of the water layer next to the thermometer well will not becomeexcessive. Also, the time required for the SPRT to come into thermalequilibrium will be shortened. Heavy felt cloth should be used to cover the ice bathin order to prevent ambient radiation from entering the bath and reaching thethermometer element, which otherwise would cause the thermometer to give aslightly high (erroneous) reading. A plastic foam cushion should be placed at thebottom of the thermometer well to protect the well and the SPRT. Since water is apoor thermal conductor, a close fitting aluminum sleeve should be used to enhancethe thermal conduction.
The thermometer current should be imposed immediately after insertion of the SPRTinto the cell so that readings can be made under conditions of steady-state selfheating. Five to ten minutes or longer may be required before steady-stateconditions are reached. To avoid errors due to variations in the self heatingthat arise from variations in the thermal contact of the ther mometer withits surroundings, it is best to read the SPRT at two cu rrents and extrapolate thereadings to zero power in the SPRT.
3.2.4 FREEZING. MELTING. OR TRIPLE POINTS OF METALS: Hg Ga. In. Sn. Zn. Al. AgAu. or Cu
The realization of metal fixed points requires the continuous presence ofliquid-solid or liquid-solid-vapor phases in thermal equilibrium. With SPRT’s, theliquid-solid interface, i.e., the equilibrium whose temperature is meas ured, mustsurround and must be as close to the temperature sensing element as possible.Since the first cryoscopic constants of metals are relatively low, the fixed-pointmetal samples should be at least 99.9999% pure. Figure 8 shows idealizedliquid/solid equilibrium conditions inside fixed point cells used in freezing andmelting experiments. Figure 9 shows a representative arrang ement of an SPRT insertedinside a metal fixed point cell. Ideally, and similar to the water triple-pointcell, an outer liquid-solid interface, which completely surrounds the innerinterface, exists close to the container wall. This outer interface, which has atemperature very close to that of the inner interface, thermally protects andthermally stabilizes the inner interface. In freezing experiments, a layer ofsolid is first formed at the crucible wall, then a thin layer of solid is inducedon the thermometer well by inserting cooling rods. As freezing advances, the outerinterface approaches the inner interface until all of the material is solid. Inmelting experiments, a layer of liquid is first formed next to the crucible, thena thin layer of liquid is formed next to the thermometer well by inserting awarming rod or a long heater. As mel ting advances, the outer liquid/solidinterface approaches the inner interface.
Since different furnace or bath designs are required for fixed-point cellsoperated at different temperatures, they will1 be discussed along with each ofthe f ixed points , or references wi l l be made to appropr ia te sources of
yy
yyyyyyyyyyyyyyyyyyyyyyyyyyyyyyyyyyyyyyyy
A
B
C
D
E
F
G
H
I
J
K
L
yyyyyyyyyyyyyyyyyyyyyyyyyyyyyyyyyyyy
Guidelines for Realizing the ITS-90 Cont’d

Z-170
Z
descriptions.
In radiation thermometry, the liquid-solid phase of the metal fixed point mustcompletely surround the blackbody radiator capacity
3.2.4.1 CONTAINER MATERIAL
Containers for the fixed-point metals must not contaminate the metal sample, and thecontainer material must be rugged enough to retain its integrity under thermalcycling between the temperature of use and ambient temperature. The containermaterial preferably should be inert to air at temperatures of use;if not, e.g.,graphite above about 200 °C, the container plus the fixed-point material must beprotectively enclosed in an inert gas such as nitrogen, argon, or helium, usingeither a borosilicate or fused silica glass envelope. It should be assumed thatthe fixed-point material itself will react chemically with air and, thus, thematerial must be protected.*
3.2.4.2 METAL FIXED POINT DEVICES FOR CALIBRATING SPRT’s
Figure 9 shows a representative fixed-point cell that can be used forcali brating long-stem type SPRT’s. In the following sections, individual typeswill be described.
3.2.4.2.1 MERCURY TRIPLE POINT
3.2.4.2.1.1 MERCURY SAMPLE
On the ITS-90, the triple point of mercury (equilibrium phase state of mercurysolid, liquid, and vapor phases) is assigned the value 234.3156 K (-38.8344°C).Depending upon the choice of container material and operating procedure, it may bemore practical to real ize the mercury freezing point at one standardatmosphere, the value being 234.3210 K (-38.8290 °C). Mercury samples withimpurity content of 1 part in 10 8 or less can be prepared by potassium hydroxide andnitric acid washings, followed by triple distillation [48]. The alkali and acidwashings can be carried out by vigorously bubbling clean filtered air, throughthe mixture of mercury and the alkali or the acid. To remove any remainingoxidizable impurities, the first two distillations should be carried out underreduced pressures with a fine stream of clean filtered air bubbling into themercury in the distillation container. The third distillation should be doneunder high vacuum to remove the noble metals. With the high-purity mercury(99.999999%), both freezing and melting techniques give triple-point temperaturesthat agree to within ± 0.1 mK over most of the liquid-solid range. [The firstcryoscopic constant of mercury is 0.00503/K. Consequently, the liquidus pointof an ideal mercury solution of 99.999999% purity would be approximately 0.002mK lower than that of 100% pure mercury.]
3.2.4.2.1.2 CONTAINERS FOR MERCURY
Any container material can be used with mercury that is sufficiently rigid anddoes not dissolve in, or chemically react with, mercury in the temperature range ofstorage and application. The choice will depend upon whether the mercury fixed-point cell is to be used at its triple point, at its freezing point, or
Figure 9. An SPRT in a metal freezing-point cell.A - platinum resistance thermometer, B - to helium gas supply and pressuregauge, C - thermometer gas seal with silicone rubber, D - silicone rubberstopper, E - thermal insulation (washed Fiberfrax),F - thermometer guide tube[precision bore tube, ground (matt finish) to uniform outside diameter], G -heat shunt (graphite) in close contact with F and with H, H - borosilicateglass cell [precision bore tube ground (matt finish ) to uniform outsidediameter], I - graphite cap (lid) for the graphite crucible, J - graphitethermometer well, K - metal sample, L - graphite crucible, M - thermalinsu la t ion (F iber f rax paper) between the graph i te cruc ib le and theborosilicate glass cell.
Figure 10. Two mercury triple-point cells, one constructed of borosilicateglass and one of Type 304 stainless steel. The two small-diameter tubes at thetop facilitate the cleaning of the cells before filling and sealing. The glasscell is sealed by melting the small-diameter tubes, but the stainless steel cellis sealed by pinching flat the small-diameter tubes and electric-arc weldingthem, thereby serving them at the middle of the flat.
Figure 8. Idealized liquid/solid equilibrium conditions inside fixed pointcells used in freezing and melting experiments. In freezing experiments, alayer of solid is first formed at the crucible wall, then a thin layer of solidis induced on the thermometer well by inserting cooling rods. In meltingexperiments, a layer of liquid is first formed next to the crucible, then athin layer of liquid is formed next to the thermometer well by inserting awarming rod or a long heater, As melting advances, the outer liquid/solidinterface approaches the inner interface.
yyyyyyyyyyyyyyyyyyyyyyyyyyyyyyyyyyyyyyyyyyyyyyyyyyyyyyyyyyyyyyyyyyyyyyyyyyyyyyyyyyyyyyyyyyyyyyyyyyyyyy
yyyyyyyyyyyyyyyyyyyyyyyyyyyyyyyyyyyyyyyyyyyyyyyyyyyyyyyyyyyyyyyyyyyyyyyyyyyyyyyyyyyyyyyyyyyyyyyyyyyyyyyyyyyyyyyyyyyyyyyyyyyyyyyyyyyyyyyyyyyyyyyyyyyyyyyyyyyyyyyyyyyyyyyyyyyyyyyyyyyyyyyyyyyyyyyyyyyyyyyyyyyyyyyyyyyyyyyyyyyyyyyyyyyyyyyyyyyyyyyyyyyyyyyyyyyyyyyyyyyyyyyyyyyyyyyyy
yyyyyyyyyyyyyyyyyyyyyyyyyyyyyyyyyyyyyyyyyyyyyyyyyyyyyyyyyyyyyyyyyyyyyyyyyyyyyyyyyyyyyyyyyyyyyyyyyyyyyy
yyyyyyyyyyyyyyyyyyyyyyyyyyyyyyyyyyyyyyyyyyyyyyyyyyyyyyyyyyyyyyyyyyyy
yyyyyyyyyyyyyyyyyyyyyyyyyyyyyyyyyyyyyyyyyyyyyyyyyyyyyyyyyyyyyyyyyyyyyyyyyyyyyyyyyyyyyyyyyyyyyyyyyyyyyy
Cell Holder
Sample Cell
Sample
Liquid Sample
Solid Sample
ThermometerWell
ResistanceThermometer
Melting Freezing
yyyyyyyyyyyyyyyyyyyy
yyyyyyyyyyyyyyyyyyyyyyyyyyyyyy
10 O.D.x1 Wall
38 O.Dx2 Wall
.
BorosilicateGlass
Dimensions in mm
Type 304Stainless Steel
1.6 Thick
1.0 Thick
38.1 O.D.x1.7 Wall
9.5 O.D.x0.9 Wall
9.5 O.D.x0.13 Wall
9.5 O.D.x 0.9 Wall25
210
13
216
445
197
yyyyyyyyy
yyyyyy
yyyyyyyyyyyyyyyyyyyyyyyyyyyyyy
yyyy
25.2 cm
M
L
K
J
I
G
H
G
F
E
D
CB
A
10 cm
76 cm
32 cm
46 cm

Z-171
at either one.
3.2.4.2.1.3 METAL CONTAINERS
Mercury is capable of dissolving most metals, at least at the low levels ofimpurity content (<l ppm) that are the permitted maxima for metal fixed points Iron,nickel, chromium, and tantalum have been reported to be soluble at only 1 ppm orless; hence, stainless steel is an adequate container for mercury in mosttemperature standard applications [53,103). (Note: the solubility of nicke1 inmercury may be close to the limit of 1 ppm.) Mercury triple-point cells can beprepared by pinching and welding the small diameter tubes used for cleaning,evacuating, and filling (see fig. 10).
3.2.4.2.1.4 CONTAINERS OF GLASS
It is expected that some metal impurities in glasses [single metal oxide(e.g., fused silica glass) or mixed metal oxide (e.g., borosilicate glass)] or"ceramics" can be leached out by mercury when the mercury is stored in them for manyyears. Traditionally, "soft glass" has been considered suitable for storingmercury [48]; however, soft glass, without special treatment, may be sus ceptibleto breakage when thermally shocked. Borosilicate glass and fused silica glassare more practical choices for mercury containers. Figure 11 shows a borosilicateglass mercury triple-point cell inside a stainless steel holder.
3.2.4.2.1.5 CONTAINERS OF PLASTIC
Organic plastics, such as polyethylene polytetrafluoroethylene (Teflon), orpolytrifluorochloroethylene (Kel-F), all of which are free of metals, can be usedto contain mercury and be used at the mercury freezing point. A stainless steelholder similar to that used for the glass mercury cell and for the stainlesssteel mercury cell (see fig.11) or similar to the holder used for the indium cell(see fig. 12) could be used as the external holder for a plastic mercury cell.Although plastic cells have not been used yet in preparing mercury fixed pointcells, it would be practical and desirable to use pla stic cells for realizing themercury fixed point. Since the vapor pressure of mercury at room temperature issufficiently high that mercury vapors can be transported under vacuumconditions, the vapors should be confined by an atmosphere of helium or otherinert gases.
3.2.4.2.1.6 ASSEMBLY OF MERCURY CELLS
A purified mercury sample can be vacuum distilled into glass containers, with theglass filling tube then sealed under vacuum with a flame [43]. The merc ury samplemay be vacuum distilled into stainless steel containers and the fil ling tubepinched, and then cut and sealed using electric-arc welding techniques [43].
3.2.4.2.1.7 REALIZATION AND APPLICATION
When the total impurity content of a mercury sample is about one part in 10 8, bothfreezing and melting techniques yield triple-point temperatures agreeing towithin ± 0.1 mK over most of the liquid-solid range. A dual-stage refrigeratorcan yield a temperature near -40°C and, hence, could be used for freezing mercury,but a much simpler stainless steel vacuum enclosure placed in a Dry Ice/ethylalcohol mixture (-78 °C) can reduce the freezing rate of mer cury to give a freezeduration of about 10 hours or more with 2.2 kg of mercury, and that is perfectlyadequate. Figure 11 shows such a stainless steel enclosure that has been usedwith a borosilicate-glass mercury cell at the NIST.
To start a freeze, fill the stainless steel enclosure that contains the me rcurytriple-point cell with dry air and immerse it in a Dry Ice/ethyl alcohol bath.Fill the themometer well with ethyl alcohol and insert therein an SPRT formonitoring the temperature of the cell. Usually, mercury supercools about 6 °C ina borosilicate glass cell but only about 3 °C in a stainless steel cell. Whenrecilescence is observed, evacuate the stainless steel holder. Remove themonitoring SPRT from the well and replace it with a thin-wall stainless steeltube that contains ethyl alcohol and that has been cooled in a tube of ethylalcohol immersed in a Dry Ice/ethyl alcohol bath. Insert successively into thestainless steel tube two or three liquid-nitrogen cooled glass rods, for about5 minutes each, in order to freeze a thin layer of mercury around the the rmometerwell. The purpose of the stainless steel tube is to collect the frost that forms onthe rods when they are removed from the liquid nitrogen. Remove the stain less steeltube and replace it with the monitoring SPRT, which has been cooling in the tubeof cold ethyl alcohol. Switch on the thermometer measuring current. (Note: it maybe necessary to refill the thermometer well with a small amount of cold ethylalcohol from the Dry-ice cooled tube before the monitoring SPRT is inserted intothe well. The well should be completely filled with ethyl alcohol when the SPRT isin the well.) With the induced inner freeze around the thermometer well,temperature equilibrium is reached in about 5 minutes. After the resistance ofthe monitoring SPRT is read, other cooled SPRT’s are successively insertedinto the mercury cell and calibrated. The final reading in a cell is made with themonitoring SPRT in order to check the extent of the freeze. This final reading ofthe monitoring SPRT must agree with the initial reading to within ± 0.1 mK.See reference 43 for more details on the calibration procedure at themercury triple point.
3.2.4.2.2 MELTING POINT OF GALLIU M
The melting point of gallium is assigned a temperature of 302.9146 K (29.7646°C) onthe ITS-90. Gallium of 99.99999% purity can be obtained commercially. At such highpurity, both freezing and melting techniques should yield liquid-solidequi librium temperatures that agree to within ± 0.1 mK. Since the metal expandsabout 3% on freezing, plastic containers, such as polyethylene, polypropylene,or polytetrafluoroethylene, are the most suitable. These are sufficientlyflexible at around 30 °C to accommodate the volume change in the gallium. Inassembling the gallium fixed-point cell, the supercooled metal can be poureddirectly into the container. A second more rugged container of Nylon, glass, orstainless steel should enclose the flexible container so that the pressure of theinert gas over the metal can be controlled at one atmosphere or be evacuated toobserve the triple point. A gallium fixed-point cell, consisting of an all plasticcontainer, that is used at the NIST is shown in f igure 13. Since gallium supercools as much as 25 °C to 70 °C, depending upon the plastic material that is in contact with it, the most convenient method of observingits liquid-solid equilibrium temperature is the melting technique. [The first
Figure 11. A borosilicate glass, mercury triple point cell in a stainless steelcontainer. A stainless-steel, mercury triple-point cell may also be mounted insidethe stainless steel container. With the high-purity mercury sample, both freezingand melting techniques yield triple-point values agreeing to within ±0.1 mK overmost of the liquid-solid range.
Guidelines for Realizing the ITS-90 Cont’d
H
F
G
E
D
C
B
A
I
J
K
L
M
N
A ="O" ring tube sealB = Thermometer wellC = Ethyl alcohol in wellD = Indium gasket sealE = Insulation, rolled paper tissueF = Stainless steel jacketG = Tubular connection for cleaning and fillingH = Insulation tissue paper rolled around (l) for centeringI = Copper foil cylinderJ = Borosilicate glass cellK = MercuryL = Thermometer cushion (fused quartz wool)M = Stand for mercury cellN = Inculation (Aluminum silicate wool)
yyyyyyyyyyyyyyy
yy
VALVE ANDVACUUM
4.5 cmJF
I
H
F
G
E
D
C
B
A
20.5 cm
Figure 13. An all-plastic gallium melting/triple-point cell. The triple-point isrealized by using the melting technique. The cell is periodically evacuated throughthe valve.
A - valve (Zytel), B - bath lid (Plexiglass), C - support rod (Nylon), D - pumpingtube (polyethylene), E - cap (Nylon), F - sample container (Teflon), G - case(Nylon), H - thermometer well (Nylon), I - gallium metal, J - base of the case

Z-172
Z
Figure 12. Photograph of an all-plastic indium cell and its stainless steel container

Z-173
Guidelines for Realizing the ITS-90 Cont’d
cryoscopic constant of gallium is 0.00732/K. Consequently, the liquidus pointof an ideal gallium solution of 99.99999% purity would be approximately 0.01 mKlower than that of 100% pure gallium.]
3.2.4.2.2.1 REALIZATION AND APPLICATION
In order to solidify the gallium metal in a fixed-point cell, initially in thesupercooled state (e.g., at room temperature), first insert successively two orthree liquid-nitrogen-cooled copper rods into the thermometer well of the cellto induce nucleation, and then place the cell in an ice bath for about one houror longer. The cell with the solidified gallium may then be placed in an oilbath at a temperature of about 40 *C to partially melt the sample to form anouter liquid-solid interface. To form a liquid-solid interface next to thethermometer well (an inner melt), the bath oil may be circ ulated thro ugh thethermometer well by pumping the oil through a tube placed in the well. Afterabout 20 minutes in the hot oil bath, about 25% of the gallium will be melted.The inner liquid-solid interface can also be prepared by using an electric heaterin the well. The amount of electric energy required, e.g., to form about a 7 mmshell of liquid around the thermometer well, can be calculated from the outerdimensions of the thermometer well and the heat of fusion of gallium (see table7). The gallium cell is then securely mounted, completely immersed so that thethermometer well will be filled with the bath oil, in a stirred oil bath,controlled at a temperature about 10 mK above the liquid-solid equilibriumtemperature (melting point or the triple point). Also, the cell can immersed ina fairly close-fitting, oil-filled aluminum or copper block, controlled at atemperature about 10 mK above the equilibrium temperature. The monitoring PRTis heated and then inserted into the thermometer well of the gallium cell.Readings are taken after about 20 minutes of equilibration in the cell. Themonitoring SPRT is replaced in the cell with a preheated test SPRT andmeasurements on it are made after about 20 minutes. A number of SPRT’s can besuccessively calibrated in the same "melt". When all of the test SPRT’s havebeen calibrated, a final measurement in the cell is made on the monitoring SPRT.This reading of the monitoring SPRT should agree with the initial reading towithin ± 0.1 mK. Also, measurements with different melts should agree to within0.1 mK. See references [16,26,65,68,94].
3.2.4.2.3 FREEZING POINT OF INDIUM
The freezing point of indium is assigned the value 429.7485 K (156.5985 ˚C) onthe ITS-90. Metal samples of 99.9999% purity and higher are commerciallyavailable. The freezing point of indium is at a sufficiently low temperatureto permi t the use of conta iners of h igh temperature p last ics[Polytetrafluoroethylene (Teflon), polyimide/amide, and others), borosilicateglass, and stainless steel (4,69,14,92). See figure 14 for an example of aTeflon container used for indium at the NIST. As used with metals that freezeat higher temperatures, graphite can also be used with indium. The metal isavailable in the form of small pellets, wire, and rods. Suitable amounts fora sample can be easily weighed into the container. (The first cryoscopicconstant of indium is 0.00212/K. Consequently, the liquidus point of an idealindium solution of 99.9999% purity would be approximately 0.5 mK lower than thatof 100% pure indium.]
Figure 14. An all-plastic indium freezing-point cell to be used in a stainlesssteel container, such as that shown in figure 12. The argon gas pressure insidethe stainless steel container is adjusted to one atmosphere at the freezing point.A similar all-plastic cell and stainless steel container may be used to realizethe mercury freezing point or meIting point at one atmosphere.
3.2.4.2.3.1 REALIZATION AND APPLICATION
A tube furnace containing the indium-point cell is controlled about 5 ˚ C abovethe freezing point of indium until the metal is completely melted. (It isconvenient to control the furnace temperature automatically and melt the metalsample overnight so that the freezing of the metal may be s started in themorning.) Insert the check SPRT into the cel1 well and when the SPRT indicatesthat the sample is about 5 above the freezing temperature, change the furnacetemperature control settings to control at 5 ˚ C below the freezing point. Whenthe check SPRT indicate. recalescence, change the furnace temperature controlsettings to control at 1 ˚ C to 0.5 ˚ C below the freezing point. Withdraw thecheck SPRT from the cell well and insert successively in the well two fusedsilica glass rods, each initially at room temperature, for about 5 minutes each and then insert the cool check SPRT in order to freeze a thin mantle around thethermometer well. (To avoid the consequence of inserting borosilicate glassrods into the aluminum or silver point cell to form the mantle around thethermometer well, all glass rods used for this purpose in the laboratory shouldbe fused silica glass.) Within 20 to 30 minutes, the readings on the check SPRTshould indicate that the cell is at temperature equilibrium. After the readingson the check SPRT are completed, test SPRT’s, that have been heated in anauxiliary furnace, are successively inserted into the cell well and calibrated.After all of the test SPRT’s have been calibrated the preheated check SPRT isinserted again into the cell well and read. This second reading should agreewith the first to within ± 0.1 mK. See references (4,69,74,92].
3.2.4.2.4 FREEZING POINT OF TIN
The freezing point of tin is assigned the value 505.078 K (231.928 ˚C) Metalsamples of 99.9999% purity are commercially available. Graphite containers arecommonly and successfully used for tin. Although the use of materials such asboron nitride (BN) has not been reported, it could be a suitable container fortin. High purity tin has been found to supercool 25 ˚ C or more [73,76]; hence,the freeze is nucleated by rapid cooling outside the furnace. The metal isavailable in the form of small pellets and in rods suitable for filling thegraphite container. A method for filling graphite containers and installing thegraphite thermometer wells is described in reference [46]. [The first cryoscopicconstant of tin is 0.00329/K. Consequently, the liquidus point of an ideal tinsolution of 99.9999% purity would be approximately 0.3 mK lower than that of 100%pure tin.]
3.2.4.2.4.1 REALIZATION AND APPLICATION
A tube furnace [46] containing the tin freezing-point cell is controlled about5 ˚C above the freezing-point temperature until the metal is completely melted.(It is convenient to control the furnace temperature automatically and melt themetal overnight so that freezing of the metal can be started early in themorning.) Insert the check SPRT into the cell well and, when the SPRT indicatesthat the sample temperature is about 5 ˚C above the freezing point, change thefurnace temperature control settings to control at 1 ˚C to 0.5 ˚C below thefreezing point. When the check SPRT indicates that the cell temperature isclose to the freezing-point value, withdraw the cell and the SPRT from thefurnace. The cell will then cool rapidly and when the SPRT detects recalescence,replace the cell in the furnace. Withdraw the check SPRT from the cell well.Insert successively in the well two fused silica glass rods, each initially atroom temperature, for about, 5 minutes each, and then the cool check SPRT inorder to freeze a thin mantle around the thermometer well. Within about 20 to 30minutes the readings on the check SPRT, should indicate that the cell is attemperature equilibrium. After the readings on the check SPRT are completed,test SPRT’s, that have been heated in an auxiliary furnace, are successivelyinserted into the cell well and calibrated. After all of the test SPRT’s havebeen calibrated, the check SPRT is heated and inserted again into the cell welland read. This reading should agree with the initial reading to within ±0.1 mK.See references [43,46,73,76].
3.2.4.2.5 FREEZING POINT OF ZINC
The freezing point of zinc is assigned the value 692.677 K (419.527 ˚C) Metalsamples of 99.9999% purity are commercially available. High purity liquid zinchas been found to supercool about 0.02 ˚C to 0.06 ˚C; hence, unlike the freezingprocedure used with the tin-point cell, its freeze can be initiated in thefurnace without withdrawing the cell from the furnace. Graphite containers arecommonly and successfully used for zinc. Although the use of materials such asboron nitride (BN) has not been reported, it could be a suitable container forzinc. The metal is available in the form of small pellets and in rods suitablefor filling graphite containers. [The first cryoscopic constant of zinc is0.00185/K. Consequently, the liquidus point of an ideal zinc solution of 99.9999%purity would be approximately 0.5 mK lower than that of 100% pure zinc.]
3.2.4.2.5.1 REALIZATION AND APPLICATION
A tube furnace containing the zinc-point cell is controlled about 5 ˚C above thefreezing point until the metal is completely melted. If the furnace temperatureis maintained at a higher temperature, the zinc will melt faster, but the zincshould never be heated by more than about 5 ˚C above its melting point. (It isconvenient to control the furnace temperature automatically and melt the zincsample overnight so that the freezing of the metal can be started early in themorning and the calibration of six or more test SPRT’s can be completed duringthe same day.) Insert the zinc-point check SPRT into the cell well. When theSPRT indicates that the melt is about 5 ˚C above the freezing point, change thefurnace temperature control settings to control at 5 ˚C below the freezing pointin order to initiate rapid cooling for nucleation. When the check SPRT indicatesrecalescence, change the furnace temperature control settings to control at 1 ˚Cto 0.5 ˚C below the freezing point. Withdraw the check SPRT from the cell welland insert successively into the well two fused silica glass rods, each initiallyat room temperature, for about 5 minutes each, and then insert again the coolcheck SPRT. This freezes a thin mantle around the thermometer well. Withinabout 20 to 30 minutes, the readings on the check SPRT should indicate that thecell is at temperature equilibrium. After the readings on the check SPRT arecompleted, test SPRT’s, that have been heated in an auxiliary furnace, aresuccessively inserted into the cell well and calibrated. After all of the testSPRT’s are calibrated, the preheated check SPRT is inserted again into the cellwell and measurements made on it. This second reading should agree with thefirst to within ± 0.1 mK. references [41,73,75].
5 mm DIA. HOLETHROUGH CAP
34.34 mm ID44.34 mm OD
18.70 mm OD
CAP (TEFLON)9 mm
1 mm
2 mm
240 mm
25mm
115mm
15mm
5 mm
CONTAINER (TEFLON®)
THERMOMETER WELL (TEFLON®)
5 mm
36.34 mm ID 40.34 mm OD
12.70 mm (0.500in.) ID14.70 mm OD
111mm
1 mm 25mm
10 mm
5 mm3 mm
10 mm ID 14 mm OD
3 mm
30 mm OD FUSEDSILICA TUBE
0.005" SPIRAL GROOVE ALONGINSIDE OF THERMOMETER WELL(1 OR 2 THREADS/in.)

Z-174
Z
A - connection to high vacuum, purified argon source, and pressure gauge, B –fused-silica-to-Kovar graded seal, C - fused-silica connecting tube, outersurface matte finished to minimize radiation piping, D - thermometer guidetube, E - heat shunts (Inconel disks), F - thermal insulation (Fiberfrax), G -fused-silica outer envelope, H - graphite lid, I - graphite thermometerwell, J - fused-silica thermometer well, K - fused-silica fiber-woven tape forcushioning the graphite freezing-point cell inside the fused-silica enclosure,L - metal sample, M - graphite crucible, N - fused-silica fiber pad forcushioning the thermometer, 0 - Fiberfrax paper liner.
3.2.4.2.6 FREEZING POINT OF ALUMINUM
The freezing point of aluminum is assigned the value 933.473 K (660.323 ˚C).Metal samples of 99.9999% purity are commercially available. High puritygraphite containers have been used successfully with aluminum. High purityliquid aluminum has been found to supercool about 1 ˚C to 2 ˚C; hence, its freezecan be initiated in the furnace without withdrawing the cell from the furnace.Aluminum is highly reactive, particularly at elevated temperatures; liquidaluminum is capable of dissolving many metals. Liquid aluminum reacts withmoisture, forming the oxide and dissolving the hydrogen. The compounds Al 4C3 and
aluminum oxycarbide have been found in aluminum samples cast in graphite at1000 ˚C. Because of the high chemical reactivity of aluminum, the graphite cellcontaining the metal must be completely protected by enclosing the cell in afused silica envelope (see fig. 15). The argon or helium gas that is used topressurize the freezing metal at one atmosphere must be thoroughly devoid ofmoisture, hydrogen, oxygen, hydrocarbons, and other substances that would reactwith liquid aluminum. The cell must not be heated more than 5 ˚C above thealuminum freezing point. [The first cryoscopic constant of aluminum is0.00149/K. Consequently, the liquidus point of an ideal aluminum solution of99.9999% purity would be approximately 0.7 K lower than that of 100% purealuminum.]
3.2.4.2.6.1 ASSEMBLY OF AN ALUMINUM-POINT CELL
High purity aluminum can be obtained in the form of shots or rods. Determine.the internal volume of the graphite container, taking into account thethermometer well. Determine the mass of liquid aluminum required to fill thecell to within 0.5 cm of the graphite lid. Weight out aluminum shots or cut andclean aluminum rods that correspond to this mass. The rods should be cut witha carbide tipped tool and cleaned by etching in a hot (about 200 ˚C) solutionconsisting (by volume) of reagent grade phosphoric acid (15 parts, sulfuricacid (5 parts), and nitric acid (7 part), and then carefully rinsing many timesin distilled water. Load the graphite crucible with the aluminum sample andthen slide it into an extra-long fused-silica test tube such as that shown infigure 16. Insert the test tube into the tube furnace and evacuate it. Whilecontinuing to evacuate the tube, set the furnace temperature to control at about5 ˚C above the melting point of aluminum. When the sample has completely melted,cool it to room temperature, while continuing to pump the tube. If aluminumshot, or rods of odd sizes, are used, the graphite cell will require severalloadings and meltings before the desired amount of total sample has been loadedinto the cell. When the graphite crucible is appropriately loaded with thesample, replace the silicone rubber stopper at the mouth of the extra-long testtube of figure 16 with the device for inserting the graphite thermometer welland lid (see reference [45] or fig. 17). Insert the test tube into the tubefurnace, evacuate it, and then fill it with high purity argon to a pressureslightly above ambient. Melt the aluminum sample and push the graphite well andlid into the cell. Cool the sample to room temperature, while maintaining theargon pressure in the test tube slightly above the ambient pressure. Finally,assemble the graphite cel1 containing the aluminum sample into the desiredfreezing - point cell configuration (see references [43,45,701] or fig. 15).
Figure 16. A method for filling a graphite freezing-point cell by melting themetal sample in the graphite crucible. The required amount of sample is placedin the graphite crucible and the crucible is inserted into the fused silicatube. To protect the sample, the fused silica tube is evacuated or filled withan inert gas (e.g., purified argon) before melting the metal in a tube furnace.Depending upon the geometry of the sample, the melting of two or more batches of sample may be required.
A - Silicone rubber stopper, B - fused silica tube, C - graphite crucible,D - metal sample.
Figure 17. An apparatus for installing a graphite thermometer well and lid in agraphite crucible containing a molten metal sample.
A - stainless steel pusher rod, B - silicone rubber gas seal (permits linearmotion of the pusher rod A), C - inlet for purified argon gas that is used inpurging and maintaining positive pressure of the gas during the assembly process,D - silicone rubber stopper, E - stainless steel flange attached to the pusherrod for pressing against the graphite lid and thermometer well during assembly.F - graphite lid for the crucible, G - slit on the pusher rod (the two halvesspring outward to hold the graphite thermometer well and lid while melting themetal sample), H - graphite thermometer well, I - fused-silica tube, J - a partof the fused-silica tube where its I.D. matches closely with the O.D. of thecrucible and its lid so that the lid can be easily guided onto the opening ofthe crucible, K - graphite crucible, L - molten metal sample.
Figure 15. A graphite freezing point cell enclosed inside a fused silica tubewith tube connection to high vacuum, purified argon gas source, and pressuregauge.
@@@@@@@@@@@@@@@@@@@@@@@@@@@@@@@@@@@@@@@@@@@@@@@@@@@@@@@@@@@@@@@@@@@@@@@@@@@@@@@@@@@@@@@@@@@@@@@@@@@@@@@@@@@@@@@@@@@@@@@@@@@@@@@@@@@@@@@@@@@@@@@@@@@@@@@@@@@@@@@@@@@@@@@@@@@@
ÀÀÀÀÀÀÀÀÀÀÀÀÀÀÀÀÀÀÀÀÀÀÀÀÀÀÀÀÀÀÀÀÀÀÀÀÀÀÀÀÀÀÀÀÀÀÀÀÀÀÀÀÀÀÀÀÀÀÀÀÀÀÀÀÀÀÀÀÀÀÀÀÀÀÀÀÀÀÀÀÀÀÀÀÀÀÀÀÀÀÀÀÀÀÀÀÀÀÀÀÀÀÀÀÀÀÀÀÀÀÀÀÀÀÀÀÀÀÀÀÀÀÀÀÀÀÀÀÀÀÀÀÀÀÀÀÀÀÀÀÀÀÀÀÀÀÀÀÀÀÀÀÀÀÀÀÀÀÀÀÀÀÀÀÀÀÀÀÀÀÀÀ
@@@@@@@@@@@@@@@@@@@@@@@@@@@@@@@@@@@@@@@@@@@@@@@@@@@@@@@@@@@@@@@@@@@@@@@@@@@@@@@@@@@@@@@@@@@@@@@@@@@@
ÀÀÀÀÀÀÀÀÀÀÀÀÀÀÀÀÀÀÀÀÀÀÀÀÀÀÀÀÀÀÀÀÀÀÀÀÀÀÀÀÀÀÀÀÀÀÀÀÀÀÀÀÀÀÀÀÀÀÀÀÀÀÀÀÀÀÀÀÀÀÀÀÀÀÀÀÀÀÀÀÀÀÀÀÀÀÀÀÀÀÀÀÀÀÀÀÀÀÀÀ
yyyyyyyyyyyyyyyyyyyyyyyyyyyyyyyyyyyyyyyyyyyyyyyyyyyyyyyyyyyyyyyyyyyyyyyyyyyyyyyyyyyyyyyyyyyyyyyyyyyyyyyyyyyyyy
yyyyyyyyyyyyyyyyyyyyyyyyyyyyyyyyyyyyyyyyyyyyyyyyyyyyyyyyyyyy
yyyyyyyy
A
B
C
D
E
E
F
E
E
G
H
I
J
K
L
M
N
O
5.1 cm
28 cm
51.3 cm
3.5 cm
5.5 cm
5.5 cm
8.3 cm
@@@@
ÀÀÀÀ
@@@@
ÀÀÀÀ
@@@@
ÀÀÀÀ
@@@@
ÀÀÀÀ
TO HIGHVACUUM
TO PURIFIEDARGON SOURCE
A
B
C
D
A
B
C
D
EF
G
H
I
K
J
L
244
560
219
153
mm
mm
mm
560 mm
mm

Z-175
3.2.4.2.6.2 REALIZATION AND APPLICATION
SPRT’s that are to be calibrated at the aluminum point and higher musthave fused silica, sapphire, or ceramic insulation for the resistanceelement and its extension leads. Such high temperature SPRT’s should behandled by procedures that avoid thermally shocking them.
A tube furnace containing the aluminum point cell is controlled about 5°Cabove the freezing point of aluminum until the metal is completely melted.It is convenient to control the furnace temperature automatically and meltthe metal overnight so that the freezing of the metal can be started earlyin the morning and the calibration of two or three test SPRT’s completedduring the same day. Insert the aluminum point check SPRT stepwise intothe cell well. Since the SPRT will cool considerably between the time itis withdrawn from any auxiliary preheat furnace and inserted into thealuminum point cell, the SPRT is heated in the section of the thermometerguide tube that is maintained close to the furnace temperature. The SPRTis inserted initially to a location where its tip is about 3 cm above thegraphite cell lid. After about 5 minutes, the SPRT is inserted anadditional 5 cm and after another 5 minutes, another 5 cm, and so on untilthe tip of the SPRT is at the bottom of the thermometer well. When theSPRT indicates that the sample is about 5°C above the freezing point,change the furnace temperature control settings to control at 5°C belowthe freezing point in order to initiate rapid cooling for nucleation. Whenthe check SPRT indicates recalescence, change the furnace temperaturecontrol settings to control at 1°C to 0.5°C below the freezing point.Withdraw the check SPRT stepwise from the cell, first to a location about3 cm above the graphite cell lid. After about 5 minutes, withdraw the SPRTanother 5 cm,and after another 5 minutes, another 5 cm, and so on untilthe SPRT is completely out of the thermometer guide tube. Next, insertsuccessively into the cell well two fused silica glass rods, eachinitially at room temperature, for about 5 minutes each to freeze a thinmantle of solid aluminum around the thermometer well. Again insert thecheck SPRT stepwise, as described above, into the cell. Within 20 to 30minutes, the readings on the check SPRT should indicate that the cell isat temperature equilibrium. After the readings on the check SPRT arecompleted, the SPRT is removed from the cell stepwise, as described above.The test SPRT’s are then successively inserted stepwise, calibrated, andremoved stepwise as described for the check SPRT. After all of the testSPRT’S have been calibrated, the check SPRT is inserted again into thecell well and measurements made. This second reading at temperatureequilibrium should agree with the first to within ± 0.1 mK.
When SPRT’s are cooled rapidly from the aluminum point to ambienttemperature, lattice vacancies are quenched in and these must be removedbefore the SPRT’s are calibrated at the triple point of water. To relieveany quenched in lattice vacancies, the SPRT’s that have been calibrated atthe aluminum point should be heated in an auxiliary furnace at about 660°Cfor about 30 minutes and then gradually cooled to about 500°C over 3 hoursor more before withdrawing from the furnace to cool at ambienttemperature. See references (43, 45, 70).
3.2.4.2.7 FREEZING POINT OF SILVER
The freezing point of silver is assigned the value 1234.93 K (961,78°C).Metal samples of 99.9999% purity are commercially available in the form ofpellets.
High purity graphite containers have been used successfully with silver.Liquid silver has been found to supercool not more than 0.5°C; hence, itsfreeze can be initiated in the furnace without withdrawing the cell fromthe furnace. See references [3,15,72,98].
Oxygen is known to “dissolve” in liquid silver and lower the freezingpoint. Although the dissociation pressure of Ag 20 is expected to be quitehigh at the freezing point of silver, the lowering of the freezing pointmay be a combination of the solution of Ag 20 and of oxygen in liquidsilver. (The dissociation pressure of Ag 20 is given as 414 atmospheres at507°C.) In a graphite environment at the freezing point of silver, a smallamount of the oxygen will eventually react with the graphite; however, anewly prepared cell should be pumped at high vacuum at about 1000°C for aweek before back filling to one atmosphere with purified argon, nitrogen,or helium. [The first cryoscopic constant of silver is very small(0.000891/K). Consequently, the liquidus point of an ideal silver solutionof 99.9999% purity would be approximately 1.1 mK lower than that of 100%pure silver.]
3.2.4.2.7.1 REALIZATION AND APPLICATION
The freezing-point cell of silver may be assembled by a procedure similarto that used with aluminum. See section 3.2.4.2.6.1.
SPRT’s that are to be calibrated at the silver freezing point must havefused silica, sapphire, or ceramic insulation for the resistance coil andits extension leads. Such high temperature SPRT’s should be handled byprocedures that avoid thermally shocking them.
A tube furnace containing the silver freezing point cell is controlled atabout 5°C above the freezing point until the metal is completely melted.(It is convenient to control the furnace temperature automatically andmelt the metal overnight so that the freezing of the metal can be startedearly in the morning and the calibration of two or three test SPRT’scompleted during the same day.) Insert the silver point check SPRTstepwise into the cell well. Since the SPRT will cool considerably betweenthe time it is withdrawn from any auxiliary preheat furnace and insertedinto the silver point cell, the SPRT is heated in the section of thethermometer guide tube that is maintained close to the furnacetemperature. The SPRT is inserted initially to a location where its tip isabout 3 cm above the graphite cell lid. After about 5 minutes, the SPRT isinserted an additional 5 cm, and after another 5 minutes, another 5 cm,and so on until the tip of the SPRT is at the bottom of the thermometerwell. When the SPRT indicates that the temperature of the sample is about5°C above the freezing point, change the furnace temperature controlsettings to control at 5°C below the freezing point in order to initiaterapid cooling for nucleation. When the check SPRT indicates recalescence,change the furnace temperature control settings to control at 1°C to 0.5°Cbelow the freezing point. Withdraw the check SPRT stepwise from the cellwell, first to a location about 3 cm above the graphite cell lid. Afterabout 5 minutes, withdraw the SPRT an additional 5 cm, and after another 5minutes, another 5 cm, and so on until the SPRT is completely out of thethermometer guide tube. Next, insert successively into the cell well twofused-silica glass rods, each initially at room temperature, for about 5minutes each in order to freeze a thin mantle of solid silver around the
thermometer well. Then, insert again the check SPRT stepwise, as describedabove, into the cell. Within about 20 to 30 minutes, the readings on thecheck SPRT should indicate that the cell is at temperature equilibrium.After the readings on the check SPRT are completed, it is removed from thecell stepwise, as described above. The test SPRT’s are then successivelyinserted stepwise, calibrated, and removed stepwise as described for the-check SPRT. After all of the test SPRT’s have been calibrated, the checkSPRT is inserted again into the cell well and read. This second readingshould agree with the first to within ±0.2 mK.
When SPRT’s are cooled rapidly from the silver point to ambienttemperature, lattice vacancies are quenched in and these must be removedbefore the SPRT’s are measured at the triple point of water. To relieveany quenched in lattice vacancies, the SPRT’s that have been calibrated atthe silver point are heated in an auxiliary furnace at about 960°C for30 minutes or so and then gradually cooled to about 500 ˚C over 3.5 hoursor more before withdrawing from the furnace to cool at ambienttemperature. In order to protect the plat inum of the SPRT fromcontamination by diffusion of metals at high temperatures (above 660°C,the SPRT’s should be enclosed in a platinum tube or other protectivedevice.
3.2.5 CONTROL CHARTS OF CHECK THERMOMETERS
Control charts should be kept for all of the check thermometers associatedwith the various fixed points. Each of these charts will usually consistof a chronological graph of the check thermometer resistance value, R(X),obtained from measurements in the fixed-point cell X, and of the ratio,W(X) = R(X)/R(TPW), of the resistance value R(X) to the resistance value,R(TPW), obtained from measurements in a triple point of water cell.Presumably, such charts have been kept by those involved in precisionthermometry. Entries on such control charts are made each time theparticular fixed point cell is used. Since those involved in precisionthermometry would have used triple point of water cells for their workbased on the IPTS-68 and they would have used W(X), the same control chartcan be continued with the ITS-90. The reason, of course, is that thebehavior of the fixed point cells is independent of the scale. Not all ofthe fixed points of the ITS-90, however, are the same as those of theIPTS-68. The ITS-90 uses some of the IPTS-68 fixed points but it also usesother fixed points. See reference (64).
Some metrologists may not have used W(X) as defined above, but may haveused the W(t) of the IPTS-68. In that case, there will be a discontinuityin their control charts involving W when they implement the ITS-90 andbegin using W(X). The magnitude of the discontinuity will simply be theratio R(273.16 K)/R(273.15 K).
Control charts involving only R(X) as a function of time will not have anydiscontinuity due to the change in the scale. Depending on the temperatureof interest, of course, there may be need to start additional controlcharts.
3.3 RADIATION THERMOMETRY
Above the freezing point of silver (1234.93 K), the ITS-90 is defined interms of Planck’s radiation law. The values of temperatures T 90 on theITS-90 are obtained from the observed ratios of the spectral concentrationsof the radiance L λ of a blackbody at the wavelength (in vacuum) λ at T 90 andat the reference temperature T 90(X) according to eq. (31).
Inside a closed cavity, the radiation densities at different wavelengths λdepend only upon the temperature of the cavity walls. When a practicalradiator is designed with a small hole in the wall to observe theradiation density at λ, there arises the question of how much the observedradiation departs from the blackbody radiation for a radiator design of agiven geometry and material of construction. There are numerous papers onthe theoretical analysis of the emissivities, associated with cavitygeometry and construction materials and descriptions of radiator designsthat have been used in radiation thermometry (8, 9, 34, 35, 54, 77, 87, 89, 95).The emissivities of cavities constructed of specular reflectors anddiffuse reflectors have been analyzed (87). It is expected that at hightemperatures many materials become oxidized and, consequently, becomediffuse reflectors. Although it is difficult to determine the actualtemperature gradients in a cavity, the effect of temperature gradients hasalso been treated (10, 11). The effective emissivity of a graphiteblackbody cavity has been computed to be 0.99997 ± 0.00003 (77).
For radiation thermometer calibrations at the silver, gold, or copperfixed point, the blackbody cavity should be constructed of graphite andsurrounded by the freezing or melting metal contained in graphite toretain the high purity of the metal that is used. [The first cryoscopicconstants of all three of these metals are extremely low (silver:0.000891/K; gold: 0.000831/K; Cu: 0.000857/K). Consequently, the ideal-solution liquidus points of these metals of 99.9999% purity would beapproximately 1.1 mK to 1.2 mK lower than that of 100% pure metals.]
References [27, 55, 56, 57, 62, 77] give some details of construction ofsuitable graphite fixed point blackbody cavities. The metal should beprotected from air using an inert gas, such as argon, nitrogen, or helium,at a pressure slightly above ambient. The graphite container or auxiliarygraphite scavengers can remove small amounts of oxygen impurities. For theblackbody cavity at the platinum point, pure alumina has been used in anoxidizing atmosphere to avoid the reaction between platinum metal andalumina in which oxygen gas is formed and metallic aluminum is dissolvedin the platinum [33,86].
Usually, optical pyrometers or photoelectric pyrometers are used todetermine the ratio of the radiances of a source of unknown temperature withthat of the reference source. The optical system of the instrument isdesigned to focus a nearly monochromatic image of the radiation source ontoa photodetector, which until about the mid 1950’s was only the human eye;now the eye has been replaced in high precision measurements byphotoelectric detectors because of their greater accuracy and theirsuitability for automation of the measurements. Two methods are commonlyused to determine the ratios of spectral radiances. Either the photoelectricpyrometer is designed for comparing the two radiation sources by nulldetection operation, similar in principle to the disappearing filament
Guidelines for Realizing the ITS-90 Cont’d

Z-176
Z
optical pyrometers using suitable neutral filters or sectored discs forattenuating the radiation of one source, or for measuring directly the radiationdensity in terms of the detector output, e.g., photocell current. The latterrequires high stability and linearity of signal processing [34,77). The optics ofthe system may comprise refract ing components ( lenses) or ref lect ingcomponents (mirrors) [28,34,54,57,87].
Equation (31) requires the rat io of monochromatic radiances. Usually,interference filters are used for this purpose. The bandwidth should be narrowwith high transmittance while completely blocking out wavelengths outside thedesired band. The temperature error is smaller the narrower the bandwidth. Thetemperature of the filters should be controlled, since they are sensitive totemperature changes. The photoelectric detector should be protected fromundesired radiations from outside the solid angle defined by the aperture of theblackbody cavity. Where the output of the photocell is used to determine theratio of the radiances, the linearity of the detector should be carefully checkedor calibrated.
For details of optical pyrometer operation and attendant sources of error, seereferences [28,34,54,57,77,87].
4. CALIBRATION OF THERMOMETERS ON THE ITS-90 AT VARIOUS LEVELS OF UNCERTAINTY ANDSOME APPROXIMATIONS OF THE SCALE
In a standards laboratory, the design of apparatus and equipment for calibrationof thermometers on the ITS-90 should be based on the desired accuracy, the number ofthermometers and thermometric instruments that must be calibrated per year, thecost of real izing the ITS-90 (the f ixed points and the measurementequipment), the cost of applying and maintaining the ITS-90, and the cost ofresearch to maintain and make necessary improvements on the realization of theITS-90. In a national standards laboratory, the efforts are directed toward theaccurate realization of the ITS-90.
On 1 January 1990, no laboratory was able to calibrate thermometers over thecomplete range of the ITS-90 in accordance with the strict definition of thescale. Also, it is thought that on that date there was no immediate, widespreadrequirement for “experimental calibration conversion” from the IPTS-68(75) toITS-90 over the complete range. Since the differences between IPTS-68(75) andITS-90 were known, “arithmetical conversions” should have met most of theimmediate requirements. Also, where stable thermometers have been used tomaintain the EPT-76 or parts of the IPTS-68(75), the scales on those referencethermometers could be converted to ITS-90, using the published approximatedifferences between the scales, and then those thermometers can be used tocalibrate other thermometers on the ITS-90. To realize the ITS-90 as definedand for international traceability, however, it is essential for the nationalcalibration laboratory to have all of the fixed-point apparatus and measurementequipment. Furthermore, without continued research and comparison with otherstandards laboratories, the question regarding the accuracy of the realizationof the scale will remain. The ITS-90 temperature calibrations are based on thethermal equilibrium states (vapor-liquid or liquid-solid equilibrium at knownpressures, or vapor-liquid-solid triple points) of pure substances. Substances,however, have some impurity content; the amount must be small enough to havenegligible effect on the measurement of temperature. Obviously, the fixed-pointdevice and the experimental procedure must be designed so that duringcal ibrat ion, the thermometer wi l l be in thermal equi l ibr ium with theequilibrium state of the defining fixed point. A method for checking whether ornot the thermometer is in thermal equilibrium with a metal fixed-point standarddevice is to reduce the immersion in the device a known amount or vary theexperimental conditions. The observed temperature change of the thermometermust correspond with the hydrostatic head effect of the liquid metal in thedevice, or there must be no observed temperature change with experimentalconditions (such as changing furnace temperatures of metal fixed-point cells).
In order to determine the precision of the calibration process, it is essentialto use check thermometers with every calibration. The results of the checkthermometers will show whether the calibration process is “under statisticalcontrol” or not. The accumulated results show the precision of the “gross”calibration process.
Since some parts of this section deal with approximations of the ITS-90, andwill make reference to the scale differences given in table 1, the methods bywhich the table was constructed will be described. The differences ( T90 - T76)between 5 K and 27 K were obtained using the same relation [99] as that used for(T NPL-75 - T 90). namely,
(T 90 - T 76)/mK = - 0.00.56(T 90/K) 2. (40)
The differences (T 90 - T 90) between 14 K and 100 K were obtained by Working Group 4of the CCT by graphical interpolation of data from the published literature. Thedifferences (T 90 - T 68), or (t 90 - t 68), between -200 ˚C and 630 ˚C wereobtained by Working Group 4 of the CCT from published data on two SPRT’s, oneSPRT covering the range, below 0 ˚C, and the other covering the range from 0 ˚Cto 630 ˚C. A polynomial of the form:
8(t 90 - t 68)/˚C = ∑ ai (t 90/630) i (41)
i=1
was fitted to the data from -200 ˚C to 630 ˚C and the coefficients are:a1 = -0.148759 a 5 = -4.089591a2 = -0.267408 a 6 = -1.871251a3 = 1.080760 a 7 = 7.438081a4 = 1.269056 a 8 = -3.536296
The polynomial with these coefficients reproduces the tabulated differences [83]to within 1 mK above 0˚C and to within 1.5 mK below 0˚C. The differences(T 90 - T 68) between 630˚C and 1064˚C were obtained by Working Group 4 bygraphical interpolation from published data [14). The differences (T 90 - T 68)above 1064 ˚C were obtained from the equation:
(t 90 - t 68)/˚C - 0.25 [(t 90/˚C + 273.15)/(1337.33)] 2. (42)
In section 3, we discussed the direct realization of the ITS-90, using thestandard instruments of the scale, i.e. , the realization of the scale at thelowest level of uncertainty. Of course, even the standard interpolatinginstruments used at the same thermodynamic temperature will indicate temperaturesthat differ slightly due to the devices having nonideal behavior and the scale’sbeing expressed in as simple a form as possible. The differences in indicatedtemperatures, however, are negligible for all practical purposes, being of theorder of ≤ ± 0.5 mK for temperatures above about 5 K (i.e., assuming no errors incalibration). The realization of the ITS-90 in the liquid helium range oftemperatures (0.65 K to 5.0 K) through helium vapor pressure- temperaturerelations can be accurate to about ± 0.1 mK or ± 0.2 mK.
For nonstandard types of thermometers used to approximate the ITS-90, the level of
uncertainty is higher than the numbers just given because of the inherent
instability of these thermometers. In all cases, these types of thermometers are
calibrated by comparison with one or more standard instruments of the scale, e.g.,
vapor-pressure thermometry; vapor-pressure thermometry and gas thermometry; vapor-
pressure thermometry, gas thermometry, and platinum resistance thermometry; gas
thermometry and plat inum resistance :thermometry; plat inum resistance
thermometry; or pyrometers or spectral radiometers.
The NIST offers calibration services for various thermometers and pyrometers
covering the range from 0.65 K to 4200 ˚C (see NIST SP 250). Of this range, the
Chemical Process Metrology Division offers calibrations for contact thermometers
covering the range from 0.65 K to 2400 K, and the Radiometric Physics Division
offers calibrations for non-contact thermometers (radiation pyrometers) covering
the range from 1234.93 K (961.78 ˚Q to 4200 ˚C. Calibrations of only contact-
type. thermometers will be discussed here. The types of contact thermometers
calibrated include rhodium-iron resistance thermometers (RIRT’s), germanium
resistance thermometers (GRT’s), standard platinum resistance thermometers
(SPRT’S), thermocouples (t/c), l iquid-in-glass thermometers, thermistor
thermometers, industrial platinum resistance thermometers (IPRT’s), digital
thermometers, and other special thermometers that are compatible with the NIST
calibration equipment.
4.1 RHODIUM-IRON RESISTANCE THERMOMETERS
At temperatures below 13.8033 K, RIRT’s and GRT’s are, at the present time, the
only thermometers that are suitable for precision temperature measurements. Also,
RIRT’s (and to a lesser extent GRT’s) are suitable for use at temperatures up to
the triple point of neon (24.5561 K). In the range from 0.65 K to about 25 K,
RIRTs have -reproducibilities of about ± 0.2 mK. Consequently, RIRT’s don’t
degrade the realization of the ITS-90 significantly.
When the ITS-90 is realized, as defined, at NIST, some NIST RIRT’s will be
calibrated at many temperatures through the Use of vapor-pressure thermometry and
gas thermometry to produce reference-standard RIRT’s, which wil l be
periodically recalibrated. The resistance temperature data of these RIRT’s will
be represented by a polynomial.
Customer RIRT’s are calibrated by comparison with reference-standard RIRT’s. A
polynomial is fitted by the method of least squares to the RIRT resistance-
temperature data so obtained and the results are reported in terms of the
polynomial that is selected.
Until the NIST completes the development of the CVGT and vapor-pressure
thermometry apparatus with which the reference-standard RIRT’s will be calibrated,
calibrations of customer RIM are performed by comparison against reference-
standard RIRT’s that have been calibrated on the NPL-75 Scale [13) or on the
EPT-76 and converted to the ITS-90.
To convert a calibration of an RIRT on the EPT-76 to an approximate calibration
on the ITS-90, use the EPT-76 calibration res instance temperature data change
the T 76 values to T 90 values Using the (T 90 - T 76) differences given in table 1, or
calculated with eq (40), to produce a new set of. resistance-temperature values,
and then fit a polynomial of the required degree to these data. Using the
coefficients of the polynomial so determined, produce the desired calibration table.
A typical calibration report on the EPT-76 and one on the ITS-90 are given in
appendix 3, sections 6.3.6 and 6.3.7, respectively.
4.2 GERMANIUM RESISTANCE THERMOMETERS
GRT’s are comparable with, but not quite as stable as RIRT ’ s. They are calibrated
in a manner similar to that of the RIRT’s and their results similarly reported.
At NIST, customer GRT’s are calibrated by comparison with reference to standard
RIRT’s.
Anyone with a calibration on the EPT-76 may convert it to an approximate ITS-90
calibration by the same procedure as just outlined for RIRT’s.
4.3 STANDARD PLATINUM RESISTANCE THERMOMETERS
Both capsule and long-stem type SPRT’s are calibrated at the NIST. They will be
discussed separately.
4.3.1 CAPSULE SPRT’S (13.8033 K TO 429.7485 K OR 505.078 K)
For temperatures in the range from 13.8033 K to 273.16 K, capsule SPRT’s are the
most suitable thermometers. NIST has reference capsule SPRT’s that have been,
or will have been, calibrated at the defining fixed points in this range. Those
SPRT’s are used in calibrating customer thermometers by the comparison technique
over the range from about 13 K to 84 K. The temperatures at which comparisons
are made are at, or within a few mK of, the defining fixed-point temperatures
of the ITS-90 and at temperatures approximately mid-way between the fixed-point,
values. Data at the temperatures intermediate to the fixed-point values are
incorporated as a check on the calibration process. At and above the argon
triple point (83.8058 K), customer capsule SPRT’s are calibrated by the fixed-
point method. See section 6.3 for an example of how to calculate the
coefficients of the deviation functions.
4.3.2 LONG-STEM TYPE SPRT’S (83.8058 TO 1234.93 K)
Long-stem type SPRT’s are used in the range from 83.8058 K to 1234.93 K. Two
different long-stem type SPRT’s are required to cover this whole range, one type
being the customary SPRT having a nominal 25.5 0 resistance at 0 *C and used in
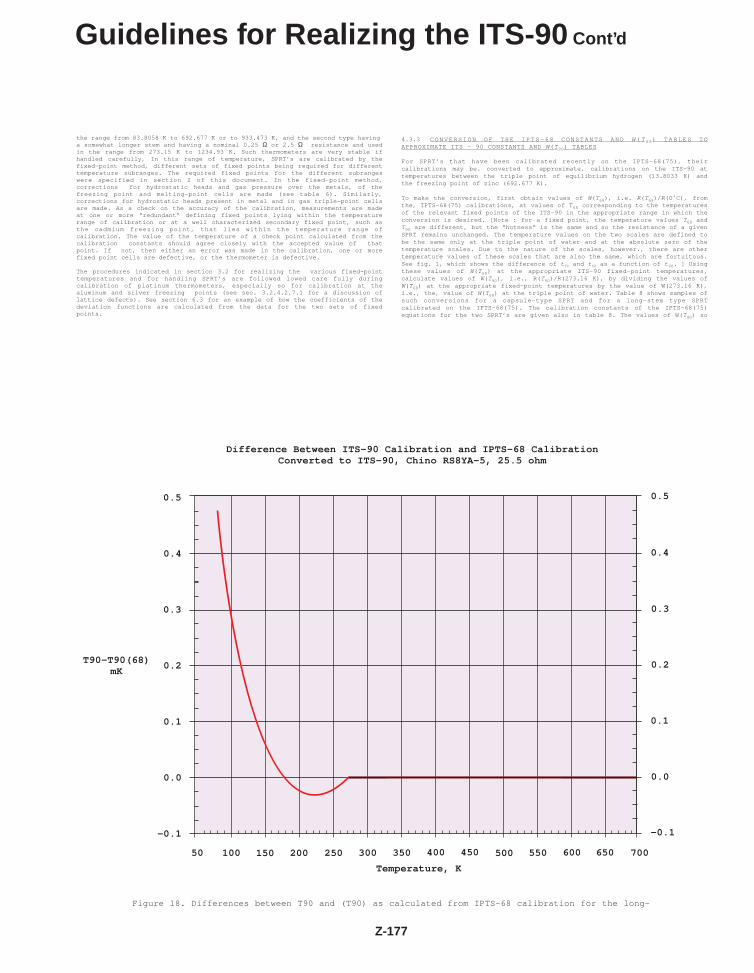
Guidelines for Realizing the ITS-90 Cont’d
the range from 83.8058 K to 692.677 K or to 933.473 K, and the second type havinga somewhat longer stem and having a nominal 0.25 Ω or 2.5 Ω resistance and usedin the range from 273.15 K to 1234.93 K. Such thermometers are very stable ifhandled carefully, In this range of temperature, SPRT’s are calibrated by thefixed-point method, different sets of fixed points being required for differenttemperature subranges. The required fixed points for the different subrangeswere specified in section 2 of this document. In the fixed-point method,corrections for hydrostatic heads and gas pressure over the metals, of thefreezing point and melting-point cells are made (see table 6). Similarly,corrections for hydrostatic heads present in metal and in gas triple-point cellsare made. As a check on the accuracy of the calibration, measurements are madeat one or more “redundant” defining fixed points lying within the temperaturerange of calibration or at a well characterized secondary fixed point, such asthe cadmium freezing point, that l ies within the temperature range ofcalibration. The value of the temperature of a check point calculated from thecalibration constants should agree closely with the accepted value of thatpoint. If not, then either an error was made in the calibration, one or morefixed point cells are defective, or the thermometer is defective.
The procedures indicated in section 3.2 for realizing the various fixed-pointtemperatures and for handling SPRT’s are followed lowed care fully duringcalibration of platinum thermometers, especially so for calibration at thealuminum and silver freezing points (see sec. 3.2.4.2.7.1 for a discussion oflattice defects). See section 6.3 for an example of how the coefficients of thedeviation functions are calculated from the data for the two sets of fixedpoints.
4.3.3 C O N V E R S I O N O F T H E I P T S - 6 8 C O N S T A N T S A N D W( T 6 8 ) T A B L E S T OAPPROXIMATE ITS - 90 CONSTANTS AND W( T90) TABLES
For SPRT’s that have been calibrated recently on the IPTS-68(75), theircalibrations may be. converted to approximate, calibrations on the ITS-90 attemperatures between the triple point of equilibrium hydrogen (13.8033 K) andthe freezing point of zinc (692.677 K).
To make the conversion, first obtain values of W( T68), i.e. R( T68)/ R(O˚C), fromthe, IPTS-68(75) calibrations, at values of T 68 corresponding to the temperaturesof the relevant fixed points of the ITS-90 in the appropriate range in which theconversion is desired. [Note : for a fixed point, the temperature values T68 andT90 are different, but the “hotness“ is the same and so the resistance of a givenSPRT remains unchanged. The temperature values on the two scales are defined tobe the same only at the triple point of water and at the absolute zero of thetemperature scales. Due to the nature of the scales, however., there are othertemperature values of these scales that are also the same, which are fortuitous.See fig. 1, which shows the difference of t 90 and t 68 as a function of t 90. ] Usingthese values of W( T68) at the appropriate ITS-90 fixed-point temperatures,calculate values of W( T90), i.e., R( T90)/R(273.16 K), by dividing the values ofW( T68) at the appropriate fixed-point temperatures by the value of W(273.16 K),i.e., the, value of W( T68) at the triple point of water. Table 8 shows samples ofsuch conversions for a capsule-type SPRT and for a long-stem type SPRTcalibrated on the IPTS-68(75). The calibration constants of the IPTS-68(75)equations for the two SPRT’s are given also in table 8. The values of W( T90) so
Z-177
Difference Between ITS-90 Calibration and IPTS-68 CalibrationConverted to ITS-90, Chino RS8YA-5, 25.5 ohm
0.5
0.4
0.3
0.2
0.1
0.0
-0.1
50 100
T90-T90(68)mK
150 200 250 300
Temperature, K
350 400 450 500 550 600 650 700
-0.1
0.0
0.1
0.2
0.3
0.4
0.5
Figure 18. Differences between T90 and (T90) as calculated from IPTS-68 calibration for the long-

Capsule SPRT (S/N 1812284)
Fixed Point T68/K W(T68) meas.. T90/K W( T90) calc.* W(T 90) meas..
e-H 2 TP 13.81 0.00119822 ** 13.8033 0.00119817 0.00119721e-H 2 BP 17.04200 0.00231120 ** 17.0357 0.00231111 0.00231049e-H 2 BP 20.280 0.00425962 ** 20.2711 0.00425945 0.00425815
Ne TP 24.5616 0.00848337 ** 24.5561 0.00848303 0.00848391o2 TP 54.361 0.09182547 ** 54.3584 0.09182180 0.09182102Ar TP 83.79723 0.21598575 ** 83.8058 0.21597714 0.21597795Hg TP 234.3086 0.84421212 ** 234.3156 0.84417846 0.84417781
H2O TP 273.16 1.00003987 ** 273.16 1.00000000 1.00000000Ga MP 302.9218 1.11815352 ** 302.9146 1.11810895 1.11810896I n FP 429.7848 1.60970773 ** 429.7485 1.60964355 1.60964566Sn FP 505.1181 1.89263856 ** 505.078 1.89256311 1.89256311
Long-Stem SPRT (S/N RS8YA-5):
Ar TP 83.79723 0.21592943 ** 83.8058 0.21592084 0.21592281Hg TP 234.3086 0.84418993 ** 234.3156 0.84415637 0.84415625
H2O TP 273.16 1.00003976 273.16 1.00000000 1.00000000Ga MP 302.9218 1.11817175 *** 302.9146 1.11812729 1.11812699I n FP 429.7848 1.60980450 *** 429.7485 1.60974050 1.60974062Sn FP 505.1181 1.89278557 505.078 1.89271033 1.89271033Zn FP 692.73 2.56885786 692.677 2.56875573 2.56875573
* Values of W( T90) calc. were obtained by conversion of corresponding values ofW( T68) meas.
** These values were calculated from NBS-IPTS-68 calibration constants, based onthe NBS wire scale and calibration at the triple point of water and the freezingpoint of tin (and the freezing point of zinc for the long-stem SPRT).
*** These values were calculated from IPTS-68 calibration constants determinedfrom fixed points.
Table 9. Values of W( T68) and W( T0) for various fixed-point temperatures T68 and
Table 8. Example of conversion of calibrations of SPRT’s on the IPTS-68 toapproximate calibrations on the ITS-90
Capsule SPRT, S/N 1812284 : e-H 2 TP to Sn FP
IPTS-68 CALIBRATION CONSTANTS
R(0 ˚C) = 25.4964808 a = 3.9262754x10 -3 d = 1.4964667A1 = 1.6314209x10 -4 B1 = -8.7377446x10 -7 C1 = 4.0321350x10 -7
D1 = 1.4525327x10 -4
A2 = 2.1616630x10 -4 B2 = -1.7113512x10 -7 C2 = 6.6163769x10 -8
D2 = 2.2572375x10 -10
A3 = 4.5449999x10 -7 B3 = -7.7242433x10 -6 C3 = 3.9028516x10 -8
A4 = 3.0860000xl0 -7 C4 = 1.0880791x10 -4
ITS-90 CALIBRATION CONSTANTS CONVERTED FROM THE IPTS-68 CONSTANTS
R(273.16) = 25.4974973
a1 = -2.5239001x10 -4 b1 = 1.2277862x10 -4 C1 = -2.3783015x10 -6
ag = -2.5287142x10 -4 bg = 1.1130131x10 -5 C2 = -4.3892024x10 -6
C3 = -1.5608728x10 -6
C4 = -2.1374663x10 -7
C5 = -1.0344171x10 -8
Long-Stem SPRT. SIN RS8YA-5 : Ar TP to Zn FP
IPTS-68 CALIBRATION CONSTANTS
R(0 ˚C) = 25.5086208 A = 3.9856609x10 -3 B = -5.8762238x10 -6
a = 3.9268986x10 -3 d = 1.49640322A4 = 2.6581418x10 -14 C4 = 9.3183900x10 -7
ITS-90 CALIBRATION CONSTANTS CONVERTED FROM THE IPTS-68 CONSTANTS
R(273.16 K) = 25.5096386a4 = -9.3225823x10 -5 b4 = -9.9914440x10 -6
a8 = -9.1058813x10 -5 b8 = -7.6061559x10 -6
Z-178
Z
4.3.4 UNCERTAINTIES OF CALIBRATIONS AND THEIR PROPAGATION
Both systematic and random errors of measurements introduced in a calibrationare propagated throughout the temperature range of the calibration. It is thetotal uncertainty arising from both of these types of errors, however, that isof interest to the customer and user of a calibrated thermometer. Internationalcomparisons of fixed-point cells below 90 K [79] and other data suggest that theuncertainties (at the 10 level) in the realizations of the defining fixed pointsof the ITS-90 are about ± 0.2 mK for the triple points 0f hydrogen and neon, ±0.1 mK for the triple point of oxygen through the melting point of gallium, ±0.7 K at the freezing point of indium, ± 1 mK from the freezing point of tinthrough the freezing point of aluminum, and ± 2 mK for the freezing point ofsilver.
The uncertainty of temperature measurements in the liquid helium range (0.65 Kto 5.0 K) resul ts f rom the uncerta inty of the hel ium vapor-pressuremeasurements. The uncertainty (at the 1 o level) throughout this range oftemperature is estimated to be approximately ± 0.1 mK to ± 0.2 mK.
For the CVGT, the uncertainty in the measured temperature over its temperaturerange (3.0 K to 24. 5561 K) arises from uncertainties of realizations of thetriple points of neon and of equilibrium hydrogen, of the measurement of theCVGT gas pressure and of the measurement of the vapor pressure of helium. Theuncertainty (at the 1 o level) throughout this range of temperature is estimatedto be approximately ± 0.1 mK to ± 0.2 mK. Uncertainties introduced by aparticular CVGT design may add to these uncertainties.
In the calibration of SPRT’s over any given subrange, the possible error in therealization of each of the fixed points and any error of measurement must beconsidered and they will be propagated independently of that incurred at theother fixed points involved. The total uncertainty of measurements at a giventemperature is then the root-mean-square of the appropriate contributinguncertainties. Curve, showing the propagation of a ± (unit error ) incurred ateach of the defining fixed points of the two major ranges are shown in figures19 and 20. Figure 19 shows the propagation of errors associated with the fixedpoint, below 213.16 K; and figure 20 shows curves for the fixed points used inthe calibration of SPRT’s in the range from 273.15 K to 1234.93 K. The labelson the various curves indicate the fixed-point in which there is the unit errorin its temperature, and the other fixed points without error. As an example,consider the curve labelled Sn(Ag, Al, Zn) of figure 20. The symbol Sn indicatesthat the unit error occurs in the Sn freezing-point temperature; that is clearlyindicated by a unit offset of the curve at that point. The symbols inparenthesis,i.e., (Ag, Al, Zn), indicate that the Ag, Al, and Zn freezing pointswere made at those fixed-point temperatures without error. Also, it is assumedthat the measurements at the triple point of water were without error. The otherlabelled curves are similarly interpreted. The straight lines labelled TPW showthe errors propagated for an error of ± 0.1 mK made by the user in the triplepoint of water.
4.3.5 ESTIMATES OF POSSIBLE ERRORS INTRODUCED BY EXTRAPOLATIONS BEYOND THERANGE OF CALIBRATION
It is unwise and is poor practice to use any thermometer beyond the temperaturerange over which it was calibrated. Nevertheless, some users persist in doingjust that. In some cases, especially if the extrapolation is for only a fewkelvins, the error introduced may be rather small. The errors of some typicalextrapolations calculated and depicted for NIST SPRT’s, are shown in figures21, 22, 23, 24, and 25.
The curve in figure 21 shows the error introduced for a NIST SPRT byextrapolating the deviation function, determined from calibration over the rangefrom the triple point of argon to the triple point of water, downward from theargon triple point to 54 K. Extrapolating downward to about the boiling pointof nitrogen (77 K) results in a fairly insignificant error in this case and,thus, can be done with the usual caution that some thermometers may not be asgood as that of figure 21.
Figure 22 depicts the results for another NIST SPRT. The curve shows the errorintroduced by extrapolating the deviation function, determined from calibrationover the range from the triple point of mercury to the melting point of gallium,downward from the mercury triple point to 84 K.
Figure 23 displays the results for the same NIST SPRT as used for figure 22, butthe curve in this case shows the error introduced by extrapolating the deviationfunction, determined from calibration over the range from the triple point ofmercury to the melting point of gallium, downward from the mercury triple pointto only 200 K. A sizable error is shown for observations that would be made atDry Ice temperatures (-78 ˚C).
Figure 24 depicts the results for several NIST SPRT’s, but the curves in thiscase show the errors introduced by extrapolating their deviation functions,determined from calibration over the range from the triple point of water to thefreezing point of zinc, downward from the triple point of water to -50 ˚C.
Figure 25 displays the results for several NIST SPRT’s, but in this case thecurves show the errors introduced by extrapolating their deviation functions,determined from calibration over the range from the triple point of water to thefreezing point of zinc, upward from the freezing point of zinc to 934 K (660 ˚C).
As a general rule and good practice, one should never extrapolate any of theITS-90 deviation functions beyond their range of application. If however, theestimated uncertainty introduced by extrapolating a deviation function beyondthe range of calibration is acceptable, then the user may do so, but with theknowledge that his thermometer may yield results with a larger uncertainty thanthat estimated. The user that makes such extrapolations should realize that notall SPRT’s wi1l behave as indicated in figures 21 through 25. The resultsdepicted in these figures are examples only and are valid for only those SPRT’sindicated. Other SPRT’s may be better or worse.
obtained may then be used with the appropriate relations described in section 2to obtain the constants of the ITS-90 deviation equations for the SPRT’s. Intab1e 8 we list the value of the deviation constants that were calculated from thesample data presented there. For comparison, values of the conversion from W( T68) to
W(T90) as well as measured values of W( T90), for the various relevant fixed-point
temperatures T68 and T90, respectively, are given in table 9. The deviations in the
values of the last two columns of table 9 for the capsule SPRT reflect theinconsistency between the NBS-IPTS-68(75) wire scale and the difference betweenthe IPTS-68(75) and the ITS-90 as given in table 1. Note that for the long-stemSPRT, the zero deviations for tin and zinc are a consequence of those fixedpoints having been used in both cases and the
conversion process having been consistent. The deviations for the other fixedpoints (Ar, Hg, Ga, and In) reflect the non-uniqueness of this SPRT and possibleerrors incurred in measurements at those fixed points.
The results of tables 8 and 9 for the long-stem SPRT, with regard to thedifferences between temperatures determined from an actual ITS-90 calibrationand those deterimined from an IPTS-68 calibration but then calculated forapproximate ITS-90 values, are shown in figure 18. Note that at temperaturesabove 273.16 K. the zero deviation of figure 18 is a consequence of the fact thatthe same fixed points (tin and zinc ) have been used in both cases and theconversion process having been consistent.

Z-179
1.5
1.0
0.5
0.0
-0.5
-1.0
-1.5
1.5
1.0
0.5
0.0
-0.5
-1.0
-1.5
250 350 450 550 650 750 850 950 1050 1150 1250
Temperature, K
Error in degreesper degree error in calibration
ITS-90 Propagation of Calibration Errorsin Platinum Resistance Thermometry
Sn(Ag,Al,Zn)Zn(Ag,Al,Sn)
Al(Ag,Zn,Sn)
Ag(Al,Zn,Sn)
TPW
Guidelines for Realizing the ITS-90 Cont’d
Figure 19. Propagation of errors from errors of calibration of SPRT’s between 13.8033 K and273.16 K. The curves show the error in the temperature values caused by a unit positive or unitnegative error of calibration at each of the fixed points in the range, namely, the triple pointsof equilibrium hydrogen, neon, oxygen, argon, and mercury. The calibration at the triple point ofwater is assumed to have been made without error. The curves are identified by the fixed point
ITS-90 Propagation of Calibration Errors in Platinum Resistance Thermometry
errorin mK
2.0
1.5
1.0
0.5
0.0
-0.5
-1.0
-1.5
-2.0
2.0
1.5
1.0
0.5
0.0
-0.5
-1.0
-1.5
-2.0
2.0
1.5
1.0
0.5
0.0
-0.5
-1.0
-1.5
-2.0
Temperature, K
0 25 50 75 100 125 150 175 200 225 250 275
20.3(e-H2, 17, Ne, O2, Ar, Hg)
17(e-H2, 17, Ne, O2, Ar, Hg)Ar(e-H2, 17, 20.3, Ne, O2, Hg)
Hg(e-H2, 17, 20.3, Ne, O2, Ar)
e-H2(17, 20.3, Ne, O2, Ar, Hg)
O2(e-H2, 17, 20.3, Ne, Hg, Ar)
Ne(e-H2, 17, 20.3, O2, Ar, Hg)
Figure 20. Propagation of errors from errors of calibration of SPRT’s between 273.15 K and1234.93 K. The curves show the error in the temperature values caused by a unit positive or unitnegative error of calibration at each of the fixed points in the range, namely, gallium, indium,tin, zinc, aluminum, and silver points. The calibration at the triple point of water is assumed tohave been made without error. The curves are identified by the fixed point with error outside theparenthesis and the three fixed points without error inside the parenthesis. Also included in thisfigure are error curves for errors made by the user at the triple point of water; these curves

Z-180
Z
Figure 21. Error curve for a NIST SPRT; the curve shows the error introduced by extrapolating itsdeviation function, determined from calibration over the range from the triple point of argon tothe triple point of water, downward from the triple point of argon to 54K.
ITS-90, 25.2 ohm Capsule PRT 1812284Oxygen Subrange - Extrapolated Argon Subrange
0.1
0.0
-0.1
-0.2
-0.3
-0.4errorin mK
-0.5
-0.6
-0.7
-0.8
-0.9
-1.0
50 75 100 125 150
Temperature, K
175 200 225 250 275
-1.0
-0.9
-0.8
-0.7
-0.6
-0.5
-0.4
-0.3
-0.2
-0.1
0.0
0.1
ITS-90, Chino Model R800-2, RS8YA-5, 25.5 ohmAr to T3 Subrange - Extrapolated Hg to Ga Subrange
20
15
10
errorin mK
5
0
-5
275250225200175150
Temperature, K
12510075
50
15
10
5
0
-5
Figure 22. Curve for a NIST SPRT that shows the error introduced by extrapolating its deviationfunction, determined from calibration over the range from the triple point of mercury to themelting point of gallium, downward from the triple point of mercury to 84K

Z-181
ITS-90, Chino Model R800-2, RS8YA-5, 25.5 ohmAr to T3 Subrange - Extrapolated Hg to Ga Subrange
1.5
1.0
0.5errorin mK
0.0
-0.5
200 205 210 215 220 225 230 235 245
Temperature, K
250 255 260 265 270 275
-0.5
0.0
0.5
1.0
1.5
240
Guidelines for Realizing the ITS-90 Cont’d
Figure 23. Curve for the NIST SPRT of figure 22 that shows the error introduced by extrapolatingits deviation function, determined from calibration over the range from the triple point ofmercury to the melting point of gallium, downward from the triple point of mercury to only 200 K.
Figure 25. Curves for several NIST SPRT’s that show the errors introduced by extrapolating theirdeviation functions, determined from calibration over the range from the triple point of water tothe freezing point of zinc, downward to the triple point of water to -50˚C.
0.0
-0.5
-1.0
-1.5
-2.0
-2.5
-3.0
Temperature, °C
errorin m°C
-3.0
-2.5
-2.0
-1.5
-1.0
-0.5
0.0
ITS-90, 25.5 ohm PRTsAr Subrange - Extrapolated Zn Subrange
-50 -45 -40 -35 -30 -25 -20 -15 -10 -5 0
30
31
32
34
35

Z-182
Z
4.4 THERMOCOUPLES (77 K TO 2400 K)
There are numerous letter-designated types of thermocouples. The Type Sthermocouple was the standard instrument of the IPTS-68(75) in the range from630.74 ˚C to 1064.43 ˚C, but it is not a standard instrument of the ITS-90.Customer thermocouples are calibrated at NIST by using a set of temperaturefixed points, by comparison with SPRT’s, or by comparison with reference-standard thermocouples that have been calibrated either by comparison with anSPRT or a radiation pyrometer, or through the use of fixed points. For detailsof the calibration procedures and of the uncertainties involved, see NIST SP250-35 [22] and NIST Monograph 175 (23] (or Monograph 125 (82]).
Usually, the calibration data for most types of thermocouples are analyzedrelative to reference tables, such as those given in NBS Monograph 125 [82].Monograph 125, of course, has reference tables for thermocouples based on theIPTS-68(75). This monograph has been revised and updated to give referencetables for all letter-designated thermocouples based on the ITS-90. The revisedversion of Monograph 125 is Monograph 175 (23) and it supersedes Monograph 125.
The electromotive-force-temperature data for a thermocouple calibrated on theIPTS-68(75) can be converted to an approximate ITS-90 calibration through theuse of the differences ( t 90 - t 68,) given in table 1 of this document and the Svalues in mV/˚C for the relevant thermocouple given in Monograph 175 orMonograph 125. An example of this conversion is given in table 10. A typicalcalibration report is presented in appendix 3 (see sec. 6.3.8).
4.5 LIQUID-IN-GLASS THERMOMETERS
Liquid-in-glass thermometers have uncertainties of realization as small as ± 30mK in the temperature range from 0˚C to about 100 ˚C, but deteriorates atlower and higher temperaures. Liquid-in-glass (primarily,Mercury-in-glass)thermometers are calibrated at NIST by comparison with SPRT’s in liquid baths ofvarious kinds that cover different temperature ranges. For details of thecalibration procedures and of the uncertainties involved, see NIST SP 250-23(105]. An example of a calibration report, based on the IPTS-68(75), of aliquid-in-glass thermometer is given in appendix 3 (see sec. 6.3.9). Acalibration report for the same thermometer, with the IPTS-68(75) calibrationconverted to an approximate ITS-90 calibration through the use of (t 90 - t 68)differences given in table 7 is given also in appendix 3 (see sec. 6.3.10).
4.6 INDUSTRIAL PLATINUM RESISTANCE THERMOMETERS
Industrial platinum resistance thermometers (IPRT’s) are designed primarily foruse in the temperature range from about 77 K (approximate liquid nitrogenboiling point) to 500 ˚C. Typically, the manufacturer of IPRT’s quotes minimuminstabi l i t ies of the IPRTs at the ± 0. 1 K level over this range oftemperatures. Some IPRT’s may be somewhat better than this but others may beconsiderably worse. As seen from table 1, the maximum difference of (T 9o - T 68)below 500˚C is about 0.08 K, and therefore the difference in temperature due to the change in temperature scales is within theinstability of many IPRT’s. Continued use of the IPTS-68(75) and of equationsand standards [American Society for Test ing and Mater ia ls (ASTM)Standard,E1137,and International ElectrotechnicalCommission (IEC) Standard,Publication 751] referenced to the IPTS-68(75),therefore, would result in anincrease in uncertainty of temperature of only about 0.1 K if the temperature
Figure 25. Curves for several NIST SPRT’s that show the errors introduced by extrapolating theirdeviation functions, determined from calibration over the range from the triple point of water tothe freezing point of zinc, upward from the freezing point of zinc to 934 K (660˚C). Also shown aresubrange inconsistencies for the subrange triple point of water to zinc, relative to the subrange
Table 10. Example of a conversion of calibration values of a type K thermocoupleon the IPTS-68 to an approximate calibration on the ITS-90
were expressed as being on the ITS-90. (Note: the ASTM and the IEC areconverting their respective IPRT tables from the IPTS-68(75) to the ITS-90. ASTMCommittee E-20 on Temperature Measurements is responsible for this conversionfor the ASTM).
When IPRT’s are calibrated on the ITS-90, of course, they may be calibrated inthe same manner as is used for SPRT’s. A better method of calibrating IPRT’s,however, is to obtain resistance-temperature data by comparison with acalibrated SPRT at numerous temperatures the range of interest and then fit apolynomial in t 9o to R( t 90 ) /R(0˚C),or to R( t 90 ) /R(0.0l ˚C) data by a least squares technique.
4.7 THERMISTOR THERMOMETERS, DIGITAL THERMOMETERS, AND OTHER TYPES OFTHERMOMETERS.
Thermistor thermometers, digital thermometers (with resistance, thermocouple, ordiode sensors), and other types of thermometers are calibrated at NIST bycomparison with SPRT’s in liquid baths. The calibration procedures followed aresimilar to those used with liquid-in-glass thermometers. The uncertainties ofcalibration range from as small as ± 2 mk for thermistor thermometers to tenths
Calibration Values Calibration Valueson IPTS-68 on IPTS-90
t 68 emf68 S t 90- t 68 ∆ t 90 emf90a
(˚C) (mV) (mV/˚C) (˚C) [-S•( t 90- t 68)] (˚C) (mV)Monograph Table 1 (mV)
1250.0 0.000 0.0395 0.000 0.000 0.0 0.000
100.0 4.092 0.414 -0.026 -0.001 100.0 4.093200.0 8.130 0.0400 -0.040 -0.002 200.0 8.132300.0 12.195 0.0415 -0.039 -0.002 300.0 12.197400.0 16.383 0.0422 -0.048 -0.002 400.0 16.385500.0 20.633 0.0426 -0.079 -0.003 500.0 20.636600.0 24.904 0.0425 -0.115 -0.005 600.0 24.909700.0 29.136 0.0419 0.20 0.008 700.0 29.128800.0 33.288 0.0410 0.34 0.014 800.0 29.128900.0 37.338 0.0400 -0.01 0.000 900.0 37.338
1000.0 41.281 0.0389 -0.19 -0.007 1000.0 41.2881100.0 45.118 0.0378 -0.26 -0.010 1100.0 45.128
a emf90 - emf68 - ∆
3 . 0
2 . 0
1 . 0
0 . 0
1 . 0--
2 . 0--
3 . 0--
4 . 0--
5 . 0--
3 . 0
2 . 0
1 . 0
0 . 0
1 . 0--
2 . 0--
3 . 0--
4 . 0--
5 . 0--
32
35
34
33
31
30
errorin mK
ITS-90, 25.5 ohm PRT’sAl Subrange - Extrapolated Zn Subrange
Temperature, K
250 350 450 550 650 750 850 950

Z-183
Guidelines for Realizing the ITS-90 Cont’d
5. REFERENCES
[1] Ancsin, J., Vapour Pressures and Triple Point of Neon and the Influenceof Impurities on these Properties, Metrologia 14 , 1-7 (1978)
[2] Ancsin, J., Thermometric Fixed Points of Hydrogen, Metrologia 13 , 79-86(1977)
[3] Ancsin, J., A Study of the Realization of the Melting and Freezing Points ofsilver, Metrologia 26 , 167-174 (1989).
[4] Ancsin, J., Melting Curves and Heat of Fusion of Indium , Metrologia 21, 7-9(19 85).
[5] Barber, C. R., Handley, R. and Herington, E . F. G. The Preparation and Useof Cells for the Realization of the Triple Point of Water , Brit. J. Appl Phys..2, 41-44 (1954).
[6] Barber, C. R. , A Proposal for a Practical Scale of Temperature Below 20 K,Temperature , . Its Measurement and Control in Science and Industry , Edited by H.H. Plumb, Vol. 4, Part 1, pp. 99-103 (Instrument Society of America, Pittsburgh,1972).
[7] Barrick, P. L., Brown, L. F., Hutchinson, H. L., and Cruse, R. L.,ImprovedFerric Oxide Gel Catalysts for Ortho-Parahydrogen Conversion, Edited by K. D.Timmerhaus, Vol. 10, paper D-1, 131-189 (Plenum Press, New York, NY, 1965).
[8] Bauer, G., and Bischoff, K., Evaluation of the Emissivity of a Cavity Sourceby Reflection Measurements, Applied Optics 10 , 2639-2643 (1971).
[9] Bedford, R.E. , Effective Emissivities of Blackbod Cavities – A Review,Temperature , Its Measurement and Control in Science and Industry , Edited by H. H.Plumb, Vol. 4, Part 1, pp. 425-434 (Instrument Society of America, Pittsburgh,PA, 1972).
[10] Bedford , R. E . and Ma, C. K., Emissivities of Diffuse Cavities, II:Isothermal and Nonisothermal Cylindro-cones, J. Opt. Soc. Am. 65, 565-572 (1974).
[11] Bedford , R. E. and Ma, C. K., Emissivities of Diffuse Cavities: Isothermaland Nonisothermal Cones and Cylinders, J. Opt. Soc. Am. 64, 339-349 (1974).
[12] Belecki, N. B., Dziuba R. F., Field, B.F., and Taylor, B. N., Guidelines forImplementing the New Representations of the Volt and Ohm Effective January 1,1990, NIST Technical Note 1263 (June 1989).
[13] Berry , K. H. NPL- 75: A Low Temperature Gas Thermometry Scale from 2. 6 Kto 27 . 1 K, Metrologia 15 89 -115 (1979).
[14] BIPM Com. Cons. Thermometrie, 17, 1989, in press.
[15] Bongiovanni, G., Crovini, L. and Marcarino P., Effects of Dissolved Oxygenand Freezing Techniques on the Silver Point, Metrologia 11, 125-132 (1975).
[16] Bonhoure, J. and Pello, R., Temperature du Point Triple du Gallium,Metrologia 19 15-20 (1983).
[17] Bonhoure, J. and Pello, R. , Points Triples de l’Argon et du Methane:Utilisation de Cellules Scellees, Metrologia 16 95-99 (1980).
[18] Bonhoure, J. and Pello, R., Temperature of the Triple Point of Methane,Metrologia 14 1 75-177 (1978).
[19] Bonhoure, J. and Terrien, J. , The New Manobarometer of the BureauInternational des Poids et Mesures, Metrologia A, 59-68 (1968).
[20] Bonnier, G. and Hermier, Y. , Thermal behavior of thermometric sealed cellsand of a multi-compartment cell, Temperature , Its Measurement and Control inScience and Industry , Edited by J . F . Schooley, Vol. 5, Part 1, pp. 231-237(American Institute of Physics, New York, 1982).
[21] Bonnier, G. and Moser, A., Development at the Institut National deMetrologie of sealed cells as IPTS fixed points, Measurement (IMEKO) 1 143-151(1983).
[22] Burns , G. W. and Scroger, M. G., The Calibration of Thermocouples andThermocouple Materials, NIST Special Publication 250-35 (April 1989).
[23] Burns, G. W. and Scroger, M. G. , Temperature-electromotive Force ReferenceFunctions and Tables for Letter-designated Thermocouple Types Based on the ITS-90, NI ST Monograph 175 (1990).
[24] Cataland, G., Edlow, M. H., and Plumb, H. H., Recent Experiments on LiquidHelium Vapor Pressure Measurements from 2 ˚K to 4 ˚K, Temperature , ItsMeasurement and Control in Science and Industry , Edited by F. G. Brickwedde, Vol.3, Part 1, pp. 413-417 (Reinhold Publishing Corporation, New York, 1962).
[25] Chappuis, P., Etudes sur le Thermometre a Gaz et Comparison des Thermometresa Mercure avec le Thermometre a Ga., Trav. et Mem. BIPM 6 1-125 plus 187 pages ofobservations (1888).
[26] Chattle , M. V., Rusby , R. L., Bonnier, G., Moser, A., Renaot, E.,Marcarino, P., Bongiovanni, G., and Frassineti, G., An intercomparison of galliumfixed point cells Temperature , Its Measurement and Control in Science andIndustry , Edited by J. F. Schooley, Vol. 5, Part 1, pp. 311-316 (AmericanInstitute of Physics, New York, 1982).
(27] Coates . B. and Andrews , J. W., A precise determination of the freezingpoint of copper, J. Phys. F: Metal Phys., a, 277-285 (1978).
[28] Coates, P. B. , The NPL photon-counting pyrometer, Temperature Measurement,1975 , The Institute of Physics Conference Series Number 26, Edited by B. F.Billing and T. J. Quinn, Chapter 5, pp. 238-243 (The Institute of Physics,London, 1975).
of kelvins for the others. The temperatures of calibration for these typesofthermometers usually lie somewhere within the range from about 77 K to 850 KBead-in-glass probe type thermistors used in the moderate temperature range arequite stable and they may be used to approximate the ITS-90 at a level of about± 1 . 5mK to ± 2.0 mK [67] . In their case , a polynomial, the degree of whichdepends on the temperature range of the calibration, is fitted to resistance-temperature data and the results reported in terms of that polynomial. Acalibration on the IPTS-68 (75) may be converted to an approximate ITS-90calibration by the same procedure as outlined for RIRT’s .
4.8 THE LOGO OF THE NATIONAL CONFERENCE OF STANDARDS LABORATORIES FOR THE ITS-90
The National Conference of Standards Laboratories (NCSL) formed an Ad HocCommittee on the Change of the Temperature Scale at the beginning of l988 inorder to publicize the new temperature scale (ITS-90) and to facilitate itsimplementation. At the NCSL meeting in July 1989, the Ad Hoc Committee adopted alogo available from the NCSL [1800 30th Street, Suite 305B , Boulder, CO 80301,Tel. (303) 440-3339 ] , that may be affixed to thermometers that have beencalibrated on the ITS-90. The purpose of the logo, illustrated in figure 26, isto indicate at a glance, without having to refer to documentation, thosethermometers in a laboratory that have been calibrated on the new scale. This isparticularly useful for those laboratories that have their various thermometerscalibrated on a prescribed schedule, with different thermometers being
Figure 26. The NCSL ITS-90 logo.

Z-184
Z
[29] Comptes Rendus des Seances de la Dix-huitieme Conference Generale des Poidset Mesures, Resolution 7, p. 101 (1987).
[30] Comptes Rendus des Seances de la Dixieme Conference Generale des Poids etMesures, Resolution 3, p. 79 (1954).
[31) Compton,J. P., The Realization of Low Temperature Fixed Points,Temperature, Its Measurement And Control in Science and Industry , Edited by H.H. Plumb, Vol. 4, Part 1, pp. 195-209 (Instrument Society of America, Pittsburgh,PA, 1972).
[32] Compton,J. P. and Ward,S. D., Realization of the Boiling and Triple Pointsof Oxygen, Metrologia 12 , 101-113 (1976).
[33] Darling, A. S. and Selman, G. L., Some Effects of Environment on thePerformance of Noble Metal Thermometers, Temperature, Its Measurement andcontrol in Science and Industry , Edited by H. H. Plumb, Vol. 4, Part 3, pp. 1633-1644 (Instrument Society of America, Pittsburgh, PA, 1972).
[34] DeWitt, D. P. and Nutter, G. D., Theory and Practice of RadiationThermometry (John Wiley and Sons, Inc., New York, NY, 1988).
[35] DeWitt, D. P. and Hernicz, R. S., Theory and Measurement of EmittanceProperties for Radiation Thermometry Applications, Temperature, Its Measurementand Control in Science and Industry , Edited by H. H. Plumb, Vol. 4, Part 1, pp.459-482 (Instrument Society of America, Pittsburgh, PA, 1972).
[36] Ditmars, D. A. and G. T. Furukawa, Detection and Damping of Thermal-acoustic Oscillations in Low-temperature Measurements, J. Res. Natl. Bur. Stands.69C, 35-38 (1965).
[37] Durieux, M., and Rusby, R. L., Helium Vapour Pressure Equations on theEPT-76, Metrologia 19 , 67-72, (1983).
[38] Durieux, M., van Dijk, J. E., ter Harmsel, H., Rem, P. C., and Rusby, R.L., Helium Vapor Pressure Equations on the EPT-76, Temperature, Its Measurementand Control In Science and Industry , Edited by J. F. Schooley, Vol. 5, Part 1,pp. 145-154 (American Institute of Physics, New York, 1982).
[39] Elliott, R. P., Constitution of Binary Alloys, First Supplement (McGraw-Hill Book Company, New York, NY, 1965).
[40) Ferguson, J. A., Realization of the Triple Point of Water, J. Phys. E: Sci.Instrum. 3 , 447-451 (1970).
[41] Furukawa, G. T., Reproducibility of the Triple Point of Argon in SealedTransportable Cells, Temperature. Its Measurement and Control in Science andIndustry , Edited by J. F. Schooley, Vol. 5, Part 1, pp. 239-248 (AmericanInstitute of Physics, New York, NY, 1982).
[42] Furukawa, G. T., Bigge, W. R., And Riddle, J. L., Triple Point of Argon,Temperature. Its Measurement and Co control in Science and Industry, Edited by H.H. Plumb, Vol. 4, Part 1, pp. 231-243 (Instrument Society of America, Pittsburgh,PA, 1972).
[43] Furukawa, G. T., Riddle, J. L., Bigge. W. R., and Pfeiffer, E. R.,Application of Some Metal SRM’s as Thermometric Fixed Points, NBS SpecialPublication 260-77, 140 pages, August 1982.
[44) Furukawa, G. T., Piccirelli, J. H., Reilly, M. L., Cryoscopic Determinationof the Purity of Benzene by Calorimetry, Purity Determinations by the ThermalMethods , Edited by R. L. Blaine and C. K. Schoff, pp. 90-106 (American Societyfor Testing and Materials, Philadelphia, PA, 1984).
[45] Furukawa, G. T., Investigation of Freezing Temperatures of National Bureauof Standards Aluminum Standards, J. Res. Natl. Bur. Stand. (U.S.) 78A 477-495(1974).
[46] Furukawa, G. T., Riddle, R. L., and Bigge, W. R., Investigation of freezingtemperatures of National Bureau of Standards tin standards, Temperature, ItsMeasurement and Control in Science and Industry , Edited by H. H. Plumb, Vol. 4,Part 1,pp. 247-263 (Instrument Society of America, Pittsburgh, PA, 1972).
[47] Furukawa, G. T., The Triple Point of Oxygen in Sealed Transportable Cells,J. Res. Natl. Bur. Stands. (U.S.) 91 , 255-275 (1986).
[48] Gordon, C. L. and Wichers, E., Purification of Mercury and Its PhysicalProperties, Ann. New York Acad. Sci. 65 369-387 (1957).
[49] Guildner, L. A. and Edsinger, R. E., Deviation of International PracticalTemperatures from Thermodynamic Temperatures in the Temperature Range from273.16 K to 730 K, J. Res. Bur. Stands. 80A , 703-738 (1976).
[50] Guildner, L. A., Stimson, H. F., Edsinger, R. E., and Anderson, R. L., AnAccurate Mercury Manometer for NBS Gas The Thermometer, Metrologia 6 1-18 (1970).
[51] Hansen,. M. , Constitution of Binary Alloys (McGraw-Hill Book Company, Inc.New York, NY, 1958).
[52] Harrison, E. R., Hatt, D. J. Prowse, D. B., and Wilbur-Ham, J., A NewInterferometric Manometer, Metrologia 12 115-122 (1976).
[53] Jangg, G. and Palman, H., Die Loslichkeit verschiedener Metalle in,Quecksilber, Zeit. Metallkde, 54 , 364-369 (1963).
[54] Jones, T. P. and Tapping, J., A photoelectric pyrometer temperature scalebelow 1064.43 *C and its use to measure the silver point, Temperature, ItsMeasurement and Control in Science and Industry , Edited by J. F. Schooley, Vol.5, Part 1, pp. 169-174 (American Institute of Physics, New York, 1982).
[55] Jones, T. P. and Tapping, J., The Determination of the ThermodynamicTemperatures of Thermometry Fixed Points in the Range 660 ˚C to 1064 ˚C,Metrologia 25 , 41-47 (1988).
[56] Jung, J. J., Determination of the difference between the thermodynamicfixed-point temperatures of gold and silver by radiation thermometry, TemperatureMeasurement. 1975 , The Institute of Physics Conference Series Number 26, Editedby B. F. Billing and T. J. Quinn, Chapter 5, pp. 278-286 (The Institute ofPhysics, London, 1975).
[57] Jung H J A Measurement of Thermodynamic Temperatures Between 683 K and 933 Kby an Infrared Pyrometer, Metrologia 23 , 19-31 (1986).
[58] Kemp,R. C. and Kemp, W. R. G., The Triple Point, Boiling Point and 17 KPoint of Equilibrium Hydrogen, Metrologia 15 , 155-159 (1979).
[59] Kemp,R. C., Kemp, W. R. C., and Cowan, J. A., The Boiling Points andTriple Points of Oxygen and Argon, Metrologia 12 93-100 (1976).
[60] Kemp, R. C., Kemp, W. R. G., and Besley, L. M., A Determination ofThermodynamic Temperatures and Measurements of the Second Virial Coefficient of4He Between 13.81 K and 287 K Using a Constant-Volume Gas Thermometer, Metrologia23, 61-86 (1986/87)
[61] Klein, H. H., Klempt, G., and Storm, L., Measurement of the ThermodynamicTemperature of 4He at Various Vapour Pressures by a Noise Thermometer, Metrologia15, 143-154 (1979).
[62] Lee, R. D., Construction and Operation of a Simple High-Precision Copper-Point Blackbody and Furnace, NBS Technical Note 483, May 1969.
[63] Maghenzani, R., Molinar, G. F., Marzola, L., and Kulshrestha, R. K.,Pressure Metrology up to 5 MPa in Different Gas Media, J. Phys. E: Sci. Instrum.20, 1173-1179 (1987).
[64] Mangum, B. W., Platinum Resistance Thermometer Calibrations, NBS SpecialPublication 250-22 (October 1987).
[65) Mangum, B. W., Triple point of gallium as a temperature fixed point,Temperature, Its Measurement and Control in Science and Industry , Edited by J.F. Schooley, Vol. 5, Part 1, pp. 299-309 (American Institute of Physic, NewYork, 1982).
[66] Mangum, B. W., Special Report on the international Temperature Scale of1990; Report on the l7th Session of the Consultative Committee on Thermometry, J.Res. Natl. Inst. Stand. Technol. 95, 69-77 (1990).
[67] Mangum, B. W., Triple point of succinonitrile and its use in thecalibration of thermistor thermometers, Rev. Sci. Instrum. 54, 1687-1692 (1983).
[68] Mangum B., W. and Thornton, D. D., Determination of the Triple-PointTemperature of Gallium, Meirologia 15 , 201-215 (1979).
[69] Mangum. A. W. Determination of the Indium Freezing-point, and Triple-pointTemperature., Netrologia 26 211-217 (1989).
[70] McAllan, J. V. and Ammar, M. M., Comparison of the freezing points ofaluminum and antimony, Temperature, Its Measurement and Control in Science andIndustry , Edited by H. 14. Plumb Vol. 4, Part 1, pp. 273-285 (Instrument Societyof America, Pittsburgh, PA, 1972).
[71] McConvil le, G. T., The Effect of the Measuring Tube Surface onThermomolecular Pressure Corrections in Vapor Pressure Thermometry, Temperature,Its Measurement and Control in Science and Industry , Edited by H. H. Plumb, Vol.4, Part 1, pp. 159-165 (Instrument Society of America, Pittsburgh, PA, 1972).
[72] McLachlan, A. D., Uchiyama, H., Saino, T., and Nakaya, S., The Stabilityof the Freezing Point of Copper as a Temperature Standard, Temperature , ItsMeasurement and Control in Science and Industry , Edited by H. H. Plumb, Vol. 4,Part 1, pp. 287-293 (Instrument Society of America, Pittsburgh, PA, 1972).
[73] McLaren, E. H., The Freezing Points of High Purity Metals as PrecisionTemperature Standards. II. An I Investigation of the Freezing Temperatures ofZinc, Cadmium, and Tin, Can. J. Phys. 35, 1086-1106 (1957).
[74] McLaren, E. H., The Freezing Points of High Purity Metals as PrecisionTemperature Standards. IV. Indium: Thermal Analyses on Three Grades ofCadmium, Can. J. Phys. 36 , 1131-1147 (1958).
[75] McLaren, E. H., The Freezing Points of High Purity Metals as PrecisionTemperature Standards. III. Thermal Analysis on Eight Grades of Zinc withPurities Greater than 99.99+%, Can. J. Phys. 36 , 585-598 (1958).
[76] McLaren, E. H. and Murdock, E. G., The Freezing Points of High PurityMetals as Precision Temperature Standards. V. Thermal Analyses on 10 Samplesof Tin with Purities Greater than 99.99+%, Can. J. Phys. 38 , 100-118 (1960).
[77] Ohtsuka, M. and Bedford, It. E., Measurement of the thermodynamictemperature interval between the freezing points of silver and copper,Temperature , Its Measurement and Control in Science and Industry , Edited by J.F. Schooley, Vol. 5, Part 1, pp. 175-181 (American Institute of Physics, NewYork, 1982).
[78] Orlova, M. P., Astrov, D. N., Shareskaya, D. I., Belyanskii, L. B.,Razhba, Ya. E., and Khnykov, V. M., Primary State Standard for the Unit ofTemperature, in the Range of 13.81-273.15 K, Measurement Techniques 16 477-482(1973).
[79] Pavese, F., Ancsin, J., Astrov, D. N., Bonhoure, J., Bonnier, G., Furukawa,G. T. , Kemp, R. C. , Maas, H. , Rusby, R. L. , Sakurai, H. , and Ling Shan-Kang,An International Intercomparison of Fixed Points by Means of Sealed Cells in theRanae 13.81 K - 90.686 K, Metrologia 20 , 127-144 (1984).

Z-185
Guidelines for Realizing the ITS-90 Cont’d
[80] Pavese.F., The Triple Points of Argon and Oxygen, Metrologia 14 , 93-103,(1978).
[81] Peggs, G., N., Elliott, K. W. T., and Lewis, S., An Intercomparison Betweena Primary Standard Mercury Barometer and a Gas-operated Pressure BalanceStandard, Metrologia 15 , 77-85 (1979).
[82] Powell, R. L., Hall, W. J., Hyink, H. Jr., Sparks, L. L., Burn., G. W.,Scroger M. G., and Plumb, H. H., Thermocouple Reference Tables Based on theIPTS-68, NBS Monograph 125 (March 1974).
[83] Preston-Thomas, H., The International Temperature Scale of 1990 (ITS-90),Metrologia 27, 3-10 (1990).
[84] Proces-Verbaux des Seances du Comite International des Poid. et Mesures,(78 • session, octobre 1989), in press.
[85] Quinn, T. J., News from the BIPM, Metrologia 26, 69-74 (1989).
[86] Quinn, T. J. and Chandler, T. R. D., The Freezing Point of PlatinumDetermined by the NPL Photoelectric Pyrometer, Temperature, Its Measurement andControl in Science and Industry . Edited by H. H . Plumb, Vol. 4, Part 1, pp.295- 309 (Instrument Society of America, Pittsburgh, PA, 1972).
1871 Quinn, T. J., Temperature (Academic Press, Inc., New York, N. Y. (1983).
[88] Ricci, J. E., The Phase Rule and Heterogeneous Equilibrium, (DoverPublications, Inc., New York, NY, 1966).
[89] Righini, F., Rosso, A., and Ruffino, G., Temperature Dependence ofEffective Wavelength in Optical Pyrometry, Temperature. Its, Measurement andControl in Science and Industry , Edited by H. H. Plumb, Vol. 4, Part 1, pp. 413-421 (Instrument Society of America, Pittsburgh, PA, 1972).
[90] Roberts, T. R., Sherman, R. H., and Sydoriak, S. G., The 1962 The Scale ofTemperatures III. Evaluation and Status, J. Res. Natl. Bur. Stands. 68A, 567-578(1964).
[91] Rusby, R. L. and Swenson, C. A., A New Determination of the Helium VapourPressure Scales Using a CMN Magnetic Thermometer and the NPL-75 Gas ThermometerScale, Metrologia-16, 73-87 (1980).
[92] Sawada, S., Realization of the triple point of Indium in a sealed glasscell, Temperature Its Measurement and Control in Science and Industry , Edited byJ. F. Schooley, Vol. 5, Part 1, pp. 343-346 (American Institute of Physics, NewYork 1982).
[93] . Simon,M ., On the Phase Separation in the Liquid System Ne-pH 2, Phys.Letters, 5, 319 (1963).
[94] Sostman, H. E., Melting point of gallium as a temperature calibrationstandard, Rev. Sci. Instrum . 41, 127-130 (1977).
[95] Sparrow, E. M., Albers, L. U., and Eckert, E. R. G., Thermal RadiationCharacteristics of Cylindrical Enclosures, J. Heat Transfer 04, 73-81 (1962).
[96] Steur, P. P. M. and Durieux, M., Constant-Volume Gas Thermometry Between 4 Kand 100 K, Metrologia 21, 1-18 (1986).
[97] Streett, W. B. and D. H. Jones, Liquid Phase Separation and Liquid-vaporEquilibrium in the System Neon-Hydrogen, J. Chem. Phys. 42, 3989-3994 (1965).
[98] Takiya, M., Precise Measurement of the Freezing Point of Silver with aPlatinum Resistance Thermometer, Comitee Consultatif de Thermometrie. 12thSession, Annexe T30, T154-T159 (1978).
[99] The 1976 Provisional 0.5.K to 30 K Temperature Scale, Metrologia 15, 65-68(1979).
[100] The International Practical Temperature Scale of 1968, Metrologia 5,35-44 (1969).
[101] The International Practical Temperature Scale of 1968, Amended Edition of 1975,Metrologia 12, 7-17 (1976)
[102] Weber,S. and Schmidt,G., Experimentel le Untersuchungen Ober dieThermomolekulare Druckdifferenz in der Nahe der Grenzbedingung P l /P 2 = (T 1/T 2) 1/2
und Vergleichung nit der Theorie, Leiden Communication 246C, 1-13 (1936).
[103] Weeks. J. R., Liquidus Curves and Corrosion of Fe, Cr , Ni, Co, V, Cb, Ta,Ti, Zr, in 500-750 ˚C Mercury, Corrosion 23, 98-106 (1967).
[104] Weitzel, D. H. and Park, 0. E., Iron Catalyst for Production of Liquidpara-Hydrogen, Rev. Sci. Instr. 27,57-58 (1956).
[105] Wise, Jacquelyn, Liquid-In-Glass Thermometer Calibration Service, NISTSpecial Publication 250-23 (September 1988).
Reproduced with permission of National Institute of Standards and Technology

One Omega Drive | Stamford, CT 06907 | 1-888-TC-OMEGA (1-888-826-6342) | [email protected]
www.omega.com
More than 100,000 Products Available!
CANADAwww.omega.caLaval(Quebec)
1-800-TC-OMEGA
UNITED KINGDOMwww. omega.co.uk
Manchester, England0800-488-488
GERMANYwww.omega.de
Deckenpfronn, Germany0800-8266342
FRANCEwww.omega.fr
Guyancourt, France088-466-342
BENELUXwww.omega.nl
Amstelveen, NL0800-099-33-44
UNITED STATESwww.omega.com
1-800-TC-OMEGAStamford, CT.
CZECH REPUBLICwww.omegaeng.cz
Karviná, Czech Republic596-311-899
TemperatureCalibrators, Connectors, General Test and Measurement Instruments, Glass Bulb Thermometers, Handheld Instruments for Temperature Measurement, Ice Point References, Indicating Labels, Crayons, Cements and Lacquers, Infrared Temperature Measurement Instruments, Recorders Relative Humidity Measurement Instruments, RTD Probes, Elements and Assemblies, Temperature & Process Meters, Timers and Counters, Temperature and Process Controllers and Power Switching Devices, Thermistor Elements, Probes and Assemblies,Thermocouples Thermowells and Head and Well Assemblies, Transmitters, Wire
Pressure, Strain and ForceDisplacement Transducers, Dynamic MeasurementForce Sensors, Instrumentation for Pressure and Strain Measurements, Load Cells, Pressure Gauges, Pressure Reference Section, Pressure Switches, Pressure Transducers, Proximity Transducers, Regulators, Strain Gages, Torque Transducers, Valves
pH and ConductivityConductivity Instrumentation, Dissolved Oxygen Instrumentation, Environmental Instrumentation, pH Electrodes and Instruments, Water and Soil Analysis Instrumentation
HeatersBand Heaters, Cartridge Heaters, Circulation Heaters, Comfort Heaters, Controllers, Meters and Switching Devices, Flexible Heaters, General Test and Measurement Instruments, Heater Hook-up Wire, Heating Cable Systems, Immersion Heaters, Process Air and Duct, Heaters, Radiant Heaters, Strip Heaters, Tubular Heaters
Flow and LevelAir Velocity Indicators, Doppler Flowmeters, Level Measurement, Magnetic Flowmeters, Mass Flowmeters,Pitot Tubes, Pumps, Rotameters, Turbine and Paddle Wheel Flowmeters, Ultrasonic Flowmeters, Valves, Variable Area Flowmeters, Vortex Shedding Flowmeters
Data AcquisitionAuto-Dialers and Alarm Monitoring Systems, Communication Products and Converters, Data Acquisition and Analysis Software, Data LoggersPlug-in Cards, Signal Conditioners, USB, RS232, RS485 and Parallel Port Data Acquisition Systems, Wireless Transmitters and Receivers
click here to go to the omega.com home page