guideline - housing public works guideline defines a step-by ... or local group that the chief...
TRANSCRIPT
GuidelineDisaster Management Act 2003
Mitigating the adverse impacts of cyclones
Evacuation and shelter
Guideline Disaster Management Act 2003
April 2008
Mitigating the Adverse Impacts of Cyclones - Evacuation and Shelter
The purpose of this Guideline is to provide advice and information to Local Governments on planning for evacuation and shelter to reduce the impacts of tropical cyclones and lows on existing and developing communities.
This Guideline has been developed jointly by:
Department of Public Works
Department of Emergency Services
Environmental Protection Agency
Department of Local Government, Sport and Recreation
Department of Natural Resources and Water
Queensland Transport
Department of Main Roads
Local Government Association of Queensland
Cairns Regional Council
Australian Bureau of Meteorology
Geoscience Australia
Emergency Management Australia
Mullins Consulting
Copyright: Department of Emergency Services (DES) materials are protected by copyright law. Copyright of DES materials resides with the State of Queensland. Apart from any fair dealing for the purpose of private study, research, criticism or review, as permitted under copyright legislation, no part may be reproduced or re-used for any commercial purposes whatsoever without written permission of the DES Copyright Administrator, Department of Emergency Services.
Limitations of the Guideline: These materials have been prepared as a guide only. All reasonable steps and due care have been taken to ensure the information contained herein is correct at the time of publication. The State of Queensland and its agents expressly exclude all liability for errors or omissions whether made negligently or otherwise for loss, damage or other consequences that may result from this guideline.
| �Disaster Management Planning Guideline Mitigating the Adverse Impacts of Cyclone – Evacuation and Shelter
Foreword
Recent experience has demonstrated that major tropical cyclones and east coast lows have significant and far reaching impacts on the resilience and sustainability of Queensland’s communities. With the intensity and frequency of cyclone and east coast low activity in Queensland expected to increase, it is essential that communities can safely evacuate and shelter during times of disaster.
The Queensland Disaster Management System demonstrates the ability of a large number of Local and State government organisations to work collaboratively to achieve the common goal of providing a framework for state-wide mitigation, preparedness, response and recovery activities.
Mitigating the adverse impacts of cyclones - evacuation and shelter guideline, is the result of collaboration between the Queensland Department of Emergency Services, the Department of Public Works and the Queensland Tropical Cyclone Consultative Committee. This guideline defines a step-by-step process local government can use to reduce community vulnerability to cyclones and inform functional operational and disaster mitigation planning. Local governments will be able to examine potential storm tide inundation, identify the structures that comply with cyclone building standards and put strategies into place to ensure that the community can evacuate and shelter safely.
We are proud to present the Disaster Management Act 2003 guideline Mitigating the adverse impacts of cyclones – evacuation and shelter. This publication serves as an excellent guide for Queensland local governments in their preparation for and response to tropical cyclones and east coast lows.
Mal Grieson
Director-General Department of Public Works
Jim McGowan
Director-General Department of Emergency Services
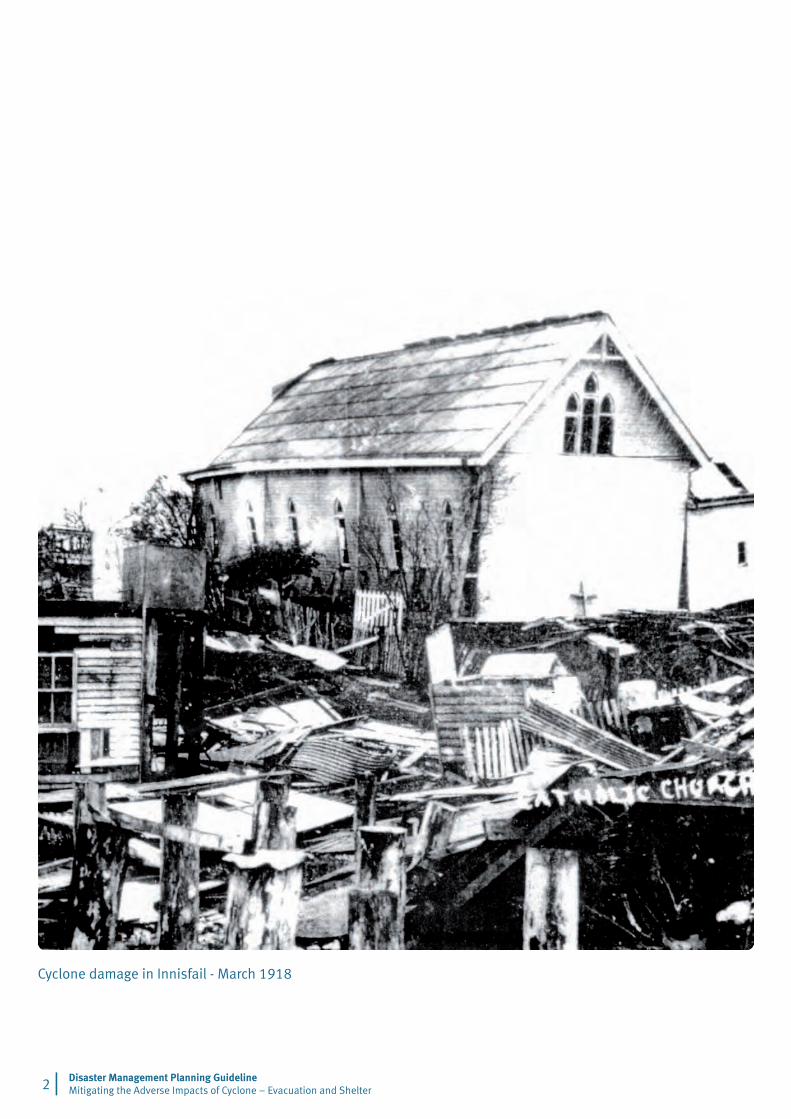
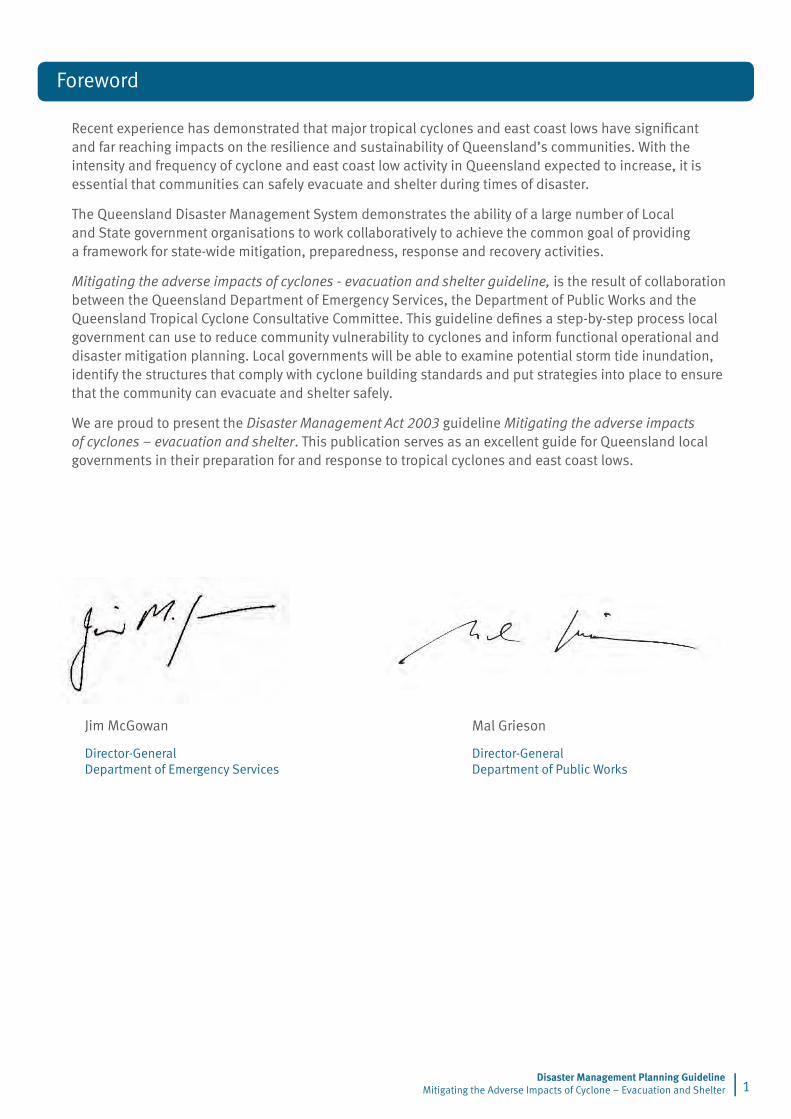
Cyclone damage in Innisfail - March 1918
Disaster Management Planning Guideline Mitigating the Adverse Impacts of Cyclone – Evacuation and Shelter � |
Table of contents
1. Purpose of the guideline 4
2. Scope of the guideline 4
3. Application of disaster management guidelines 4
4. The need to mitigate the adverse impacts of cyclones 5
5. Risk study – evacuation and shelter 65.1 Communicate and consult 8
5.2 Establish the context 8
5.3 Identify risks 8
5.4 Analyse risks 10
Storm tide inundation 12
Ability to evacuate 22
Wind resistance of housing 30
Ability to shelter 32
5.5 Evaluate risks 36
Storm tide inundation 36
Ability to evacuate 36
Wind resistance of housing 37
Ability to shelter 37
5.6 Treat risks – mitigation 40
Preparedness 40
Infrastructure planning 40
5.7 Monitor and review 42
Appendix AGlossary 44
Appendix BCyclone categories and building standards 46
Appendix CStorm tide inundation 50
Appendix DReferences 52
Appendix ELocal governments 54
| �Disaster Management Planning Guideline Mitigating the Adverse Impacts of Cyclone – Evacuation and Shelter
Disaster Management Planning Guideline Mitigating the Adverse Impacts of Cyclone – Evacuation and Shelter 4 |
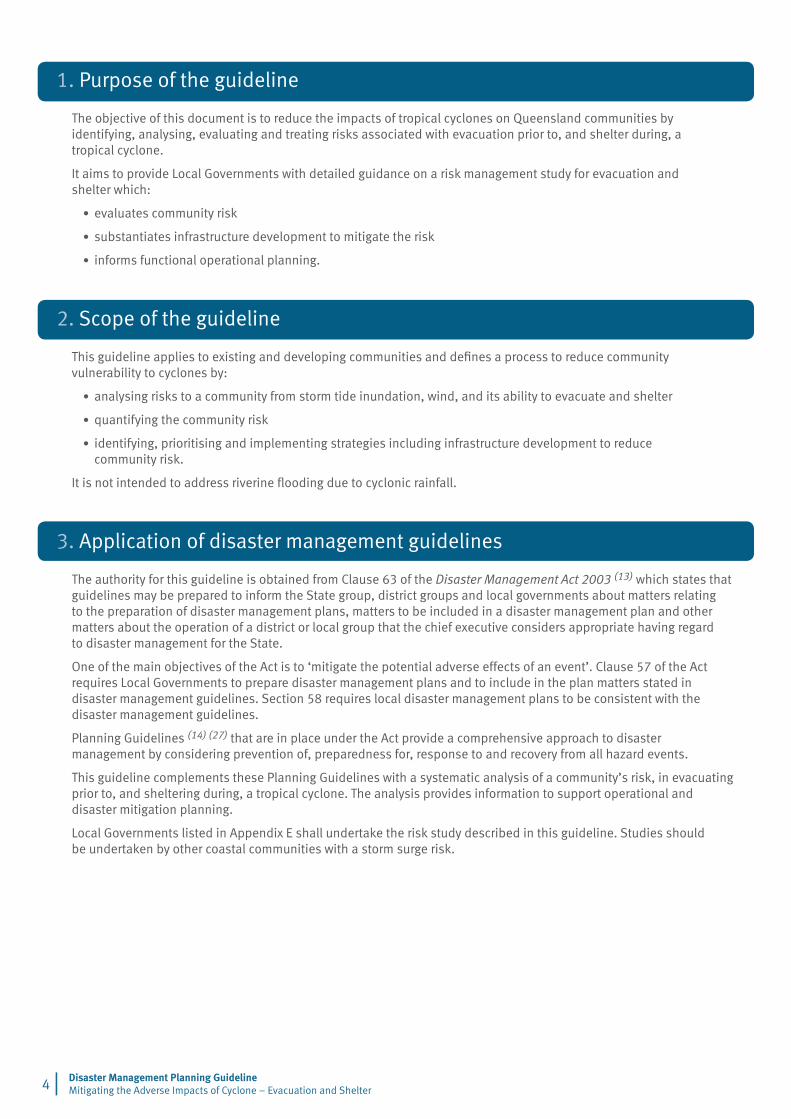
1. Purpose of the guideline
The objective of this document is to reduce the impacts of tropical cyclones on Queensland communities by identifying, analysing, evaluating and treating risks associated with evacuation prior to, and shelter during, a tropical cyclone.
It aims to provide Local Governments with detailed guidance on a risk management study for evacuation and shelter which:
evaluates community risk
substantiates infrastructure development to mitigate the risk
informs functional operational planning.
2. Scope of the guideline
This guideline applies to existing and developing communities and defines a process to reduce community vulnerability to cyclones by:
analysing risks to a community from storm tide inundation, wind, and its ability to evacuate and shelter
quantifying the community risk
identifying, prioritising and implementing strategies including infrastructure development to reduce community risk.
It is not intended to address riverine flooding due to cyclonic rainfall.
3. Application of disaster management guidelines
The authority for this guideline is obtained from Clause 63 of the Disaster Management Act 2003 (13) which states that guidelines may be prepared to inform the State group, district groups and local governments about matters relating to the preparation of disaster management plans, matters to be included in a disaster management plan and other matters about the operation of a district or local group that the chief executive considers appropriate having regard to disaster management for the State.
One of the main objectives of the Act is to ‘mitigate the potential adverse effects of an event’. Clause 57 of the Act requires Local Governments to prepare disaster management plans and to include in the plan matters stated in disaster management guidelines. Section 58 requires local disaster management plans to be consistent with the disaster management guidelines.
Planning Guidelines (14) (27) that are in place under the Act provide a comprehensive approach to disaster management by considering prevention of, preparedness for, response to and recovery from all hazard events.
This guideline complements these Planning Guidelines with a systematic analysis of a community’s risk, in evacuating prior to, and sheltering during, a tropical cyclone. The analysis provides information to support operational and disaster mitigation planning.
Local Governments listed in Appendix E shall undertake the risk study described in this guideline. Studies should be undertaken by other coastal communities with a storm surge risk.
•
•
•
•
•
•
| 5Disaster Management Planning Guideline Mitigating the Adverse Impacts of Cyclone – Evacuation and Shelter
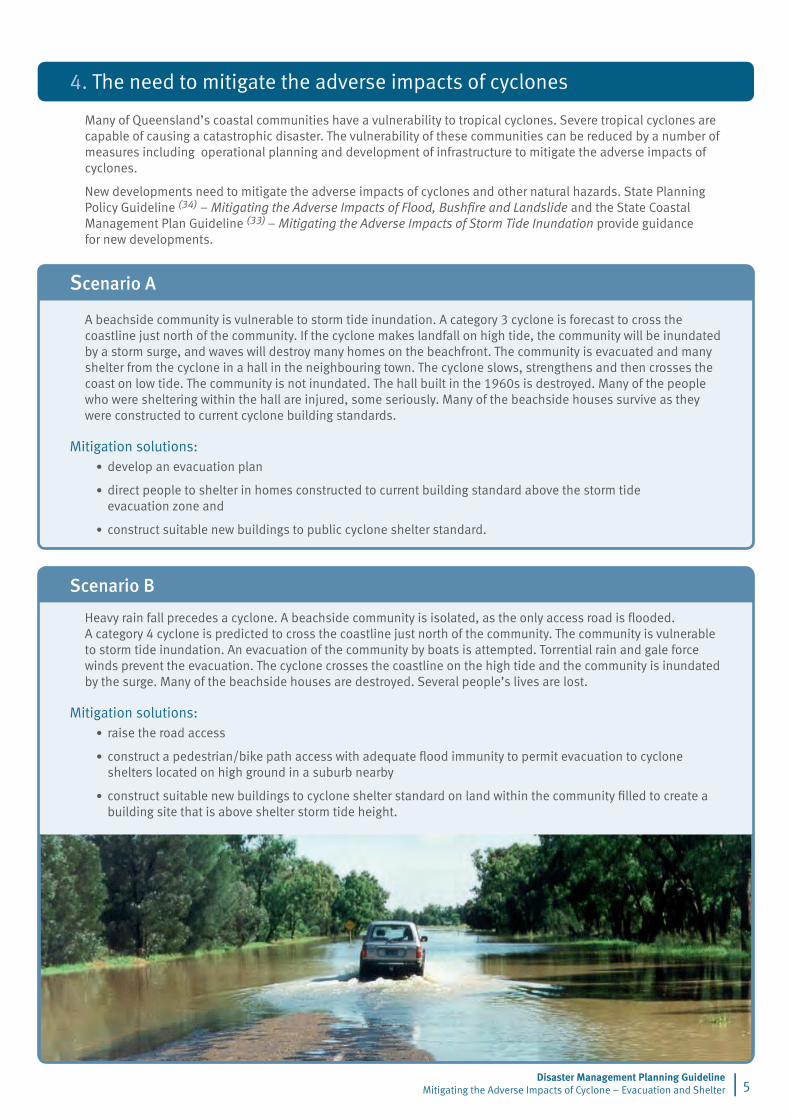
4. The need to mitigate the adverse impacts of cyclones
Many of Queensland’s coastal communities have a vulnerability to tropical cyclones. Severe tropical cyclones are capable of causing a catastrophic disaster. The vulnerability of these communities can be reduced by a number of measures including operational planning and development of infrastructure to mitigate the adverse impacts of cyclones.
New developments need to mitigate the adverse impacts of cyclones and other natural hazards. State Planning Policy Guideline (34) – Mitigating the Adverse Impacts of Flood, Bushfire and Landslide and the State Coastal Management Plan Guideline (33) – Mitigating the Adverse Impacts of Storm Tide Inundation provide guidance for new developments.
Scenario A
A beachside community is vulnerable to storm tide inundation. A category 3 cyclone is forecast to cross the coastline just north of the community. If the cyclone makes landfall on high tide, the community will be inundated by a storm surge, and waves will destroy many homes on the beachfront. The community is evacuated and many shelter from the cyclone in a hall in the neighbouring town. The cyclone slows, strengthens and then crosses the coast on low tide. The community is not inundated. The hall built in the 1960s is destroyed. Many of the people who were sheltering within the hall are injured, some seriously. Many of the beachside houses survive as they were constructed to current cyclone building standards.
Mitigation solutions:develop an evacuation plan
direct people to shelter in homes constructed to current building standard above the storm tide evacuation zone and
construct suitable new buildings to public cyclone shelter standard.
Scenario B
Heavy rain fall precedes a cyclone. A beachside community is isolated, as the only access road is flooded. A category 4 cyclone is predicted to cross the coastline just north of the community. The community is vulnerable to storm tide inundation. An evacuation of the community by boats is attempted. Torrential rain and gale force winds prevent the evacuation. The cyclone crosses the coastline on the high tide and the community is inundated by the surge. Many of the beachside houses are destroyed. Several people’s lives are lost.
Mitigation solutions:raise the road access
construct a pedestrian/bike path access with adequate flood immunity to permit evacuation to cyclone shelters located on high ground in a suburb nearby
construct suitable new buildings to cyclone shelter standard on land within the community filled to create a building site that is above shelter storm tide height.
•
•
•
•
•
•
Building damage by cyclone Larry - March 2006
Disaster Management Planning Guideline Mitigating the Adverse Impacts of Cyclone – Evacuation and Shelter 6 |
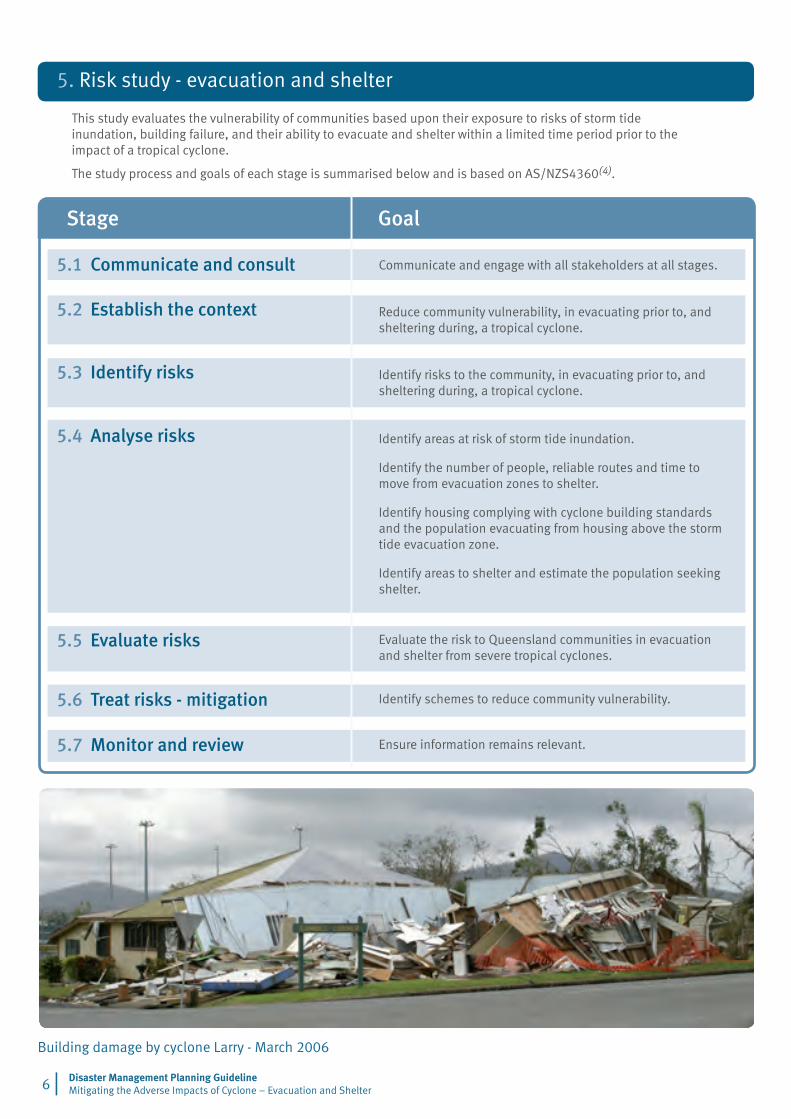
5. Risk study - evacuation and shelter
This study evaluates the vulnerability of communities based upon their exposure to risks of storm tide inundation, building failure, and their ability to evacuate and shelter within a limited time period prior to the impact of a tropical cyclone.
The study process and goals of each stage is summarised below and is based on AS/NZS4360(4).
5.2 Establish the context
5.1 Communicate and consult
Stage Goal
Communicate and engage with all stakeholders at all stages.
Reduce community vulnerability, in evacuating prior to, and sheltering during, a tropical cyclone.
5.3 Identify risks Identify risks to the community, in evacuating prior to, and sheltering during, a tropical cyclone.
5.4 Analyse risks Identify areas at risk of storm tide inundation.
Identify the number of people, reliable routes and time to move from evacuation zones to shelter.
Identify housing complying with cyclone building standards and the population evacuating from housing above the storm tide evacuation zone.
Identify areas to shelter and estimate the population seeking shelter.
5.5 Evaluate risks Evaluate the risk to Queensland communities in evacuation and shelter from severe tropical cyclones.
5.6 Treat risks - mitigation Identify schemes to reduce community vulnerability.
5.7 Monitor and review Ensure information remains relevant.
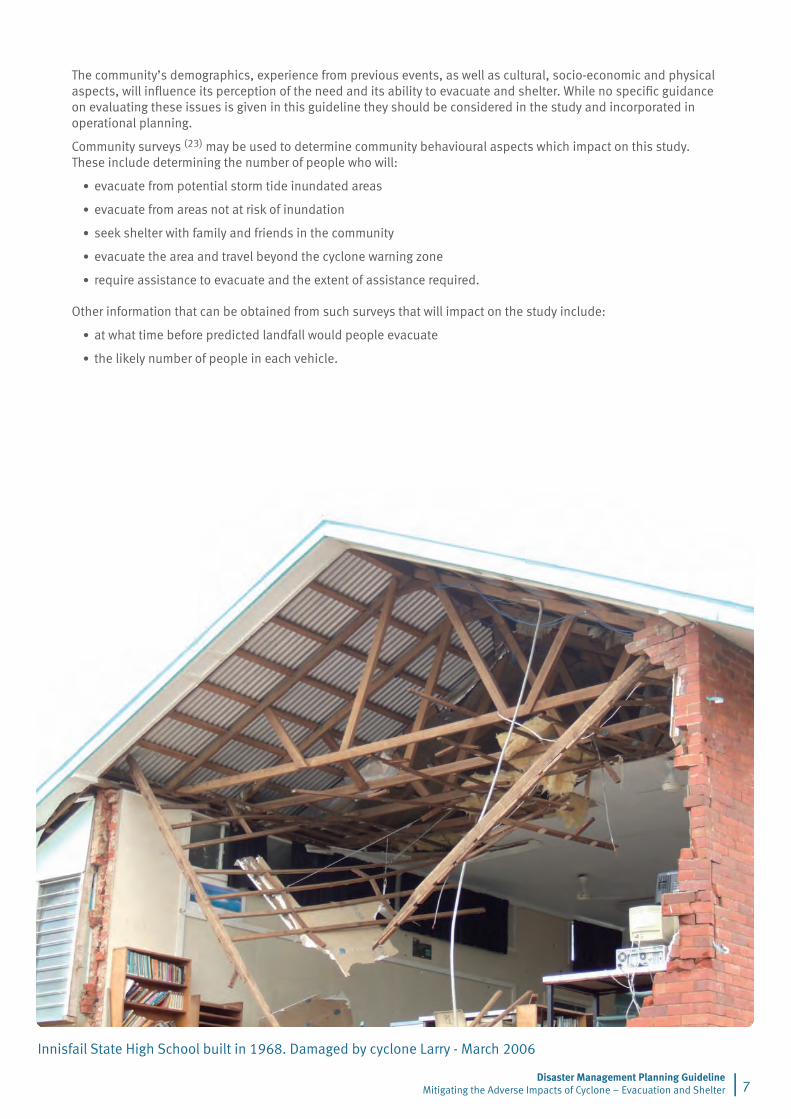
Innisfail State High School built in 1968. Damaged by cyclone Larry - March 2006
| 7Disaster Management Planning Guideline Mitigating the Adverse Impacts of Cyclone – Evacuation and Shelter
The community’s demographics, experience from previous events, as well as cultural, socio-economic and physical aspects, will influence its perception of the need and its ability to evacuate and shelter. While no specific guidance on evaluating these issues is given in this guideline they should be considered in the study and incorporated in operational planning.
Community surveys (��) may be used to determine community behavioural aspects which impact on this study. These include determining the number of people who will:
evacuate from potential storm tide inundated areas
evacuate from areas not at risk of inundation
seek shelter with family and friends in the community
evacuate the area and travel beyond the cyclone warning zone
require assistance to evacuate and the extent of assistance required.
Other information that can be obtained from such surveys that will impact on the study include:
at what time before predicted landfall would people evacuate
the likely number of people in each vehicle.
•
•
•
•
•
•
•
Disaster Management Planning Guideline Mitigating the Adverse Impacts of Cyclone – Evacuation and Shelter 8 |
5.1 Communicate and consultStudy Goal 5.1: Communicate and engage with all stakeholders at all stages.
Consult with technical experts, disaster management specialists and community members at all stagesThe Study requires that stakeholders and communities are identified, and paths of communication are established. Communication and consultation should then occur at all stages of the study.
Where stakeholders and communities contribute to the decision making process there is a much larger pool of information and expertise to enable appropriate solutions to be developed.
For risk events which have a high level of uncertainty, such as cyclones and associated storm surge, communication and consultation during the risk assessment phase are considered extremely important.
Communication and consultation will:
help develop resilience amongst stakeholders and community members
ensure commitment of stakeholders and promote shared understandings of the risks and the mitigation activities
reflect the interests of the community.
5.2 Establish the contextStudy Goal 5.2: Reduce community vulnerability, in evacuating prior to, and sheltering during, a tropical cyclone.
Provide information specific to the community to effectively incorporate evacuation and sheltering into the local disaster management planning. Identify the need and provide justification for infrastructure development which mitigates the risk.
The study shall determine the:
zones to be evacuated for six different storm tide events
number of people to be evacuated for each event
designated evacuation routes
evacuation timelines for each storm tide event with varying evacuation route conditions
areas where housing complies with current wind resistant building standards
ability to shelter.
Local governments should undertake studies for each community. A community is a group of people which may be isolated from adjoining communities.
The study area should be bounded by topographic features such as rivers, creeks or steep slopes which form natural boundaries to the community. Rivers and creeks may flood and hill slopes may slip during an event to form physical boundaries to the evacuation. The area should include a zone in which people may seek shelter.
The study provides information for operational planning. It does not purport to be a disaster management operational plan. The study does not address the decision process to evacuate, the management of the evacuation and shelter, or the return phase of the evacuation.
5.3 Identify risksStudy Goal 5.3: Identify risks to the community, in evacuating prior to, and sheltering during, a tropical cyclone.
Determine the risk to the community by examining:
a) Storm tide inundation b) Ability to evacuate c) Wind resistance of housing d) Ability to shelter.
Identify other risks to which the community may be exposed while evacuating prior to, and/or sheltering during, a severe tropical cyclone.
•
•
•
•
•
•
•
•
•
Example
| 9Disaster Management Planning Guideline Mitigating the Adverse Impacts of Cyclone – Evacuation and Shelter
Communicate and consult
Communication and consultation with the community, disaster managers and technical specialist have been undertaken at all stages of this study.
Establish the context
The scopeThe purpose of this study is to reduce the impacts of cyclones on communities within the shire by planning for orderly evacuation and shelter. This study is based upon the Disaster Management Guideline – Mitigating the Adverse Impacts of Cyclones – Evacuation and Shelter 2008.
This study:
details the zones to be evacuated for six different storm tide events
determines the number of people to be evacuated for each event
designates evacuation routes
determines the evacuation timelines for each storm tide event with varying evacuation route conditions
determines the areas where housing complies with current wind resistant building standards
determines the ability for people to shelter.
No buildings have been identified in this community as complying with the Design Guidelines for Queensland Public Cyclone Shelters. (12)
The study also identifies mitigation strategies and provides a rational basis for infrastructure planning to mitigate the adverse impacts of cyclones in the shire.
This study is not intended as an operational plan. It does not include the decision process to evacuate, the management of the evacuation and shelter, or the return phase of the evacuation.
•
•
•
•
•
•
Identify risksRisks to the communities within the shire, in evacuating prior to, and sheltering during, a tropical cyclone are identified by examining:
a) Storm tide inundation b) Ability to evacuate c) Wind resistance of housing d) Ability to shelter.
This example is for demonstration purposes only and resemblance to any community, location or actual or potential event is purely coincidental.
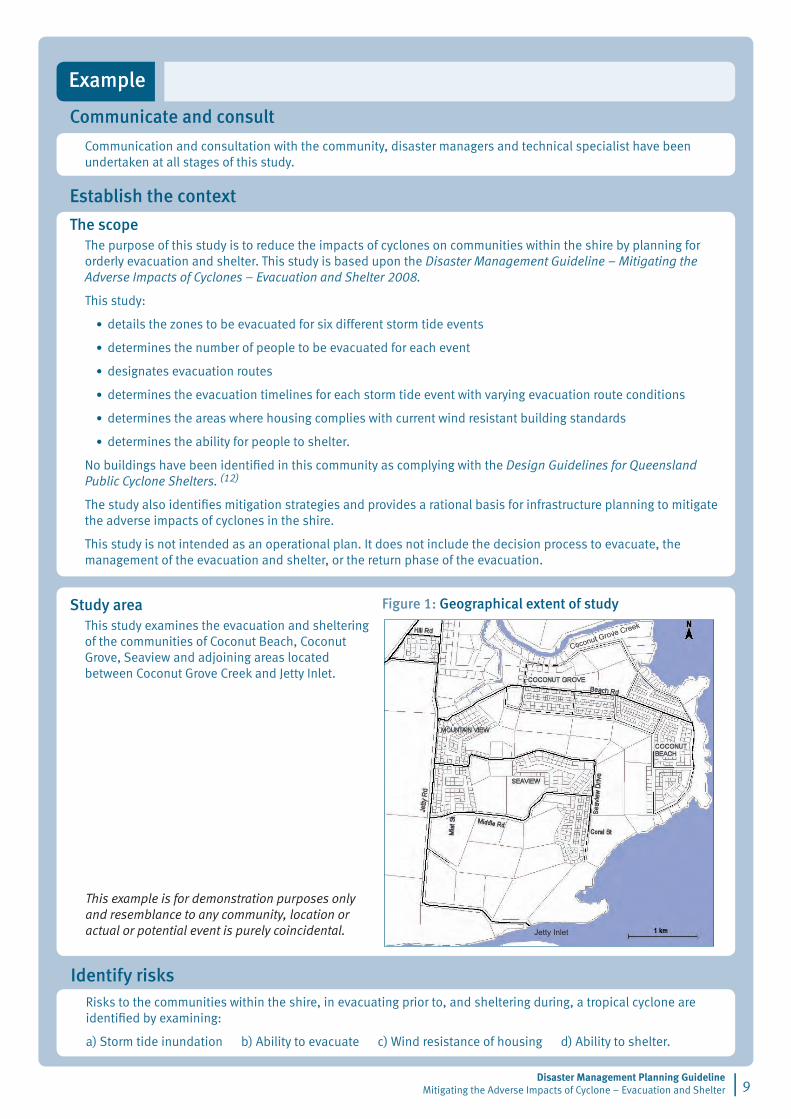
Study areaThis study examines the evacuation and sheltering of the communities of Coconut Beach, Coconut Grove, Seaview and adjoining areas located between Coconut Grove Creek and Jetty Inlet.
Figure 1: Geographical extent of study
Disaster Management Planning Guideline Mitigating the Adverse Impacts of Cyclone – Evacuation and Shelter 10 |
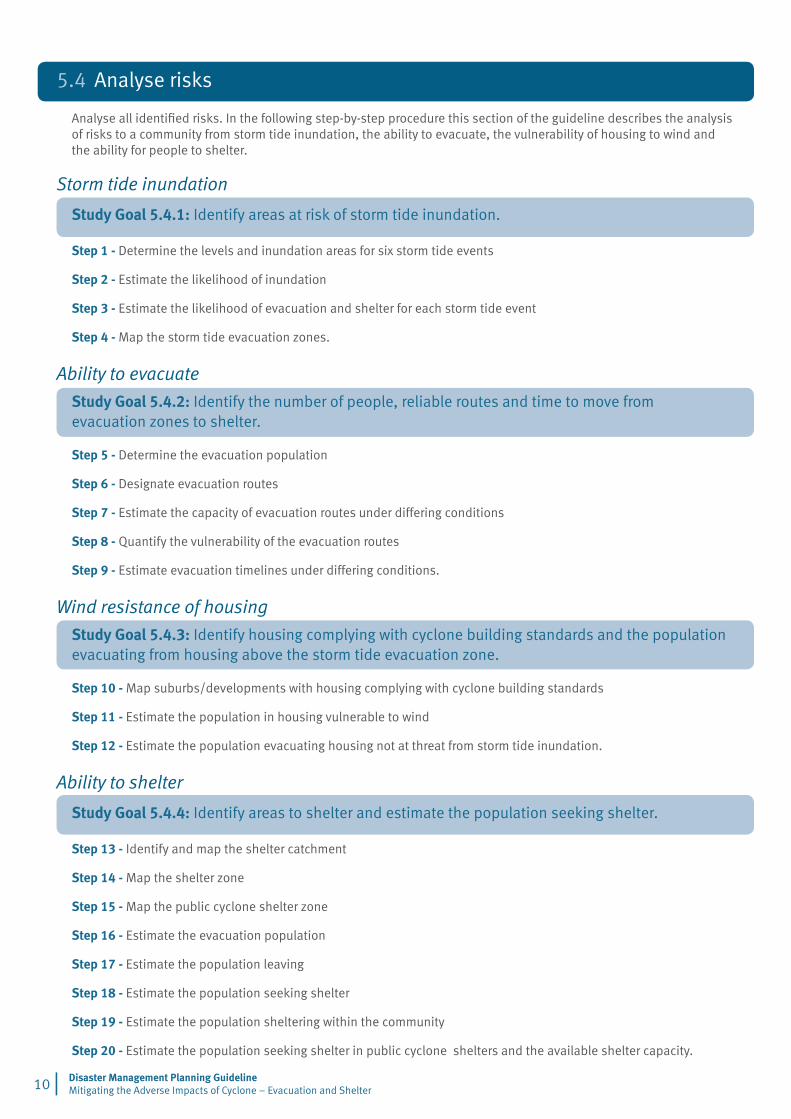
5.4 Analyse risks
Analyse all identified risks. In the following step-by-step procedure this section of the guideline describes the analysis of risks to a community from storm tide inundation, the ability to evacuate, the vulnerability of housing to wind and the ability for people to shelter.
Storm tide inundation
Study Goal 5.4.1: Identify areas at risk of storm tide inundation.
Step 1 - Determine the levels and inundation areas for six storm tide events
Step 2 - Estimate the likelihood of inundation
Step 3 - Estimate the likelihood of evacuation and shelter for each storm tide event
Step 4 - Map the storm tide evacuation zones.
Ability to evacuate
Study Goal 5.4.2: Identify the number of people, reliable routes and time to move from evacuation zones to shelter.
Step 5 - Determine the evacuation population
Step 6 - Designate evacuation routes
Step 7 - Estimate the capacity of evacuation routes under differing conditions
Step 8 - Quantify the vulnerability of the evacuation routes
Step 9 - Estimate evacuation timelines under differing conditions.
Wind resistance of housing
Study Goal 5.4.3: Identify housing complying with cyclone building standards and the population evacuating from housing above the storm tide evacuation zone.
Step 10 - Map suburbs/developments with housing complying with cyclone building standards
Step 11 - Estimate the population in housing vulnerable to wind
Step 12 - Estimate the population evacuating housing not at threat from storm tide inundation.
Ability to shelter
Study Goal 5.4.4: Identify areas to shelter and estimate the population seeking shelter.
Step 13 - Identify and map the shelter catchment
Step 14 - Map the shelter zone
Step 15 - Map the public cyclone shelter zone
Step 16 - Estimate the evacuation population
Step 17 - Estimate the population leaving
Step 18 - Estimate the population seeking shelter
Step 19 - Estimate the population sheltering within the community
Step 20 - Estimate the population seeking shelter in public cyclone shelters and the available shelter capacity.
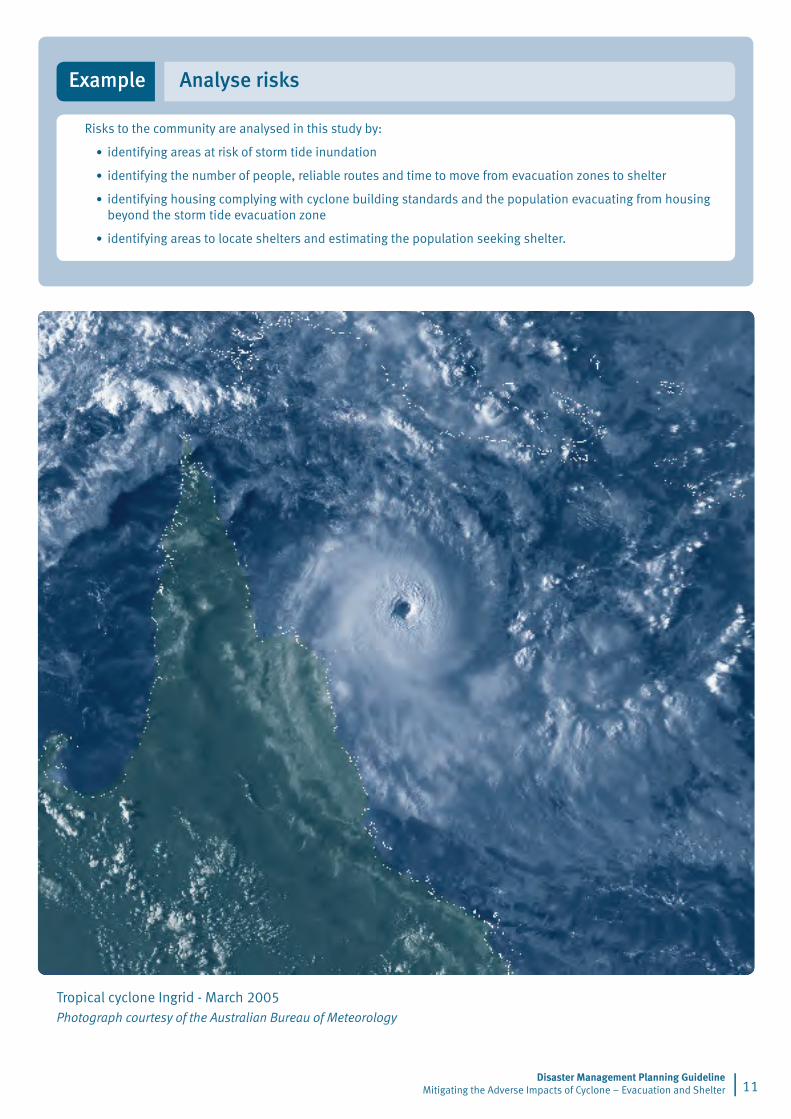
Tropical cyclone Ingrid - March 2005 Photograph courtesy of the Australian Bureau of Meteorology
Example Analyse risks
| ��Disaster Management Planning Guideline
Mitigating the Adverse Impacts of Cyclone – Evacuation and Shelter
Risks to the community are analysed in this study by:
identifying areas at risk of storm tide inundation
identifying the number of people, reliable routes and time to move from evacuation zones to shelter
identifying housing complying with cyclone building standards and the population evacuating from housing beyond the storm tide evacuation zone
identifying areas to locate shelters and estimating the population seeking shelter.
•
•
•
•
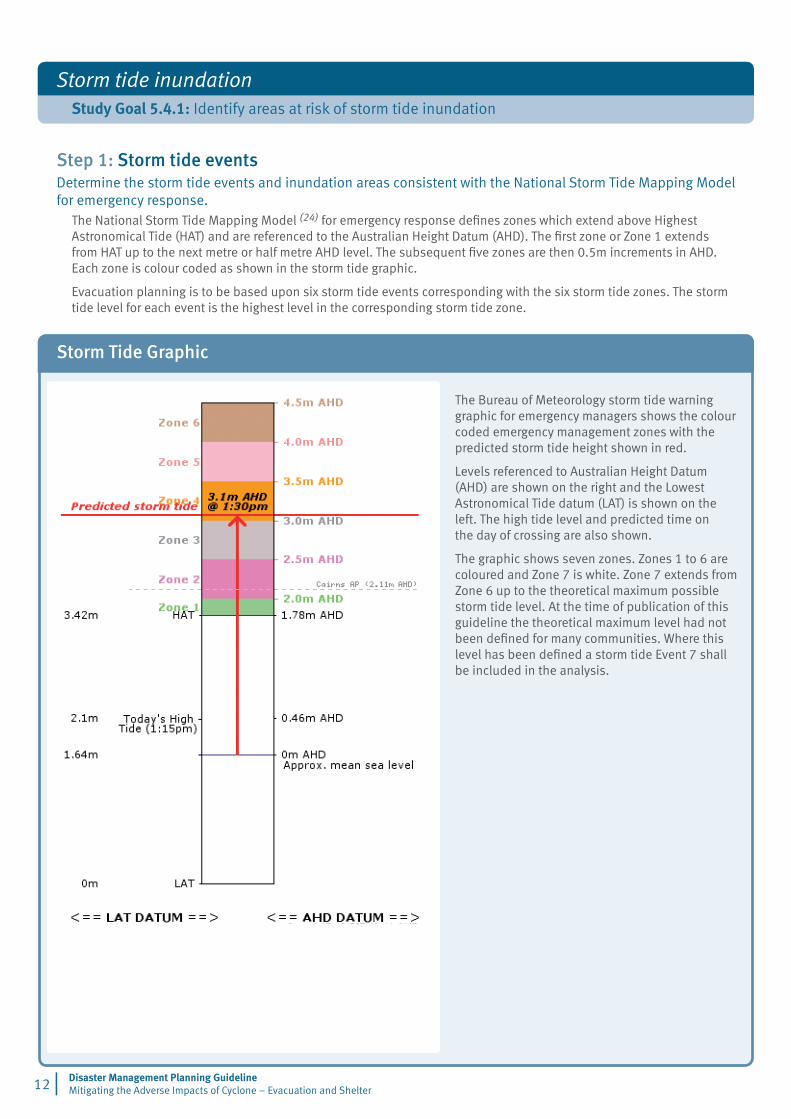
The Bureau of Meteorology storm tide warning graphic for emergency managers shows the colour coded emergency management zones with the predicted storm tide height shown in red.
Levels referenced to Australian Height Datum (AHD) are shown on the right and the Lowest Astronomical Tide datum (LAT) is shown on the left. The high tide level and predicted time on the day of crossing are also shown.
The graphic shows seven zones. Zones 1 to 6 are coloured and Zone 7 is white. Zone 7 extends from Zone 6 up to the theoretical maximum possible storm tide level. At the time of publication of this guideline the theoretical maximum level had not been defined for many communities. Where this level has been defined a storm tide Event 7 shall be included in the analysis.
Disaster Management Planning Guideline Mitigating the Adverse Impacts of Cyclone – Evacuation and Shelter �� |
Storm tide inundationStudy Goal 5.4.1: Identify areas at risk of storm tide inundation
Step 1: Storm tide eventsDetermine the storm tide events and inundation areas consistent with the National Storm Tide Mapping Model for emergency response.
The National Storm Tide Mapping Model (24) for emergency response defines zones which extend above Highest Astronomical Tide (HAT) and are referenced to the Australian Height Datum (AHD). The first zone or Zone 1 extends from HAT up to the next metre or half metre AHD level. The subsequent five zones are then 0.5m increments in AHD. Each zone is colour coded as shown in the storm tide graphic.
Evacuation planning is to be based upon six storm tide events corresponding with the six storm tide zones. The storm tide level for each event is the highest level in the corresponding storm tide zone.
Storm Tide Graphic
Example Storm tide inundation
| ��Disaster Management Planning Guideline
Mitigating the Adverse Impacts of Cyclone – Evacuation and Shelter
Storm tide events
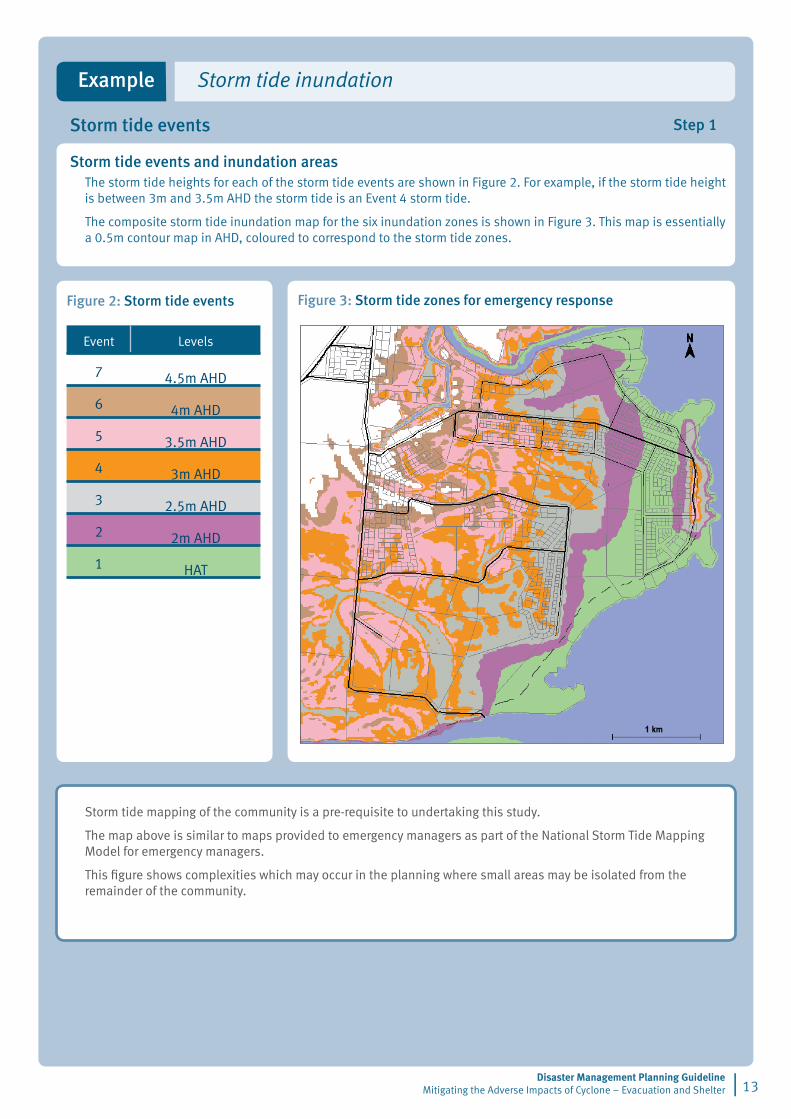
Storm tide events and inundation areasThe storm tide heights for each of the storm tide events are shown in Figure 2. For example, if the storm tide height is between 3m and 3.5m AHD the storm tide is an Event 4 storm tide.
The composite storm tide inundation map for the six inundation zones is shown in Figure 3. This map is essentially a 0.5m contour map in AHD, coloured to correspond to the storm tide zones.
Figure 3: Storm tide zones for emergency response
Storm tide mapping of the community is a pre-requisite to undertaking this study.
The map above is similar to maps provided to emergency managers as part of the National Storm Tide Mapping Model for emergency managers.
This figure shows complexities which may occur in the planning where small areas may be isolated from the remainder of the community.
Figure 2: Storm tide events
Event Levels
7 4.5m AHD
6 4m AHD
5 3.5m AHD
4 3m AHD
� 2.5m AHD
� 2m AHD
� HAT
Step 1
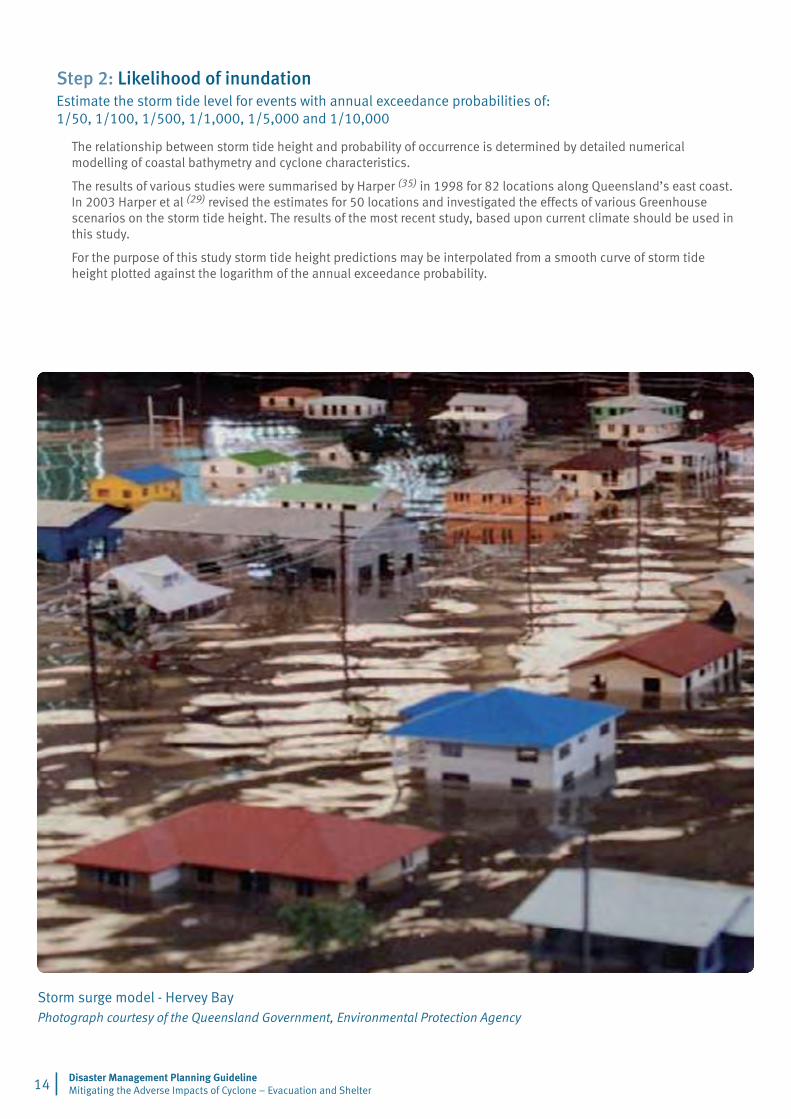
Storm surge model - Hervey BayPhotograph courtesy of the Queensland Government, Environmental Protection Agency
Disaster Management Planning Guideline Mitigating the Adverse Impacts of Cyclone – Evacuation and Shelter 14 |
Step 2: Likelihood of inundation Estimate the storm tide level for events with annual exceedance probabilities of: 1/50, 1/100, 1/500, 1/1,000, 1/5,000 and 1/10,000
The relationship between storm tide height and probability of occurrence is determined by detailed numerical modelling of coastal bathymetry and cyclone characteristics.
The results of various studies were summarised by Harper (35) in 1998 for 82 locations along Queensland’s east coast. In 2003 Harper et al (29) revised the estimates for 50 locations and investigated the effects of various Greenhouse scenarios on the storm tide height. The results of the most recent study, based upon current climate should be used in this study.
For the purpose of this study storm tide height predictions may be interpolated from a smooth curve of storm tide height plotted against the logarithm of the annual exceedance probability.
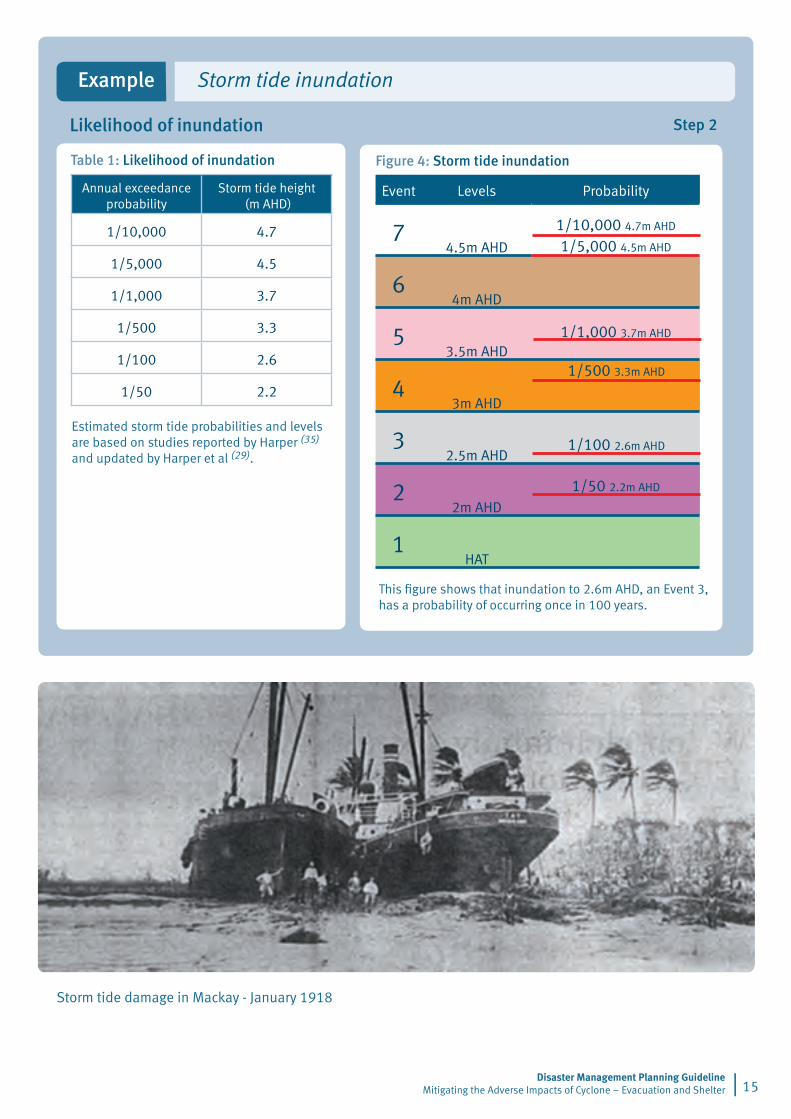
Table 1: Likelihood of inundation
Annual exceedance probability
Storm tide height (m AHD)
1/10,000 4.7
1/5,000 4.5
1/1,000 3.7
1/500 3.3
1/100 2.6
1/50 2.2
Estimated storm tide probabilities and levels are based on studies reported by Harper (35) and updated by Harper et al (29).
Figure 4: Storm tide inundation
Event Levels Probability
74.5m AHD
1/10,000 4.7m AHD
1/5,000 4.5m AHD
64m AHD
53.5m AHD
1/1,000 3.7m AHD
43m AHD
�2.5m AHD
�2m AHD
1/50 2.2m AHD
�HAT
Example Storm tide inundation
Storm tide damage in Mackay - January 1918
| 15Disaster Management Planning Guideline
Mitigating the Adverse Impacts of Cyclone – Evacuation and Shelter
Likelihood of inundation
This figure shows that inundation to 2.6m AHD, an Event 3, has a probability of occurring once in 100 years.
Step 2
1/500 3.3m AHD
1/100 2.6m AHD
Sample cyclone forecast graphic
Disaster Management Planning Guideline Mitigating the Adverse Impacts of Cyclone – Evacuation and Shelter 16 |
Step 3: Likelihood of evacuation and shelterEstimate the evacuation and shelter probability for each of the storm tide events.
This analysis establishes an important point - that evacuation and the need for shelter due to a potential storm tide will occur more frequently than actual inundation.
The likelihood of evacuation can be approximated by dividing the probability of inundation by the average ratio of the length of coastline evacuated to the actual length inundated. An allowance should be added to the storm tide height for the difference between the tide height at the actual peak storm tide and the highest tide height upon which the forecast is based.
The annual probability of exceedance of the storm tide height for each storm tide event can be estimated from a plot of the storm tide height versus the logarithm of probability.
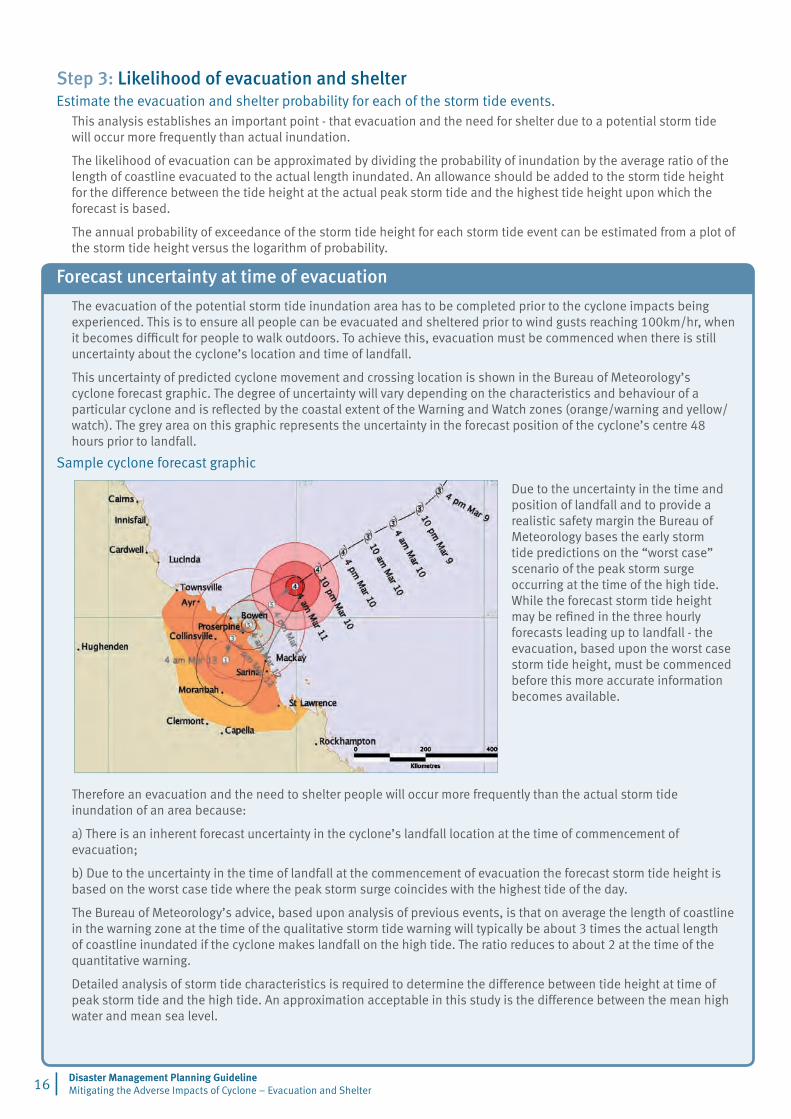
Forecast uncertainty at time of evacuation
The evacuation of the potential storm tide inundation area has to be completed prior to the cyclone impacts being experienced. This is to ensure all people can be evacuated and sheltered prior to wind gusts reaching 100km/hr, when it becomes difficult for people to walk outdoors. To achieve this, evacuation must be commenced when there is still uncertainty about the cyclone’s location and time of landfall.
This uncertainty of predicted cyclone movement and crossing location is shown in the Bureau of Meteorology’s cyclone forecast graphic. The degree of uncertainty will vary depending on the characteristics and behaviour of a particular cyclone and is reflected by the coastal extent of the Warning and Watch zones (orange/warning and yellow/watch). The grey area on this graphic represents the uncertainty in the forecast position of the cyclone’s centre 48 hours prior to landfall.
Therefore an evacuation and the need to shelter people will occur more frequently than the actual storm tide inundation of an area because:
a) There is an inherent forecast uncertainty in the cyclone’s landfall location at the time of commencement of evacuation;
b) Due to the uncertainty in the time of landfall at the commencement of evacuation the forecast storm tide height is based on the worst case tide where the peak storm surge coincides with the highest tide of the day.
The Bureau of Meteorology’s advice, based upon analysis of previous events, is that on average the length of coastline in the warning zone at the time of the qualitative storm tide warning will typically be about 3 times the actual length of coastline inundated if the cyclone makes landfall on the high tide. The ratio reduces to about 2 at the time of the quantitative warning.
Detailed analysis of storm tide characteristics is required to determine the difference between tide height at time of peak storm tide and the high tide. An approximation acceptable in this study is the difference between the mean high water and mean sea level.
Due to the uncertainty in the time and position of landfall and to provide a realistic safety margin the Bureau of Meteorology bases the early storm tide predictions on the “worst case” scenario of the peak storm surge occurring at the time of the high tide. While the forecast storm tide height may be refined in the three hourly forecasts leading up to landfall - the evacuation, based upon the worst case storm tide height, must be commenced before this more accurate information becomes available.
Fore
cast
/ e
vacu
atio
n st
orm
tide
hei
ght
(m A
HD
)
Annual exceedance probability
| 17Disaster Management Planning Guideline
Mitigating the Adverse Impacts of Cyclone – Evacuation and Shelter
Likelihood of evacuation and shelter
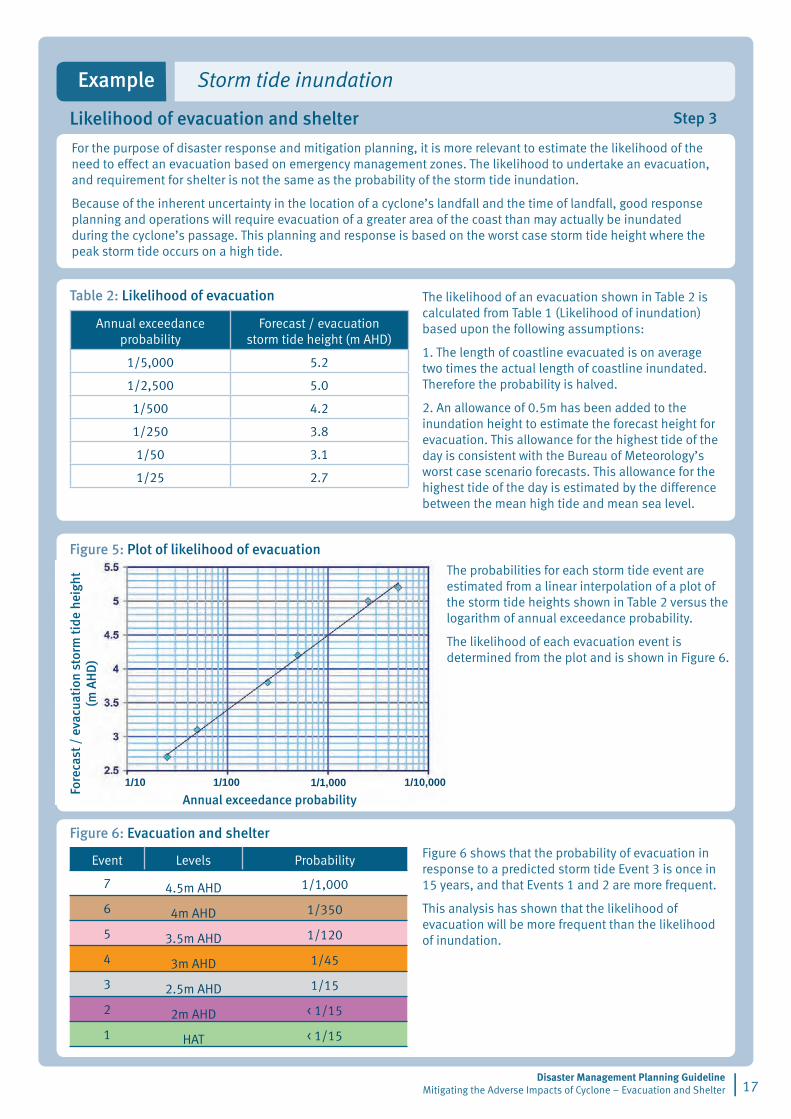
For the purpose of disaster response and mitigation planning, it is more relevant to estimate the likelihood of the need to effect an evacuation based on emergency management zones. The likelihood to undertake an evacuation, and requirement for shelter is not the same as the probability of the storm tide inundation.
Because of the inherent uncertainty in the location of a cyclone’s landfall and the time of landfall, good response planning and operations will require evacuation of a greater area of the coast than may actually be inundated during the cyclone’s passage. This planning and response is based on the worst case storm tide height where the peak storm tide occurs on a high tide.
The likelihood of an evacuation shown in Table 2 is calculated from Table 1 (Likelihood of inundation) based upon the following assumptions:
1. The length of coastline evacuated is on average two times the actual length of coastline inundated. Therefore the probability is halved.
2. An allowance of 0.5m has been added to the inundation height to estimate the forecast height for evacuation. This allowance for the highest tide of the day is consistent with the Bureau of Meteorology’s worst case scenario forecasts. This allowance for the highest tide of the day is estimated by the difference between the mean high tide and mean sea level.
The probabilities for each storm tide event are estimated from a linear interpolation of a plot of the storm tide heights shown in Table 2 versus the logarithm of annual exceedance probability.
The likelihood of each evacuation event is determined from the plot and is shown in Figure 6.
Figure 6 shows that the probability of evacuation in response to a predicted storm tide Event 3 is once in 15 years, and that Events 1 and 2 are more frequent.
This analysis has shown that the likelihood of evacuation will be more frequent than the likelihood of inundation.
Table 2: Likelihood of evacuation
Annual exceedance probability
Forecast / evacuation storm tide height (m AHD)
1/5,000 5.2
1/2,500 5.0
1/500 4.2
1/250 3.8
1/50 3.1
1/25 2.7
Figure 6: Evacuation and shelter
Event Levels Probability
7 4.5m AHD 1/1,000
6 4m AHD 1/350
5 3.5m AHD 1/120
4 3m AHD 1/45
� 2.5m AHD 1/15
� 2m AHD < 1/15
� HAT < 1/15
Figure 5: Plot of likelihood of evacuation
Example Storm tide inundation
Step 3
1/10 1/100 1/1,000 1/10,000
Disaster Management Planning Guideline Mitigating the Adverse Impacts of Cyclone – Evacuation and Shelter 18 |
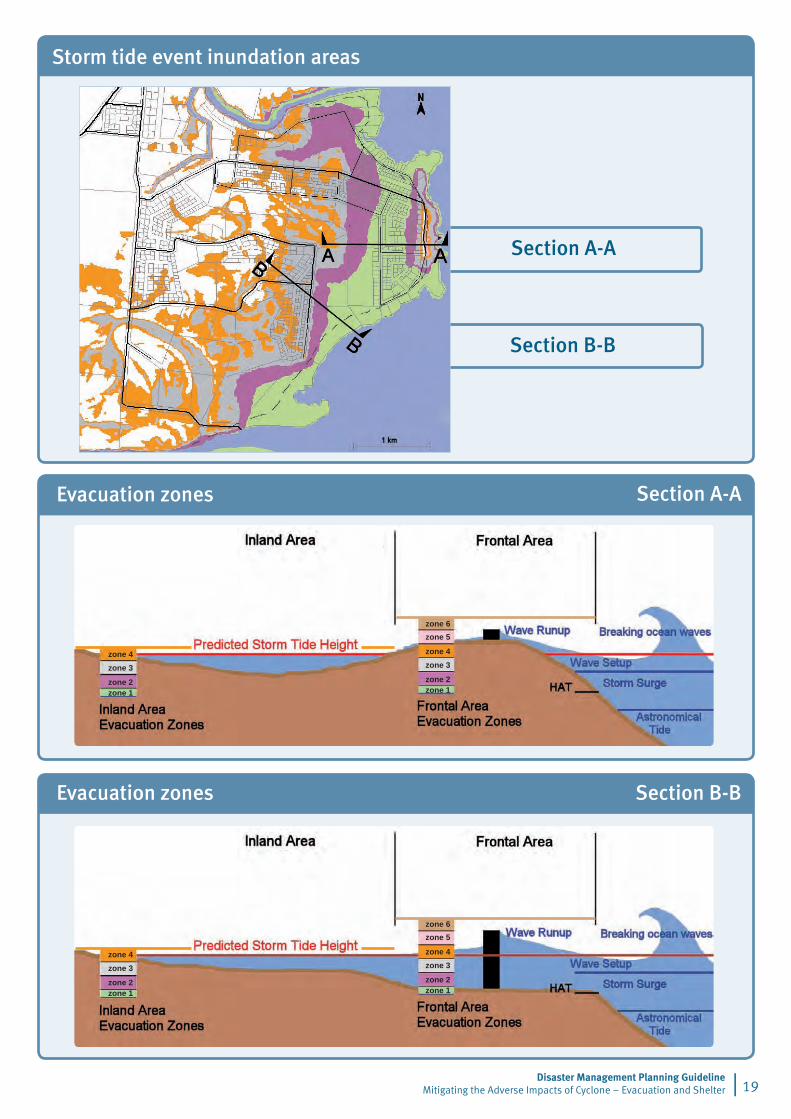
Step 4: Storm tide evacuation zonesMap the storm tide evacuation zones for each of the six storm tide events.
A property should be included in the evacuation zone when the storm tide event extends to the building on the property or the inundation isolates the property from the community.
The storm tide event inundation levels shown on the map on the opposite page are essentially colour coded contour levels. Some properties are shown with two or more coloured zones. To avoid confusion the zones can be extended to the property boundary, so that a residential property is shown to be in a single zone. The exceptions are large properties with more than one residential building.
The level of sea water inundation is neither uniform nor horizontal. The level will vary along the coastline depending upon the cyclone and its location along with the coastal bathymetry. On the east coast of Queensland the storm tide is greatest south of the eye where the wind is blowing towards the shore. On the west coast of Cape York it is greatest to the north of the eye.
In the beach front area, breaking ocean waves will run-up the beach and foreshore to levels above the predicted storm tide level. Waves will attack fore dunes or near shore structures and can cause considerable damage.
Behind the beach front area, where the effect of ocean waves has decayed, the inundation level will depend upon:
the water depth
the duration of the peak storm tide
the obstruction to water flow by buildings, vegetation and topography.
If there is sufficient time for the water to flow inland, the inundation level inland would eventually be the same as the water level at the coastline.
Detailed engineering modelling can be used to determine the time-dependent inundation levels within the community for the various storm tide levels.
Where such analysis has not been undertaken it is proposed that two evacuation levels are adopted for each storm tide event:
a level equal to the forecast storm tide height in the inland area where the effect of ocean waves has decayed.
a higher level in the frontal area to allow for the effects of breaking ocean waves and run-up.
The extent and increased level of the evacuation zone in the frontal area is dependent upon the storm tide event as the potential height of ocean waves depends on the water depth. Informed advice should be sought and realistic yet conservative estimates adopted for the width and increased level in the frontal area.
Evacuation levels
•
•
•
•
•
Area Level
Inland Forecast storm tide height zone
Frontal Forecast storm tide height zone + n x 0.5m
Note: n =1, 2, 3, 4 etc
The forecast storm tide height is the water level when the storm surge is combined with the astronomical tide and wave setup. Wave runup can increase water levels above the forecast storm tide height.
Wave setup is the increase in the mean water level at the shoreline caused by wave action. The maximum height of the setup on a beach is dependent upon the size of the ocean waves. When the storm tide is higher than the top of the beach and the storm tide inundates inland, then the wave setup reduces as the depth of water over the foreshore increases.
The inland evacuation levels assume a forecast storm tide height with a wave setup allowance consistent with inland inundation.
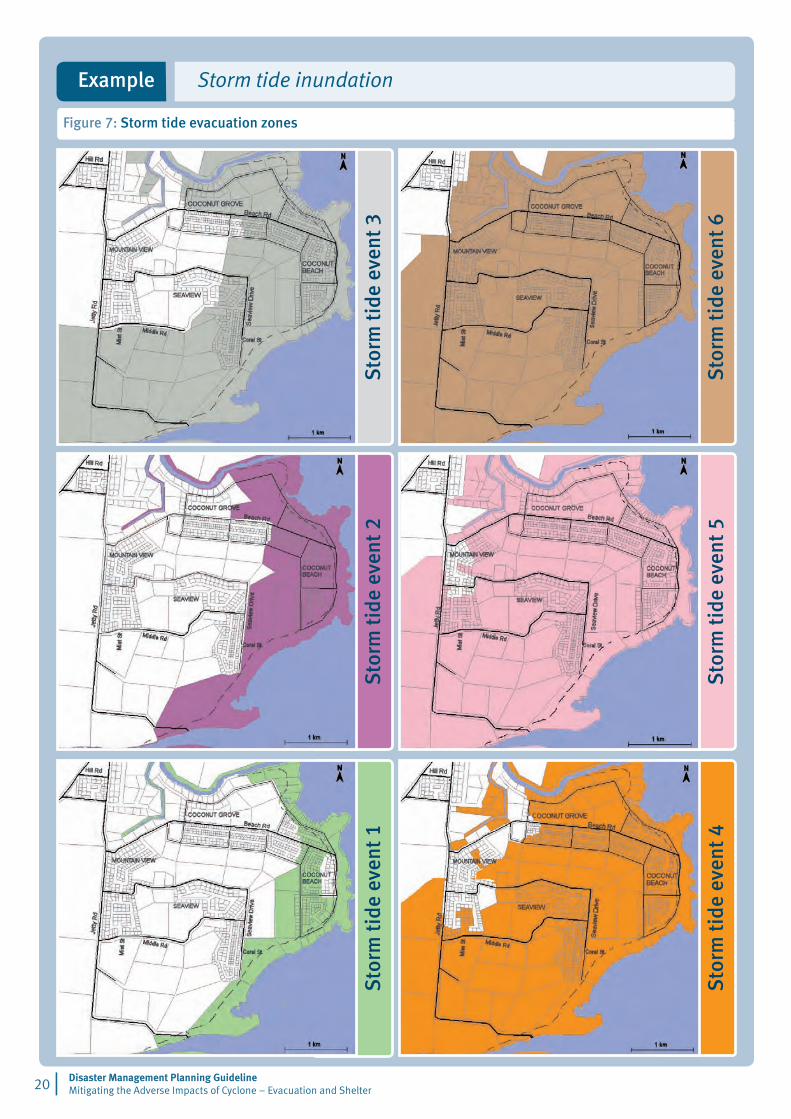
Evacuation zones, mapped with a single colour for each storm tide event, which extent to property boundaries and include an increased inundation level in the frontal area are shown in the example - Figure 7.
| 19Disaster Management Planning Guideline
Mitigating the Adverse Impacts of Cyclone – Evacuation and Shelter
Storm tide event inundation areas
Evacuation zones
Evacuation zones Section B-B
Section A-A
zone 1zone 2
zone 3zone 4
zone 1zone 2
zone 3zone 4
zone 5zone 6
zone 1zone 2
zone 3zone 4
zone 1zone 2
zone 3zone 4
zone 5zone 6
Section A-A
Section B-B
Step 4
Disaster Management Planning Guideline Mitigating the Adverse Impacts of Cyclone – Evacuation and Shelter 20 |
Figure 7: Storm tide evacuation zones
Example Storm tide inundation
Sto
rm ti
de e
vent
2S
torm
tide
eve
nt 1
Sto
rm ti
de e
vent
5S
torm
tide
eve
nt 4
Sto
rm ti
de e
vent
6
Sto
rm ti
de e
vent
3
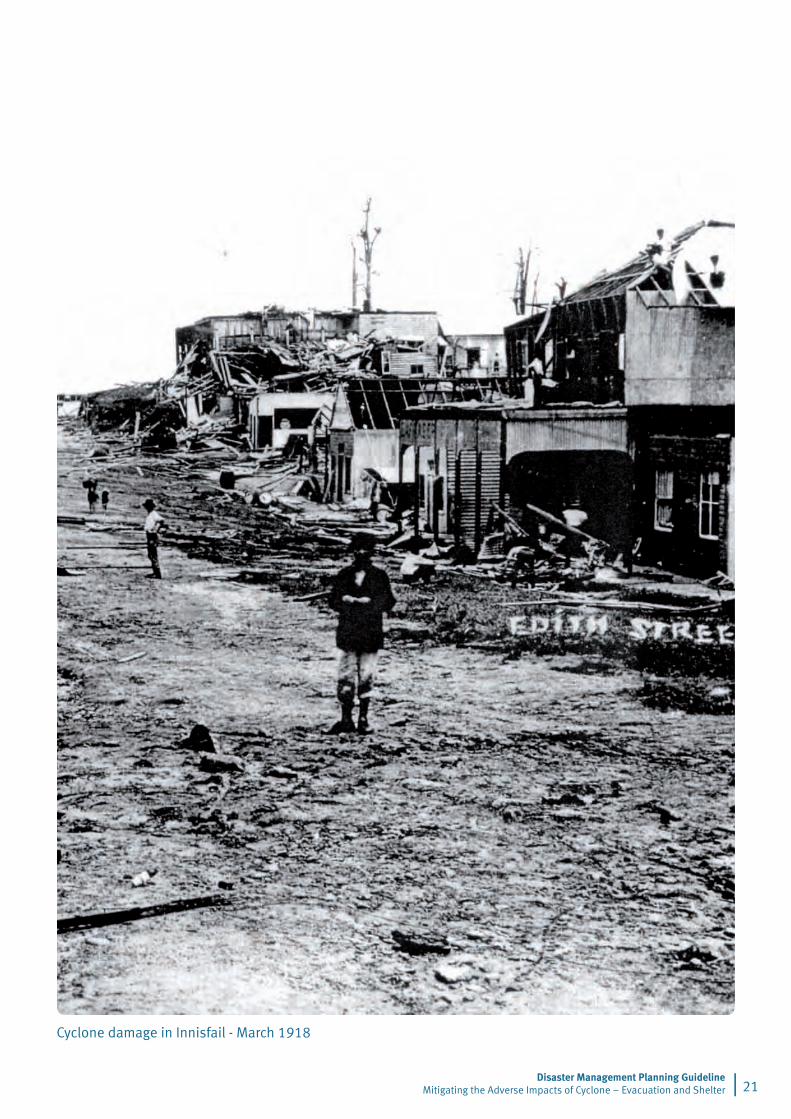
Cyclone damage in Innisfail - March 1918
| ��Disaster Management Planning Guideline
Mitigating the Adverse Impacts of Cyclone – Evacuation and Shelter
Photograph courtesy of the Australian Bureau of Meteorology
Disaster Management Planning Guideline Mitigating the Adverse Impacts of Cyclone – Evacuation and Shelter �� |
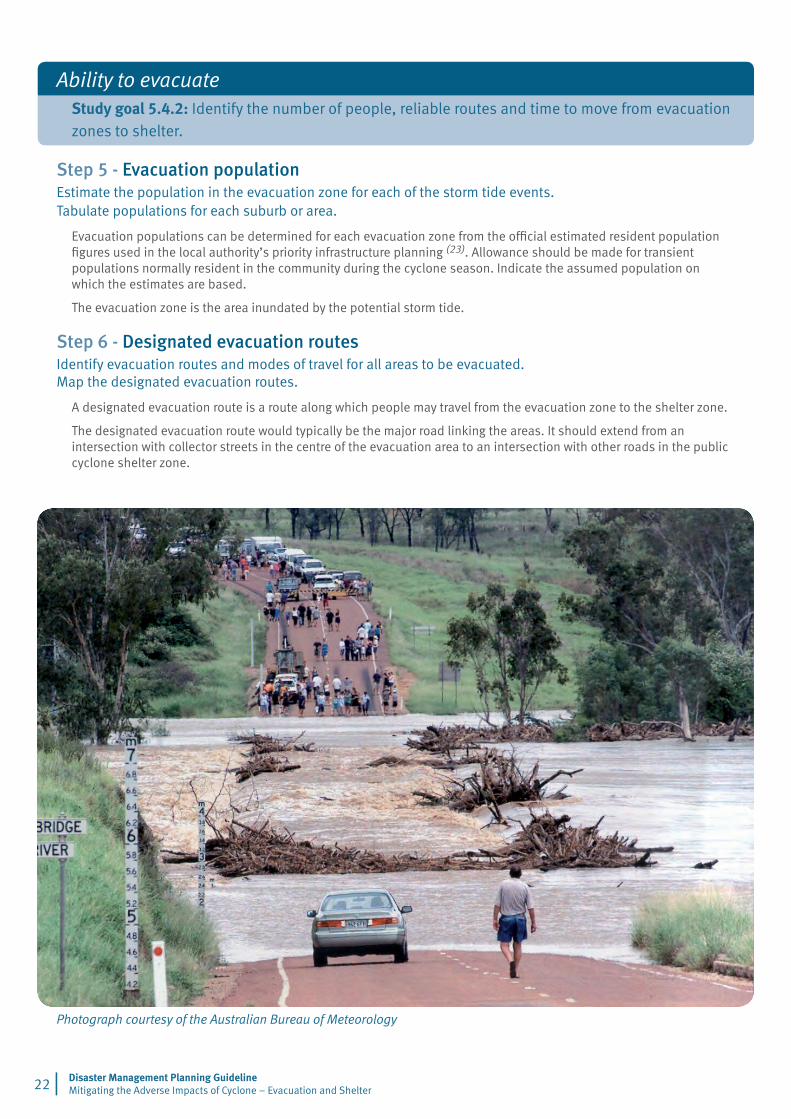
Ability to evacuateStudy goal 5.4.2: Identify the number of people, reliable routes and time to move from evacuation zones to shelter.
Step 5 - Evacuation population Estimate the population in the evacuation zone for each of the storm tide events. Tabulate populations for each suburb or area.
Evacuation populations can be determined for each evacuation zone from the official estimated resident population figures used in the local authority’s priority infrastructure planning (23). Allowance should be made for transient populations normally resident in the community during the cyclone season. Indicate the assumed population on which the estimates are based.
The evacuation zone is the area inundated by the potential storm tide.
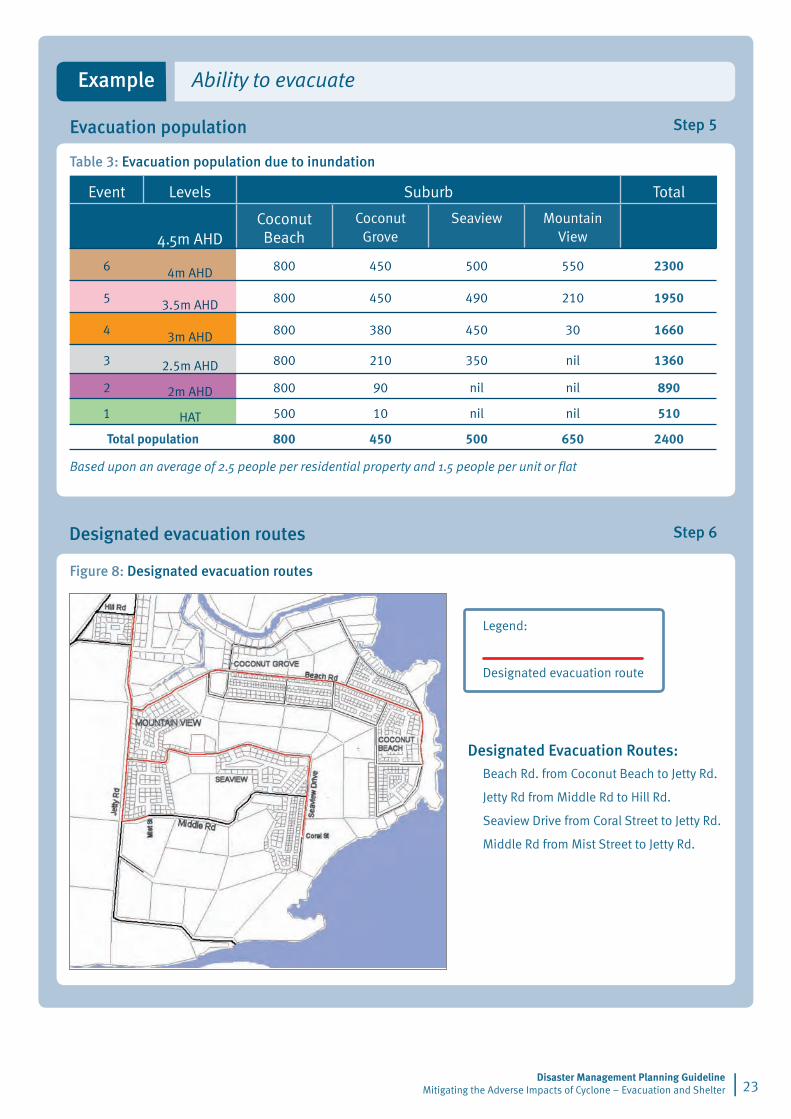
Step 6 - Designated evacuation routesIdentify evacuation routes and modes of travel for all areas to be evacuated. Map the designated evacuation routes.
A designated evacuation route is a route along which people may travel from the evacuation zone to the shelter zone.
The designated evacuation route would typically be the major road linking the areas. It should extend from an intersection with collector streets in the centre of the evacuation area to an intersection with other roads in the public cyclone shelter zone.
| ��Disaster Management Planning Guideline
Mitigating the Adverse Impacts of Cyclone – Evacuation and Shelter
Legend:
Designated evacuation route
Designated Evacuation Routes:Beach Rd. from Coconut Beach to Jetty Rd.
Jetty Rd from Middle Rd to Hill Rd.
Seaview Drive from Coral Street to Jetty Rd.
Middle Rd from Mist Street to Jetty Rd.
Evacuation population
Figure 8: Designated evacuation routes
Table 3: Evacuation population due to inundation
Event Levels Suburb Total
4.5m AHDCoconut Beach
Coconut Grove
Seaview Mountain View
6 4m AHD 800 450 500 550 2300
5 3.5m AHD 800 450 490 210 1950
4 3m AHD 800 380 450 30 1660
� 2.5m AHD 800 210 350 nil 1360
� 2m AHD 800 90 nil nil 890
� HAT 500 10 nil nil 510
Total population 800 450 500 650 2400
Based upon an average of 2.5 people per residential property and 1.5 people per unit or flat
Ability to evacuateExample
Designated evacuation routes
Step 5
Step 6
Disaster Management Planning Guideline Mitigating the Adverse Impacts of Cyclone – Evacuation and Shelter 24 |
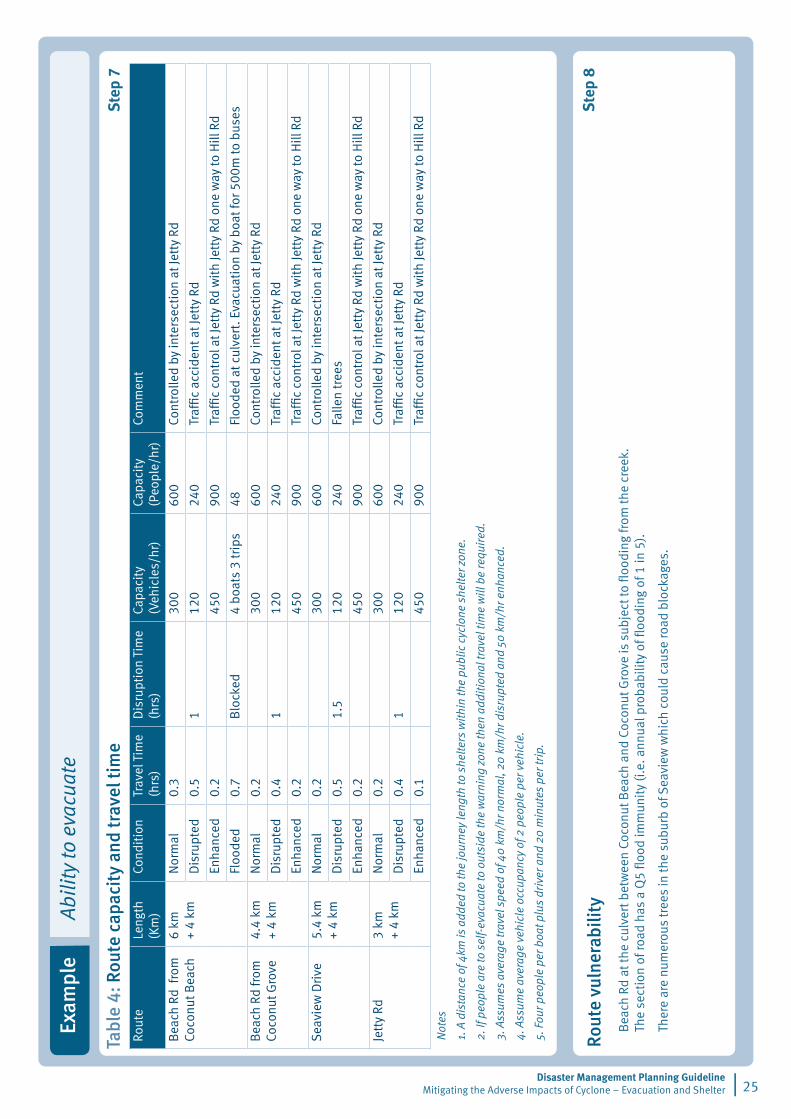
Step 7: Route capacity Determine the capacity of, and travel time along, the evacuation routes.
The capacity (people/hr) of the evacuation routes will vary depending upon route conditions. A range of route conditions, normal and disrupted and, if appropriate, enhanced and blocked should be examined.
Where the time necessary for evacuating the community is greater than six hours, for the normal route condition, determine the appropriate level of emergency management intervention to achieve an evacuation within six hours. Determine the enhanced capacity of the evacuation routes.
Identify hazards which may block the evacuation route. Determine an alternate means and the rate of evacuation.
Route capacity should be assessed individually for each community. The capacity is often controlled by the capacity of the intersection.
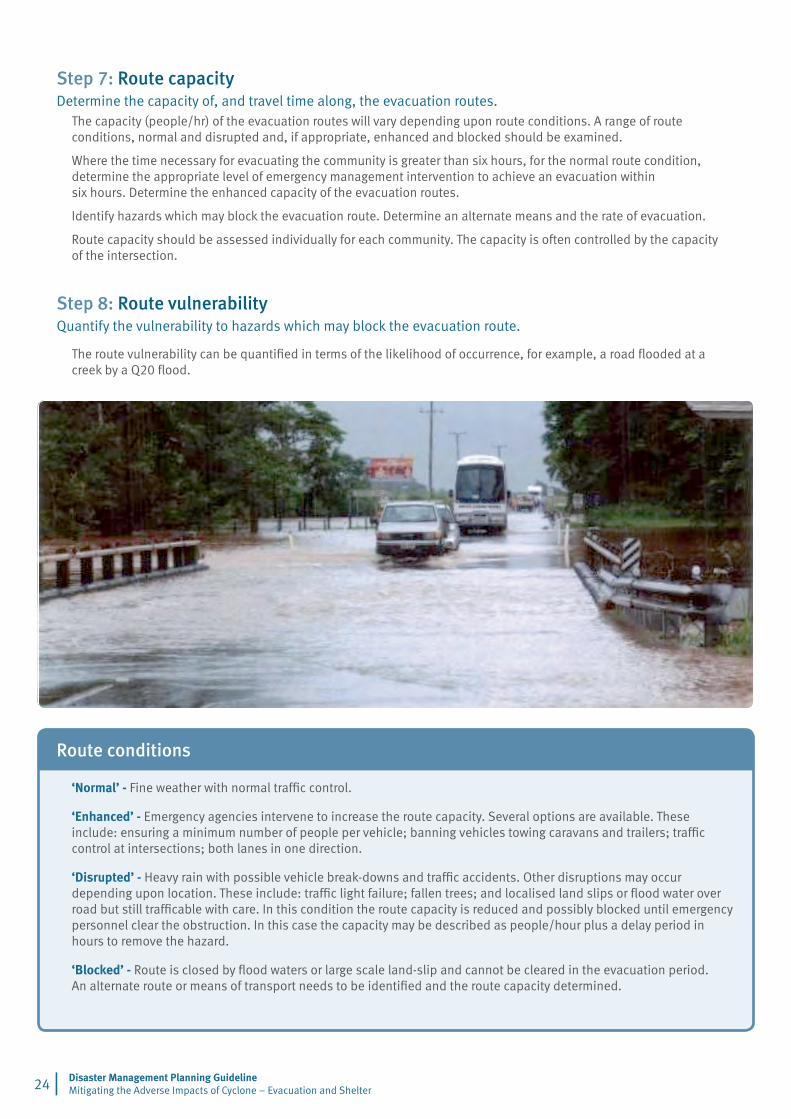
Step 8: Route vulnerability Quantify the vulnerability to hazards which may block the evacuation route.
Route conditions
‘Normal’ - Fine weather with normal traffic control.
‘Enhanced’ - Emergency agencies intervene to increase the route capacity. Several options are available. These include: ensuring a minimum number of people per vehicle; banning vehicles towing caravans and trailers; traffic control at intersections; both lanes in one direction.
‘Disrupted’ - Heavy rain with possible vehicle break-downs and traffic accidents. Other disruptions may occur depending upon location. These include: traffic light failure; fallen trees; and localised land slips or flood water over road but still trafficable with care. In this condition the route capacity is reduced and possibly blocked until emergency personnel clear the obstruction. In this case the capacity may be described as people/hour plus a delay period in hours to remove the hazard.
‘Blocked’ - Route is closed by flood waters or large scale land-slip and cannot be cleared in the evacuation period. An alternate route or means of transport needs to be identified and the route capacity determined.
The route vulnerability can be quantified in terms of the likelihood of occurrence, for example, a road flooded at a creek by a Q20 flood.
Ste
p 7
Ste
p 8
| 25Disaster Management Planning Guideline
Mitigating the Adverse Impacts of Cyclone – Evacuation and Shelter
Tabl
e 4:
Rou
te c
apac
ity
and
trav
el ti
me
Rout
eLe
ngth
(Km
)Co
ndit
ion
Trav
el T
ime
(hrs
)D
isru
ptio
n Ti
me
(hrs
) Ca
paci
ty(V
ehic
les/
hr)
Capa
city
(Peo
ple/
hr)
Com
men
t
Bea
ch R
d fr
om
Coco
nut B
each
6 km
+ 4
kmN
orm
al0.
330
060
0Co
ntro
lled
by in
ters
ecti
on a
t Jet
ty R
d
Dis
rupt
ed0.
5 �
120
240
Traf
fic a
ccid
ent a
t Jet
ty R
d
Enha
nced
0.2
450
900
Traf
fic c
ontr
ol a
t Jet
ty R
d w
ith
Jett
y Rd
one
way
to H
ill R
d
Floo
ded
0.7
Blo
cked
4 bo
ats
3 tr
ips
48Fl
oode
d at
cul
vert
. Eva
cuat
ion
by b
oat f
or 5
00m
to b
uses
Bea
ch R
d fr
om
Coco
nut G
rove
4.4
km+
4 km
Nor
mal
0.2
300
600
Cont
rolle
d by
inte
rsec
tion
at J
etty
Rd
Dis
rupt
ed0.
4�
120
240
Traf
fic a
ccid
ent a
t Jet
ty R
d
Enha
nced
0.2
450
900
Traf
fic c
ontr
ol a
t Jet
ty R
d w
ith
Jett
y Rd
one
way
to H
ill R
d
Sea
view
Dri
ve5.
4 km
+ 4
kmN
orm
al0.
230
060
0Co
ntro
lled
by in
ters
ecti
on a
t Jet
ty R
d
Dis
rupt
ed0.
51.
512
024
0Fa
llen
tree
s
Enha
nced
0.2
450
900
Traf
fic c
ontr
ol a
t Jet
ty R
d w
ith
Jett
y Rd
one
way
to H
ill R
d
Jett
y Rd
3 km
+ 4
kmN
orm
al0.
230
060
0Co
ntro
lled
by in
ters
ecti
on a
t Jet
ty R
d
Dis
rupt
ed0.
4�
120
240
Traf
fic a
ccid
ent a
t Jet
ty R
d
Enha
nced
0.1
450
900
Traf
fic c
ontr
ol a
t Jet
ty R
d w
ith
Jett
y Rd
one
way
to H
ill R
d
Not
es
1. A
dis
tanc
e of
4km
is a
dded
to th
e jo
urne
y le
ngth
to s
helte
rs w
ithin
the
publ
ic c
yclo
ne s
helte
r zon
e.
2. If
peo
ple
are
to s
elf-
evac
uate
to o
utsi
de th
e w
arni
ng z
one
then
add
ition
al tr
avel
tim
e w
ill b
e re
quir
ed.
3. A
ssum
es a
vera
ge tr
avel
spe
ed o
f 40
km
/hr n
orm
al, 2
0 k
m/h
r dis
rupt
ed a
nd 5
0 k
m/h
r enh
ance
d.
4. A
ssum
e av
erag
e ve
hicl
e oc
cupa
ncy
of 2
peo
ple
per v
ehic
le.
5. F
our p
eopl
e pe
r boa
t plu
s dr
iver
and
20
min
utes
per
trip
.
Rout
e vu
lner
abili
ty
Bea
ch R
d at
the
culv
ert b
etw
een
Coco
nut B
each
and
Coc
onut
Gro
ve is
sub
ject
to fl
oodi
ng fr
om th
e cr
eek.
Th
e se
ctio
n of
road
has
a Q
5 flo
od im
mun
ity
(i.e
. ann
ual p
roba
bilit
y of
floo
ding
of 1
in 5
).
Ther
e ar
e nu
mer
ous
tree
s in
the
subu
rb o
f Sea
view
whi
ch c
ould
cau
se ro
ad b
lock
ages
.
Abili
ty to
eva
cuat
e Ex
ampl
e
Disaster Management Planning Guideline Mitigating the Adverse Impacts of Cyclone – Evacuation and Shelter 26 |
Step 9: Evacuation timeline Determine the evacuation timelines for each storm tide evacuation event and present the timelines graphically.
Determine the evacuation timelines for the evacuation route under normal conditions in fair weather. Also estimate timelines assuming the route is disrupted, for example by temporary blockages such as break-downs, fallen trees or localised landslip. If the evacuation time under these conditions is unacceptable estimate the timeline with enhanced traffic flow. Where the route may be blocked, for example by flooding or large landslips, determine the evacuation time for an alternate route or means of evacuation.
Socio-economic factors should be considered in determining the total evacuation time, including for example the number of people:
a) without access to private transport
b) who are disabled and require assistance.
The evacuation timelines show the decision time interval available to commence evacuation.
The Bureau of Meteorology’s Tropical Cyclone Warning Centre commences qualitative warnings 24 hours before the forecast arrival time of 100 km/hr wind gusts (37). Qualitative warnings indicate that the forecast storm tide is greater than or equal to the highest astronomical tide (HAT) and are updated at least every 6 hrs. Quantitative warnings, with estimates of storm tide heights, commence 12 hours before the onset of 100 km/hr winds. Quantitative warnings are updated every 3 hours.
The Tropical Cyclone Storm Tide Warning-Response System (37) proposes that the earliest likely evacuation authorisation for a mandatory evacuation is 9 hours before the onset of 100 km/hr winds. Voluntary evacuations may occur before this time.
Highly vulnerable communities with evacuation timelines greater than 6 to 9hrs need to commence voluntary evacuations prior to the authorisation of mandatory evacuations. The decision to evacuate may need to be made prior to the Bureau of Meteorology’s first quantitative warning at 12hrs before onset of 100 km/hr winds.
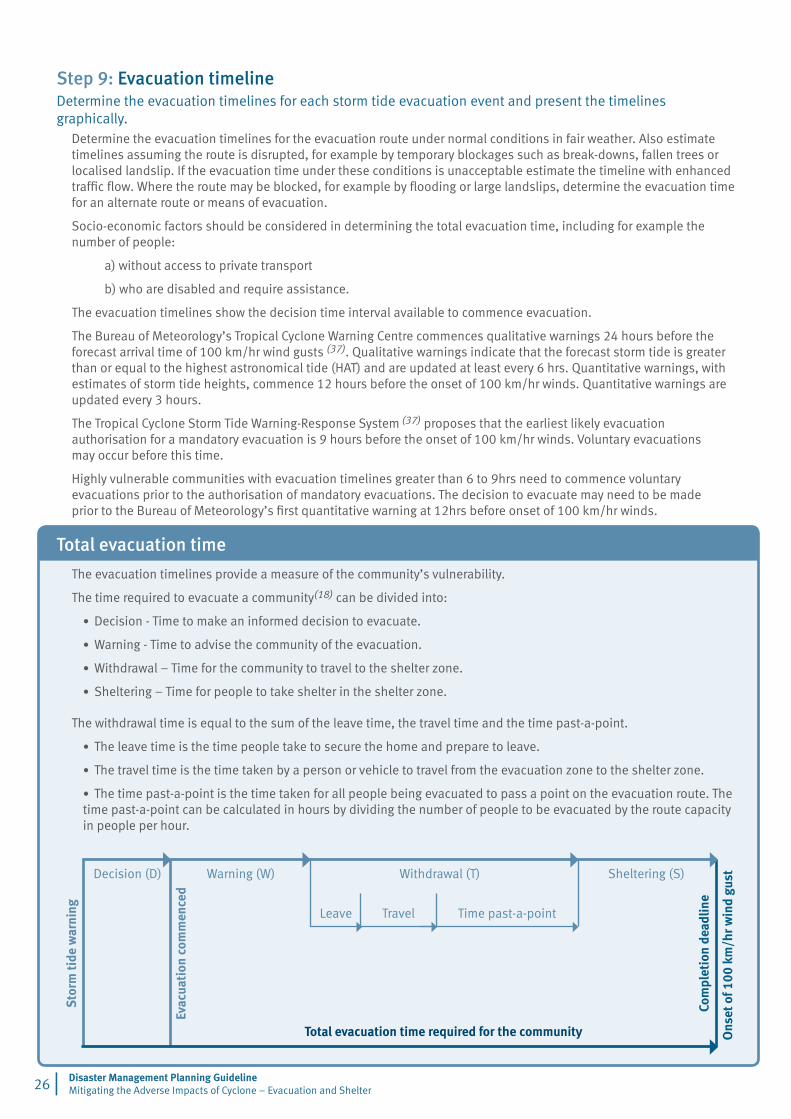
Total evacuation time
The evacuation timelines provide a measure of the community’s vulnerability.
The time required to evacuate a community(18) can be divided into:
Decision - Time to make an informed decision to evacuate.
Warning - Time to advise the community of the evacuation.
Withdrawal – Time for the community to travel to the shelter zone.
Sheltering – Time for people to take shelter in the shelter zone.
The withdrawal time is equal to the sum of the leave time, the travel time and the time past-a-point.
The leave time is the time people take to secure the home and prepare to leave.
The travel time is the time taken by a person or vehicle to travel from the evacuation zone to the shelter zone.
The time past-a-point is the time taken for all people being evacuated to pass a point on the evacuation route. The time past-a-point can be calculated in hours by dividing the number of people to be evacuated by the route capacity in people per hour.
•
•
•
•
•
•
•
Withdrawal (T)
Time past-a-pointTravelLeave
Warning (W) Sheltering (S)Decision (D)
Total evacuation time required for the community
Sto
rm ti
de w
arni
ng
Evac
uati
on c
omm
ence
d
Com
plet
ion
dead
line
Ons
et o
f 100
km
/hr w
ind
gust

Fig
ure
9: E
vacu
atio
n ti
mel
ines
– S
torm
Tid
e Ev
ents
6, 5
Abili
ty to
eva
cuat
e Ex
ampl
e
| 27Disaster Management Planning Guideline
Mitigating the Adverse Impacts of Cyclone – Evacuation and Shelter
Ste
p 9
72 hrs
48 hrs
42 hrs
36 hrs
30 hrs
Preliminary Warning
24 hrs
Preliminary Warning18 hrs
Storm Tide Warning
�� hrs Estimates height
�� hrs
9 hrs Revises estimate
8 hrs
Storm Tide Warning
6 hrs Revises estimate
5 hrs
Storm Tide Warning� hrs Revises estimate
� hrs
� hr
Storm Tide Warning
Evac
uati
onT
imel
ines
(hrs
)Ro
ute
Cond
itio
nEv
acua
tion
Ro
ute
Evac
uati
on
Popu
lati
onSu
burb
Sto
rm
Tide
Ev
ent
Volu
ntar
y ev
acua
tion
Man
dato
ry e
vacu
atio
n
Aut
horis
atio
nIm
plem
enta
tion
100 km/hr Winds
DW
TT
TT
TS
S N
orm
al
Bea
ch R
d/ Je
tty
Rd80
0Co
conu
t Bea
ch
6
DW
TT
TS
S E
nhan
ced
DW
TT
TT
TT
TT
TT
TS
S D
isru
pted
D W
T T
T T
T T
TT
TT
TT
TT
TT
TS
Flo
oded
DW
TT
TT
TS
S N
orm
alB
each
Rd/
Jett
y Rd
450
Coco
nut G
rove
DW
TT
TS
S E
nhan
ced
D
W T
TT
TT
TT
TT
TT
SS
Dis
rupt
ed
DW
TT
TT
TS
S N
orm
alS
eavi
ew D
r/Je
tty
Rd50
0S
eavi
ewD
WT
TT
SS
Enh
ance
d
DW
T T
TT
TT
TT
TT
TT
SS
Dis
rupt
ed
DW
TT
TT
TS
S N
orm
al
Jett
y Rd
550
Mou
ntai
nVi
ewD
WT
TT
SS
Enh
ance
d
DW
TT
TT
TT
TT
TT
TS
S D
isru
pted
DW
TT
TT
SS
Nor
mal
Bea
ch R
d/ Je
tty
Rd80
0Co
conu
t Bea
ch
5
DW
TT
TS
S E
nhan
ced
D
WT
TT
TT
TT
TT
TS
S D
isru
pted
D W
T T
T T
T T
TT
TT
TT
TT
TT
TS
Flo
oded
DW
TT
TT
SS
Nor
mal
Bea
ch R
d/ Je
tty
Rd45
0Co
conu
t Gro
veD
WT
TT
SS
Enh
ance
d
D
WT
TT
TT
TT
TT
TS
S D
isru
pted
DW
TT
TT
SS
Nor
mal
Sea
view
Dr/
Jett
y Rd
490
Sea
view
DW
TT
TS
S E
nhan
ced
D
WT
TT
TT
TT
TT
TS
S D
isru
pted
D
WT
TT
TS
S N
orm
al
Jett
y Rd
210
Mou
ntai
nVi
ewD
WT
TT
SS
Enh
ance
d
D
WT
TT
TT
TT
TT
TS
S D
isru
pted
Lege
nd: D
– D
ecis
ion
Tim
e; W
– W
arni
ng T
ime;
T –
With
draw
al T
ime;
S –
She
lteri
ng T
ime
Abili
ty to
eva
cuat
e
Exam
ple
Disaster Management Planning Guideline Mitigating the Adverse Impacts of Cyclone – Evacuation and Shelter 28 |
Evac
uati
on T
imel
ines
(hrs
)Ro
ute
Co
ndit
ion
Evac
uati
on
Rout
eEv
acua
tion
Po
pula
tion
Subu
rbS
torm
Ti
de
Even
tVo
lunt
ary
evac
uati
onM
anda
tory
eva
cuat
ion
Aut
horis
atio
nIm
plem
enta
tion
DW
TT
TT
SS
Nor
mal
Bea
ch R
d/ Je
tty
Rd80
0Co
conu
t B
each
4
DW
TT
TS
S E
nhan
ced
DW
TT
TT
TT
TT
TS
S D
isru
pted
DW
T T
T T
T T
TT
TT
TT
TT
TT
TS
Flo
oded
DW
TT
TS
S N
orm
alB
each
Rd/
Jett
y Rd
380
Coco
nut
Gro
veD
WT
TT
TT
TT
TT
SS
Dis
rupt
ed
DW
TT
TS
S N
orm
alS
eavi
ew D
r/Je
tty
Rd45
0S
eavi
ewD
WT
TT
TT
TT
TT
SS
Dis
rupt
ed
DW
TT
TS
S N
orm
alJe
tty
Rd30
Mou
ntai
nVi
ewD
WT
TT
TT
TT
TT
SS
Dis
rupt
ed
DW
TT
TS
S N
orm
alB
each
Rd/
Jett
y Rd
800
Coco
nut
Bea
ch
�
DW
TT
TT
TT
TS
S D
isru
pted
DW
T T
T
TT
TT
TT
TT
TT
TT
TT
S F
lood
ed
DW
TT
TS
S N
orm
alB
each
Rd/
Jett
y Rd
210
Coco
nut
Gro
veD
WT
TT
TT
TT
SS
Dis
rupt
ed
DW
TT
TS
S N
orm
alS
eavi
ew D
r/Je
tty
Rd35
0S
eavi
ewD
WT
TT
TT
TT
TS
S D
isru
pted
Nor
mal
Jett
y Rd
nil
Mou
ntai
nVi
ew D
isru
pted
Lege
nd: D
– D
ecis
ion
Tim
e; W
– W
arni
ng T
ime;
T –
With
draw
al T
ime;
S –
She
lteri
ng T
ime
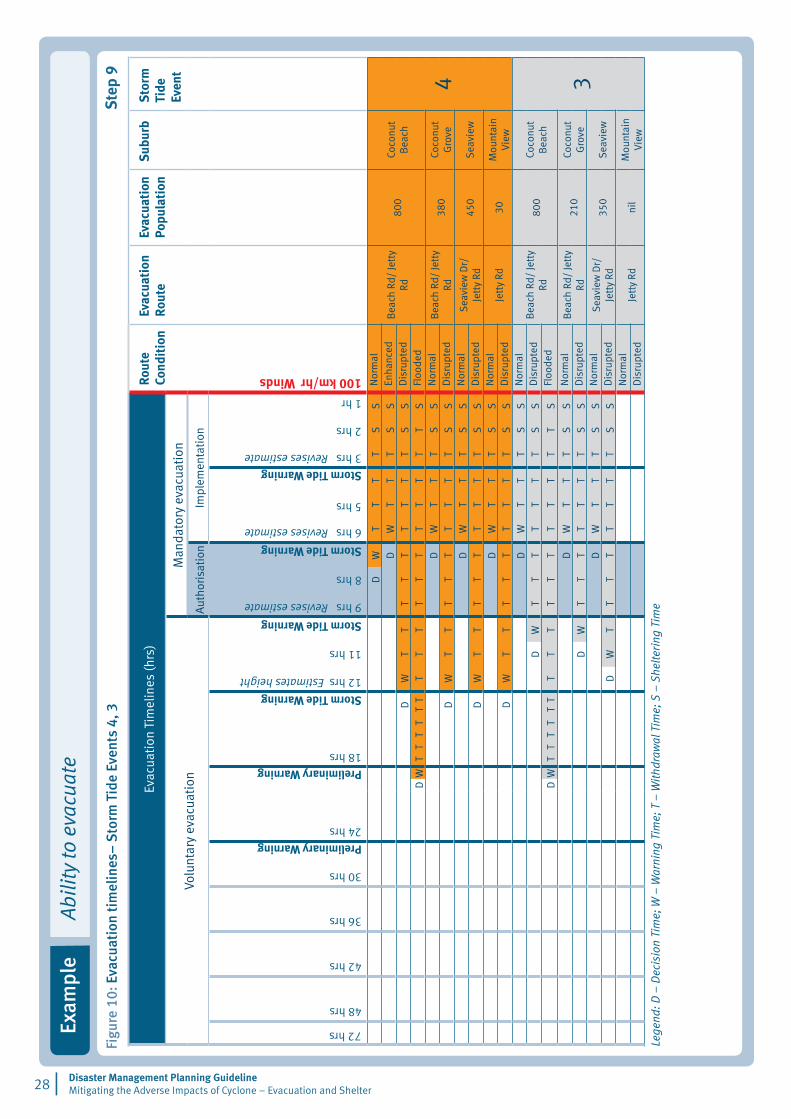
Figu
re 1
0: E
vacu
atio
n ti
mel
ines
– S
torm
Tid
e Ev
ents
4, 3
Ste
p 9
72 hrs
48 hrs
42 hrs
36 hrs
30 hrs
Preliminary Warning24 hrs
Preliminary Warning18 hrs
Storm Tide Warning
�� hrs Estimates height
�� hrs
9 hrs Revises estimate
8 hrs
Storm Tide Warning
6 hrs Revises estimate
5 hrs
Storm Tide Warning� hrs Revises estimate
� hrs
� hr
Storm Tide Warning
100 km/hr Winds
Abili
ty to
eva
cuat
e Ex
ampl
e
| 29Disaster Management Planning Guideline
Mitigating the Adverse Impacts of Cyclone – Evacuation and Shelter
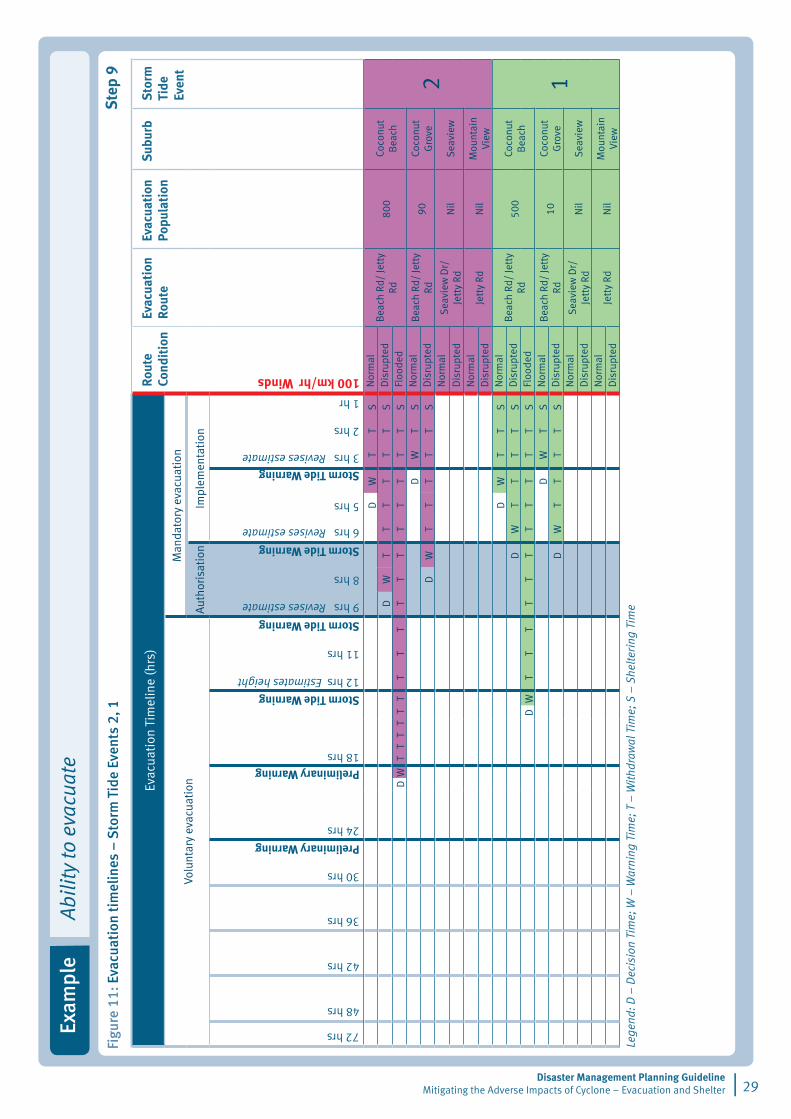
Figu
re 1
1: E
vacu
atio
n ti
mel
ines
– S
torm
Tid
e Ev
ents
2, 1
Evac
uati
on T
imel
ine
(hrs
)Ro
ute
Co
ndit
ion
Evac
uati
on
Rout
eEv
acua
tion
Po
pula
tion
Su
burb
Sto
rm
Tide
Ev
ent
Volu
ntar
y ev
acua
tion
Man
dato
ry e
vacu
atio
n
Aut
horis
atio
nIm
plem
enta
tion
DW
TT
S N
orm
alB
each
Rd/
Jett
y Rd
800
Coco
nut
Bea
ch
�
DW
TT
TT
TT
S D
isru
pted
DW
T T
T
T T
T
TT
TT
TT
TT
TT
TS
Flo
oded
DW
TS
Nor
mal
Bea
ch R
d/ Je
tty
Rd90
Coco
nut
Gro
veD
WT
TT
TT
S D
isru
pted
Nor
mal
Sea
view
Dr/
Jett
y Rd
Nil
Sea
view
Dis
rupt
ed N
orm
alJe
tty
RdN
ilM
ount
ain
View
Dis
rupt
ed
DW
TT
S N
orm
alB
each
Rd/
Jett
y Rd
500
Coco
nut
Bea
ch
�
DW
TT
TT
S D
isru
pted
D
WT
TT
TT
TT
TT
TT
S F
lood
ed
DW
TS
Nor
mal
Bea
ch R
d/ Je
tty
Rd10
Coco
nut
Gro
veD
WT
TT
TS
Dis
rupt
ed N
orm
alS
eavi
ew D
r/Je
tty
RdN
ilS
eavi
ew D
isru
pted
Nor
mal
Jett
y Rd
Nil
Mou
ntai
nVi
ew D
isru
pted
Lege
nd: D
– D
ecis
ion
Tim
e; W
– W
arni
ng T
ime;
T –
With
draw
al T
ime;
S –
She
lteri
ng T
ime
Ste
p 9
72 hrs
48 hrs
42 hrs
36 hrs
30 hrs
Preliminary Warning
24 hrs
Preliminary Warning18 hrs
Storm Tide Warning
�� hrs Estimates height
�� hrs
9 hrs Revises estimate
8 hrs
Storm Tide Warning
6 hrs Revises estimate
5 hrs
Storm Tide Warning� hrs Revises estimate
� hrs
� hr
Storm Tide Warning
100 km/hr Winds
Disaster Management Planning Guideline Mitigating the Adverse Impacts of Cyclone – Evacuation and Shelter 30 |
Wind resistance of housingStudy goal 5.4.3: Identify housing complying with cyclone building standards and the population evacuating from housing above the storm tide evacuation zone.
Step 10 - Map complying housing Map suburbs and developments which are built to cyclone building standards.
Housing in suburbs constructed after 1982 should be built to cyclone building standards.
Where public shelters are not available, these suburbs and developments provide the best option for shelter for people evacuated from potential storm tide inundation areas.
Where public shelters are available these suburbs and developments provide an alternative shelter option provided the houses are well maintained.
Step 11 - Housing vulnerable to windEstimate the population in structural vulnerable accommodation, such as caravans and temporary buildings, and the population housed in accommodation which does not comply with current building codes.
In suburbs developed prior to 1982 some houses/accommodation will have been re-developed or upgraded to comply with cyclone building standards.
Step 12 – Population evacuating housing Estimate the number of people housed above the storm tide evacuation zone who may evacuate. Tabulate this evacuation population for each storm tide event.
A number of people with accommodation located above the storm tide evacuation zones may evacuate.
The proportion of people evacuating may be greater for vulnerable construction than for complying construction. Some people may shelter in complying accommodation or public shelters and others may travel to be out of the cyclone’s path.
This evacuation population may be greater for more intense cyclones which have greater potential for damage.
Community surveys can provide a basis upon which to estimate this population.
Structural Vulnerability
In 1975, following Cyclone Tracy, wind loads specified in the Australian Wind Loading standard were increased substantially for cyclonic areas.
Consequently, typically buildings constructed in Queensland’s cyclone region prior to 1975 do not comply with current wind loading standards.
With the introduction of Appendix IV to the Qld Building Act (7) in 1982 it became mandatory for houses to be constructed to resist cyclonic wind loads similar to current standards.
Typically housing constructed prior to 1975 does not comply with current standards. Housing constructed between 1975 and 1982 may comply. Housing constructed after 1982 should comply.
Construction Description Comment
Non-complying Non Permanent Construction Caravans etc
Housing Pre 1982 (incl 1982) Appendix IV to the Qld Building Act was introduced in 1982.Complying Housing Post 1982
Housing in Queensland’s cyclonic region complying with current building standards has a low risk of failure at the design wind speed of 248 km/hr. This corresponds to the mid range of a category 4 cyclone. (Refer Appendix B)
Step 11
Step 10
Step 12
| ��Disaster Management Planning Guideline
Mitigating the Adverse Impacts of Cyclone – Evacuation and Shelter
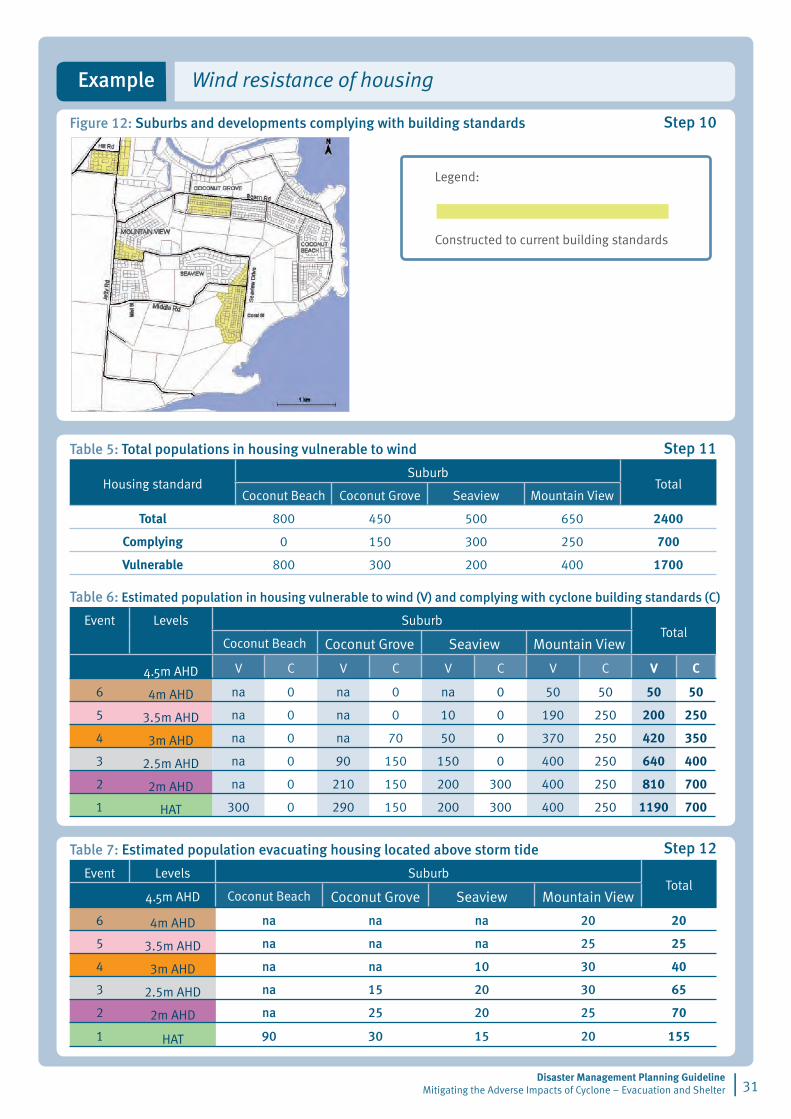
Figure 12: Suburbs and developments complying with building standards
Legend:
Constructed to current building standards
Wind resistance of housingExample
Table 5: Total populations in housing vulnerable to wind
Housing standardSuburb
TotalCoconut Beach Coconut Grove Seaview Mountain View
Total 800 450 500 650 2400
Complying 0 150 300 250 700
Vulnerable 800 300 200 400 1700
Table 6: Estimated population in housing vulnerable to wind (V) and complying with cyclone building standards (C)
Event Levels SuburbTotal
Coconut Beach Coconut Grove Seaview Mountain View
4.5m AHD V C V C V C V C V C
6 4m AHD na 0 na 0 na 0 50 50 50 50
5 3.5m AHD na 0 na 0 10 0 190 250 200 250
4 3m AHD na 0 na 70 50 0 370 250 420 350
� 2.5m AHD na 0 90 150 150 0 400 250 640 400
� 2m AHD na 0 210 150 200 300 400 250 810 700
� HAT 300 0 290 150 200 300 400 250 1190 700
Table 7: Estimated population evacuating housing located above storm tide
Event Levels SuburbTotal
4.5m AHD Coconut Beach Coconut Grove Seaview Mountain View
6 4m AHD na na na 20 20
5 3.5m AHD na na na 25 25
4 3m AHD na na 10 30 40
� 2.5m AHD na 15 20 30 65
� 2m AHD na 25 20 25 70
� HAT 90 30 15 20 155
Disaster Management Planning Guideline Mitigating the Adverse Impacts of Cyclone – Evacuation and Shelter �� |
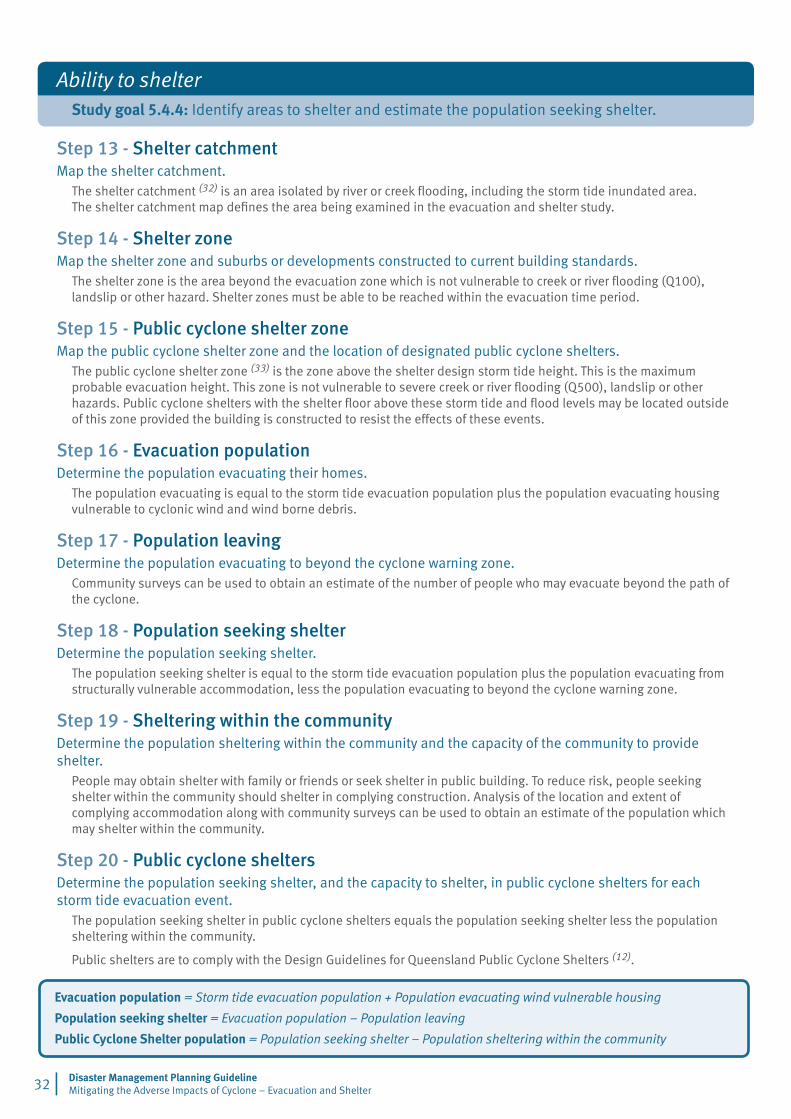
Ability to shelterStudy goal 5.4.4: Identify areas to shelter and estimate the population seeking shelter.
Step 13 - Shelter catchment Map the shelter catchment.
The shelter catchment (32) is an area isolated by river or creek flooding, including the storm tide inundated area. The shelter catchment map defines the area being examined in the evacuation and shelter study.
Step 14 - Shelter zoneMap the shelter zone and suburbs or developments constructed to current building standards.
The shelter zone is the area beyond the evacuation zone which is not vulnerable to creek or river flooding (Q100), landslip or other hazard. Shelter zones must be able to be reached within the evacuation time period.
Step 15 - Public cyclone shelter zoneMap the public cyclone shelter zone and the location of designated public cyclone shelters.
The public cyclone shelter zone (33) is the zone above the shelter design storm tide height. This is the maximum probable evacuation height. This zone is not vulnerable to severe creek or river flooding (Q500), landslip or other hazards. Public cyclone shelters with the shelter floor above these storm tide and flood levels may be located outside of this zone provided the building is constructed to resist the effects of these events.
Step 16 - Evacuation populationDetermine the population evacuating their homes.
The population evacuating is equal to the storm tide evacuation population plus the population evacuating housing vulnerable to cyclonic wind and wind borne debris.
Step 17 - Population leavingDetermine the population evacuating to beyond the cyclone warning zone.
Community surveys can be used to obtain an estimate of the number of people who may evacuate beyond the path of the cyclone.
Step 18 - Population seeking shelter Determine the population seeking shelter.
The population seeking shelter is equal to the storm tide evacuation population plus the population evacuating from structurally vulnerable accommodation, less the population evacuating to beyond the cyclone warning zone.
Step 19 - Sheltering within the community Determine the population sheltering within the community and the capacity of the community to provide shelter.
People may obtain shelter with family or friends or seek shelter in public building. To reduce risk, people seeking shelter within the community should shelter in complying construction. Analysis of the location and extent of complying accommodation along with community surveys can be used to obtain an estimate of the population which may shelter within the community.
Step 20 - Public cyclone shelters Determine the population seeking shelter, and the capacity to shelter, in public cyclone shelters for each storm tide evacuation event.
The population seeking shelter in public cyclone shelters equals the population seeking shelter less the population sheltering within the community.
Public shelters are to comply with the Design Guidelines for Queensland Public Cyclone Shelters (12).
Evacuation population = Storm tide evacuation population + Population evacuating wind vulnerable housing
Population seeking shelter = Evacuation population – Population leaving
Public Cyclone Shelter population = Population seeking shelter – Population sheltering within the community
| ��Disaster Management Planning Guideline
Mitigating the Adverse Impacts of Cyclone – Evacuation and Shelter
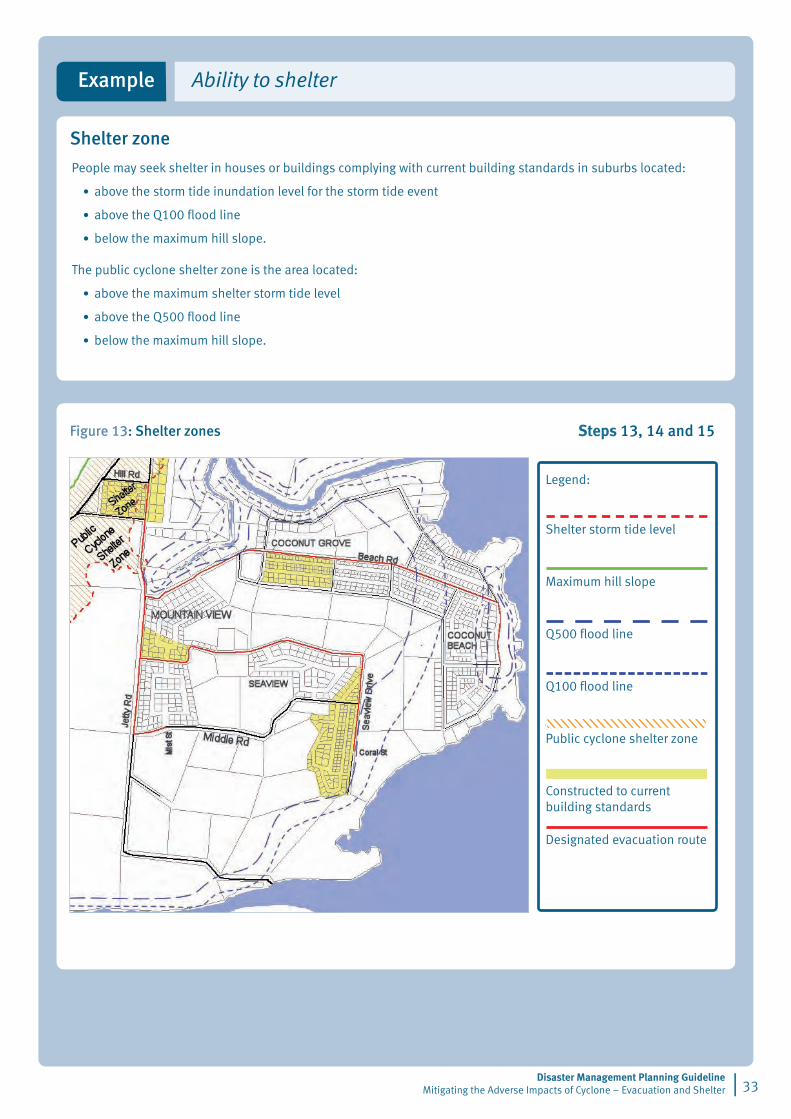
Shelter zone
People may seek shelter in houses or buildings complying with current building standards in suburbs located:
above the storm tide inundation level for the storm tide event
above the Q100 flood line
below the maximum hill slope.
The public cyclone shelter zone is the area located:
above the maximum shelter storm tide level
above the Q500 flood line
below the maximum hill slope.
Figure 13: Shelter zones
•
•
•
•
•
•
Ability to shelterExample
Steps 13, 14 and 15
Legend:
Shelter storm tide level
Maximum hill slope
Q500 flood line
Q100 flood line
Public cyclone shelter zone
Constructed to current building standards
Designated evacuation route
Ability to shelterExample
Sto
rm ti
de e
vent
2S
torm
tide
eve
nt 1
Sto
rm ti
de e
vent
5S
torm
tide
eve
nt 4
Sto
rm ti
de e
vent
6
Sto
rm ti
de e
vent
3
Disaster Management Planning Guideline Mitigating the Adverse Impacts of Cyclone – Evacuation and Shelter 34 |
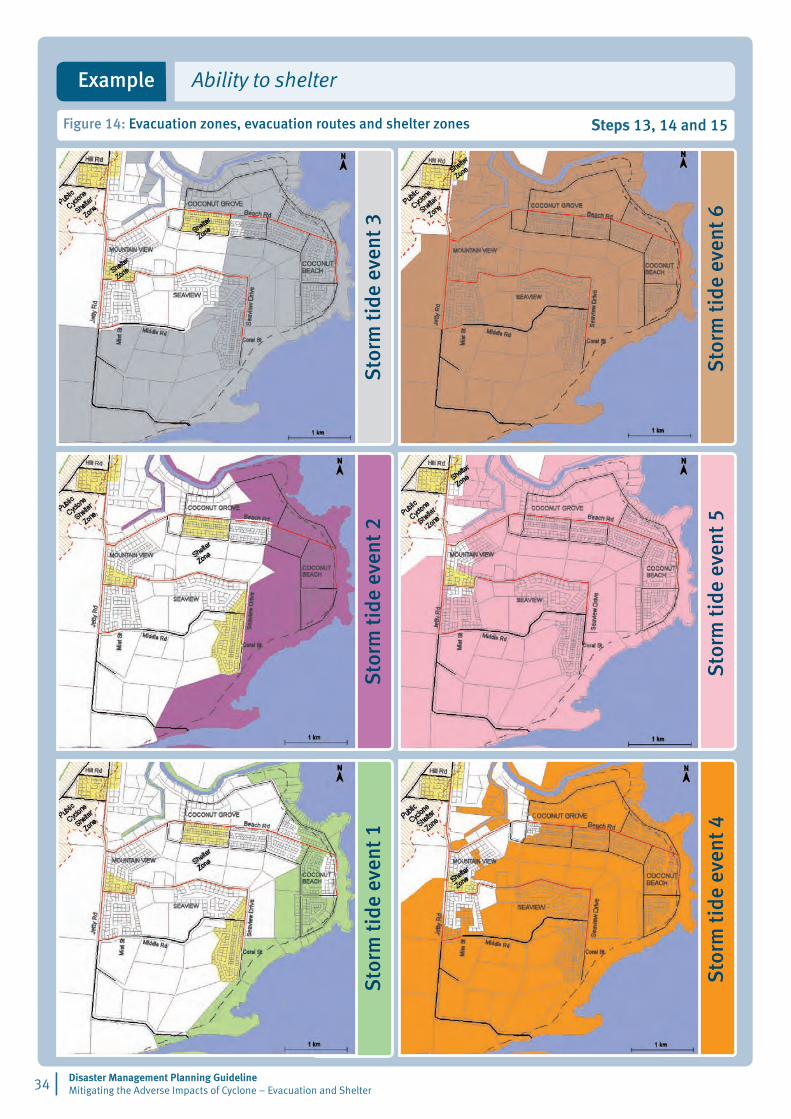
Figure 14: Evacuation zones, evacuation routes and shelter zones Steps 13, 14 and 15
Ability to shelterExample
| 35Disaster Management Planning Guideline
Mitigating the Adverse Impacts of Cyclone – Evacuation and Shelter
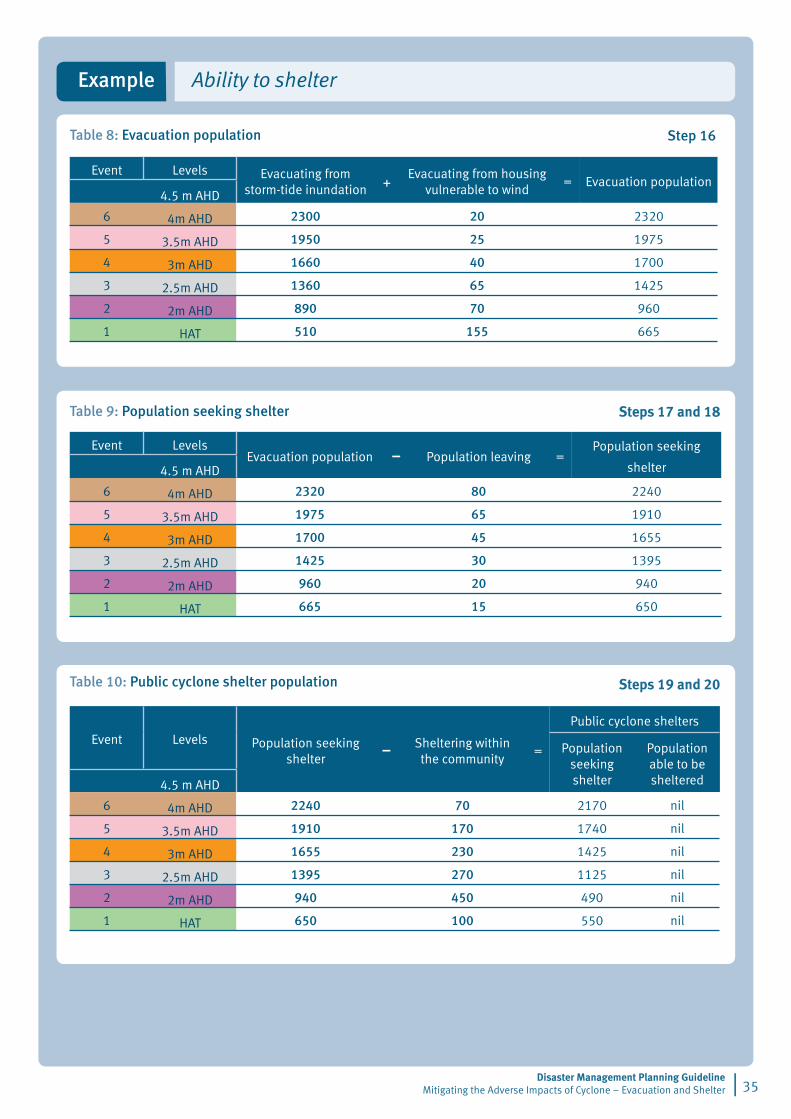
Table 8: Evacuation population
Event Levels Evacuating from storm-tide inundation +
Evacuating from housing vulnerable to wind
= Evacuation population4.5 m AHD
6 4m AHD 2300 20 2320
5 3.5m AHD 1950 25 1975
4 3m AHD 1660 40 1700
� 2.5m AHD 1360 65 1425
� 2m AHD 890 70 960
� HAT 510 155 665
Table 9: Population seeking shelter
Event Levels Evacuation population – Population leaving =
Population seeking
shelter4.5 m AHD
6 4m AHD 2320 80 2240
5 3.5m AHD 1975 65 1910
4 3m AHD 1700 45 1655
� 2.5m AHD 1425 30 1395
� 2m AHD 960 20 940
� HAT 665 15 650
Table 10: Public cyclone shelter population
Event Levels Population seeking shelter
– Sheltering within the community
=
Public cyclone shelters
Population seeking shelter
Population able to be sheltered4.5 m AHD
6 4m AHD 2240 70 2170 nil
5 3.5m AHD 1910 170 1740 nil
4 3m AHD 1655 230 1425 nil
� 2.5m AHD 1395 270 1125 nil
� 2m AHD 940 450 490 nil
� HAT 650 100 550 nil
Step 16
Steps 17 and 18
Steps 19 and 20
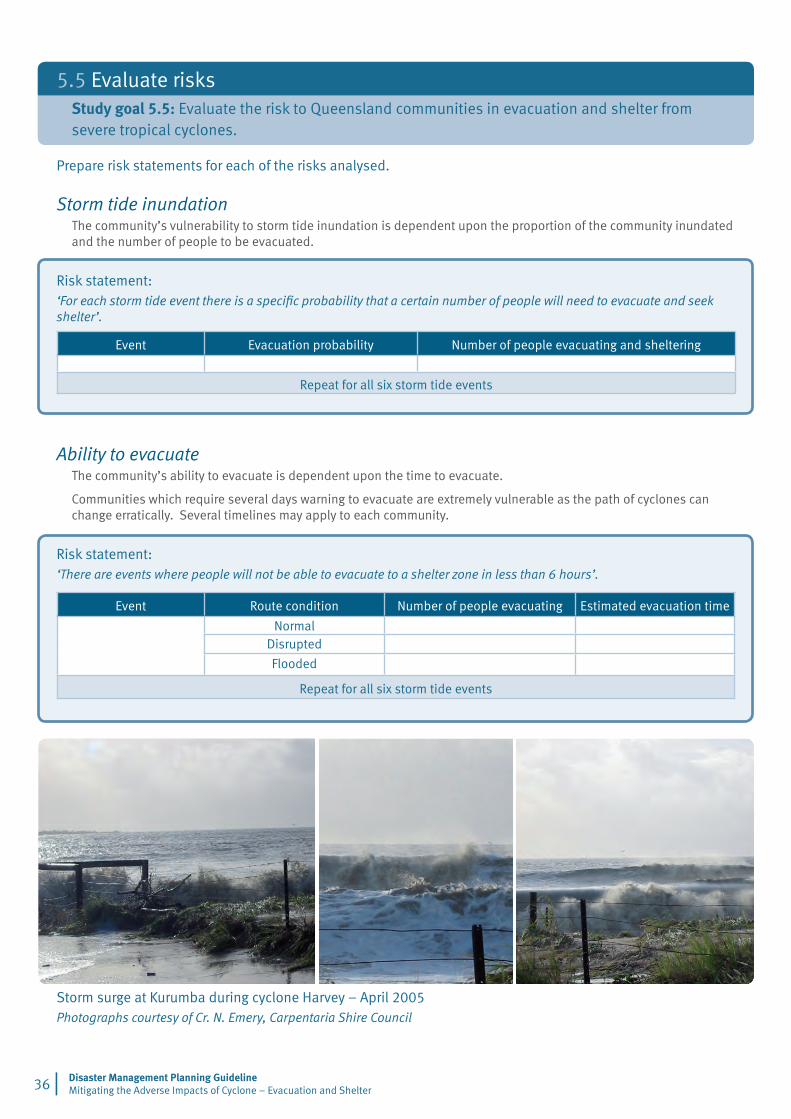
Storm surge at Kurumba during cyclone Harvey – April 2005Photographs courtesy of Cr. N. Emery, Carpentaria Shire Council
Disaster Management Planning Guideline Mitigating the Adverse Impacts of Cyclone – Evacuation and Shelter 36 |
5.5 Evaluate risksStudy goal 5.5: Evaluate the risk to Queensland communities in evacuation and shelter from severe tropical cyclones.
Prepare risk statements for each of the risks analysed.
Storm tide inundationThe community’s vulnerability to storm tide inundation is dependent upon the proportion of the community inundated and the number of people to be evacuated.
Risk statement:‘For each storm tide event there is a specific probability that a certain number of people will need to evacuate and seek shelter’.
Event Evacuation probability Number of people evacuating and sheltering
Repeat for all six storm tide events
Ability to evacuateThe community’s ability to evacuate is dependent upon the time to evacuate.
Communities which require several days warning to evacuate are extremely vulnerable as the path of cyclones can change erratically. Several timelines may apply to each community.
Risk statement:‘There are events where people will not be able to evacuate to a shelter zone in less than 6 hours’.
Event Route condition Number of people evacuating Estimated evacuation time
NormalDisrupted
Flooded
Repeat for all six storm tide events
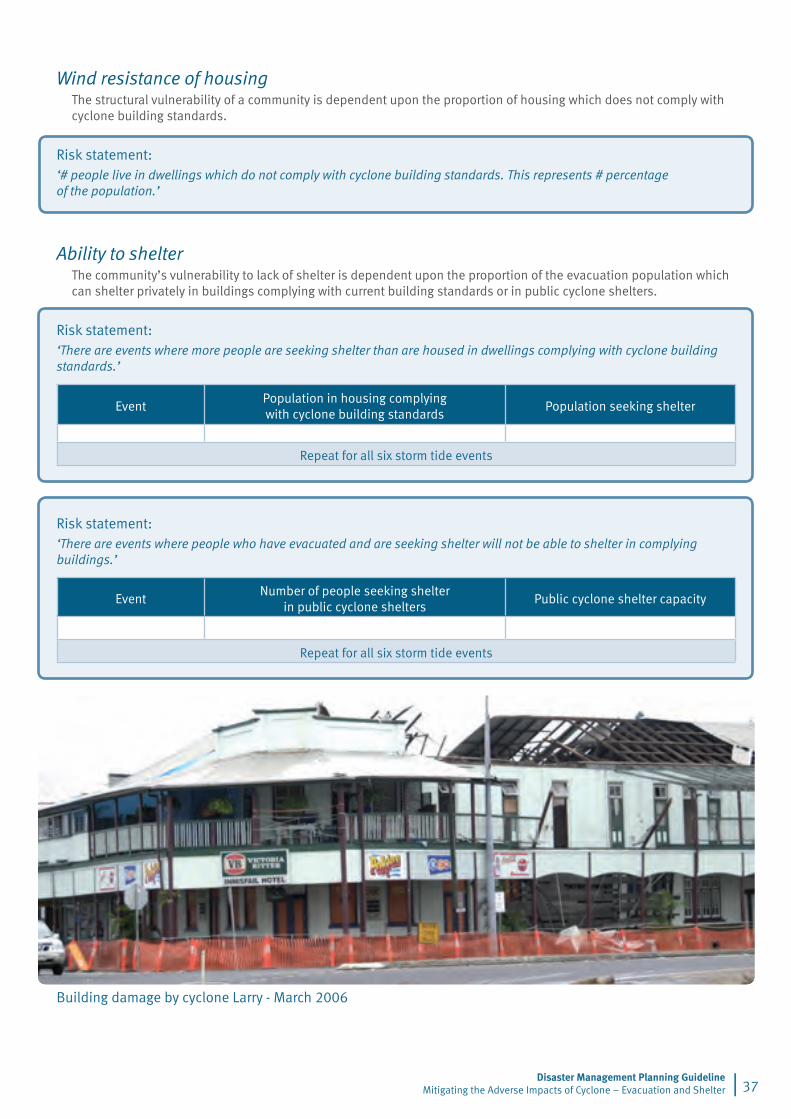
Building damage by cyclone Larry - March 2006
| 37Disaster Management Planning Guideline
Mitigating the Adverse Impacts of Cyclone – Evacuation and Shelter
Wind resistance of housingThe structural vulnerability of a community is dependent upon the proportion of housing which does not comply with cyclone building standards.
Risk statement:‘# people live in dwellings which do not comply with cyclone building standards. This represents # percentage of the population.’
Ability to shelterThe community’s vulnerability to lack of shelter is dependent upon the proportion of the evacuation population which can shelter privately in buildings complying with current building standards or in public cyclone shelters.
Risk statement:‘There are events where more people are seeking shelter than are housed in dwellings complying with cyclone building standards.’
Event Population in housing complying with cyclone building standards
Population seeking shelter
Repeat for all six storm tide events
Risk statement:‘There are events where people who have evacuated and are seeking shelter will not be able to shelter in complying buildings.’
Event Number of people seeking shelter
in public cyclone sheltersPublic cyclone shelter capacity
Repeat for all six storm tide events
Evaluate risksExample
Disaster Management Planning Guideline Mitigating the Adverse Impacts of Cyclone – Evacuation and Shelter 38 |
Risk statements
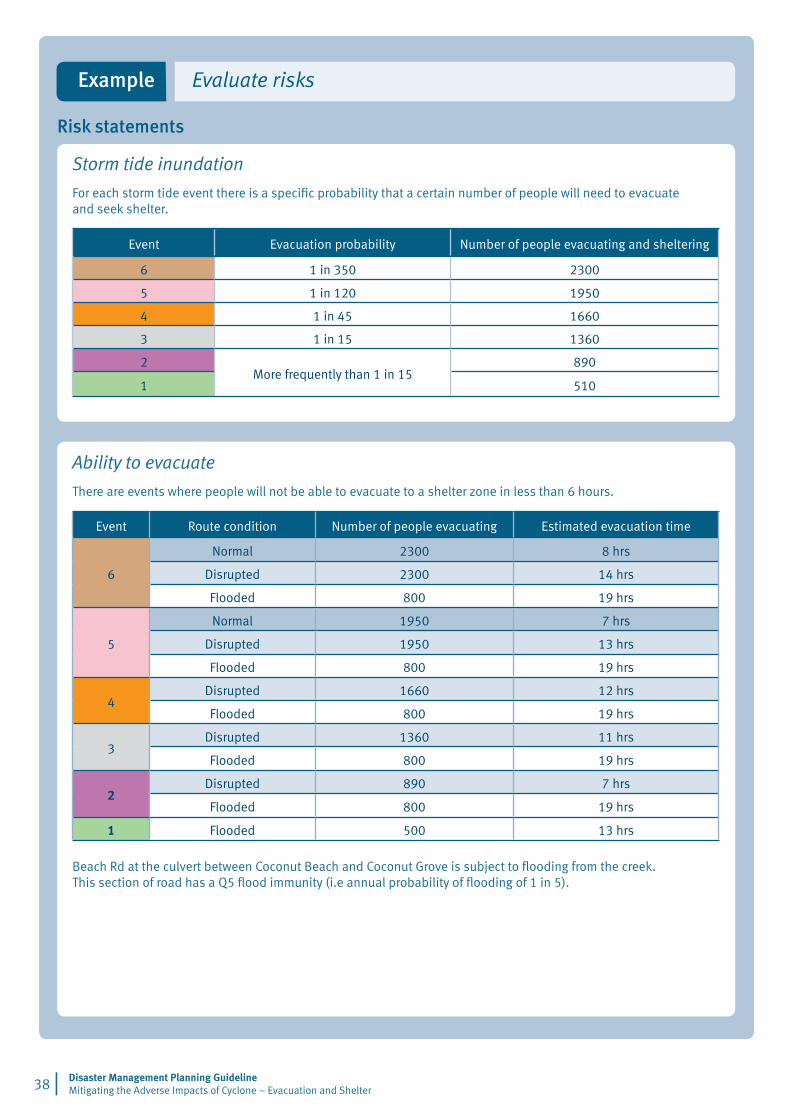
Storm tide inundation
For each storm tide event there is a specific probability that a certain number of people will need to evacuate and seek shelter.
Event Evacuation probability Number of people evacuating and sheltering
6 1 in 350 2300
5 1 in 120 1950
4 1 in 45 1660
� 1 in 15 1360
�More frequently than 1 in 15
890
� 510
Ability to evacuate
There are events where people will not be able to evacuate to a shelter zone in less than 6 hours.
Event Route condition Number of people evacuating Estimated evacuation time
6
Normal 2300 8 hrs
Disrupted 2300 14 hrs
Flooded 800 19 hrs
5
Normal 1950 7 hrs
Disrupted 1950 �� hrs
Flooded 800 19 hrs
4Disrupted 1660 �� hrs
Flooded 800 19 hrs
�Disrupted 1360 �� hrs
Flooded 800 19 hrs
2Disrupted 890 7 hrs
Flooded 800 19 hrs
1 Flooded 500 �� hrs
Beach Rd at the culvert between Coconut Beach and Coconut Grove is subject to flooding from the creek. This section of road has a Q5 flood immunity (i.e annual probability of flooding of 1 in 5).
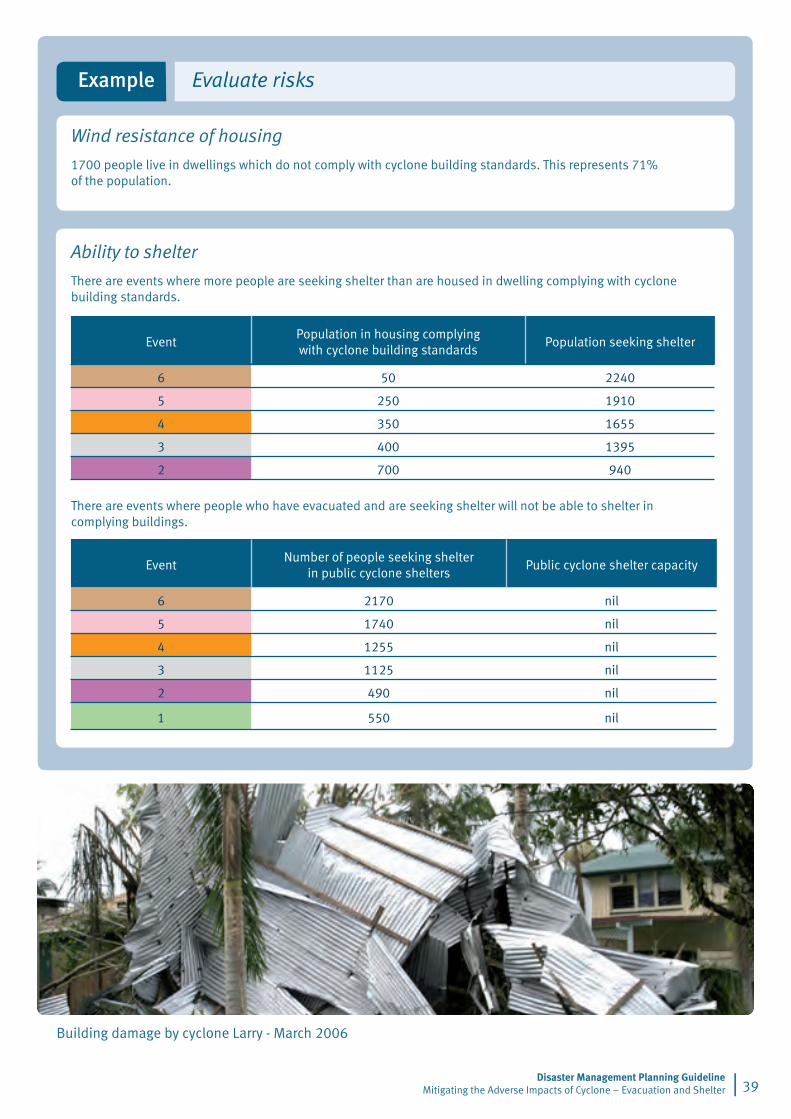
Building damage by cyclone Larry - March 2006
| 39Disaster Management Planning Guideline
Mitigating the Adverse Impacts of Cyclone – Evacuation and Shelter
Evaluate risksExample
Wind resistance of housing
1700 people live in dwellings which do not comply with cyclone building standards. This represents 71% of the population.
Ability to shelter
There are events where more people are seeking shelter than are housed in dwelling complying with cyclone building standards.
EventPopulation in housing complying with cyclone building standards
Population seeking shelter
6 50 2240
5 250 1910
4 350 1655
� 400 1395
� 700 940
There are events where people who have evacuated and are seeking shelter will not be able to shelter in complying buildings.
EventNumber of people seeking shelter
in public cyclone sheltersPublic cyclone shelter capacity
6 2170 nil
5 1740 nil
4 1255 nil
� 1125 nil
� 490 nil
� 550 nil
Disaster Management Planning Guideline Mitigating the Adverse Impacts of Cyclone – Evacuation and Shelter 40 |
5.6 Treat risks – mitigationStudy goal 5.6: Identify schemes to reduce community vulnerability.
PreparednessPlan for the evacuation and shelter of communities based upon current infrastructure
Update operational plans for evacuation and shelter based upon this analysis and evaluation of risks
Inform communities of their vulnerability and educate people on strategies which they may undertake to reduce their risk
Undertake traffic control planning to define the extent of traffic control measures required for each route condition
Tabulate the traffic control measures required for each evacuation route for each storm tide evacuation event.
For example:
Update the operational plan with evacuation zones, evacuation populations, evacuation routes, evacuation timelines and shelter zones for each of the storm tide events.
Educate the community of risks from tropical cyclones with a brochure, distributed with the rates notice, which explains cyclone category, storm tide events, evacuation zones, evacuation populations, evacuation routes, evacuation timelines and shelter zones for each of the storm tide events.
Inform people of their evacuation zone, by showing the evacuation zone for the property on the rates notice and providing an evacuation zone sticker to be mounted in the electrical metre box.
Inform people of their evacuation route and shelter zone for their area, in a brochure included with the rates notice, distributed prior to the cyclone season.
Avoid disruption of designated evacuation routes with roadwork during the cyclone season.
Infrastructure planningIdentify infrastructure solutions to safeguard vulnerable communities
Develop solutions for the community which may involve adjacent communities and local authorities
Estimate the cost of implementing the mitigation strategy and the reduction in risk
Prioritise the mitigation strategies
Inform the Roads Alliance - Regional Roads Group of all designated evacuation routes.
For example:
Construct flood mitigation options to reduce the vulnerability of the evacuation route
Construct levees to reduce a community’s vulnerability to storm tide inundation
Construct public cyclone shelters to provide shelter for people during a severe tropical cyclone.
•
•
•
•
•
•
•
•
•
•
•
•
•
•
•
•
The following have been identified to reduce community vulnerability.
PreparednessThe operational plan has been updated with evacuation zones, evacuation populations, evacuation routes, evacuation timelines and shelter zones for each of the storm tide events.
Cyclone season brochures have been developed to be included with the rates notice and circulated at shopping centres and schools prior to the cyclone season. The brochures explain cyclone categories, storm tide events, evacuation zones, evacuation routes, cyclone building standards, home maintenance and the need for each family to develop a cyclone plan.
For properties in the storm tide evacuation zone, the rates notices have been amended to show the storm tide events which may inundate the property.
Disaster managers are informed of the evacuation timelines for each community and that evacuation of some communities is required prior to the authorisation of mandatory evacuation.
Evacuation route traffic control planning has been undertaken for each of the storm tide events.
The roads capital works program has been arranged so that designated evacuation routes are not disrupted during the cyclone season.
As there is currently insufficient public cyclone shelter capacity a ‘friend-in-high-places’ program has been instigated to encourage people in the shelter zone with houses complying with cyclone building standards to offer their home as a private shelter to a family they know living in an evacuation zone. A brochure has been prepared as part of the program to explain the storm tide event levels. It explains that as the event becomes more severe a house in the shelter zone for one storm tide event may be in the evacuation zone for a more severe storm tide event. The brochure also describes which houses should comply with cyclone building standards and the importance of regular maintenance. It also discusses the need to shelter in a room within the house which provides the best protection from wind-borne debris. Disaster managers are aware that even with this program there is insufficient shelter capacity within the community and have submitted to council a report requesting development of public cyclone shelters.
Infrastructure planningDevelopment of the following infrastructure has been identified to reduce the community vulnerability. The projects are listed in priority:
Shelter Capacity Construct a multi-purpose centre to provide a community facility for indoor sports, performing arts and community events. The building is to be constructed as a public cyclone shelter and would provide shelter accommodation for 1,200 people. Estimated cost of $.... includes $.... to comply with Queensland public cyclone shelter building guidelines.
Evacuation Route Vulnerability Re-construct the culvert on Beach Rd between Coconut Beach and Coconut Grove and raise the road for 0.5km each side of the culvert to achieve Q100 flood immunity along Beach Rd. Estimated cost $....
Evacuation Route Capacity Increase the capacity of the Beach Rd and Jetty Rd intersection and construct a second northern bound lane from this intersection to the Hill Rd intersection. Estimated cost $....
Treat Risks - mitigationExample
| 41Disaster Management Planning Guideline
Mitigating the Adverse Impacts of Cyclone – Evacuation and Shelter
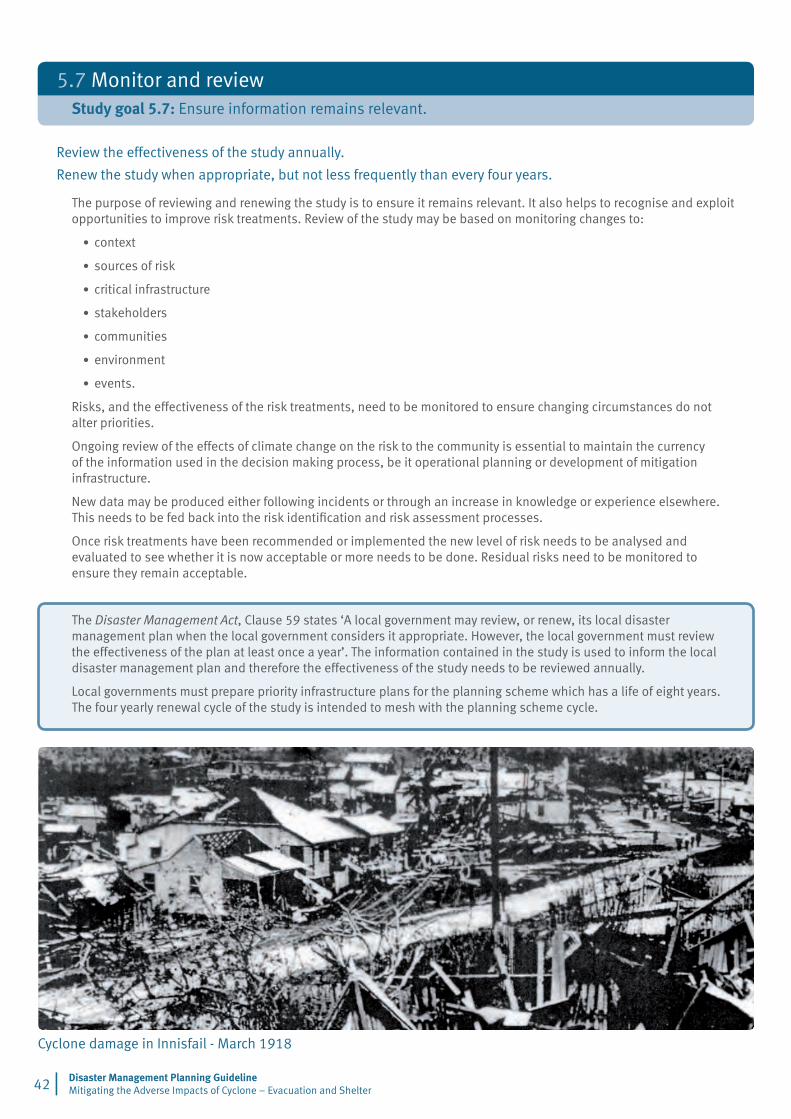
Cyclone damage in Innisfail - March 1918
Disaster Management Planning Guideline Mitigating the Adverse Impacts of Cyclone – Evacuation and Shelter 42 |
5.7 Monitor and reviewStudy goal 5.7: Ensure information remains relevant.
Review the effectiveness of the study annually.
Renew the study when appropriate, but not less frequently than every four years.
The purpose of reviewing and renewing the study is to ensure it remains relevant. It also helps to recognise and exploit opportunities to improve risk treatments. Review of the study may be based on monitoring changes to:
context
sources of risk
critical infrastructure
stakeholders
communities
environment
events.
Risks, and the effectiveness of the risk treatments, need to be monitored to ensure changing circumstances do not alter priorities.
Ongoing review of the effects of climate change on the risk to the community is essential to maintain the currency of the information used in the decision making process, be it operational planning or development of mitigation infrastructure.
New data may be produced either following incidents or through an increase in knowledge or experience elsewhere. This needs to be fed back into the risk identification and risk assessment processes.
Once risk treatments have been recommended or implemented the new level of risk needs to be analysed and evaluated to see whether it is now acceptable or more needs to be done. Residual risks need to be monitored to ensure they remain acceptable.
The Disaster Management Act, Clause 59 states ‘A local government may review, or renew, its local disaster management plan when the local government considers it appropriate. However, the local government must review the effectiveness of the plan at least once a year’. The information contained in the study is used to inform the local disaster management plan and therefore the effectiveness of the study needs to be reviewed annually.
Local governments must prepare priority infrastructure plans for the planning scheme which has a life of eight years. The four yearly renewal cycle of the study is intended to mesh with the planning scheme cycle.
•
•
•
•
•
•
•
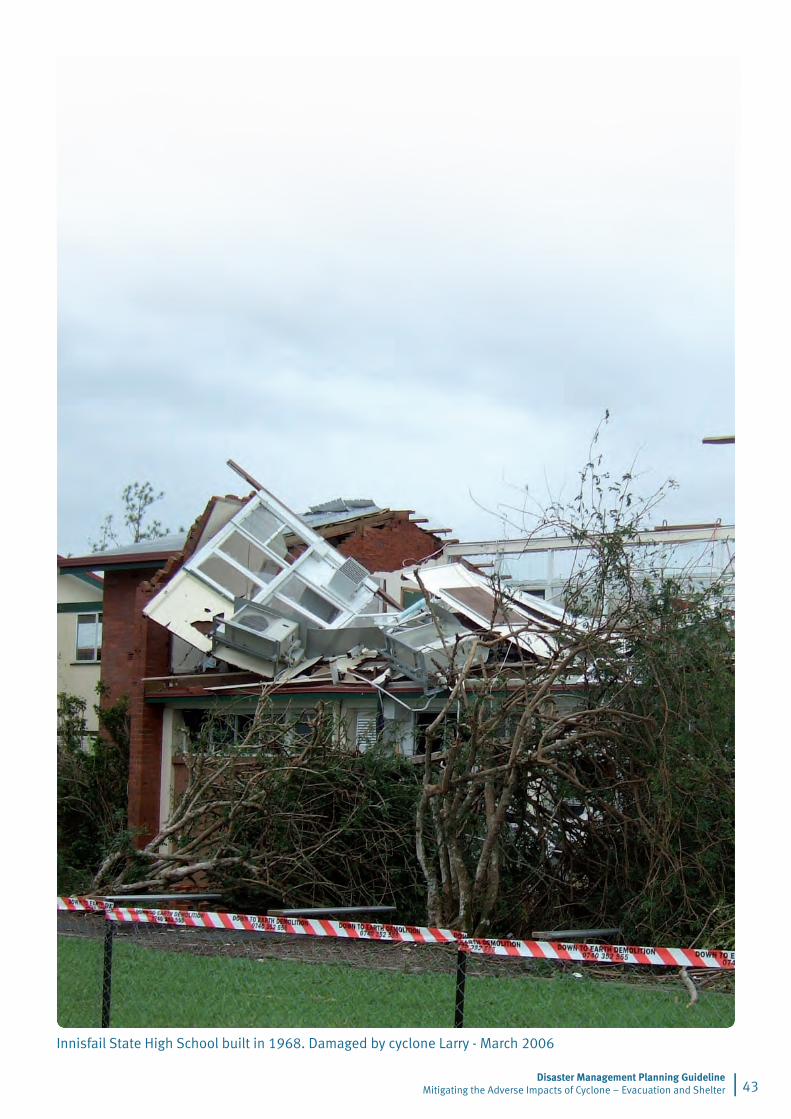
Innisfail State High School built in 1968. Damaged by cyclone Larry - March 2006
| 43Disaster Management Planning Guideline
Mitigating the Adverse Impacts of Cyclone – Evacuation and Shelter
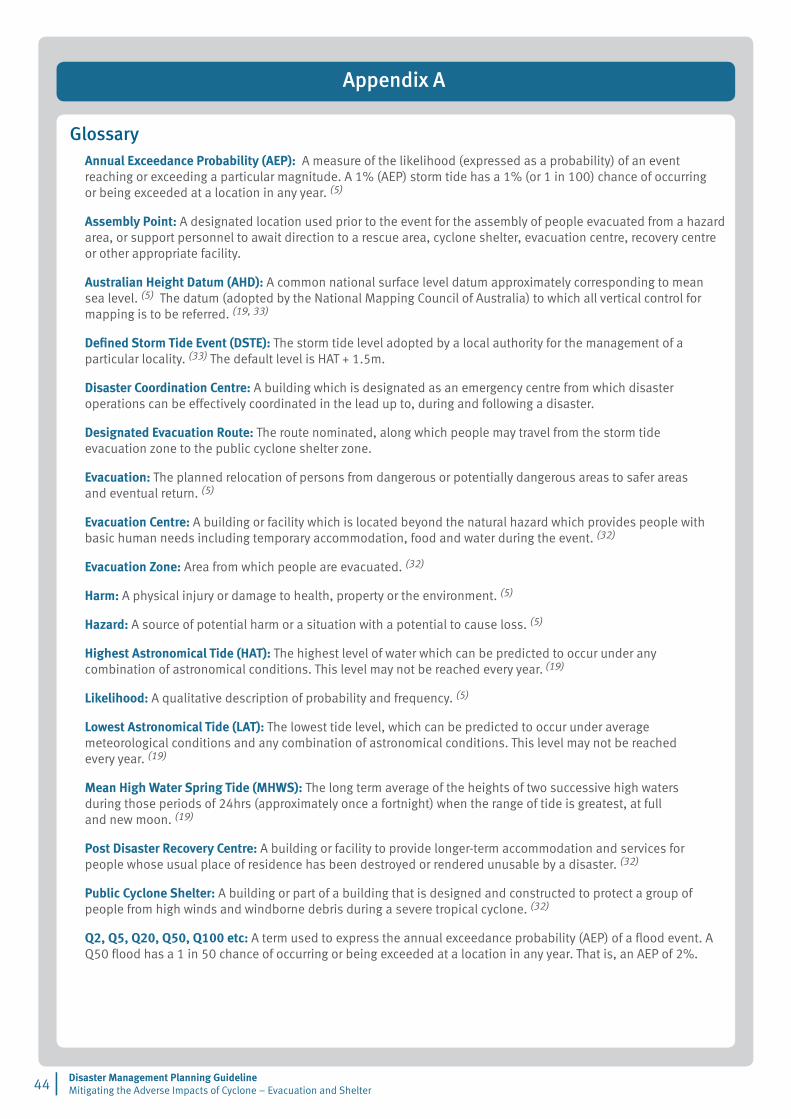
AppendixA
GlossaryAnnual Exceedance Probability (AEP): A measure of the likelihood (expressed as a probability) of an event reaching or exceeding a particular magnitude. A 1% (AEP) storm tide has a 1% (or 1 in 100) chance of occurring or being exceeded at a location in any year. (5)
Assembly Point: A designated location used prior to the event for the assembly of people evacuated from a hazard area, or support personnel to await direction to a rescue area, cyclone shelter, evacuation centre, recovery centre or other appropriate facility.
Australian Height Datum (AHD): A common national surface level datum approximately corresponding to mean sea level. (5) The datum (adopted by the National Mapping Council of Australia) to which all vertical control for mapping is to be referred. (19, 33)
Defined Storm Tide Event (DSTE): The storm tide level adopted by a local authority for the management of a particular locality. (33) The default level is HAT + 1.5m.
Disaster Coordination Centre: A building which is designated as an emergency centre from which disaster operations can be effectively coordinated in the lead up to, during and following a disaster.
Designated Evacuation Route: The route nominated, along which people may travel from the storm tide evacuation zone to the public cyclone shelter zone.
Evacuation: The planned relocation of persons from dangerous or potentially dangerous areas to safer areas and eventual return. (5)
Evacuation Centre: A building or facility which is located beyond the natural hazard which provides people with basic human needs including temporary accommodation, food and water during the event. (32)
Evacuation Zone: Area from which people are evacuated. (32)
Harm: A physical injury or damage to health, property or the environment. (5)
Hazard: A source of potential harm or a situation with a potential to cause loss. (5)
Highest Astronomical Tide (HAT): The highest level of water which can be predicted to occur under any combination of astronomical conditions. This level may not be reached every year. (19)
Likelihood: A qualitative description of probability and frequency. (5)
Lowest Astronomical Tide (LAT): The lowest tide level, which can be predicted to occur under average meteorological conditions and any combination of astronomical conditions. This level may not be reached every year. (19)
Mean High Water Spring Tide (MHWS): The long term average of the heights of two successive high waters during those periods of 24hrs (approximately once a fortnight) when the range of tide is greatest, at full and new moon. (19)
Post Disaster Recovery Centre: A building or facility to provide longer-term accommodation and services for people whose usual place of residence has been destroyed or rendered unusable by a disaster. (32)
Public Cyclone Shelter: A building or part of a building that is designed and constructed to protect a group of people from high winds and windborne debris during a severe tropical cyclone. (32)
Q2, Q5, Q20, Q50, Q100 etc: A term used to express the annual exceedance probability (AEP) of a flood event. A Q50 flood has a 1 in 50 chance of occurring or being exceeded at a location in any year. That is, an AEP of 2%.
Disaster Management Planning Guideline Mitigating the Adverse Impacts of Cyclone – Evacuation and Shelter 44 |
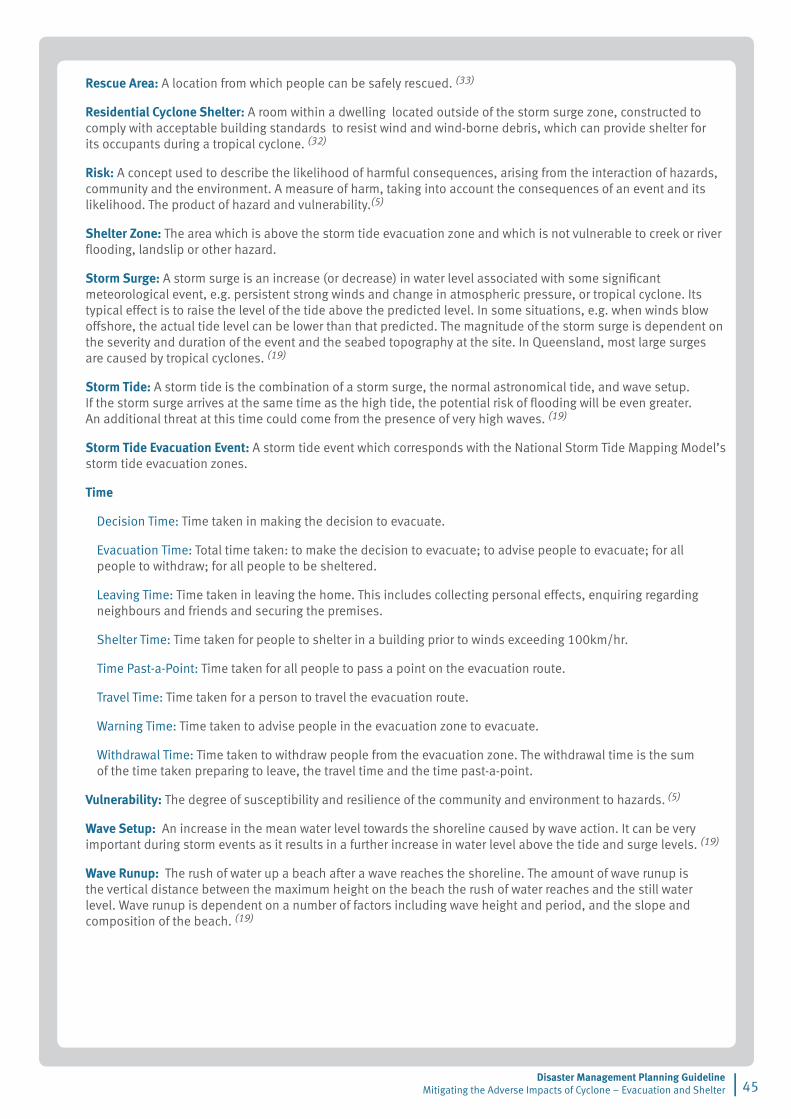
Rescue Area: A location from which people can be safely rescued. (33)
Residential Cyclone Shelter: A room within a dwelling located outside of the storm surge zone, constructed to comply with acceptable building standards to resist wind and wind-borne debris, which can provide shelter for its occupants during a tropical cyclone. (32)
Risk: A concept used to describe the likelihood of harmful consequences, arising from the interaction of hazards, community and the environment. A measure of harm, taking into account the consequences of an event and its likelihood. The product of hazard and vulnerability.(5)
Shelter Zone: The area which is above the storm tide evacuation zone and which is not vulnerable to creek or river flooding, landslip or other hazard.
Storm Surge: A storm surge is an increase (or decrease) in water level associated with some significant meteorological event, e.g. persistent strong winds and change in atmospheric pressure, or tropical cyclone. Its typical effect is to raise the level of the tide above the predicted level. In some situations, e.g. when winds blow offshore, the actual tide level can be lower than that predicted. The magnitude of the storm surge is dependent on the severity and duration of the event and the seabed topography at the site. In Queensland, most large surges are caused by tropical cyclones. (19)
Storm Tide: A storm tide is the combination of a storm surge, the normal astronomical tide, and wave setup. If the storm surge arrives at the same time as the high tide, the potential risk of flooding will be even greater. An additional threat at this time could come from the presence of very high waves. (19)
Storm Tide Evacuation Event: A storm tide event which corresponds with the National Storm Tide Mapping Model’s storm tide evacuation zones.
Time
Decision Time: Time taken in making the decision to evacuate.
Evacuation Time: Total time taken: to make the decision to evacuate; to advise people to evacuate; for all people to withdraw; for all people to be sheltered.
Leaving Time: Time taken in leaving the home. This includes collecting personal effects, enquiring regarding neighbours and friends and securing the premises.
Shelter Time: Time taken for people to shelter in a building prior to winds exceeding 100km/hr.
Time Past-a-Point: Time taken for all people to pass a point on the evacuation route.
Travel Time: Time taken for a person to travel the evacuation route.
Warning Time: Time taken to advise people in the evacuation zone to evacuate.
Withdrawal Time: Time taken to withdraw people from the evacuation zone. The withdrawal time is the sum of the time taken preparing to leave, the travel time and the time past-a-point.
Vulnerability: The degree of susceptibility and resilience of the community and environment to hazards. (5)
Wave Setup: An increase in the mean water level towards the shoreline caused by wave action. It can be very important during storm events as it results in a further increase in water level above the tide and surge levels. (19)
Wave Runup: The rush of water up a beach after a wave reaches the shoreline. The amount of wave runup is the vertical distance between the maximum height on the beach the rush of water reaches and the still water level. Wave runup is dependent on a number of factors including wave height and period, and the slope and composition of the beach. (19)
| 45Disaster Management Planning Guideline
Mitigating the Adverse Impacts of Cyclone – Evacuation and Shelter
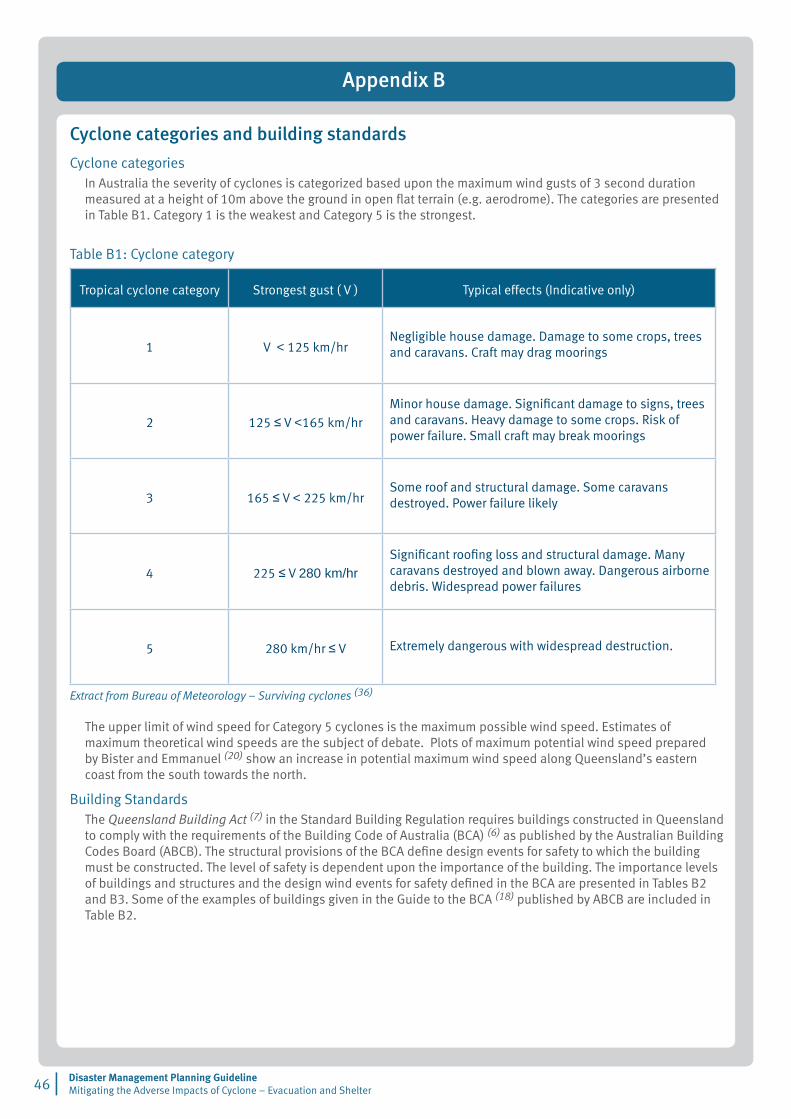
AppendixB
Cyclone categories and building standards
Cyclone categoriesIn Australia the severity of cyclones is categorized based upon the maximum wind gusts of 3 second duration measured at a height of 10m above the ground in open flat terrain (e.g. aerodrome). The categories are presented in Table B1. Category 1 is the weakest and Category 5 is the strongest.
Table B1: Cyclone category
Tropical cyclone category Strongest gust ( V ) Typical effects (Indicative only)
� V < 125 km/hrNegligible house damage. Damage to some crops, trees and caravans. Craft may drag moorings
� 125 ≤ V <165 km/hrMinor house damage. Significant damage to signs, trees and caravans. Heavy damage to some crops. Risk of power failure. Small craft may break moorings
� 165 ≤ V < 225 km/hrSome roof and structural damage. Some caravans destroyed. Power failure likely
4 225 ≤ V 280 km/hrSignificant roofing loss and structural damage. Many caravans destroyed and blown away. Dangerous airborne debris. Widespread power failures
5 280 km/hr ≤ V Extremely dangerous with widespread destruction.
Extract from Bureau of Meteorology – Surviving cyclones (36)
The upper limit of wind speed for Category 5 cyclones is the maximum possible wind speed. Estimates of maximum theoretical wind speeds are the subject of debate. Plots of maximum potential wind speed prepared by Bister and Emmanuel (20) show an increase in potential maximum wind speed along Queensland’s eastern coast from the south towards the north.
Building StandardsThe Queensland Building Act (7) in the Standard Building Regulation requires buildings constructed in Queensland to comply with the requirements of the Building Code of Australia (BCA) (6) as published by the Australian Building Codes Board (ABCB). The structural provisions of the BCA define design events for safety to which the building must be constructed. The level of safety is dependent upon the importance of the building. The importance levels of buildings and structures and the design wind events for safety defined in the BCA are presented in Tables B2 and B3. Some of the examples of buildings given in the Guide to the BCA (18) published by ABCB are included in Table B2.
Disaster Management Planning Guideline Mitigating the Adverse Impacts of Cyclone – Evacuation and Shelter 46 |
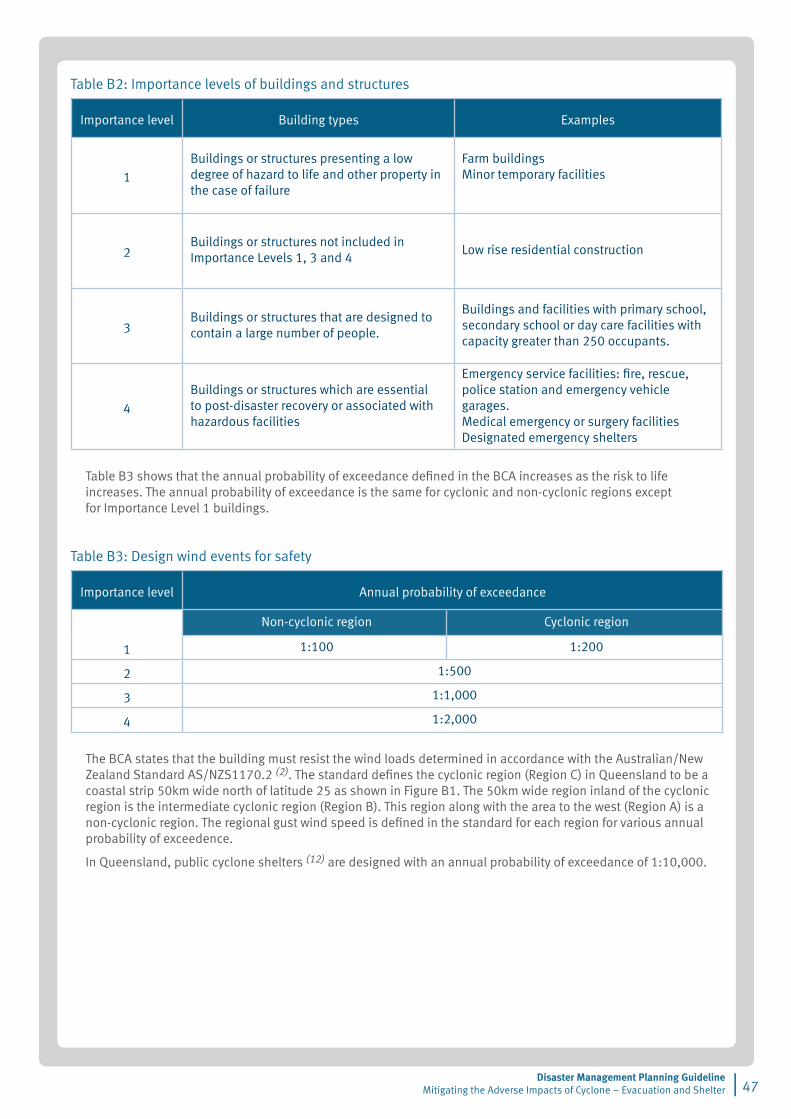
Table B2: Importance levels of buildings and structures
Importance level Building types Examples
�Buildings or structures presenting a low degree of hazard to life and other property in the case of failure
Farm buildingsMinor temporary facilities
�Buildings or structures not included in Importance Levels 1, 3 and 4
Low rise residential construction
�Buildings or structures that are designed to contain a large number of people.
Buildings and facilities with primary school, secondary school or day care facilities with capacity greater than 250 occupants.
4Buildings or structures which are essential to post-disaster recovery or associated with hazardous facilities
Emergency service facilities: fire, rescue, police station and emergency vehicle garages.Medical emergency or surgery facilitiesDesignated emergency shelters
Table B3 shows that the annual probability of exceedance defined in the BCA increases as the risk to life increases. The annual probability of exceedance is the same for cyclonic and non-cyclonic regions except for Importance Level 1 buildings.
Table B3: Design wind events for safety
Importance level Annual probability of exceedance
Non-cyclonic region Cyclonic region
� 1:100 1:200
� 1:500
� 1:1,000
4 1:2,000
The BCA states that the building must resist the wind loads determined in accordance with the Australian/New Zealand Standard AS/NZS1170.2 (2). The standard defines the cyclonic region (Region C) in Queensland to be a coastal strip 50km wide north of latitude 25 as shown in Figure B1. The 50km wide region inland of the cyclonic region is the intermediate cyclonic region (Region B). This region along with the area to the west (Region A) is a non-cyclonic region. The regional gust wind speed is defined in the standard for each region for various annual probability of exceedence.
In Queensland, public cyclone shelters (12) are designed with an annual probability of exceedance of 1:10,000.
| 47Disaster Management Planning Guideline
Mitigating the Adverse Impacts of Cyclone – Evacuation and Shelter
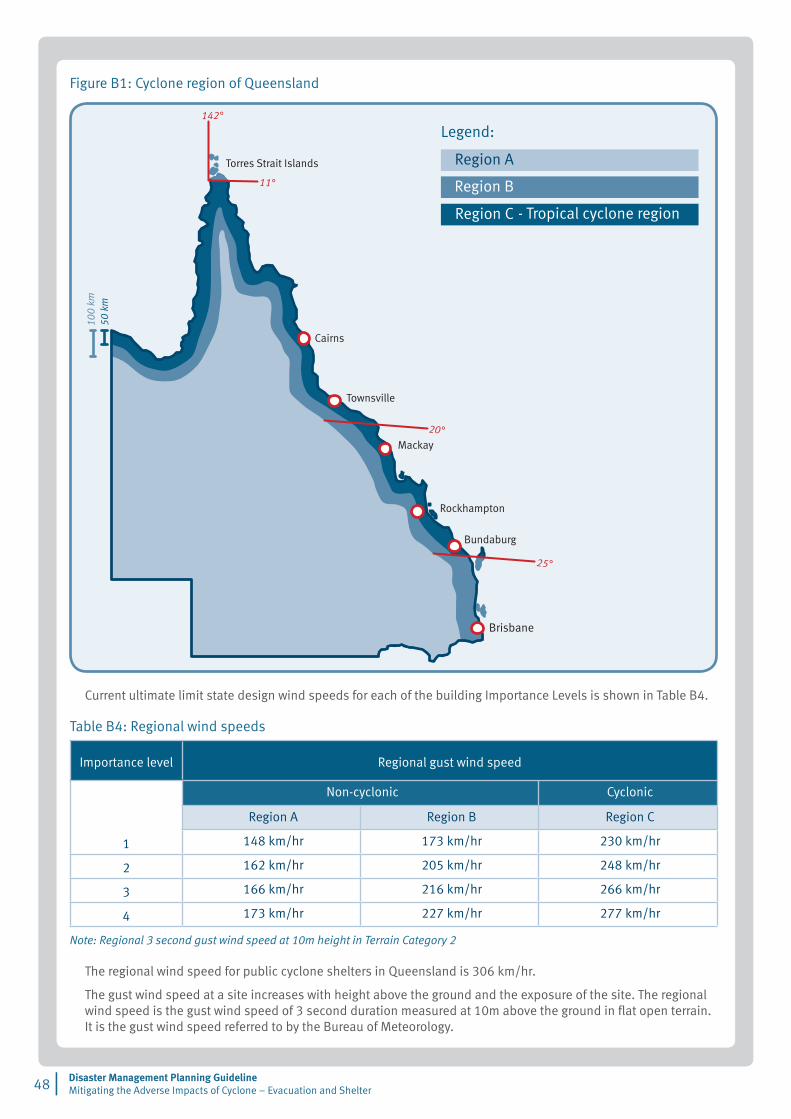
Disaster Management Planning Guideline Mitigating the Adverse Impacts of Cyclone – Evacuation and Shelter 48 |
Figure B1: Cyclone region of Queensland
- Tropical cyclone region
Current ultimate limit state design wind speeds for each of the building Importance Levels is shown in Table B4.
Table B4: Regional wind speeds
Importance level Regional gust wind speed
Non-cyclonic Cyclonic
Region A Region B Region C
� 148 km/hr 173 km/hr 230 km/hr
� 162 km/hr 205 km/hr 248 km/hr
� 166 km/hr 216 km/hr 266 km/hr
4 173 km/hr 227 km/hr 277 km/hr
Note: Regional 3 second gust wind speed at 10m height in Terrain Category 2
The regional wind speed for public cyclone shelters in Queensland is 306 km/hr.
The gust wind speed at a site increases with height above the ground and the exposure of the site. The regional wind speed is the gust wind speed of 3 second duration measured at 10m above the ground in flat open terrain. It is the gust wind speed referred to by the Bureau of Meteorology.
Legend:

The design gust wind speed for an individual building is determined from the applicable regional wind speed modified for site exposure. Site exposure factors of building height, terrain roughness, shielding by other buildings and topography are defined in the ‘Wind actions’ standard for Australia and New Zealand (2).
The cyclonic wind classes C1, C2, C3 and C4 currently used in house design are defined in the ‘Wind loads for housing’ standard (3). The design wind speeds were determined for an importance level 2 building, 6.5m high, located in cyclonic region C. Class C1 sites have the greatest protection from the wind, while Class C4 sites have least protection of the four classes. Class C1 is applicable to a house on flat terrain in a suburb surrounded by other houses, while Class C4 is applicable to a house on sloping terrain, with an average slope of less than 1:3, in a rural setting. The design wind speed for a building on a Class C1 site is 50m/s (180km/hr), while a building on a Class C4 site has a design wind speed of 86m/s (310km/hr). Both buildings are designed for a regional wind speed of 248 km/hr.
Building vulnerabilityA comparison of regional wind speeds and cyclone category for each of the building importance levels is shown in Table B5.
Table B5: Building design wind speed and cyclone category.
Importance level Building Regional gust wind speed Cyclone
� Farm Shed 230 km/hr Low Category 4
� House 248 km/hr Mid Category 4
� School, Office Building 266 km/hr Mid to High Category 4
4 Medical Emergency Centre 277 km/hr High Category 4
Queensland Public Cyclone Shelters 306 km/hr Low Category 5
Note: Regional wind speeds – Region C
The probability of failure of a building designed and constructed to resist a wind event is low if the building is subjected to that event, provided the building is well maintained. However, the probability of failure of the building increases as the wind speed exceeds the design event.
In 1975 the Queensland Building Act (7) was introduced and the cyclone region was also introduced into the Australian Standard following cyclone Tracy the previous year. Typically, buildings constructed in Queensland’s cyclone region prior to 1975 do not comply with current wind loading standards. The resistance of housing construction to winds was improved in Queensland in 1982 with the introduction of Appendix IV to the then Standard Building By-Laws.
Buildings in Queensland’s cyclone region constructed to current building standards are likely to survive in Category 3 or less severe cyclones. However, failure of some buildings is expected during a Category 4 cyclone. Typically buildings constructed in Queensland’s cyclone region prior to 1976 and houses prior to 1982 are more vulnerable to wind damage than buildings built to current standards.
Current building standards do not require the external fabric of the building to be resistant to wind borne debris. Further, current standards do not require internal walls to be designed for cyclonic wind loads. Consequently, a house or accommodation unit may have external walls with large areas of glazing and internal masonry walls which are not reinforced or internal walls of plasterboard. During a cyclone the external glazing may be broken by wind-borne debris, exposing the internal walls to: winds which may cause unreinforced masonry to collapse and wind-borne debris which may penetrate plasterboard walls.
The vulnerability of people sheltering within their homes, located outside the storm tide evacuation zone, would be reduced if they have a room within the dwelling constructed to resist cyclonic winds and wind borne debris. This room for example the bath room, store room or pantry could have sufficient space to accommodate all people living in the dwelling. These residential cyclone shelters reduce the likelihood of people evacuating to a public cyclone shelter.
| 49Disaster Management Planning Guideline
Mitigating the Adverse Impacts of Cyclone – Evacuation and Shelter

AppendixC
Storm tide inundationExtracts from Queensland Climate Change and Community Vulnerability to Tropical Cyclones, Ocean Hazards Assessment – Stage 1 – Review of Technical Requirements - March 2001. (30)
Storm surge‘All tropical cyclones on or near the coast are capable of producing a storm surge, which can increase coastal water levels for periods of several hours and significantly affect over 100km of coastline (Harper 1998). (38) The potential magnitude of the surge is affected by many factors – principally the intensity of the tropical cyclone, its size and forward speed.’
Storm tide‘When the storm surge is combined with the astronomical tide variation and the wave setup contribution at the coast the absolute combined mean water level (MWL) reached is called the storm tide level.’
‘Figure C1 summaries the various components which work together to produce an extreme storm tide. Firstly, the storm surge, mainly caused by the interaction of the extreme wind-driven currents and the coastline, raises coastal water levels above the normally expected tide at the time – producing the so-called stillwater level (SWL). Meanwhile, extreme wind-generated ocean waves, combinations of swell and local sea, are also driven before the strong winds and ride upon the SWL. As part of the process of wave breaking, a portion of their energy is transferred to vertical wave setup, yielding a slightly higher mean water level (MWL). Additionally, individual waves will run up sloping beaches to finally expend their forward energy and, when combined with the elevated SWL, this allows them to attack foredunes or nearshore structures to cause considerable erosion or destruction of property.’
Figure C1: Water level components of a storm tide
‘The first critical phase of a storm tide is when the MWL commences to exceed the local Highest Astronomical Tide (HAT), which represents the normal landward extent of the sea at any coastal location (Queensland Transport 1999). By this time, depending on the coastal features, it is likely that extensive beach and dune erosion will have occurred due to wave run-up effects alone. If the water level rises further, inundation of normally dry land will commence and the storm tide will be capable of causing loss of life through drowning and significant destruction of nearshore buildings and facilities if large ocean swell penetrate the foreshore regions.’
Disaster Management Planning Guideline Mitigating the Adverse Impacts of Cyclone – Evacuation and Shelter 50 |

Extracts from South Carolina Hurricane Study 2000 – Chapter 2 – Hazards (23)
Total flood elevation ‘Waves breaking near the shore cause a transport of water shoreward. When there is an increase in wave height water cannot flow back to the sea as rapidly as it came in. This phenomenon, known as “wave setup”, increases the water level along the beachfront. Waves will break and dissipate their energy in shallow water. Therefore, a relatively steep offshore beach slope allows large ocean waves to get closer to the shore before breaking and usually promotes larger waves. Wave setup is primarily a concern near the beachfront because waves are generally not transmitted inland of the coastline even if the beach has been overtopped.’
Wave effect ‘Generally, waves do not add significantly to the area flooded and have little effect on the number of people that will be required to evacuate. Since near-shore wave phenomena under hurricane conditions are not well understood, it is assumed that for the open coast, maximum theoretical wave heights based upon relationships of fetch length to water depth occur near the time of landfall. Immediately along the coastline or the shorelines of very large sounds and estuaries, wave crests can increase the expected still-water depth above the terrain by one-third, thus greatly increasing the hazard. Due to the presence of barriers such as structures, dunes, or vegetation, the waves break and dissipate a tremendous amount of energy within a few hundred yards of the coastline. Buildings within that zone that are not specifically designed to withstand the forces of wave action are often heavily damaged or destroyed.
For evacuation planning purposes, it is perhaps more important to consider potential wave effects for less than sustained tropical storm winds. If wave heights above theoretical still-water levels exceed the elevations of roads, bridges, or other critical areas near the coastline, evacuation could be curtailed sooner than expected, increasing the pre-landfall hazards distance. Evacuation planners should be aware that low-lying sections of highway could be subject to some wave action and over wash prior to the arrival of sustained tropical storm winds, especially with the coincidental occurrence of astronomical high tide.’
| 51Disaster Management Planning Guideline
Mitigating the Adverse Impacts of Cyclone – Evacuation and Shelter
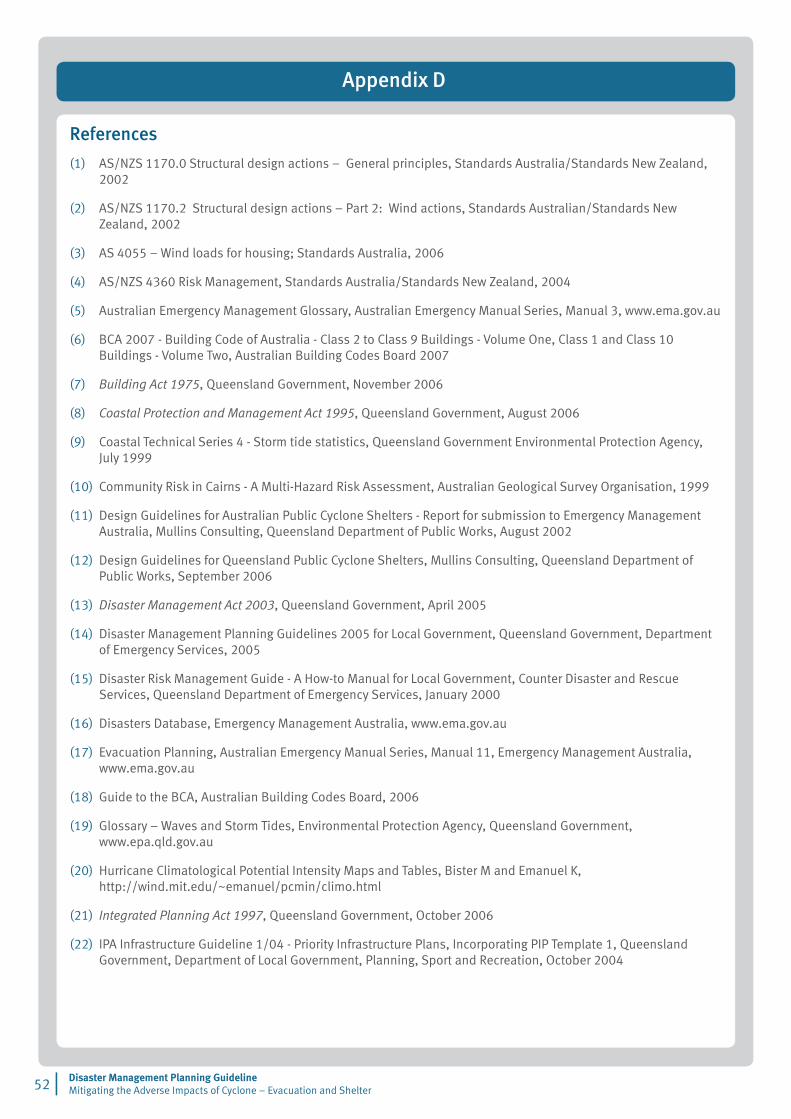
AppendixD
References
(�) AS/NZS 1170.0 Structural design actions – General principles, Standards Australia/Standards New Zealand, 2002
(�) AS/NZS 1170.2 Structural design actions – Part 2: Wind actions, Standards Australian/Standards New Zealand, 2002
(�) AS 4055 – Wind loads for housing; Standards Australia, 2006
(4) AS/NZS 4360 Risk Management, Standards Australia/Standards New Zealand, 2004
(5) Australian Emergency Management Glossary, Australian Emergency Manual Series, Manual 3, www.ema.gov.au
(6) BCA 2007 - Building Code of Australia - Class 2 to Class 9 Buildings - Volume One, Class 1 and Class 10 Buildings - Volume Two, Australian Building Codes Board 2007
(7) Building Act 1975, Queensland Government, November 2006
(8) Coastal Protection and Management Act 1995, Queensland Government, August 2006
(9) Coastal Technical Series 4 - Storm tide statistics, Queensland Government Environmental Protection Agency, July 1999
(10) Community Risk in Cairns - A Multi-Hazard Risk Assessment, Australian Geological Survey Organisation, 1999
(��) Design Guidelines for Australian Public Cyclone Shelters - Report for submission to Emergency Management Australia, Mullins Consulting, Queensland Department of Public Works, August 2002
(��) Design Guidelines for Queensland Public Cyclone Shelters, Mullins Consulting, Queensland Department of Public Works, September 2006
(��) Disaster Management Act 2003, Queensland Government, April 2005
(14) Disaster Management Planning Guidelines 2005 for Local Government, Queensland Government, Department of Emergency Services, 2005
(15) Disaster Risk Management Guide - A How-to Manual for Local Government, Counter Disaster and Rescue Services, Queensland Department of Emergency Services, January 2000
(16) Disasters Database, Emergency Management Australia, www.ema.gov.au
(17) Evacuation Planning, Australian Emergency Manual Series, Manual 11, Emergency Management Australia, www.ema.gov.au
(18) Guide to the BCA, Australian Building Codes Board, 2006
(19) Glossary – Waves and Storm Tides, Environmental Protection Agency, Queensland Government, www.epa.qld.gov.au
(20) Hurricane Climatological Potential Intensity Maps and Tables, Bister M and Emanuel K, http://wind.mit.edu/~emanuel/pcmin/climo.html
(��) Integrated Planning Act 1997, Queensland Government, October 2006
(��) IPA Infrastructure Guideline 1/04 - Priority Infrastructure Plans, Incorporating PIP Template 1, Queensland Government, Department of Local Government, Planning, Sport and Recreation, October 2004
Disaster Management Planning Guideline Mitigating the Adverse Impacts of Cyclone – Evacuation and Shelter 52 |

(��) National Hurricane Preparedness Study Program, Federal Emergency Management Agency (FEMA) and US Army Corp of Engineers, Comprehensive Hurricane Data Preparedness Study Website http://chps.sam.usace.army.mil/
(24) National Storm Tide Mapping Model for Emergency Response, Department of Emergency Services Queensland, Emergency Management Australia, 2002
(25) Natural Hazards in Australia, Identifying Risk Analysis Requirements, Middelmann M, Geoscience Australia, Canberra, 2007
(26) Official Tide Tables and Boating Safety Guide, Queensland Department of Transport, 2008
(27) Operational Planning Guidelines for Local Disaster Management Groups, Department of Emergency Services Queensland, Emergency Management Queensland, 2006
(28) Queensland Climate Change and Community Vulnerability to Tropical Cyclones – Ocean Hazards Assessment Stage 1 Report- Review of Technical Requirements, Australian Government Bureau of Meteorology and James Cook University Marine Modelling Unit, March 2001
(29) Queensland Climate Change and Community Vulnerability to Tropical Cyclones - Ocean Hazards Assessment Stage 3 Report - Surge Plus Tide Statistics for Selected Open Coast Locations along the Queensland East Coast, Australian Government Bureau of Meteorology and James Cook University Marine Modelling Unit, July 2004
(30) Queensland Climate Change and Community Vulnerability to Tropical Cyclones - Ocean Hazards Assessment Synthesis Report - An Overview and Discussion of Results from Project Stages 2, 3 and 4, Australian Government Bureau of Meteorology and James Cook University Marine Modelling Unit, August 2004
(��) Queensland Climate Change and Community Vulnerability to Tropical Cyclones - Ocean Hazards Assessment Stage 4 Report – Development of a Cyclone Wind Damage Model for use in Cairns, Townsville and Mackay, James Cook Cyclone Testing Station and Systems Engineering Australia, September 2003
(��) Scoping Study for the Provision of Public Cyclone Shelters in Queensland, Mullins Consulting, Queensland Government Department of Public Works, November 2006
(��) State Coastal Management Plan Guideline - Mitigating the Adverse Impacts of Storm Tide Inundation, Queensland Government Environmental Protection Agency, Version 12, November 2005
(34) State Planning Policy Guideline - Mitigating the Adverse Impacts of Flood, Bushfire and Landslide, Queensland Government, Department of Local Government and Planning, Department of Emergency Services, June 2003
(35) Storm Tide Threat in Queensland: History, Prediction and Relative Risks - Conservation technical report No 10, Queensland Government, Department of Environment and Heritage, August 1998
(36) Surviving Cyclones, Australian Government, Bureau of Meteorology. http://www.bom.gov.au/info/cyclone/
(37) Tropical Cyclone Storm Tide Warning – Response System, Issued by the State Disaster Management Group and the Australian Bureau of Meteorology, Seventh Edition, October 2006.
| 53Disaster Management Planning Guideline
Mitigating the Adverse Impacts of Cyclone – Evacuation and Shelter
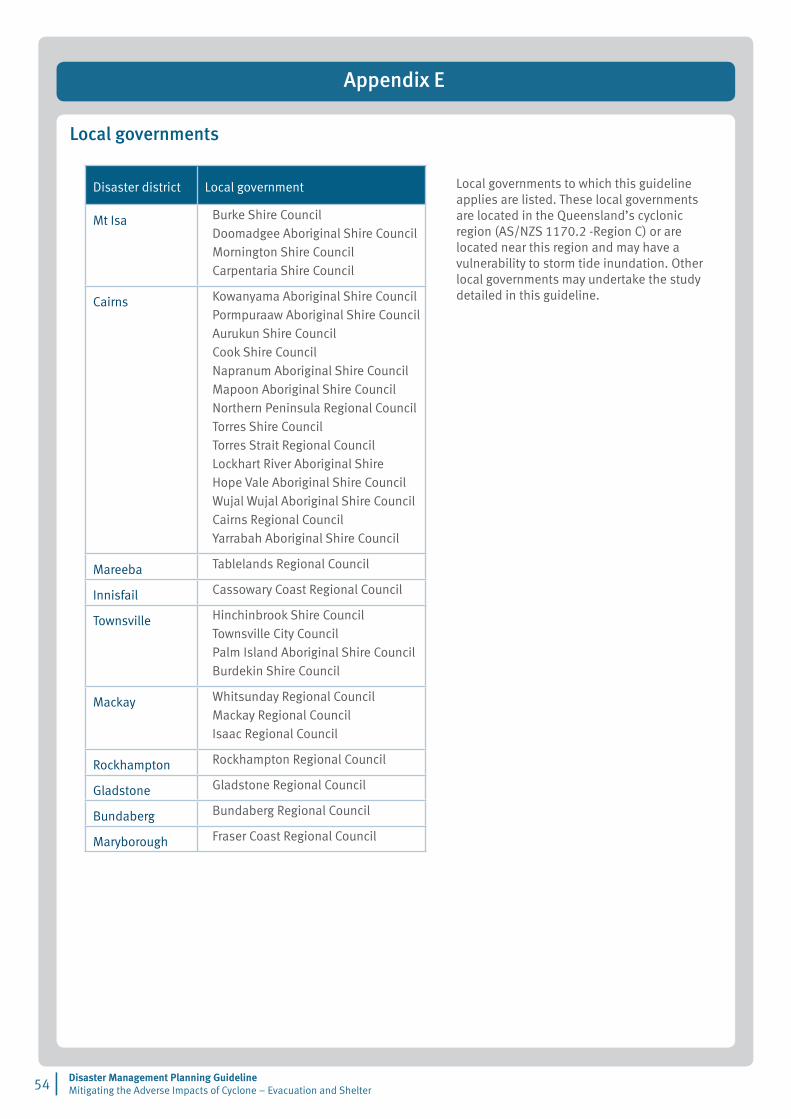
AppendixE
Local governments to which this guideline applies are listed. These local governments are located in the Queensland’s cyclonic region (AS/NZS 1170.2 -Region C) or are located near this region and may have a vulnerability to storm tide inundation. Other local governments may undertake the study detailed in this guideline.
Disaster Management Planning Guideline Mitigating the Adverse Impacts of Cyclone – Evacuation and Shelter 54 |
Local governments
Disaster district Local government
Mt Isa Burke Shire CouncilDoomadgee Aboriginal Shire CouncilMornington Shire CouncilCarpentaria Shire Council
Cairns Kowanyama Aboriginal Shire CouncilPormpuraaw Aboriginal Shire CouncilAurukun Shire CouncilCook Shire CouncilNapranum Aboriginal Shire CouncilMapoon Aboriginal Shire CouncilNorthern Peninsula Regional CouncilTorres Shire CouncilTorres Strait Regional CouncilLockhart River Aboriginal ShireHope Vale Aboriginal Shire CouncilWujal Wujal Aboriginal Shire CouncilCairns Regional CouncilYarrabah Aboriginal Shire Council
Mareeba Tablelands Regional Council
Innisfail Cassowary Coast Regional Council
Townsville Hinchinbrook Shire CouncilTownsville City CouncilPalm Island Aboriginal Shire CouncilBurdekin Shire Council
Mackay Whitsunday Regional CouncilMackay Regional CouncilIsaac Regional Council
Rockhampton Rockhampton Regional Council
Gladstone Gladstone Regional Council
Bundaberg Bundaberg Regional Council
Maryborough Fraser Coast Regional Council

Notes
| 55Disaster Management Planning Guideline
Mitigating the Adverse Impacts of Cyclone – Evacuation and Shelter

Notes
Disaster Management Planning Guideline Mitigating the Adverse Impacts of Cyclone – Evacuation and Shelter 56 |