ground-water resources of griggs and steele counties ... · been published as part ii of the griggs...
TRANSCRIPT
GROUND-WATER RESOURCE S
of
GRIGGS and STEELE COUNTIES ,NORTH DAKOTA
by
Joe S. Downey and C . A. Armstron g
U.S. Geological Survey
COUNTY GROUND-WATER STUDIES 21 - PART II INorth Dakota State Water CommissionVernon Fahy, State Engineer
BULLETIN 64 - PART II INorth Dakota Geological SurveyEdwin A. Noble, State Geologist
Prepared by the U.S . Geological Surveyin cooperation with the North Dakota Geological Survey ,
North Dakota State Water Commission ,Griggs County Water Management Distric t
and the Steele County Water Management District
1977
Bismarck, North Dakota

CONTENTS
PageABSTRACT 1INTRODUCTION 1
Previous investigations 3Acknowledgments 3Well-numbering system 4Geography 4
AVAILABILITY AND QUALITY OF GROUND WATER 6General concepts 6Ground water in bedrock 10
Rocks of Precambrian age 10Rocks of Ordovician age 10Rocks of Jurassic age 12Rocks of Cretaceous age 12
Dakota aquifer 12Pierre aquifer 1 2
Ground water in glacial drift 13Spiritwood aquifer system 14McVille aquifer 16Galesburg aquifer 20Elk Valley aquifer 22Undifferentiated drift aquifers 23
UTILIZATION OF GROUND WATER 25Rural domestic and livestock use 25Public supply 25
Binford 25Cooperstown 26Finley 26Hannaford 26Hope 26Sharon 26Rural water districts 27
SUMMARY 27SELECTED REFERENCES : 29DEFINITIONS OF SELECTED TERMS 32
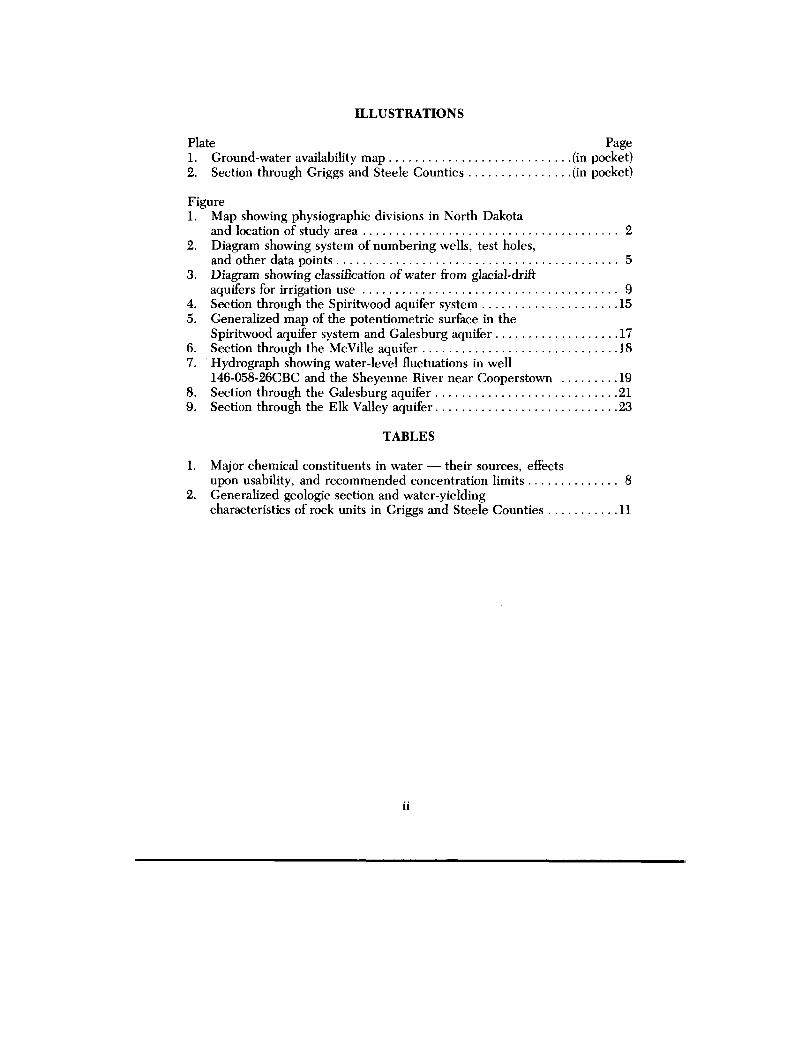
ILLUSTRATION S
Plate
Page1. Ground-water availability map (in pocket )2. Section through Griggs and Steele Counties (in pocket )
Figure1. Map showing physiographic divisions in North Dakota
and location of study area 22. Diagram showing system of numbering wells, test holes ,
and other data points 53. Diagram showing classification of water from glacial-drift
aquifers for irrigation use 94. Section through the Spiritwood aquifer system 1 55. Generalized map of the potentiometric surface in the
Spiritwood aquifer system and Galesburg aquifer 1 76. Section through the McVille aquifer 1 87. Hydrograph showing water-level fluctuations in wel l
146-058-26CBC and the Sheyenne River near Cooperstown 1 98. Section through the Galesburg aquifer 2 19. Section through the Elk Valley aquifer 23
TABLES
1. Major chemical constituents in water — their sources, effect supon usability, and recommended concentration limits 8
2. Generalized geologic section and water-yieldin gcharacteristics of rock units in Griggs and Steele Counties 1 1
ii

SELECTED FACTORS FOR CONVERTING ENGLISH UNITS TO THEINTERNATIONAL SYSTEM (SI) OF METRIC UNIT S
A dual system of measurements — English units and the InternationalSystem (SI) of metric units — is given in this report . SI is an organized systemof units adopted by the Eleventh General Conference of Weights and Measure sin 1960. Selected factors for converting English units to SI are given below .
Multiply English units ByAcres 0 .4047
.004047Acre-feet .001233
1.233x10'6Feet .3048Feet per day (ft/d) .3048Feet per mile (ft/mi) .18943
Feet squared per day(ft2/d) .0929
Gallons .003785Gallons per day
(gal/d) .003785Gallons per minute
(gal/min) .06309Gallons per minute per
foot [(gallmin)/ft] .20 7Inches 25 . 4Miles 1 .60 9
1,609Million gallons per day
(M gal/d) 3,785Square miles (mil) 2 .590
To obtain SI unitshectares (ha)square kilometers (km2)cubic hectometers (hm3)cubic kilometers (km 3 )meters (m)meters per day (mid)meters per kilometer
(m/km )meters squared per day
(m2/d )cubic meters (m3)cubic meters per day
(m 3/d)
litres per second (Us)liters per second per
meter [(Us)/m ]millimeters (mm)kilometers (km)meters (m)cubic meters per day
( m3/d)square kilometers (km 2 )
ii i
GROUND-WATER RESOURCES O FGRIGGS AND STEELE COUNTIES, NORTH DAKOT A
By Joe S . Downey and C . A. Armstrong
ABSTRACT
Griggs and Steele Counties, in east-central North Dakota, are underlain b ybedrock of Ordovician, Jurassic, and Cretaceous ages . The Fall River andLakota Formations of Cretaceous age form the Dakota aquifer . The fracturedupper part of the Pierre Formation (shale), also of Cretaceous age, form sanother bedrock aquifer . The Dakota aquifer, which consists mainly of inter -bedded shale and sandstone units, may yield as much as 500 gallons per minut e(32 liters per second) of sodium sulfate water to wells at selected locations. ThePierre aquifer yields from 1 to 10 gallons per minute (0 .06 to 0 .63 liters persecond) of sodium bicarbonate or sodium sulfate water to wells .
Four major glacial-drift aquifers are present in the study area . The Spirit-wood aquifer system may supply as much as 1,500 gallons per minute (95 liter sper second) of water to wells . Water samples contained dissolved-solids con-centrations ranging from 244 to 9,800 milligrams per liter . The Galesburgaquifer will yield as much as 1,000 gallons per minute (63 liters per second) o fwater to wells . Water samples contained dissolved-solids concentrations rang-ing from 317 to 2,170 milligrams per liter . The McVille aquifer will yield a smuch as 500 gallons per minute (32 liters per second) to wells . Water sample scontained dissolved-solids concentrations ranging from 449 to 2,200 milligram sper liter . The Elk Valley aquifer could yield 30 gallons per minute (2 liters pe rsecond) to wells . Water samples contained dissolved-solids concentration sranging from 397 to 2,890 milligrams per liter .
Six communities in the project area use ground-water supplies . Rural waterdistricts are being developed in the two-county area that will provide depend -able ground-water supplies for many farms and small municipalities . TheSpiritwood aquifer system and the McVille and Galesburg aquifers are capableof supplying the water needs of these districts and could also provide water fo rirrigation .
INTRODUCTION
The study of the ground-water resources of Griggs and Steele Counties (fig .1) was made cooperatively by the U .S. Geological Survey, the North DakotaState Water Commission, the North Dakota Geological Survey, and the Grigg sand Steele Counties Water Management Districts .
This investigation is one of a series of studies to obtain information on theground-water resources of North Dakota. The purpose of the study was toevaluate the quantity and the quality of ground water for municipal, domestic ,livestock, and irrigation uses . Accordingly, the report contains descriptions o f
1

98°
I.GOLDEN —BILLINGS
~'
isso RiI VALLEY!
MERSS-I _10,
'OLIVE R
p DUNN 'i
it
STARK ---\ ,1,~~~ rMORTO NL /\
*4. 9 I, T~__
GRAN TSLOPE IH ETTINGER -~.~
R/VER
'INNn ..
I
\l
A[L
100°
BOTTINEAUI ROLETTE 1T0WNER CAVALIER
LAK E~
L
ti
IPEMBINA_-_
-i1ERCE ---
IRAMSEY
rWALSH -7--
,
i
[ ENSN--r
eENTRALj
I
I) is± iP N 1yv!E LL S
. BURLEIGH1KIDDE R
`\ I
II
I
BISMARCK
(I
•s,ISTUTSMA N_ _
EMMON\S /'
,
1\~ SpGn
LOGAN
' rte_ I LA MOURE__rMC INTOSH
DICKE YI
f
—T-= ----'\-- - 08 °
L
ENELSON GRAND
:KRBKFSBR" sDRIF! PRAIR IE ,\
I I~ ~ ~
MCHENRY ]- r—_i S£Y~M'Vt- -
AGASSIZ °
=PEW,-AR GRANSO
EN TM _ _-LVALLEY )
I
46 ° yRt91 LANQ_
50 1000
10
2 51 I0 10
5000 MILES
150 KILOMETERS
FIGURE 1 .- Physiogaphic divisions in North Dakota and location of study area .
1,3

the location, areal extent, thickness, and nature of the major aquifers ; estimate sof the quantities of water stored in these aquifers; estimates of the potentialyields of wells tapping .the aquifers; and descriptions of the chemical quality ofthe ground water .
Many sources of data were utilized in the preparation of this report . A wellinventory provided data on depth, construction, and productivity of the privat eand public wells in the counties . Test drilling supplied information on thethickness, extent, and hydrologic parameters of the major aquifers . Chemicalanalyses of water samples from selected wells were made to determine th equality of the ground water . The basic data collected during this study hav ebeen published as part II of the Griggs and Steele Counties ground-water stud y(Downey and others, 1973) . The geology of both counties was studied by Joh nP. Bluemle of the North Dakota Geological Survey and is published as part I o fthe series (Bluemle, 1975) . This report, part III, is based largely on interpreta-tion of the basic data contained in part II .
The stratigraphic nomenclature used in this report is that of the Nort hDakota Geological Survey and does not necessarily follow the usage of the U .S .Geological Survey .
Previous Investigations
The earliest report of geohydrologic interest was by Upham (1895), wh oreported on selected geological features in Griggs and Steele Counties as a par tof a study of glacial Lake Agassiz . Simpson (1929) briefly described theground-water conditions in Griggs County (p . 142-144) and Steele County (p .228-230) as part of a statewide survey . Abbott and Voedisch (1938) listed chem -ical data from selected wells in both counties, and Dennis (1947 and 1948 )reported on the geology and occurrence of ground water in the Sharon an dHope areas of Steele County . Adolphson (1962) reported on the occurrence ofground water in the Hatton area of Traill and Steele Counties, and Beeks (1967 )reported on the occurrence of ground water in the Hatton area of Grand Forks ,Traill, and Steele Counties . Selected data from these older reports have bee nutilized in the preparation of this report .
Acknowledgment s
The authors express their appreciation to members of the Griggs and Steel eCounties Water Management Districts and the County Boards of Commission-ers, city officials of Cooperstown, Finley, and Hope, and to the many residentsof both counties who contributed time and effort towards the completion of thi sstudy . Particular recognition is due M . O. Lindvig, R . W. Schmid, and C . E .Naplin of the North Dakota State Water Commission who were largely respon -sible for the test drilling and aquifer-test data . Appreciation also is expressedfor the well logs furnished by C. C. Smith Drilling Co ., the city of Luverne,Empire Drilling Co ., Frederickson 's, Inc ., Burlington Northern, Inc ., I . J .
3

Wilhite Co., Lako Drilling Co ., Lehigh Portland Cement Co ., Northern Re-sources, Inc., Russell Drilling Co ., Simcox Oil Co., U.S . Bureau of Reclama-tion, and the U .S. Air Force .
Well-Numbering System
The numbering of wells, test holes, and other data points in this report i sbased upon a public lands survey system of the U .S . Bureau of Land Manage-ment . The first numeral of the numbering system denotes the township nort hof a base line, the second numeral denotes the range west of the fifth principa lmeridian, and the third numeral denotes the section in which the well i slocated (fig . 2) . The letters A, B, C, and D designate, respectively, the north -east, northwest, southwest, and southeast quarter section, quarter-quarter sec-tion, and quarter-quarter-quarter section (10-acre or 4-ha tract) . For example ,well 148-057-15ADD is in the SE'/4SE 1/4NEY4 sec . 15, T. 148 N., R. 57 W .Consecutive terminal numerals are added if more than one well is recorde dwithin a 10-acre (4-ha) tract. This numbering system is also used for the locationof small areas .
Geography
Griggs and Steele Counties (fig . 1) have an area of about 1,430 mil (3,704km2) and a 1970 population of 7,933 (U .S. Bureau of the Census, 1971) . Theeconomy of both counties is based upon agriculture — small grains are the mai ncrops .
Both counties are located within the drainage system of the Red River of th eNorth, which is a part of the larger Hudson Bay system . The major tributariesof the Red River that cross the area are the Sheyenne River in Griggs Count yand the Maple and Goose Rivers in Steele County .
The topography is varied. A broad, nearly flat plain formed by glacial LakeAgassiz characterizes the eastern part of Steele County ; whereas, rolling prairi e(Drift Prairie; fig . 1) dotted with numerous sloughs or prairie potholes charac-terizes the western part of Steele County and all of Griggs County .
Maximum topographic relief in the report area is about 755 feet (230 m).The highest altitude is about 1,730 feet (527 m) above msl (mean sea level) at148-061-15BBD in northwestern Griggs County, and the lowest is about 975feet (297 m) above msl where the Goose River leaves Steele County . Localrelief rarely exceeds 100 ft/mi (19 m/km), and in parts of the Lake Agassiz plainit is less than 5 ft/mi (0 .9 m/km) .
Griggs and Steele Counties have a continental climate characterized by col dand snowy winters and warm summer days with cool nights . Major weathersystems crossing the area bring a variety of weather in all seasons . According tothe National Weather Service (1964-70), the mean annual temperature atCooperstown is 39.3°F (4°C) . Maximum temperatures during June, July, an dAugust average about 81°F (27°C) and temperatures during the winter month s
4

FIGURE 2.- System of numbering wells, test holes, and other data points .
5

average about 8°F (-13°C) . The mean annual precipitation at Cooperstown i s18 .23 inches (463 mm), of which about three-fourths falls as rain during th egrowing season .
AVAILABILITY AND QUALITY OF GROUND WATER
General Concept s
All ground water of economic importance in Griggs and Steele Counties i sderived from precipitation, either directly or by percolation from nearby areas .After precipitation falls on the earth's surface, part is returned to the atmos-phere by evaporation, part runs off into streams, and the remainder infiltrate sthe ground . A large quantity of the water that enters the ground is held tem-porarily in the soil and is then returned to the atmosphere by evaporation o rtranspiration of plants . After the soil and plant requirements have been satis-fied, the excess water, if any, percolates downward and enters the aquifer a srecharge .
Ground water moves by gravity from areas of recharge to areas of discharge .Ground-water movement is generally very slow ; it may be only a few feet peryear . The rate of movement is governed by the hydraulic conductivity of thematerial through which the water moves and by the hydraulic gradient . Grave land well-sorted sand generally are highly conductive, and deposits of thesematerials commonly form aquifers . Fine-grained materials such as silt and clayusually have low conductivity .
The water level in an aquifer fluctuates in response to recharge to an ddischarge from the aquifer. Under natural conditions, over a long period o ftime, the rate of discharge from an aquifer approximately equals the rate ofrecharge. When equilibrium exits for a long period of time, the amount o fwater in storage remains constant .
Withdrawal of water from an aquifer causes two or more of the following : (1 )a decrease in the rate of natural discharge, (2) an increase in the rate of re -charge, or (3) a reduction in the volume of water in storage . If ground-waterwithdrawal and natural discharge do not exceed recharge to an aquifer, th ewater level in the aquifer will approach equilibrium. If the discharge exceedsrecharge, the excess will be withdrawn from storage . When water is taken fromstorage, the water level continues to decline as long as water is discharged fro mthe aquifer .
The maximum rate of ground-water withdrawal that can be maintaine dindefinitely is related directly to the rate of recharge . However, recharge i sregulated largely by climatic, hydrologic, and geologic controls and generally i sdifficult to quantify without large amounts of data .
In Griggs and Steele Counties the major rivers and streams along with themany small lakes and potholes are in hydraulic connection with aquifers . Theaquifers either may receive recharge from these sources or may discharge intothem, depending on the prevailing head relationships .
6

All ground water contains dissolved mineral matter in varying amounts .Rainfall begins to dissolve mineral matter from the atmosphere as it falls, an dcontinues to dissolve mineral matter as the water percolates through the soil .The amount and kind of dissolved mineral matter in water depends upon manyfactors including the solubility and types of rocks encountered, temperature ,pressure, the length of time the water is in contact with the rocks, and th eamount of carbon dioxide in the water . Water that has been underground a longtime, or has traveled a long distance from the recharge area, generally is mor ehighly mineralized than water that has been in transit for only a short tim ebecause of the more varied conditions encountered .
The suitability of water for various uses is determined largely by the kin dand amount of dissolved matter . The chemical constituents, physical proper -ties, and indices most likely to be of concern are iron, sulfate, nitrate, fluoride ,total dissolved solids, hardness, temperature, odor, taste, specific conductance ,sodium-adsorption ratio (SAR), trace elements, and percent sodium . The clas -sifications of water hardness used in this report are shown in the followin gtable :
Hardness range (inmilligrams per liter of
calcium carbonate) Hardness description
0-60
Soft
61-120
Moderately hard
121-180
HardMore than 180
Very hard
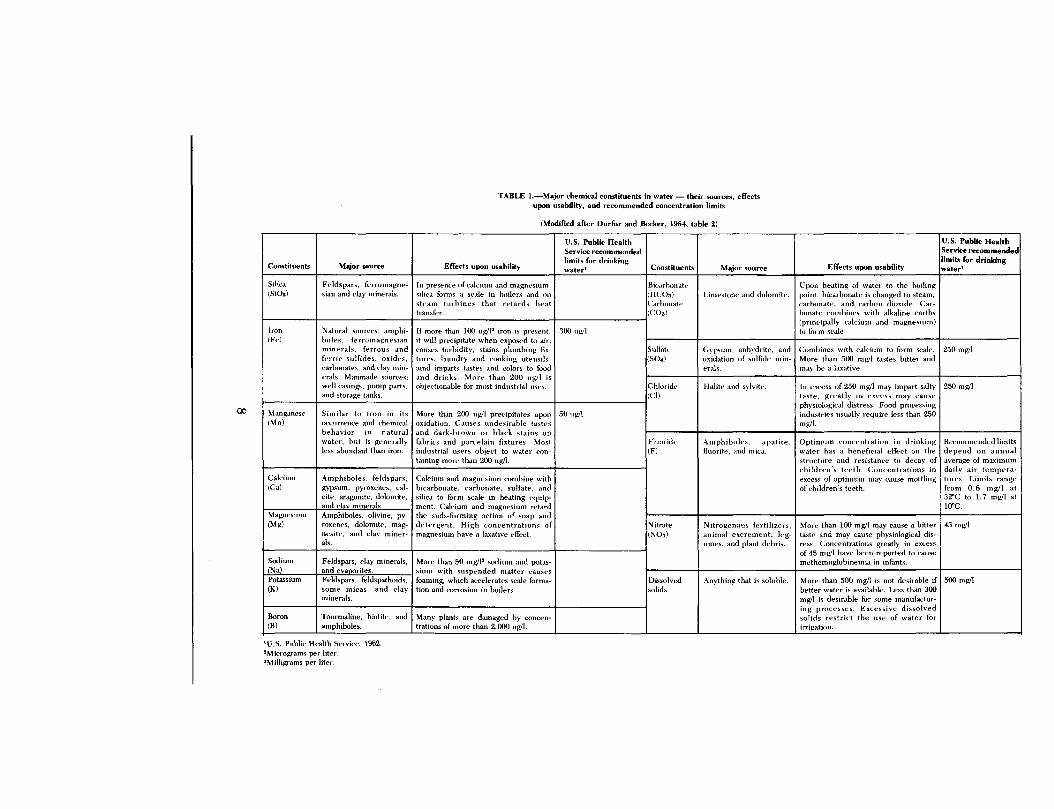
The sources of the major chemical constituents, their effects on usability ,and the limits recommended by the U .S. Public Health Service are given intable 1 . Additional information regarding drinking water standards may b efound in "Drinking Water Standards" published by the U .S. Public HealthService (1962).
The dissolved-solids concentration and conductivity of water can be de -scribed in terms of salinity . For this report ; the following classifications of therelative freshness and salinity have been adopted from Robinove and others
(1958) .
SpecificDissolved solids conductance
(milligrams (micromhos pe rClass per liter) centimeter at 25°C )
Fresh Less than 1,000 Less than 1,400Slightly saline 1,000 to
3,000 1,400 to
4,000
Moderately saline 3,000 to 10,000 4,000 to 14,000Very saline 10,000 to 35,000 14,000 to 50,000
Brine More than 35,000 More than 50,000
7
00
TABLE 1 .—Major chemical constituents in water — their sources, effect supon usability, and recommended concentration limit s
(Modified after Durfor and Becker, 1964, table 2 )
Constituents Major source Effects upon usability
U .S. Public HealthService recommende dlimits for drinkingwater' Constituents Major source Effects upon usability
U.S . Public HealthService recommendedlimits for drinkin gwater'
Silica(SiOn)
Feldspars, ferromagne -sian and clay minerals.
In presence of calcium and magnesium,silica forms a scale in boilers and onsteam
turbines
that
retards
heattransfer.
Bicarbonate(HCOa)Carbonate(COa)
Limestone and dolomite .Upon heating of water to the boilingpoint, bicarbonate is changed to steam ,carbonate, and carbon dioxide . Car-bonate combines with alkaline earth s(principally calcium and magnesium )to firm scale .Iro n
(Fe)Natural sources : amphi -boles,
ferromagnesianminerals,
ferrous
an dferric sulfides,
oxides ,carbonates, and clay min -erals . Manmade sources :well casings, pump parts ,and storage tanks .
If more than 100 ug/12 iron is present ,it will precipitate when exposed to air ;causes turbidity, stains plumbing fix -tures,
laundry and cooking utensils ,amd imparts tastes and colors to foodand drinks .
More than 200 ug/l i sobjectionable kn. most industrial uses.
300 ug/l
Sulfat e(SOa)
Gypsum, anhydrite, an doxidation of sulfide min -erals .
Combines with calcium to form scale .More than 500 mg/I tastes hitter an dmay he a laxative .
250 mg/ I
Chloride(CI)
Halite and sylvite .
–
In excess of 250 mg/I may impart saltytaste,
greatly in excess may causephysiological distress. Food processingindustries usually require less than 250mg/I.
250 mg/I
Manganes e(Mn)
Similar
to
iron
in
itsoccurrence and chemicalbehavior
natura lwater, but is generallyless abundant than iron .
More than '200 ug/l precipitates uponoxidation . Causes undesirable taste sand dark-brown or black stains o nfabrics and porcelain fixtures .
Mostindustrial users object to water con-taming more than 200 ugll .
50 ug/l
Fluorid e(F)
Amphiboles,
apatite ,fluorite, and mica .
Optimum concentration in drinkingwater has a beneficial effect on thestructure and resistance to decay o fchildren 's teeth .
Concentrations inexcess of optimum may cause mottlin gof children's teeth .
Recommendedlimit sdepend on annualaverage of maximumdaily air tempera-tures .
Limits rangefrom
0 .6
mg/I
at32°C to 1 .7 mg/I at10°C .
Calcium(Ca)
Amphiboles, feldspars ,gypsum . pyroxenes, cal -cite, aragonite, dolomite ,and clay minerals.
Calcium and magnesium combine wit hbicarbonate, carbonate,
sulfate, an dsilica to form scale in heating equip -ment . Calcium and magnesium retardthe suds-forming action of soap an ddetergent .
High concentrations o fmagnesium have a laxative effect .
Magnesiu m(Mg)
Amphiboles, olivine, py -roxenes, dolomite, mag -nesite,
and clay miner -als.
Nitrate(NO3)
Nitrogenous fertilizers ,animal excrement, leg-lames, and plant debris .
More than 100 mg/I may cause a bittertaste and may cause physiological dis -ress . Concentrations greatly in excessof 45 mg/I have been reported to caus emethemoglobinemia in infants .
45 mg/I
Sodiu m(Na)
Feldspars, clay minerals ,and evaporites .
More than 50 mg/l a sodium and potas-slum with suspended matter cause sfoaming, which accelerates scale forma-tion and corrosion in boilers .
Dissolvedsolids
Anything that is soluble. More than 500 mg/I is not desirable i fbetter water is available . Less than 300mg/I is desirable for some manufactur -ing processes .
Excessive dissolvedsolids restrict the use of water fo rirrigation .
500 mg/IPotassiu m(K)
Feldspars, feldspathoids ,some micas,
and cla yminerals.
Boron(B)
Tourmaline, biotite, andamphiboles.
Many plants are damaged by concen-trations of more than 2,000 ug/l .
'U .S. Public Health Service, 1962 .°Micrograms per liter .'Milligrams per liter.

Two indices used to show the suitability of water for irrigation in this repor tare SAR and specific conductance . SAR is related to the sodium hazard ; thespecific conductance is related to the salinity hazard . The hazards increase asthe numerical values of the indices increase . The reader is referred to thereport "Diagnosis and Improvement of Saline and Alkali Soils, " (U.S. Salinit yLaboratory Staff, 1954) for further use of these indices . The irrigation classifica-tions of water from several glacial-drift aquifers in Griggs and Steele Countie sare shown in figure 3 .
wu 30- _
28- CI-5 4
26 C2-S4 _
S0 mx 24 _C3-S4 -
22 - C4-S4
_
20 -CI-S3
y
~ IBC2-S 3
0
1 6pw N a
_
0 1 4
g12
CI-S 2
-
C3-S3
C2-S2 ° C4-g310 _
C3-S2 .8- _
6 -~ — C4-5 2
4-
CI-SI
C2-S I
2 -^ C3! g l
°
° C4-SI
-
0 1 °I
I
I ..11'i'1'II . . . °
•••
°
1°° . I100
250
750
2250C\ CONDUCTIVITY-MICROMHOS/CM. (ECXIO6) AT 25° C
9y,S
2 3 4
LOW MEDIUM HIGH VERY HIGH
SALINITY HAZAR D
EXPLANATION
° Elk Valley aquifer
. Galesburg aquifer
° McVille aquifer
• Spiritwood aquifer system
FIGURE 3.- Classifications of water from glacial-drift aquifers for irriga-tion use .
9
3100 2 4 5 6 7891000 3 4 5000

Ground Water in Bedroc k
Rocks of Precambrian Age
Crystalline rocks of Precambrian age (table 2) occur at depths that rang efrom about 1,000 feet (300 m) in southeastern Steele County to about 2,900 fee t(880 m) in northwestern Griggs County . These rocks appear to contain onl ysmall amounts of very saline water in joints and fractures and it is doubtful tha tsubstantial quantities of water could be obtained from them .
Rocks of Ordovician Age
Rocks of Ordovician age (table 2) have been subdivided into the Winnipeg ,Red River, and Stony Mountain Formations . The Winnipeg Formation gener-ally consists of 20 to about 65 feet (6 to 20 m) of shale, sandstone, and shal ylimestone overlying rocks of Precambrian age . Although the Winnipeg Forma-tion was not identified in test holes drilled in Griggs and Steele Counties as partof the present study, test hole 151-061-32BC north of the study area in NelsonCounty penetrated 47 feet (14 m) of clayey shale at a depth of 2,864 to 2,91 1feet (873 to 887 m) that may represent the formation in the project area (Dow-ney, 1973) . Test-hole data from adjacent Grand Forks County indicate that theWinnipeg Formation contains an aquifer of potential importance . Although itsareal extent is poorly defined (Kelly and Paulson, 1970), the aquifer probabl yunderlies a large area of Griggs and Steele Counties, also .
The Red River Formation overlies the Winnipeg Formation in the studyarea . This formation was described by Ballard (1963), who divided it into tw ounits : a lower unit of fragmental microgranular dolomite and an upper unit o ffragmental limestone, argillaceous dolomite, and minor amounts of anhydrite .The formation thickness is about 570 feet (174 m) .
Few data are available concerning the water-yielding characteristics of th eRed River Formation in Griggs and Steele Counties . The productivity of car-bonate rocks, such as limestone and dolomite, is dependent upon the numbe rand the continuity of fractures and solution cavities that are open to the well .Well yields will be high where a large number of extensive fractures an dsolution cavities are present, whereas solid limestone will yield little or nowater .
The Stony Mountain Formation, which overlies the Red River Formation ,consists of interbedded shale, dolomite, and limestone . Few data are availableas to the thickness of the formation in Griggs and Steele Counties; however, i nNelson County to the north the formation ranges in thickness from 142 feet (4 3m) in oil test 151-060-06AA to 92 feet (28 m) in oil test 149-059-15BD (Downey ,1973) .
If water were obtained from Ordovician rocks in Griggs and Steele Coun-ties, it probably would be very saline, with dissolved-solids concentration sexceeding 20,000 mg/1 (Downey, 1973). The principal constituents are sodiu mand chloride .
10

TABLE 2 .-Generalized geologic section and water-yielding characteristics of geologic unit sin Griggs and Steele Countie s
System Formation Dominant lithology
Maximu mthickness
(feet) Water-yielding characteristic s
Quaternary Glacial drift Clay, silt, sand, and gravel . 550+ Yields as much as 1,500 gal/min to individual wells from thickerand more permeable sand and gravel deposits .
Pierre Formation Shale 200 Yields from 1 to 10 gal/min to individual wells from fractures .Low hydraulic conductivity except where fractured .
Niobrara Formation Calcareous shale . 160Carlile Formation Shale . 240 Very low hydraulic conductivity except for thin sandstone unit sGreenhorn Formation Calcareous shale . 80 which may yield small quantities of water.
Cretaceous Belle Fourche Formation Shale . 250Mowry Formation Shale . 100Newcastle Formation Sandstone and shale . 80Skull Creek Formation Sandy shale . 90 Yields from 250 to 500 gal/min to individual wells from thicker andFall River Formation
(Dakota Sandstone, shale, and 285 more permeable sandstone units.Lakota Formation
aquifer) siltstone.
Jurassic Unnamed Red shale and 100 Very low hydraulic conductivity except for thin interbedded sand -siltstone. stone units which may yield 1 to 10 gal/min to individual wells at
selected locations .
Stony Mountain Formation Limestone and dolomite . 140 Yields from limestone and dolomite units dependent upon numbe rOrdovician Red River Formation Limestone and dolomite . 570 of joints, solution cavities, and fractures open to well. Locally, high
Winnipeg Formation Calcareous shale and 65 yields are possible. Shale units are not water yielding . Yields fro msandstone. sandstone units unknown .
Precambrian Unnamed Granodiorite, granite, Unknown Relatively impermeable .schist, and gneiss .

Rocks of Jurassic Ag e
Rocks of Jurassic age (table 2) have not been identified in Griggs and SteeleCounties, although geologic data from adjacent areas (Downey, 1973) sugges tthat they may be present . These rocks are composed predominantly of shale ,and siltstone, but locally may contain thin lenses of sandstone that are capabl eof yielding 1 to 10 gal/min (0.06 to 0.63 Us) of moderately saline water toindividual wells .
Rocks of Cretaceous Ag e
Rocks of Cretaceous age contain two important aquifers in Griggs an dSteele Counties ; the Dakota and Pierre . The other formations of Cretaceou sage do not yield significant amounts of water to wells .
Dakota aquifer .–The Dakota aquifer (table 2), consisting of the Lakota andFall River Formations (or their equivalents), underlies much of the GreatPlains in the United States and Canada . It is potentially the most productiv ebedrock aquifer in Griggs and Steele Counties . However, most wells presently(1974) tapping the aquifer in the study area are unused but are maintained on astandby basis . The water-bearing materials consist mainly of fine- to coarse -grained quartz sandstone interbedded with gray shale from about 580 to 86 5feet (180 to 264 m) below land surface . The sandstone occurs in thin lenses, a sshown by the log of well 145-054-27CDC (Downey and others, 1973) .
Because of the variable nature of the sandstone lenses in the Dakotaaquifer, extension of aquifer parameters from one area to another within th eaquifer is of questionable value. Estimates based on sample examination anddata available from adjacent counties (Downey, 1973; Kelly and Paulson, 1970 )indicate a transmissivity of about 6,000 ft 2 /d (557 m 2 /d) and a storage coefficientof 0 .0002 for the Dakota aquifer in Griggs and Steele Counties . Yields rangin gfrom 250 to 500 gal/min (16 to 32 Us) may be possible from individual well stapping the thicker sandstone lenses .
Analyses of nine water samples from six wells tapping the Dakota aquifer i nGriggs and Steele Counties are available (Downey and others, 1973) . Thesamples had a dissolved-solids concentration of 2,960 to 5,190 mg/1 with amedian value of 3,800 mg/l . Chloride concentrations ranged from 581 to 1,51 0mg/1 with a median of 1,350 mg/1 . The chloride concentration of water from theaquifer apparently increases from south to north with a large increase occurrin gabout midway across the counties .
Little use is made of the water from the Dakota aquifer in Griggs and Steel eCounties because it is saline and also because there generally is better qualit ywater available at shallower depths .
Pierre aquifer . –The Pierre Formation (table 2) directly underlies the glacia ldrift or crops out in much of the project area . It generally consists of light-grayto black shale, marlstone, and claystone with yellowish to white bentonit elayers in the lower part of the formation . The upper part of the Pierre Forma-tion in Griggs and Steele Counties consists of a black fissile shale that contain s
12

fractures caused by glacial action . The fractured shale ranges in depth from 25to 140 feet (8 to 43 m) below land surface and forms an aquifer that is a source o fwater for many farms in northeastern Griggs and northwestern Steele Coun-ties .
A study of the hydraulic characteristics of the aquifer at Michigan in Nelso nCounty was made by Aronow, Dennis, and Akin (1953) . They reported trans-missivities for the aquifer that ranged from about 66 to 121 ft 2/d (6 .1 to 11 . 2m 2/d) and averaged 95 ft 2 /d (8 .8 m 2/d) . The storage coefficients computed fro mtheir test data averaged 0 .00042. Similar values were obtained from short-ter mpumping tests on the Pierre aquifer near Fairdale in Walsh County (Downey,1973).
Individual well yields from the Pierre aquifer range from less than 1 to 10gal/min (0 .06 to 0.63 Us) . However, yields greater than 5 gal/min (0 .32 Us )should not be expected in most areas of Griggs and Steele Counties .
Recharge to the Pierre aquifer is derived mainly from percolation throughthe overlying glacial drift or direct infiltration in outcrop areas . In areas wherethe fracture zones are in hydraulic connection with the glacial drift, water i sable to move rather quickly into the shale and along the fractures toward area sof discharge. In such areas, water-level rises in the shale are closely related t operiods of precipitation . Where the fracture zones are poorly developed, wate rmoves very slowly through the shale from areas of recharge to areas of dis-charge. The amount of water in storage in the Pierre aquifer is related directlyto the extent and thickness of the fracture zones .
Water from the Pierre aquifer is moderately hard to very hard and of asodium bicarbonate or sodium sulfate type. Five samples had dissolved-solid sconcentrations ranging from 308 to 2,550 mg/l with a median value of 1,230mg/l . The principal ions were sodium, calcium, bicarbonate, sulfate, andchloride . The sodium-adsorption ratio ranged from 0 .8 to 36 with a medianvalue of 6 .5 .
Ground Water in Glacial Drift
Griggs and Steele Counties are mantled by glacial drift, except along stream swhere it has been removed by postglacial erosion . The drift commonly is lessthan 100 feet (30 m) thick in much of the two-county area; the maximumthickness is more than 550 feet (167 m) .
Glacial drift occurs in many types . Till, the first and most prevalent type, is anonsorted mixture of clay, silt, sand, gravel, and boulders . Till was depositeddirectly from glaciers and ice sheets with little sorting by water action ; it scomposition depends to a large extent upon the type of bedrock over which th eglacier or ice sheet had moved .
The second type of glacial drift is glacial outwash, which includes delt adeposits, ice-contact deposits, and many buried sand and gravel deposits . Out -wash deposits normally are stratified and sorted according to grain size and ar e
13

very permeable . Outwash deposits comprise all the major glacial-drift aquifers i nGriggs and Steele Counties .
The third type of glacial drift — lake deposits — consists of clay, silt, and san ddeposited in the proglacial lakes that existed at or near the edge of a glacier . Thedeposits of silt and clay in eastern Steele County are included in this type . Als oincluded are beach deposits formed along the shores of the lakes .
Spiritwood Aquifer System
The largest glacial-drift aquifer in the two-county area, the Spiritwoo daquifer system, is located in the western part of Griggs County and extends fro mT. 144 N ., R. 58 W. northwestward through T. 148 N., R. 61 W. (pl . 1, inpocket) . The system, is composed of the Spiritwood aquifer of Huxel (1961), th eNew Rockford aquifer of Trapp (1968), and several small unnamed tributar yaquifers . The system, which underlies about 350 m il (900 km2) in Griggs County ,extends into Barnes County on the south and Eddy, Foster, and Nelson Countie son the west and north .
The Spiritwood aquifer system consists of lenticular deposits of sand an dgravel interbedded with clay and silt. It ranges in thickness from less than 1 foo t(0 .3 m) at the edge to more than 550 feet (170 m) . However, the thickness of thesaturated sand and gravel averages about 100 feet (30 m) . The deeper aquifermaterials were deposited in preexisting bedrock channels (pl . 2, in pocket, an dfig . 4 1) by flowing water . After the channels were filled, deposition continue duntil the valleys were filled . Locally, low divides between the valleys also wereburied .
A 100-hour aquifer test was made on the Spiritwood aquifer system nea rBinford, N . Dak. The pumping rate for the test was 1,515 gal/min (95 .6 1/s) .Analysis of the data (R . W. Schmid, North Dakota State Water Commission ,written commun ., 1972), using methods developed by Theis (1935), indicates atransmissivity of about 4,500 ft2/d (418 m 2/d) and a storage coefficient of abou t0 .02 .
The yields from wells located in the Spiritwood aquifer system depen dmainly upon the thickness of sand and gravel found at the well location . Wellslocated along the central parts of the aquifer offer the greatest possibility o fpenetrating large thicknesses of sand and gravel, and individual wells located i nthese areas may yield more than 1,000 gal/min (63 1/s) . The aquifer-test datasuggest that individual well yields of about 1,500 gal/min (951/s) may be obtaine dat selected locations in the aquifer . Yields decrease toward the aquifer bound-aries due to the thinning of the sand and gravel and the low hydraulic conductiv -ity of the confining clay, silt, and till deposits .
Because of the facies changes within the Spiritwood aquifer system, exten-sion of yield data from one area to another within the aquifer is somewhattenuous, but correlations made where conditions are similar usually are valid .
1 Locations of sections are shown on plate 1 .
14

FIGURE 4.- Section through the Spiritwood aquifer system .
B '
-400
-350
-300
90 0VERTICAL EXAGGERATION X5 3DATUM IS MEAN SEA LEVEL
0
2
3 MILE S
0
2
3
4 KILOMETERS

Recharge to the Spiritwood aquifer system is from direct precipitation an dsnowmelt on the aquifer surface . Water-level fluctuations in the aquifer aregenerally small with the highest water levels following spring snowmelt . Yearlyfluctuations generally are less than 3 feet (1 m), although somewhat greaterfluctuations do occur at a few locations. The potentiometric surface (fig . 5)generally slopes towards, and water is discharged into, Bald Hill Creek .
In general water from the Spiritwood aquifer system is very hard and is asodium bicarbonate type . Locally, however, the water is a sodium sulfate orcalcium sulfate type . Water samples were collected from 101 wells penetratin gthe Spiritwood aquifer system . Dissolved-solids concentrations ranged from 244to 9,800 mg/1 ; the median was 800 mg/1 . Hardness ranged from 63 to 5,030 mg/ 1and sulfate ranged from 19 to 5,660 mg/1 . Chloride concentrations ranged from0.7 to 649 mg/1, but only eight of the samples contained more than the U .S .Public Health Service (1962) recommended chloride limit of 250 mg/1 . All of th esamples with concentrations greater than 700 mg/1 sulfate or more than 250 mg/ 1chloride were collected from wells located near the edge of the aquifer, suggest -ing recharge from the Pierre Formation .
The sodium-adsorption ratio ranged from 0 .1 to 13 and exceeded 6 in 2 9samples . The aquifer system has water that generally is classified as C3-Sl toC3-S2 for irrigation (fig . 3) .
Based on an average saturated thickness of 100 feet (30 m), an estimatedaverage specific yield of 0 .15, and an areal extent of 350 mi2 (900 km2), about3,400,000 acre-feet (4 .2 km 3 ) of water may be available from storage from th eSpiritwood aquifer system in Griggs County . Silts and clays also contain consid -erable water in storage, but the rate of drainage from these deposits is too slow t oadd significantly to the available storage within a period of a few years .
McVille Aquifer
The McVille aquifer (Downey, 1973) extends from T. 144 N., R. 57 W. inSteele County to T . 148 N ., R. 59 W . in Griggs County (pl. 1) . It underlies about13 mi2 (34 km 2 ) in the two-county area and extends from Barnes County on thesouth to Nelson County on the north . The aquifer is contained in a buried valle y(fig. 6) cut into the Pierre Formation and the overlying till . It has a length of about34 miles (55 km) and ranges in width from about a quarter of a mile (400 m) toabout 20 miles (4 km) with an average width of about three-eighths of a mile (60 0m) .
Test drilling indicates that the McVille aquifer generally is composed of fin esand, sandy gravel, and clayey silty sand interbedded with lenses of silty clay an dglacial till . The sand and gravel generally is coarser in the northern part of theaquifer than in the southern part . The aquifer ranges in thickness from less than 1foot (0 .3 m) at the edges to more than 300 feet (90 m) near the southern boundaryof Steele County and contains an average of about 80 feet (24 m) of saturated san dand gravel .
A pumping test of the McVille aquifer was not made as a part of this study ;however, data from a test made in Nelson County (Downey, 1973) indicate tha t
16

M IDDLE,-
FINLE Y
0
2 3 4 5
10 MILE S
0 1 2 3 4 5
10
15 KILOMETER S
EXPLANATIO N
/46o- POTENTIOMETRIC CONTOUR—Shows altitudeat which water level would have stood in tightl ycased wells, fall-winter 1970 . Contour interva l20 feet (6 .1 m) . Datum is mean sea level
FIGURE 5.- Generalized map of the potentiometric surface in the Spiritwood aquifer system and Galesbur gaquifer .

METERS-450
-400
-350SHAL E
DATUM IS MEAN SEA LEVEL VERTICAL EXAGGERATION X 530 2 MILE S
0 3 KILOMETERS
FIGURE 6.- Section through the McVille aquifer .
the transmissivity ranges from about 2,000 to 9,000 ft 2/d (186 to 836 m2/d) .Somewhat smaller transmissivities should be expected in the southern part of th eaquifer near the city of Luverne where the aquifer is composed of finer graine dmaterials . Maximum yields of individual wells tapping the McVille aquifer ar eestimated at about 500 gal/min (32 1/s).
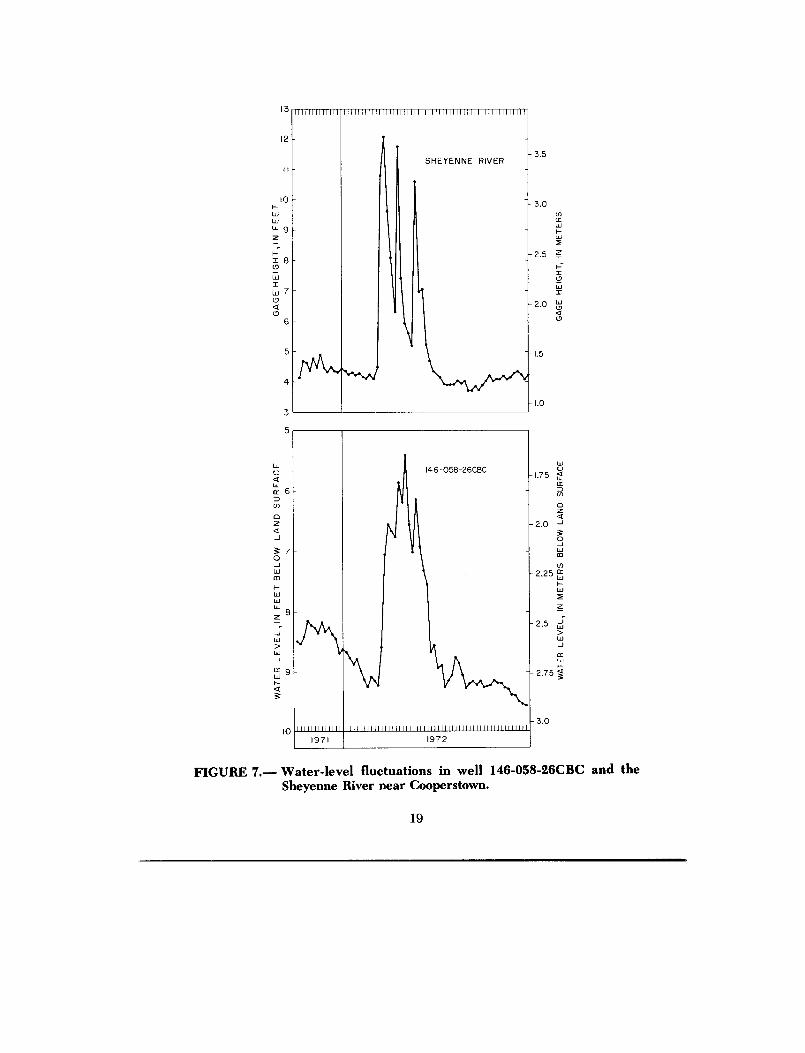
Recharge to the McVille aquifer is from direct precipitation, snowmelt, an dinflow from the Sheyenne River . The relationship between the aquifer and th eriver is shown graphically in figure 7, where periods of high and low water level sin observation we11146-058-26CBC, located about 200 feet (61 m) from the river ,coincide with periods of high and low flows in the river .
Water in the McVille aquifer generally is very hard, and the dissolved-solidsconcentration varies to a great extent with the water 's position in the aquifer .Water from the more permeable parts of the aquifer generally has relatively lo wconcentrations of dissolved solids with a high proportion of calcium and bicarbo -nate ions . Toward the edges of the aquifer and in those areas where the aquifer i sisolated from the Sheyenne River, dissolved solids and the proportion of sodiu mand sulfate ions increase . Water samples collected from the aquifer ha ddissolved-solids concentrations ranging from 449 mg/1 in the northern part of theaquifer to 2,200 mg/1 in the southern part near the city of Luverne .
18
13
1111111111111
111111111111111111111111111111111111111111111111111 1
SHEYENNE RIVER-3 . 5
-3. 0
-2 . 5
2 .0
12
6
1. 5
I. 0
146-058-26CBC
wJ6
1--
2 .75 3
-3. 0
10
I IIIIIIIIIIII 1 111111111111111111111 1 111111111111111111111 H 1 11111
1971
197 2
FIGURE 7.- Water-level fluctuations in well 146-058-26CBC and theSheyenne River near Cooperstown.
19

The sodium-adsorption ratio ranged from 0 .1 to 11 with a median value of 2 .1 .The aquifer has water that generally is classified C2-S1 to C3-S2 for irrigation (fig .3) .
Based on an areal extent of 13 m i2 (34 km2 ), an average saturated thickness o f80 feet (24 m), and an estimated average specific yield of 0 .15, about 100,000acre-feet (0 .1 km 3 ) of water may be available from storage in the aquifer .
Galesburg Aquife r
The Galesburg aquifer (Bluemle, 1967) underlies an area of about 165 mi 2(427 km2) in southeastern Steele County . It extends into Traill and Cass Countie sto the east and south and includes the deposits assigned to the Page aquifer b yKlausing (1968) in Cass County .
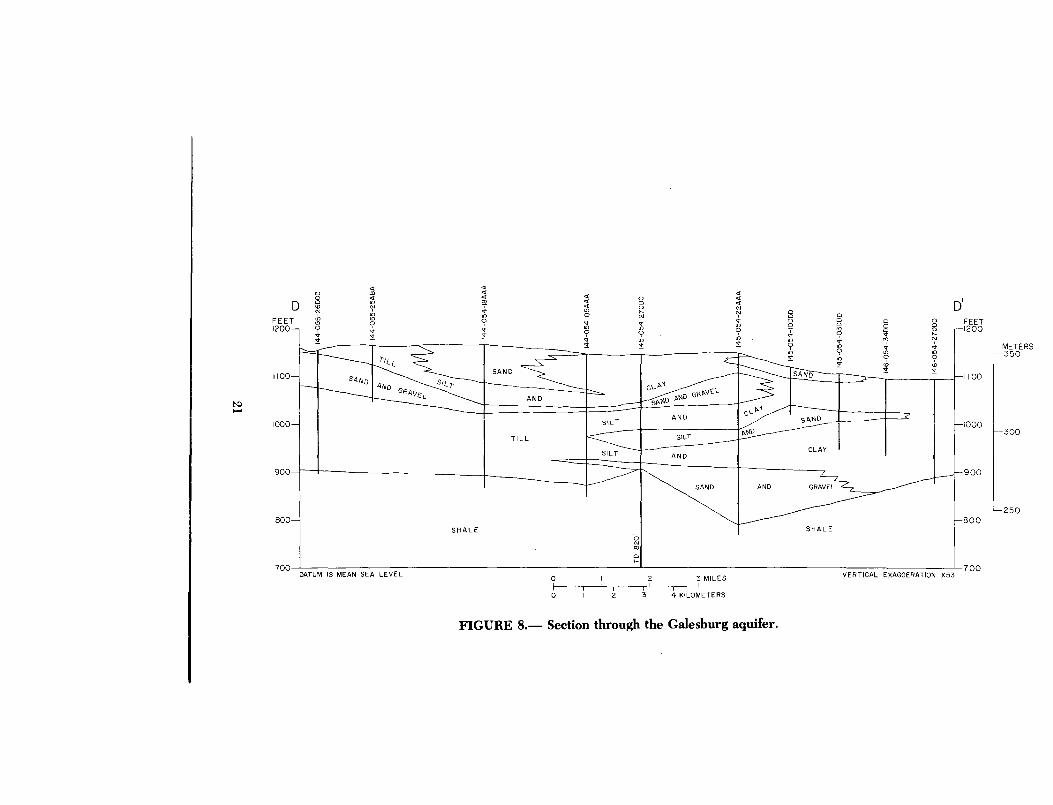
Geologically, the Galesburg aquifer is a part of the Galesburg delta (Bluemle ,1967), which formed along the shore of glacial Lake Agassiz . The aquifer materi-als were deposited in a near-shore environment of the lake and consist o flenticular deposits of sand and gravel interbedded with clay and silt . Glacial tilloccurs within several stratigraphic sequences (pl . 2, and fig . 8), indicating thatglacial ice moved across the surface of the delta at various times during it sformation . Glacial till also occurs as a layer capping the aquifer throughout mostof the area . The aquifer ranges in thickness from less than 1 foot (0 .3 m) near thewestern edge to about 400 feet (122 m) in the southeastern corner of Steel eCounty with an average thickness of about 210 feet (64 m) . The average thicknes sof saturated sand and gravel in the aquifer is about 43 feet (13 m) .
Because of the nature of origin of the Galesburg aquifer, the lithology i svariable from one location to another . The thickness and extent of sand andgravel deposits change rapidly within a short distance . Individual sand an dgravel lenses range in thickness from about 2 feet (0 .6 m) to 115 feet (35 m) withan average thickness of about 25 feet (7 .6 m) .
Geologic logs of test holes (Downey and others, 1973) drilled through th eGalesburg aquifer indicate that the aquifer in general consists of two units : anupper near-surface unit consisting of lenses of fine sand and a deeper uni tcomposed of interbedded sand and gravel (pl . 2, and fig . 8) . The two units areseparated by varying thicknesses of glacial till and(or) silt and clay . Klausing(1968) noted the occurrence of these two separate units within the Page aquife r(Galesburg equivalent) in Cass County; however, in Traill County (Jensen andKlausing, 1971) the two units were not identified, most likely because of the lac kof test holes that penetrated the deeper unit .
Because of facies changes that occur within short distances in the Galesbur gaquifer, extrapolation of aquifer properties from one area to another is somewha ttenuous . Schmid (written commun., 1973), using methods developed by Thei s(1935) and data from a pumping test at 144-054-22DCD, where the aquifer is 78feet (24 m) thick, reported that the Galesburg aquifer had a transmissivity o fapproximately 5,000 ft2 /d (464 m2/d) and a storage coefficient of about 0.001 inthis area . The specific capacity of the test well was 7 .8 (gal/min)/ft [1 .6 (1/s)/m] .Based on available data, it is estimated that individual well yields of 500 to 1,000
20
Q
Qo
m
ao
0
mN
vN
NO
0Oa
aa
2
DFEE T1200
SANA ND_
GRA ~fI
SAND
AND
METERS-350
100
-1000
1100 —
1000 —
900
a
TILL
SILT
SILT
AND
SAND
pND
CLAY
AND
GRAVEL
- 30 0
900
- 250800
SHALE-800
SHAL E
0r700
DATUM IS MEAN SEA LEVELq 2 3 MILESf
7
I
I
I
~
q 2 3 I4 KILOMETERS
VERTICAL EXAGGERATION X5370 0
FIGURE 8.- Section through the Galesburg aquifer .
gal/min (32 to 63 1/s) may be expected from about one-fourth of the area of theGalesburg aquifer . Data from the pumping test and the potentiometric-surfacemap (fig . 5) indicate that the Elm and South Branch Goose Rivers act as drains fo rthe ground-water system .
Recharge to the Galesburg aquifer is from direct precipitation upon th eaquifer surface and infiltration from snowmelt in the spring . Discharge is limite dto outflow to the Elm and South Branch Goose Rivers, evapotranspiration, an dsmall-capacity wells .
Water from the Galesburg aquifer is very hard and generally is either acalcium sulfate or a calcium bicarbonate type . Dissolved-solids concentrations in41 samples ranged from 317 to 2,170 mg/1 with a median value of 856 mg/1 . Iron ,manganese, and sulfate commonly exceeded the recommended limits shown intable 1 .
The sodium-adsorption ratio of the samples analyzed ranged from 0 .2 to 1 .6 .The water generally is classified C3-S1 for irrigation purposes (fig . 3).
Based on an areal extent of 165 m il (427 km 2), an average saturated thicknes sof 43 feet (13 in), and an estimated average specific yield of 0 .15, about 680,000acre-feet (0 .8 km 3) of water may be available from storage in the Galesbur gaquifer .
Elk Valley Aquifer
The Elk Valley aquifer (Kelly and Paulson, 1970) underlies an area of abou t48 mil (124 km 2) in northeastern Steele County (p1 . 2) . Test drilling indicatesthat the aquifer consists of sand and gravel interbedded with clay and silt (fig .9) . It ranges in thickness from a few feet to about 100 feet (30 in) ; however, thesand and gravel units have an average thickness of about 23 feet (7 m) and arenormally found at less than 100 feet (30 m) below land surface .
Jensen and Klausing (1971) reported an estimated transmissivity for the El kValley aquifer at Hatton in Traill County of 134 ft 2/d (12.4 m2/d) . A similia rvalue is estimated for the aquifer deposits in Steele County . Most wells in theaquifer presently yield only a few gallons per minute but yields as high as 30gal/min (2 1/s) probably could be obtained from some ideally located wells tha tfully penetrate the aquifer.
Water from the Elk Valley aquifer in Steele County normally is very har dand generally is a calcium or sodium bicarbonate type . The dissolved-solid sconcentration in samples collected during this study ranged from 397 to 2,89 0mg/1 with a median value of 549 mg/1 .
The sodium-adsorption ratio of the samples analyzed ranged from 0 .2 to 1 .6 .The water generally is classified C3-S1 for irrigation purposes (fig . 3).
Although the Elk Valley aquifer underlies about 7 percent of the area o fSteele County, its low hydraulic conductivity will restrict future developmen tto small capacity wells .
22

METER S-350
-300
-1100
E I
FEE T-1200
-100 0
CLA Y
900—
-900
800
SHAL E
DATUM IS MEAN SEA LEVEL VERTICAL EXAGGERATION X530 2 MILE S
J01 2 3 KILOMETERS
FIGURE 9.- Section through the Elk Valley aquifer .
Based on an areal extent of 48 mil (124 km 2 ), an average saturated thicknes sof 23 feet (7 m), and an estimated average specific yield of 0.15, about 110,00 0acre-feet (0 .14 km3) of water may be available from the sand and gravel units .
Undifferentiated Drift Aquifers
Small deposits of sand and gravel commonly are interspersed in the glacia ltill throughout much of eastern Griggs County and much of Steele County .These deposits were formed wherever there was sufficient melt water to caus esorting and stratification . Many of the deposits are contained in small narrowchannels, but the full extent of the channels could not be determined becaus eof insufficient data to determine the exact boundaries .
In general the sand and gravel deposits are limited both in thickness an dareal extent . They are also limited as to recharge because of the overlying till ,which ranges in hydraulic conductivity from about 0.00004 to 0.05 ft/d(0 .000012 to 0.02 m/d; Downey, 1973) depending upon the amount of clay, silt,and sand present . Yields from individual wells tapping these sand and graveldeposits may be as high as 50 gal/min (3 1/s), but generally are less than 5gal/min (0 .3 1/s) .
23
-250B0 0

Many farm wells in the eastern part of Griggs County and the western par tof Steele County tap deposits of glacial till . These wells yield sufficient water tomeet the needs of small farm operations even though many of them failed t openetrate any significant thickness of sand or gravel . In some places the water i sproduced from very thin sand and gravel lenses that are interbedded with th etill, in others the water comes from joints or other fractures in the till . Becaus ejoints, fractures, and sand and gravel lenses in the till are not apparent at th esurface, considerable test drilling is necessary before installation of productio nwells .
In order to insure the best possible yield from till aquifers, it is necessary t oinstall large-diameter wells that will provide a large area for seepage and als oact as reservoirs for storage of water . Proper design of wells tapping till aquiferswill minimize the tendency for these wells to be pumped dry after a shor tpumping period . It will also decrease the length of time required to refill afte rbeing pumped dry .
Hydrographs plotted from water-level measurements from till wells com-monly show large fluctuations . These large fluctuations generally are attribute dto the effects of precipitation . However, Schneider (1961) and Willis and other s(1964) have shown that water-level fluctuations in fine-grained materials ca noccur in the absence of precipitation due to the formation of ice crystals withi nthe sediments, thereby removing water from the system . When these icecrystals melt in the spring, the water is returned to the ground-water syste mresulting in a rise in water levels . Preliminary data from a series of temperaturesensors installed from 5.6 to 78 inches (142 to 1,980 mm) below land surface i nCavalier County (R . D . Hutchinson, written commun ., 1974) indicate that wit hthe freezing of the till there is a corresponding decrease in water levels i nnearby observation wells, and with spring melting there is a rise in wate rlevels .
Many small ice-contact deposits of sand and gravel are found in Griggs andSteele Counties . In general, these deposits are the result of glacial ice meltingin place and leaving a deposit of sand or gravel . Often the bulk of these deposit sis above the general water table of the area and only a thin water-saturated zon eexists near the base . During periods of the year when precipitation is at aminimum, these deposits may be completely dry .
A few of the larger ice-contact deposits may yield sufficient water for gen-eral farm use ; however, in most cases the ice-contact deposits are not capable o fyielding more than 5 to 10 gal/min (0 .3 to 0 .6 Us) to individual wells over a longperiod of time .
The chemical quality of water from undifferentiated drift aquifers differswidely from one location to another . This variation of water quality mainly i sdue to the great variety of minerals in the deposits, sources of recharge, an dhydraulic connection with other aquifers . In samples collected from undiffer-entiated drift aquifers the dissolved-solids concentration ranged from 333 t o7,760 mg/l and total hardness ranged from 200 to 3,100 mg/1 . Iron, manganese ,and sulfate commonly exceeded the recommended limits set by the U .S . PublicHealth Service (1962) .
24
UTILIZATION OF GROUND WATE R
Nearly the entire population of Griggs and Steele Counties is dependen tupon ground water for their supply of water for domestic and livestock needs .Based on 1970 population figures, about 61 percent of the two-county popula-tion has self-supplied systems and 39 percent depends on a public supply . Sixcommunities — Binford, Cooperstown, Finley, Hannaford, Hope, and Sharon— have municipal water supplies ; all use ground-water sources .
Based on a 1970 population of 7,933 people, it is estimated that abou t850,000 gal/d (3,000 m3/d) of water is being used in the two-county area .
Rural Domestic and Livestock Us e
In Griggs and Steele Counties, many of the older domestic and livestockwells are of large diameter and of hand-dug or bored construction . Dug wellsmay be satisfactory where an adequate supply of water can be obtained near thesurface, but they have certain disadvantages . Wells cannot be dug by hand veryfar below the water table; consequently, if the water table is lowered substan-tially, the wells must be deepened or they will go dry . Because they penetrateonly a few feet of the upper part of the aquifer, individual wells commonly hav elow yields, normally less than 5 gal/min (0 .3 1/s) . Dug wells tapping shallowaquifers are often subject to surface sources of contamination . Furthermore, itis difficult to seal a dug well properly and still provide access for repairs .
Because of the disadvantages of dug wells, many have been replaced b ydrilled or bored wells in recent years . Most of the drilled farm wells are from 4to 6 inches (102 to 152 mm) in diameter and are completed in the most produc-tive aquifer available . In the western part of Griggs County the Spiritwoodaquifer system is the principal source of water . In the central part of th etwo-county area the Pierre, undifferentiated drift, and McVille aquifers supplymost of the farms . Farms in northeastern Steele County obtain water from theElk Valley aquifer, while those in southeastern Steele County utilize th eGalesburg aquifer .
Most farm units in the two-county area have at least one well for thei rdomestic and livestock uses, but records are not available to accurately deter -mine the quantity of water used .
Public Supply
Binford
The city of Binford (population 242) in northwestern Griggs County obtain sits public supply of water from a well located at 147-060-08C BC . The supply i sobtained from a 114-foot (35-m) well finished in the Spiritwood aquifer system .Reported pumpage is about 4,000 gal/d (15 m 3/d) . Additional water for the citysystem may be obtained by further development of the Spiritwood aquife rsystem .
25

Cooperstown
The city of Cooperstown, located in east-central Griggs County, is th emajor population (1,485) center of the county . Cooperstown obtains its waterfrom three wells, 146-058-26BDB1, BDB2, and BDB3 (38, 47, and 139 fee tdeep; 12, 14, and 42 m), finished in the McVille aquifer east of the city . Onlythe 47-foot and 139-foot wells are used for the city supply ; the 38-foot well is forreserve. Daily pumpage averages about 274,000 galld (1,028 m3/d), and the47-foot and 139-foot wells, which have capacities of 75 gal/min (4 .7 1/s) and 175gal/min (11 1/s), respectively, are adequate to supply this amount .
Finley
The city of Finley, the major population (809) center of Steele County ,obtains its water from several wells tapping a shallow deposit of sand and grave least of the city . These wells range from 20 to 32 feet (6 to 10 m) in depth an dappear to be adequate to supply the city 's average daily pumpage of 55,000gallons (208 m 3 ) . If necessary, additional water could be obtained by develop-ment of the Galesburg or McVille aquifers .
Hannaford
The city of Hannaford in south-central Griggs County obtains its watersupply from a well 180 feet (55 m) deep developed in the Spiritwood aquife rsystem .
Pumpage records are not available for the city, but the water supply appear sto be more than adequate for the 244 residents (1970 census) of the city . Thewell probably is being pumped on the average between 14,000 and 15,000 gal/d(53 m 3/d and 57 m 3/d) . This is far below the capacity of the well and there is n oforeseeable shortage of water . If need did arise, however, further developmen tof the Spiritwood aquifer system would produce an adequate supply .
Hope
The city of Hope (population 364), in south-central Steele County, obtain sits water supply from two wells in the Galesburg aquifer . Daily pumpag eranges from 25,000 gal/d (95 m 3/d) in the winter to 60,000 gal/d (227 m 3 /d) inthe summer . Average daily pumpage is about 42,500 galld (161 m3 /d). TheGalesburg aquifer is capable of meeting the future water needs of the city .
Sharon
The city of Sharon (population 201), located in northwestern Steele County ,obtains its water from a 65-foot (20-m) well that taps an undifferentiated driftaquifer . Reported daily pumpage for 1972 was 9,000 gal/d (34 m 3/d) .
26

Rural Water Districts
Since 1970, several rural water districts were developed in eastern Nort hDakota, including one planned to provide water from the Galesburg aquifer t oa large area of Griggs and Steele Counties . With proper planning, these dis-tricts are able to provide large quantities of water to farms and smal lmunicipalities . Three aquifers — the Spiritwood, McVille, and Galesburg — i nthe two-county area could be used as sources of water to supply the needs ofany additional water districts .
SUMMARY
Ground water in Griggs and Steele Counties may be obtained fro msandstone units in the Dakota aquifer, fracture zones in the shale in the Pierr eaquifer, and from sand and gravel aquifers in glacial deposits . Available datasuggest that water from the bedrock units of Precambrian, Ordovician, an dJurassic age is moderately saline to very saline . Well yields from the Precamb-rian, Ordovician, and Jurassic units are low .
The Dakota aquifer, at a depth of about 580 feet (180 m) below land surface ,is potentially the most productive bedrock aquifer in the two-county area . Thisaquifer is capable of yielding as much as 500 gal/min (32 1/s) to properly con -structed individual wells . Water samples from the Dakota aquifer haddissolved-solids concentrations of from 2,960 to 5,190 mg/l, and generallywould be considered too saline for most uses .
The Pierre aquifer, directly underlying the glacial drift, supplies water forfarms in the northeastern part of Griggs County and the northwestern part o fSteele County . Individual well yields from the Pierre aquifer are as much as 1 0gal/min (0.6 Us), but generally are less than 5 gal/min (0 .3 Us). Water sample sfrom the Pierre aquifer had dissolved-solids concentrations ranging from 308 t o2,550 mg/1 .
The aquifers with the greatest potential for development are those in th eglacial deposits associated with buried valleys, such as the Spiritwood andMcVille aquifers, and deltas associated with glacial Lake Agassiz . The sedi-ments in both types of deposits are lenticular, thus the thickness of any particu-lar sand or gavel body may vary within a short distance .
Hydrologic data for the Spiritwood aquifer system, McVille, Galesburg, andElk Valley aquifers are listed in the summary table .
The rural population of Griggs and Steele Counties is dependent uponground water for domestic and much of their livestock needs . In addition, thecommunities of Binford, Cooperstown, Finley, Hannaford, Hope, and Sharo nobtain their public supplies from wells .
Planned rural water districts will be able to provide large quantities of waterto many farms in the two-county area from three glacial-drift aquifers — th eSpiritwood system, McVille, and Galesburg .
27

Summary of data for major aquifers in the glacial drift
Aquifer Spiritwoodsystem
McVille Galesburg Elk Valley
Areal exten t(mil) 350 13 165 48
Averagesaturatedsand an dgravelthicknes s(feet) 100 80 43 2 3
Estimatedmaximumyield toindividualwells(gal/min) 1,500 500 1,000 3 0
Estimatedamount ofwater avail -able fromstorage(acre-feet) 3,400,000 100,000 680,000 110,000
Dissolve dsolids 244 449 317 397range to to to to(m g/1) 9,800 2,200 2,170 2,890
Dominant Sodium, Calcium Calcium Calcium ,ions calcium, sodium, sulfate, sodium,
bicarbonate, bicarbonate, and andand sulfate . and sulfate . bicarbonate . bicarbonate .
Hardness Very hard.' Very hard . Very hard . Very hard .
Generalirrigationclassi- C3-S1 to C2-S1 to C3-S1 . C3-S1 .fication C3-S2 . C3-S2 .
'More than 180 mg/1 of calcium carbonate .
2 8

SELECTED REFERENCE S
Abbott, G . A., and Voedisch, F . W., 1938, the municipal ground-wate rsupplies of North Dakota : North Dakota Geol . Survey Bull . 11, 99 p .
Adolphson, D . G ., 1962, Ground water in the Hatton area, Traill and Steel eCounties, North Dakota : North Dakota State Water Comm . Ground Wate rStudies no. 39, 23 p .
Anderson, S . B., and Haraldson, H. C., 1968, Cement-rock possibilities i nPaleozoic rocks of eastern North Dakota : North Dakota Geol . Survey Rept.Inv. 48, 62 p .
Aronow, Saul, Dennis, P . E., and Akin, P . D ., 1953, Geology and ground-water resources of the Michigan City area, Nelson County, North Dakota :North Dakota State Water Comm . Ground Water Studies no . 21, 125 p .
Ballard, F . V., 1963, Structural and stratigraphic relationships in the Paleozoi crocks of eastern North Dakota : North Dakota Geol . Survey Bull . 40, 42 p .
Beeks, C . H., Jr ., 1967, Hatton water supply survey, Steele, Traill, and Gran dForks Counties, North Dakota : North Dakota State Water Comm .Ground-Water Studies no . 66, 34 p .
Bluemle, J . P. 1967, Geology and ground-water resources of Traill County :North Dakota Geol . Survey Bull . 49, pt. I, and North Dakota State WaterComm . County Ground-Water Studies 10, pt . I, p . 34 .
1975, Geology of Griggs and Steele Counties : North Dakota Geol . SurveyBull . 64, pt . I, and North Dakota State Water Comm . County Ground -Water Studies 21, pt . 1, 50 p .
Carlson, C . G., 1964, The Niobrara Formation of eastern North Dakota ; it spossibilities for use as a cement rock : North Dakota Geol . Survey Rept . Inv.41, 56 p .
Colton, R. B ., Lemke, R. W., and Lindvall, R. M., 1963, Preliminary glacialmap of North Dakota : U. S. Geol . Survey Misc . Geol . Inv . Map I-331 .
Dennis, P. E., 1947, Ground water in the Sharon area, Steele County, NorthDakota: North Dakota State Water Comm . Ground Water Studies no . 8, 29P .
1948, Ground water in the Hope area, Steele County, North Dakota :North Dakota State Water Comm . Ground Water Studies no . 9, 30 p .
Downey, J . S ., 1969, in Pederson, D. T., and Reid, J . R., eds., Geology ofnortheastern North Dakota : North Dakota Geol . Survey Misc . Ser . 39, p .12 .
_1970, Ground-water resources of Nelson County, northeastern Nort hDakota: U .S . Geol . Survey Hydrol . Inv . Atlas HA-428 . 1971, Ground-water basic data, Nelson and Walsh Counties, North
Dakota: North Dakota Geol . Survey Bull. 57, pt. II, and North DakotaState Water Comm . County Ground-Water Studies 17, pt . II, 459 p .
_1973, Ground-water resources, Nelson and Walsh Counties, NorthDakota: North Dakota Geol . Survey Bull . 57, pt . III, and North DakotaState Water Comm. County Ground-Water Studies 17, pt . III, 67 p .
29
Downey, J . S ., Hutchinson, R. D., and Sunderland, G . L. 1973, Ground-wate rbasic data, Griggs and Steele Counties, North Dakota : North Dakota Geol .Survey Bull . 64, pt. II, and North Dakota State Water Comm. CountyGround-Water Studies 21, pt . II, 469 p .
Durfor, C . N., and Becker, Edith, 1964, Public water supplies of the 100largest cities in the United States, 1962 : U .S . Geol . Survey Water-SupplyPaper 1812, 364 p .
Ferris, J . G., Knowles, D . B., Brown, R. H., and Stallman, R. W., 1962,Theory of aquifer tests : U .S . Geol . Survey Water-Supply Paper 1536-E, p .69-174 .
Hem, J . D ., 1970, Study and interpretation of the chemical characteristics ofnatural water : U .S . Geol . Survey Water-Supply Paper 1473, 2d ed ., 363 p .
Huxel, C . J ., Jr ., 1961, Artesian water in the Spiritwood buried-valley com-plex, North Dakota: U .S . Geol . Survey Prof. Paper 424-D, p . D179-D181 .
Jacob, C . E., 1946, Drawdown test to determine effective radius of artesianwell : Am. Soc . Civil Engineers Proc ., v . 72, no . 5, p . 629-646 .
Jensen, H. M ., and Klausing, R . L., 1971, Geology and ground water resource sof Trail] County : North Dakota Geol. Survey Bull. 49, pt . III, and NorthDakota State Water Comm . County Ground Water Studies 10, 40 p .
Kelly, T. E ., 1968, Notes on the geohydrology of the Dakota Sandstone, east-ern North Dakota : U .S . Geol . Survey Prof. Paper 600-C, p . C185-C191 .
Kelly, T. E., and Paulson, Q . F., 1970, Geology and ground water resources o fGrand Forks County, pt . III, Ground water resources : North Dakota Geol .Survey Bull . 53 and North Dakota State Water Comm . County GroundWater Studies 13, 58 p .
Klausing, R . L., 1968, Geology and ground water resources of Cass County ,North Dakota: North Dakota Geol . Survey Bull. 47, pt. III, and NorthDakota State Water Comm . County Ground Water Studies 8, pt . III, 77 p .
Meinzer, O. E ., 1923a, The occurrence of ground water in the United States ,with a discussion of principles : U .S . Geol . Survey Water-Supply Paper 489 ,321 p .
1923b, Outline of ground-water hydrology, with definitions : U.S . Geol .Survey Water-Supply Paper 494, 71 p .
Meinzer, O . E., and Hard, H. A., 1925, The artesian water supply of theDakota Sandstone in North Dakota, with special reference to the Edgeleyquadrangle : U .S . Geol . Survey Water-Supply Paper 520-E, p . 73-95 .
National Weather Service, 1964-70, Climatological data, North Dakota : Ann .Summaries 1963-69, v . 72-78, no . 13 .
Nikiforoff, C . C., 1947, The life history of Lake Agassiz : An alternative in-terpretation : Am . Jour . Sci ., v . 245, no . 4, p . 205-239 .
Norris, S . E., 1963, Permeability of glacial till : U .S . Geol . Survey Prof. Paper450-E, p. 150-151 .
30

North Dakota State Department of Health, Environmental Health and En-gineering Services, 1964, Chemical analyses of municipal water in Nort hDakota: 25 p .
Robinove, C . J ., Langford, R . H., and Brookhart, J . W., 1958, Saline-wate rresources of North Dakota: U.S. Geol. Survey Water-Supply Paper 1428 ,72 p .
Schneider, Robert, 1961, Correlation of ground-water levels and air tempera-tures in the winter and spring in Minnesota: U.S. Geol . Survey Water -Supply Paper 1539-D, 14 p .
Schroer, F. W., 1970, A study of the effect of water quality and management o nthe physical and chemical properties of selected soils under irrigation :North Dakota Water Resources Inst ., Rept . Inv ., 48 p .
Simpson, H. E ., 1929, Geology and ground-water resources of North Dakota ,with a discussion of the chemical character of water by H . B. Riffenburg:U .S . Geol. Survey Water-Supply Paper 598, 312 p .
Sweeney, M . D ., [no date], Soil and water characteristics important in irriga-tion: North Dakota State Univ., Extension Service, Circ . S and F-573, 6 p.
Theis, C. V., 1935, The relation between the lowering of the piezometri csurface and the rate and duration of discharge of a well using ground-wate rstorage : Am. Geophys . Union Trans ., pt . 1, p . 519-524.
_1938, Significance and nature of the cone of depression in ground-wate rbodies : Econ . Geology, v . 33, no . 8, p . 889-902 .
Trapp, Henry, Jr ., 1968, Geology and ground-water resources of Eddy andFoster Counties, North Dakota ; pt . III, Ground water resources : NorthDakota Geol . Survey Bull . 44, and North Dakota State Water Comm .County Ground Water Studies 5, 110 p .
Twenhofel, W. H ., 1954, Correlation of the Ordovician Formations of Nort hAmerica: Geol . Soc . America Bull., v. 65, p . 247-298 .
U.S . Bureau of the Census, 1971, U .S . Census of Population 1970 : number o finhabitants, North Dakota : Final rept . PC(I)-A36 .
U.S . Geological Survey, 1940-1960, Compilation of records of surface waters ofthe United States ; pt . 5, Hudson Bay and upper Mississippi River basins :U .S . Geol . Survey Water-Supply Papers 1308 and 1728 .
U.S . Public Health Service, 1962, Drinking water standards, 1962 : U .S. PublicHealth Service Pub . 956, 61 p .
U .S . Salinity Laboratory Staff, 1954, Diagnosis and improvement of saline an dalkali soils : U .S . Dept . Agriculture Handb. 60, 160 p .
Upham, Warren, 1895, The glacial Lake Agassiz : U .S . Geol . Survey Mon . 25 ,658 p . [1896] .
Wentworth, C. K., 1922, A scale of grade and class terms for clastic sediments :Jour. Geol ., v . 30, p . 377-392 .
Wenzel, L . K., 1942, Methods for determining permeability of water-bearin gmaterials with special reference to discharging-well methods, with a sectio nof direct laboratory methods and bibliography on permeability and lamina rflow by V. C . Fishel : U .S . Geol . Survey Water-Supply Paper 887, 192 p .
31

Wenzel, L . K., and Sand, H . H., 1942, Water supply of the Dakota Sandston ein the Ellendale-Jamestown area, North Dakota, with reference to change sbetween 1923 and 1938: U.S . Geol . Survey Water-Supply Paper 889-A, 8 1
P .Willis, W. O ., Parkinson, H . L., Carlson, C . W., and Haas, H . J ., 1964, Water
table changes and soil moisture loss under frozen conditions : Soil Sci ., v .98, no . 4, October 1964, p . 244-248 .
DEFINITIONS OF SELECTED TERM S
Aquifer –A formation, group of formations, or part of a formation that contain ssufficient saturated permeable material to yield significant quantities o fwater to wells or springs .
Artesian well–A well in which the water level stands above an artesian o rconfined aquifer . A flowing artesian well is a well in which the water level i sabove the land surface . See confined ground water .
Cone of depression–The conical low produced in a water table or potentiomet-ric surface by a discharging well .
Confining bed–A body of relatively impermeable material adjacent to one o rmore aquifers . In nature, the hydraulic conductivity of a confining bed ma yrange from near zero to some value distinctly lower than that of the adjacen taquifer .
Confined ground water–Water in an aquifer that is contained by a confinin gbed, and under pressure significantly greater than atmospheric .
Gaining stream–A stream whose flow is being increased by the inflow of groun dwater from springs and seeps along its course .
Head, static–The height above a standard datum at which the upper surface of acolumn of water or other liquid can be supported by the static pressure at agiven point . The term static head, which is a measure of potential, is some-times expressed simply as head .
Homogeneous–Having identical properties everywhere in space .Hydraulic conductivity –A term replacing field coefficient of permeability an d
expressed as feet per day or meters per day . The ease with which a fluid wil lpass through a porous material . This is determined by the size and shape ofthe pore spaces in the rock and their degree of interconnection . Hydraulicconductivity may also be expressed as cubic feet per day per square foot ,gallons per day per square foot, or cubic meters per day per square meter .Hydraulic conductivity is measured at the prevailing water temperature .
Losing stream–A stream that is losing water to the ground along its course .PorosityThe ratio of the volume of the voids in a rock to the total volume . The
ratio may be expressed as a decimal fraction or as a percentage . The termeffective porosity refers to the amount of interconnected pore spaces o rvoids in a rock or soil and is expressed as a percentage of the total volumeoccupied by the interconnecting pores .
Potentiometric surface–The surface that represents the static head . It may bedefined as the level to which water will rise in tightly cased wells . A wate r
32

table is a potentiometric surface .Sodium-adsorption ratio–The ratio expressing the relative activity of sodium
ions in exchange reaction with soil and is an index of the sodium or alkal ihazard to the soil . Sodium-adsorption ratio is expressed by the equatio n
Na+
/Ca ++ +Mg+ +J
2where the concentrations of the ions are expressed in milliequivalents pe rliter or equivalents per million .
Specific capacity–The rate of discharge of water from a well divided by th edrawdown of the water level, normally expressed as gallons per minute pe rfoot of drawdown .
Storage coefficient–The volume of water an aquifer releases from or takes intostorage per unit surface area of the aquifer per unit change in head . In anartesian aquifer the water derived from storage with decline in head come smainly from compression of the aquifer and to a less extent from expansio nof the water . In an unconfined, or water-table aquifer, the amount of wate rderived from the aquifer is from gravity drainage of the voids .
Transmissivity–The rate at which water, at the prevailing temperature, i stransmitted through a unit width of an aquifer under a unit hydraulic gra-dient . Transmissivity is normally expressed in units of feet squared per dayor meters squared per day, but can be expressed as the number of gallons o fwater that will move in 1 day under a hydraulic gradient of 1 foot per foo tthrough a vertical strip of aquifer 1 foot wide extending the full saturatedheight of the aquifer.
Water table–Is a surface in an unconfined aquifer at which the pressure i satmospheric . It is defined by the levels at which water stands in wells tha tpenetrate the aquifer just far enough to hold standing water .
Zone of saturation–In the saturated zone of an aquifer all voids are ideally fille dwith water . The water table is the upper limit of this zone . In nature, thesaturated zone may depart from the ideal in some repsects . A rising watertable may trap air in parts of the zone and other natural fluids may occup yvoids in the lower part of an aquifer .
SAR =
33