green growth strategy for karnataka -...
TRANSCRIPT

Green Growth Strategy for Karnataka
Case Studies

Copyright © Global Green Growth Institute, 2014
Disclaimer
The presentation of the material in this publication does not imply
the expression of any opinion whatsoever on the part of the Global
Green Growth Institute concerning the legal status of any country,
territory, city or area or of its authorities, or concerning delimitation
of its frontiers or boundaries. Moreover, the views expressed in the
publication do not necessarily represent the decision or the stated
policy of the Global Green Growth Institute.
While every effort has been made to ensure the correctness of data/
information used in this report, neither the authors nor GGGI accept
any legal liability for the accuracy or inferences drawn from the
material contained therein or for any consequences arising from the
use of this material.
The full report should be referenced as follows: Global Green
Growth Institute (2014) Green Growth Strategy for Karnataka- Case
Studies, GGGI, Seoul, Republic of Korea
Text from this report can be quoted provided the source is
acknowledged and GGGI or BCCI-K informed.
Design: Infonauts, www.infonauts.in

Green Growth Strategy for Karnataka
Case Studies
December, 2014
Consortium Partners

2
This report forms deliverables of the project initiated by the Global Green Growth Institute (GGGI) and the Bangalore Climate Change Initiative - Karnataka (BCCI-K) with its consortium partners: Center for Study of Science, Technology and Policy (CSTEP, Bengaluru), Indian Institute of Science (IISc, Bengaluru), University of Agricultural Sciences (UAS, Bengaluru), Institute for Social and Economic Change (ISEC, Bengaluru), Integrated Natural Resource Management (INRM, New Delhi) and the London School of Economics—India Observatory (LSE-IO, London).
The main authors of the case studies are Ankit Singhvi and Ajith Radhakrishnan with inputs from Jason Eis, Siddarthan Balasubramania and Prasoon Agarwal. This report also benefited greatly from inputs and suggestions by various officials from Government of Karnataka, academia, and professionals from relevant industries. Special thanks to Swati Sharma and Sahil Gulati for their editorial support and assisting authors in preparing report for publication. Above all, the project would not have been successful without the leadership provided by Professor B.K. Chandrashekar, Chairman, BCCI-K.
Acknowledgement

3
Karnataka continues to witness strong economic growth with contributions increasing from industry and the services sector. Its emergence as the IT hub of India underscores its increasing relevance in shaping India’s growth story. The confluence of aspiring middle class, rising consumption, increasing understanding of the impacts of climate change and a globalized economy require Karnataka to adopt a climate resilient growth strategy to meet its development objectives.
Against this background, the BCCI-K and GGGI led-initiative on developing a Green Growth Strategy for Karnataka is timely as it addresses the challenge of reconciling faster economic growth with environmental sustainability. The strategy is developed with an approach grounded in scientific modelling and intensive consultation with policy makers.
This report is an attempt to demonstrate the feasibility of implementing a green growth strategy in Karnataka. There are five case studies covered in this report; electric vehicles, waste heat recovery, wind energy, solar energy and micro-irrigation. All these opportunities have the potential to make significant positive impacts in meeting the development objectives of the state, including sustained economic growth, poverty reduction and job creation. The report identifies implementation barriers, policy implications, investment requirements and possible funding sources for these specific opportunities, and concluding with concrete recommendations for policy makers. It is intended to be used as a tool to frame the issues around green growth, weighing the potential opportunities for implementation of a green growth strategy in Karnataka.
Having worked in close consultation with various stakeholders as possible, we are confident that this report will be highly useful to practitioners, policy makers and other experts. Our wish is for Karnataka to be an inspiring example of how a climate-resilient, inclusive, green growth trajectory is possible, turning ambitious vision into reality.
Prof. B. K. ChandrashekarChairmanBangalore Climate Change Initiative – Karnataka (BCCI-K)
Foreword

4

5
Enabling Adoption of Electric Vehicles
Harnessing Waste Heat Recovery for Power Generation
Scaling up Grid Connected Solar
Renewing Wind Energy
Boosting Micro Irrigation Opportunities
Contents
1
2
3
4
5
7
15
21
27
35

Four fold increase in demand for urban transport in 20 years.
Increase in oil imports, Green House Gases, Particulate Matter, noise pollution and congestion.
Loss of 1.7% of state GDP due to air pollution translating to economic loss of INR 5,100 crores per year.
Electric Vehicles found to be most effective in combating air pollution with zero tailpipe emissions.
Electric Buses for use in public transport, closest in overcoming key barriers for adoption of Electric vehicles.

Enabling Adoption of Electric Vehicles
7
Enabling Adoption of Electric Vehicles1
Executive Summary
India is on track to become the third largest road transportation market by 2020, driven by strong economic growth and rapid urbanization. In the next 20 years, a steady economic growth, higher working population, and longer trips due to urban sprawl will lead to a four-fold increase in the demand for urban transport, nearly tripling the demand for passenger transport as a whole.
The growth in transportation sector has resulted in higher oil imports, higher emissions of Green House Gases (GHG) and Particulate Matter (PM
10 and PM
2.5), increased noise
pollution and congestion in urban areas. Most of the cities in India surveyed by World Health Organization (WHO) have been rated in top polluted cities in the world, especially on count of PM pollution. PM concentrations in Bengaluru are already in violation of National Ambient Air Quality Standards.
Air pollution is a significant problem in India resulting in loss of about 1.7% of GDP, as per estimates by The World Bank in 2014. While it may not be accurate to directly deduce from national loss percentage, 1.7% of state GDP would translate to a loss of economic activity of about INR 5,100 crores per year for Karnataka.
Noise pollution in urban areas has also emerged as a significant health issue. Prolonged exposure to elevated noise levels has been linked to sleeping disorders, noise induced hearing losses and increased risks of heart stroke. Estimates by UK government suggest that economic cost of noise pollution is even higher than that of air pollution. There have been multiple initiatives to reduce emissions in transportation sector ranging from fuel efficiency, introduction of alternative fuels like CNG, promotion of non-motorized transport (NMT) and electric vehicles.
Electric vehicles are found to be the most effective in combating local air pollution with zero tailpipe emissions
and lower noise pollution in buses. In Indian context, electric vehicles also help in fuel security with reduced oil and gas imports. National Electric Mobility Mission Plan (NEMMP 2020) is the most comprehensive plan undertaken by Government of India to accelerate adoption of electric vehicles in the Indian market.
There are four key barriers to adoption of electric vehicles. These barriers are related to policy, technology, enabling infrastructure and cost economics. As per our analysis, electric buses for use in public transport are closest in overcoming these barriers.
Karnataka is best positioned to take lead in introducing electric buses in their public transport system. With one of the largest intra-city public transport network, with a fleet of over 6000 buses, it can emerge as a significant market for the Original Equipment Manufacturer (OEM) in the near future. Bengaluru Municipal Transport Corporation (BMTC) has successfully piloted an electric bus for over 3 months with positive results. Going forward, adoption by state road transport corporations with a fleet of over 25,000 buses can reduce PM emissions by 25%.
The Total Cost of Ownership (TCO) approach, as proposed in NEMMP 2020 was used to arrive at subsidy requirement for adoption of electric buses. For electric buses, current viability gap is estimated at about INR 60-70 lacs per bus. This is for buses which are equivalent in service and quality to Volvo air conditioned buses being currently used by BMTC. This subsidy gap can be bridged by a combination of direct incentives, waiver of import duty and taxes and low cost interest loans. A combination of low cost loan from Clean Technology Fund and quantification of societal benefits can also bridge the subsidy gap.
Karnataka could thus focus on electrification of its state fleet of buses and government vehicles in the short term to drive adoption. Further, BMTC can expand on its initiative to bring electric buses and initiate development of enabling infrastructure.

1
8
This case study is intended for policy makers to assess the merits in aggressively transitioning to electric mobility. The passenger transport demand in Karnataka on road in 2010 is estimated to have been about 180 Billion Passenger Kilo Meters (BPKM), with urban transport accounting for about 100 BPKM. Public transport accounts for about 50% of the total urban transport demand. Bengaluru, which accommodates over 40% of the vehicles in the state, is expected to account for a significant share of urban transport demand in the state. Bengaluru has the second highest registered motor vehicles in the country after Delhi (Exhibit 1).
Transportation has emerged as the single largest source of PM pollution with diesel vehicles having the highest emission intensity. It accounts for 42% of the total PM pollution in city of Bengaluru which is one of the highest in the country. Diesel vehicles, especially buses, have the highest emission factors and contribute almost 30% to the total PM pollution.
A transformative approach combined with substantive volumes, can make India a market maker for electric mobility. This approach looks at the transport problem from both accessibility and sustainability perspectives. Energy security, air pollution and noise pollution are current and serious problems which India needs to solve for sustained growth. Bengaluru has all the key elements like California to lead innovation in the country. It is also worst impacted by PM pollution with transportation being the largest contributor.
This study segments the mobility requirements in Karnataka and recommends focusing on electrification of public transport and government vehicles in a definite time frame. This will help foster an ecosystem which will accelerate mass adoption of electric vehicles by private consumers as well. India is uniquely positioned with lower per capita vehicles, shorter commuting distances and a fair share of lighter vehicles, to adopt electric vehicles with current technology.
Air and Noise Pollution: Challenge and Solutions
India is plagued by the problem of poor air quality with serious consequences on health of its citizens. Cities are the most affected and this problem is getting accentuated by rapid urbanization taking place in India.
Exhibit 2 shows the increasing trend of PM emissions in Bengaluru. It also shows dominant role of transportation in PM
2.5 emissions in Bengaluru. PM
2.5 is found to be more
dangerous for pulmonary disorders. The other source of PM
2.5 pollution is road dust, construction dust, industries
and diesel generator sets used for power backup. Trucks and Buses contribute over 50% to the PM
10 emissions in transport.
Elevated noise emissions result in sleeping disorders and increased risk of heart attack. Diesel powered buses result in noise levels from 65 dB to 90 dB depending on the state of motion. Compared to diesel buses, electric buses have 7-10
Introduction
0
1000
2000
3000
4000
5000
6000
7000
8000 Del
hiB
eng
alur
u
Che
nnai
Hyd
erab
ad
Pune
Gr.
Mum
bai
Jaip
ur
Ahm
edab
ad
Co
imb
ato
re
Ind
ore
Lud
hian
a
Luck
now
Nag
pur
Sura
t
Kan
pur
Cha
ndig
arh
Ko
taJo
dhp
ur
Vad
od
ara
Bho
pal
Am
ritsa
r
Rajk
ot
Patn
a
Alla
hab
ad
Ranc
hiA
gra
Vish
akha
pat
nam
Jam
shed
pur
Mad
urai
Jab
alp
ur
Vara
nasi
Raip
ur
Vija
yaw
ada
Gha
ziab
ad
Tiru
chira
pal
li
Ko
lkat
a
Gw
alio
r
Ko
chi
Dha
nbad
Dur
g B
hilla
i
Nas
hik
Mee
rut
Aur
ang
abad
Srin
agar
7350
4156
3767
3387
2267
2029
1871
1682
1386
1338
1337
1315
1237
1145
1067
1058 953
868
839
829
803
760
743
738
729
704
683
682
680
605
588
579
553
525
521
496
490
480
462
445
444
420
281
201
Exhibit 1 Registered Vehicles in 2012 [CPCB (2010)]
Source: CPCB (2010)

Enabling Adoption of Electric Vehicles
9
2001 2002 2003 2004 2005 2006 2007 2008 2009 20100
50
100
150
200
250
300
YearAnn
ual a
vera
ge c
once
ntra
tion
Respirable suspended Particulate Matter levels %PM2.5 emissions Bangalore
%PM10 emissions Bangalore
Delhi
Bangalore
Chennai
Mumbai
Kolkata
Bus
Others
Cars
3 Wheelers
2 Wheelers
Trucks
Paved roadand dustDomestic
Transport
DG sets
Secondary
28.1
24
2713
21
13
2
47.6
13.6 4.46.3
dB lower noise levels at 55-60 dB. This has significant health benefits in terms of reduced stress. As per Government of UK study, a reduction from 70 to 60 dB translates to a value of about 15 GBP per household per year. (Exhibit 3)
Large buses and Omni buses have the highest emission factor of 0.56 (g/km) among all road vehicles. This is followed by trucks. This is consistent with their overall contribution in PM pollution in Bengaluru city where buses have been found to be the highest contributor to PM emissions. The dominant fuel source for these categories of vehicles is diesel.
Large buses and Omni buses account for about 25% of the PM emissions in the country. We have taken 25% as potential to reduce PM emissions in Karnataka for our analysis by completely transitioning bus fleet to electric buses. Karnataka with a state GDP of over INR 300,000 crores would imply a loss of about INR 5,100 crores in GDP.
This is based on study conducted by The World Bank which has estimated that there is a loss of about 1.7% of India’s GDP due to air pollution. There are multiple solutions with varying degree of efficacy in combating air pollution. These solutions can be categorized under three categories:
Fuel efficiency standards: Fuel efficiency standards have played a key role in incrementally reducing emissions across all vehicle categories. They are primarily driven by regulations and standards. Hybrid vehicles and alternative fuels: CNG vehicles have played a key role in reducing PM emissions in metro cities, primarily Delhi. However, given the shortage of domestic natural gas production, there are issues around fuel security and price of imported gas which need to be resolved for sustained growth in CNG vehicles. Electric vehicles: Electric vehicles present a transforma-tive approach which can leapfrog India to the position of a global leader. They have the highest impact in reducing air emissions at tailpipe and also reduce demand of oil
Noise decible dB
Valu
e pe
r hou
seho
ld p
er y
ear,
GBP
0
5
10
15
56 57 58 59 60 61 62 63 64 65 66 67 68 69 70
20
25
30
Source: Government of UK (2013)
Exhibit 3 Value of Changes in Noise Exposure
Exhibit 2 PM Emissions from Transport and Other Factors
•
•
•
Source: Hosamane et. al. (2013) and CPCB (2010)

1
10
imports. They also reduce noise emissions by 7-10 dB during operation.
Current Policy Landscape For Electric Mobility
Government of India in 2012 came forward with an ambitious NEMMP 2020 with the objective of making India a leader in electric vehicles, two wheelers and four wheeler market in the world by 2020 with sales of 6-7 million units. The plan envisaged a push towards electric vehicles contributing
towards fuel security. NEMMP focuses on: Demand creation through incentives and mandates.Domestic manufacturing by linking incentives to localization.R&D through pilot projects and test centers for performance evaluation. Provision of enabling infrastructure, primarily related to charging stations and maintenance centers.
Table 1 shows the relative ranking in ease of implementation of electric vehicles for different categories. Two wheelers, three wheelers and buses have been identified higher on ease of implementation scale. If we combine it with emission impact, buses are best positioned for transition.
•••
•
Table 1 NEMMP 2020 Assessment of Relative Ease of Implementation
Average distance travelled per day (km) Average battery charge (KWh)
Stable Operations Low Operating Costs Customer Acceptance
Average revenue collection (INR)
Electric bus
AC Volvo
March April March April March April
Average maintenance cost (INR 000/month) Average fuel cost (INR 000/month) Estimate of sound level (dBA)
162 168 252 27610,864 12,516
5
14
53
150
5570
Exhibit 4 Insights from Electric Bus Trial Conducted by BMTC
Analysis LCVs
Low
High
Moderate
Low
Moderate to High
Low to Moderate
High investmentneeded as volumesare high
Moderate to High
Low to Moderate
Moderate to High
Significantinvestmentsrequired by OEMs
Low to Moderate
Moderate
High
Moderate
Moderate
Moderate
High
Moderate
Moderate
Capabilities
Price Performance Gap
Investment
Overall
•
•
•
•
Four Wheelers Two Wheelers Buses Three Wheelers
Ease
of
impl
emen
tatio
n

Enabling Adoption of Electric Vehicles
11
As a progressive state, Karnataka has already proposed exemption of road tax and Value Added Tax (VAT) exemption for electric vehicles. It is also home to Mahindra Reva, the first electric car company in India. BMTC has recently concluded trials of an electric bus in the city. The experience has been promising with definite savings on operational and maintenance cost. Exhibit 4 shows some insights from the electric bus trial data. Energy costs were reduced by 60% and maintenance cost by over 70%. Customers appreciated quieter rides with less noise and vibrations. BMTC has submitted a proposal to the Department of Heavy Industries under NEMMP to run a larger pilot with over 30 electric buses.
Electric vehicles have evolved over decades and are increasingly being seen as mainstream alternative in transportation. Pike Research forecasts that the global market for all electric-drive buses—including hybrid, battery electric, and fuel cell buses—grow steadily over the next 6 years, with a Compound Annual Growth Rate (CAGR) of 26.4% from 2012 to 2018. China has the maximum deployment of electric buses and has fostered development of over 9 electric bus manufacturers. Latin America has also witnessed strong growth in adoption of electric buses. There are four key barriers that electric vehicles need to overcome, to go mainstream in India:
Policy and regulatory framework: A legislative mandate for Electric Vehicles (EVs) in certain categories and geographies is important to kick-start meaningful
adoption of EVs. The current policies are not adequately funded and have limited time horizon. Technology maturity and product effectiveness: EV technology is rapidly evolving in terms of performance and features. Battery technology in terms of energy density, charge capacity and operating life are most critical for EV. In India, there is limited choice for four wheelers with only 1-2 products in the market. Similarly, two wheeler riders are handicapped by questions around product effectiveness. Total Cost of ownership and financing: Electric vehicles entail a higher initial capital investment despite lower operating costs. Electric vehicles have higher average total cost of ownership compared to conventional fuel vehicles. This industry, like any other new industry, would need some government support to gain momentum. Low cost financing and leasing models, reduction of import duties and tax breaks in manufacturing need to be explored for sustained growth.Enabling infrastructure and stakeholder awareness: A mass adoption of electric vehicles would require building of charging and maintenance infrastructure. In addition, lack of awareness among key stakeholders (policymakers, vendors, customers) is a big impediment in EV adoption. BMTC’s pilot of electric bus for 3 months starting April 2014 has been very successful.
Exhibit 5 illustrates the position of different vehicle categories in overcoming barriers as explained above. Buses for public transport are best positioned to lead the transition to electric vehicles. Government can mandate the adoption of electric buses and explore deploying electric vehicles for part of its fleet of cars.
•
•
•
•
Hurdles in Electrification of Transport
Success of Electric Vehicles
TRUCKS & LORRIES
Policy and regulatory framework
Technology maturity and product effectiveness
Economic valueand financing
Enabling infrastructureand customer adoption
Technology stillevolving for long distance.
Lack of productchoice. Economicvalue propositionnot clear.
Technology available.Challenges infinancing andsustaining demand.
Technology and product availble.Cluster demand.
CARS & 4WHEELERS
TWOWHEELERS
GOVERNMENT OWNEDBUSES & CITY TRANSPORT
Exhibit 5 Position of Different Vehicle Classes in Overcoming Barriers to Mass Adoption
Barriers and Opportunities

1
12
Exhibit 6 shows the vehicle stock and performance of Karnataka transport corporations. State buses accounted for about 30% of the total diesel consumption in the state (16 million liters per year). Government can focus on its
The Total Cost of Ownership approach has been followed for this study, as indicated in the NEMMP 2020. This report expands the definition and also adds the economic cost of PM pollution, for evaluation. The five key cost components considered in the TCO analysis are:
Investment cost (Depreciation)Financing costFuel cost
own state fleet which is best positioned to overcome barriers in implementation. This will meet the twin objective of developing a favourable ecosystem for EV and reducing PM pollution.
This study presents an analysis for electric buses used in public transport. Exhibit 7 illustrates the TCO analysis carried out for electric buses and Internal Combustion Engine (ICE) buses. This analysis shows a gap of about INR 65-70 lacs per electric bus. This gap is for the fully loaded model of an electric bus which is equivalent to the current Volvo AC bus service by BMTC. This will reduce considerably for bus variants without air-conditioning. This viability gap is higher than the INR 37 lacs supported by NEMMP 2020.
Vehicle stock of buses (units)
Average vehicle mileage(Km/litre)
Annual diesel consumption(million liters per year)
BMTC
KSRTC
NEKRTC
NWKRTC
Source: KRTC (2011), NWKRTC (2012), NEKRTC (2013), CSTEP (2014), GGGI analysis
BMTC
KSRTC
NEKRTC
NWKRTC
BMTC
KSRTC
NEKRTC
TOTAL
NWKRTC
6,000
8,243
4,203
4,403
4.01 1.1
1.60
1.52
0.99
5.22
4.87
5.25
5.07 ˜30% of Karnatakadiesel consumption
Fuel Cost Maintenance
ELECTRIC BUS DIESEL VOLVO
Depreciation Finance Salvage Fuel Cost Maintenance Depreciation Finance Salvage Economic viability gap
TCO EV
*Average 170 km/day, fuel cost INR 65/liter, electricity cost INR 6.95/KWh, maintenance cost actual from trial, efficiency 1.5 Kwh/km, 2.2 km/lt for Volvo **Battery life of 9 years with 3000 charge cycles. Payback in 9 years, discount rate of 11%, residual value of 15% of capital cost for EV. 30 % of the battery cost*** Maintenance cost of Electric bus increasing by 5%, diesel bus by7% on account of escalation in spares**** Electric bus costs taken with reduced driving distance of 170 Km at INR 260 lacs, cost of Volvo taken at 88 lakhs
Source: GGGI analysis. NEMMP 2020, EBUSCO, KRTC (2011), The World Bank (2013), Ramachandra et. al. (2009)
39 4
148
100 18 273 119
11 5434
12 67
Exhibit 6 Vehicle Stock and Performance of State Transport Corporations (2012-13)
Exhibit 7 TCO Analysis of Electric Buses and ICE Buses (INR lacs)
•••
••
Total Cost of Ownership (TCO) and Financing
Maintenance costSalvage value

Enabling Adoption of Electric Vehicles
13
Electric buses in public transport have considerable social benefits. Electric buses have zero tailpipe PM emissions, maintain low noise levels, can provide valuable off-peak storage for wind energy and help reduce oil imports for the country. Exhibit 8 is a preliminary estimate of social benefits on account of an electric bus, translating to about INR 23 lacs. It is important that local dataset is developed for detailed analysis of the social benefits.
Low cost financing can significantly impact the cost economics of an electric bus. The current TCO analysis assumes 11% cost of debt for a 9 year tenure. A 1% reduction in cost of debt results in reduction of INR 7-8 lacs in TCO. One of the Climate Investment Funds (CIF) and the Clean Technology Fund (CTF) provide middle income countries with highly concessional resources to explore options to scale up the demonstration, deployment, and transfer of low carbon technologies in renewable energy, energy efficiency, and sustainable transport. The fund is already active in India and has given USD 100 million of development assistance to the Government of Himachal Pradesh. This fund can be targeted to run large scale pilots for electric vehicles by the state government. The fund provides debt at ~7% (LIBOR+ 450 bps) with tenor of 40 years. This will reduce the TCO of one electric bus by about INR 40 lacs. Combined with social benefits and economies of scale, Karnataka can expand rapidly to induct more electric buses.
Recommendations
Following are the recommendations made, based on the case study:
BMTC could build on the success of the trial of electric bus. It has already sent a proposal for a 30 bus pilot to Department of Heavy Industries. We believe that a bigger pilot could be planned with state government support and low cost financing from CTF. This will attract competition and initiate the process of indigenization in manufacturing.State government could propose a long term implementation plan (5-10 years) and provide additional funding support to BMTC for early adoption of electric bus.State government should induct electric vehicles as government vehicles to increase awareness, expand product range and demonstrate commitment. Transport department has already started an initiative where 100 electric cars are being procured for official duties for a trial period.The air emissions should be actively monitored in urban areas starting with Bengaluru city, specifically for PM
10
and PM2.5
. Noise levels could also be measured on bus routes to build emission and noise data map. This can help prioritize routes for introduction of electric buses. This will also raise awareness and attractiveness of electric vehicles in the society.
Air Pollution* Noise Pollution** Off peak night storage*** Energy security**** Total secondary benfits
*Outdoor air pollution. 1.7% GDP. 29% contribution by transport diesel bus account for about 30% of diesel consumption**Value of noise level reduction of 7-10 dB, 10-15 GBP per household, 5 hour exposure, 2 hour in bus, 420 people per bus***5 months during high wind season. 80% of 250 KWh of battery available for storage, avoided coal generation at INR 3/KWh ****USD to INR forward at 5% per year. Interest saving on 80% of oil consumption
Source: GGGI analysis, NEMMP 2020, EBUSCO, KRTC (2011), The World Bank (2013), Ramachandra et. al. (2009)
6.5
8.04.4
3.8 22.7
Diesel vehicles have higher PM emission intensity
Higher PM10 and PM2.5 emissions result in increased incidence of pulmonary disorders
Electric buses are charged after 10 pm in off peak time
They provide valuable storage for the grid operator
Noise pollution results in sleeping disorders, high stress levels, low productivity
High noise levels increase likelihood of heart attacks
India imports 80% of its oil demand resulting in increased USD demand
India’s growing reliance on import can have security implications
Preliminary and indicative estimate of secondary benefits of an Electric Bus (INR lacs)
Exhibit 8 Social Benefits of Electric Bus
•
•
•
•

14
Industries have over 50% share of the total energy consumption and GHG emissions.
Cement and Iron and Steel plants alone account for over 70% of the total energy emissions.
Waste Heat Recovery in Karnataka offers the potential to deploy 500MW of generation capacity by 2030.
WHR would provide quality power all day, allowing the grid operator to manage it as base load power.
WHR power is competitively priced at INR 3.7-4 /kWh, marginally higher than the APPC price for Karnataka.
70%

15
Harnessing Waste Heat Recovery for Power Generation
Harnessing Waste Heat Recovery forPower Generation2
Karnataka is the fifth most industrialized state in India and among the top producers of cement (~15Mt) and iron and steel (~10 Mt). Industries are dominant energy consumers with over 50% share of the total energy consumption and Green House Gas (GHG) emissions in the state of Karnataka. Industry will continue to be the dominant consumer of energy in 2030, with share in excess of 50%. Within the organized industry sector, Cement and Iron and Steel plants alone account for over 70% of the total energy related emissions. Cement is a distant second and has 10% share. Currently Karnataka is one of the few states that does not allow captive consumers to offset their Renewable Power Obligations (RPOs) from (WHR) generation. This has resulted in very low adoption of WHR solutions in the industry. WHR in Karnataka offers the potential to deploy about 500 MW of generation capacity by 2030 in Iron and Steel and Cement industries. It would entail an investment of about INR 3,500 crores but an added generation of electricity of about 3.5 million kWh/year (equivalent to 2,000 MW of wind generation capacity). Additionally, this provides firm quality power all day, which allows the grid operator to manage them as base load power.
WHR technology is characterized by high capital investment with marginal subsidy support on tariff when compared to current Average Pooled Power Cost (APPC). At present, Iron and Steel energy consumption is primarily on account of Jindal South West (JSW) plant which has WHR system. In case of cement, currently only 1 out of 9 plants in Karnataka (>1 Mt of capacity) has installed WHR technology. With no fuel cost, WHR power is competitive at prices of INR 3.7-4 /kWh, which is marginally higher than the APPC price for Karnataka, INR 3.07/KWh. However, it is likely that with higher coal costs, WHR power would
become cost competitive with APPC thus obviating the need for government support.
The current policies on WHR are focused on capital subsidy through accelerated depreciation (provided by central government) and ability to offset RPOs through WHR power generation. Karnataka however, does not recognize WHR generation towards RPOs. Also, the policy does not specify criteria which addresses the concerns of Cement and Iron and Steel sectors.
The three big challenges for adoption of WHR technology are high upfront capital investment, difficulty in sale of the surplus power and the lack of penetration of WHR technology in the industry. Since only two industries account for majority of the capacity potential, the targeting is relatively easy for the government to explore generation based incentive for procuring WHR power.
The incentive requirement can be reduced significantly, if low cost financing can be arranged for sourcing of technologies. Given that there are currently about 8 cement plants over 1MTPA (Million Tons per Annum) which can deploy WHR system, a charter of action can be drafted with all stakeholders to implement WHR systems in a specified time period.
State Government could implement a preferential tariff to buy electricity generated from WHR system. Clean Technology Fund (CTF) administered by World Bank may be good source to pursue, to raise concessional finance for investing in WHR system.
Executive Summary

16
2
Due to sustained industrialization, energy demand in industries in Karnataka is projected to grow by three times, reaching 32 Million Tons of Oil Equivalent (Mtoe) by 2030, with thermal energy demand growing faster than electricity demand. Over 90% of this thermal demand will be met by industrial grade coal, much of which will have to be imported. Cement and Iron and Steel industries will account for over 80% of the industrial energy demand by 2030.
As the industrial sector continues efforts to improve its energy efficiency, recovering waste heat losses provides an attractive opportunity for an emission free and less costly energy source. Using best available technologies, specific energy consumption in various industries can be reduced by 15-30%. This case study focuses on Cement and Iron and Steel industries which account for majority of the energy consumption in the industrial sector in the state. Currently the adoption of WHR technologies for power generation is very low in Karnataka, especially in the
Cement industry. JSW steel plant dominates the Iron and Steel industry landscape and has deployed state-of-the-art WHR technology to generate clean power and water.
Emissions from industrial sector are going to double every decade (Exhibit 1). Exhibit 2 lays out growth path for energy demand for key industries. It is worth noting that energy and emissions show a direct correlation primarily due to heavy reliance on fossil fuels (coal) for energy demand. Cement and Iron and Steel continue to have dominant contribution in the overall industrial emissions and energy requirement. This calls for specific policy actions for these two industries.
An analysis of growth in Iron and Steel and Cement industry show WHR potential of 500 MW by 2030 (Exhibit 3). This is based on current technology and has scope to increase as technology improves.
Introduction
Growth and Potential of WHR Energy for Electricity Generation
Emission in the BAU Scenario for Karnataka (all figures in MtCO2e)
AgriculturePower
IndustryTransport
2010 2020 2030
+7%
799
1413
43
304
159
47
80
18
15012
81
24
33
Source: CSTEP (2014)
Exhibit 1 Emission Growth from Key Sectors in Karnataka

17
Harnessing Waste Heat Recovery for Power Generation
Waste heat recovery projects as per Central Electricity Regulatory Commission (CERC) and Renewable Energy Certificate (REC) regulations are not considered renewable, and therefore are not eligible to get RECs. The classification
of any energy source as renewable, has to be determined by MNRE for the project to be eligible for REC, which is a national level framework. However, at state level, classifying an energy source as renewable energy source is determined by a state electricity regulator. The definition of Renewable Energy power in the state RPO regulations, differs in some instances from that of CERC and Ministry of New and Renewable Energy (MNRE).
Policy and Regulatory Landscape for Waste Heat Recovery
8.512.9
43.44
132
56039.9
Production in Cement Industry in Karnataka(all units in Million tons)
Production in I&S Industry in Karnataka(all units in Million tons)
WHR based power generation potential (all units in MW)
20302010 20302010 20302010
8% 6.2% 9%
Source: CSTEP (2014), GGGI analysis
Cement
Iron & Steel
Refinery
Fertilizers
Pulp & Paper
Aluminium
Textiles
Energy Demand in Industries (PJ)
0
200
400
600
800
1000
1200
1400
1600
2010 2015 2020 2025 2030
Source: CSTEP (2014), GGGI analysis
Exhibit 3 Waste Heat Recovery Electricity Potential in Karnataka
Exhibit 2 Energy Demand from Key Industries in Karnataka

18
2
Barriers to Growth
There are capital subsidies in the form of accelerated depreciation, available on WHR equipment. These are at par with depreciation benefits available for energy efficiency initiatives which are available to an industry.
Karnataka currently does not treat WHR from industries like Cement and Iron and Steel as renewable energy. The state also does not allow captive plant owners to use waste heat energy to meet their RPOs. Hence there is no added incentive for the industry to adopt WHR solutions.
The three big challenges for adoption of WHR technology are:
High upfront capital investment: WHR requires higher upfront capital investment when compared to capital cost related to setting up of conventional coal fired power plants. This is difficult for most of the companies that have limited capacity to deploy capital on initiatives outside of their core business activity. Additionally, high borrowing costs result in higher levelized costs of power. Tables 1 and 2 outline the financial parameters for WHR based solutions for Cement and Iron and Steel industries. The cost of power is marginally higher than the current APPC in the state.
•
Parameters
Capital Cost
O&M cost
IRR
LCOE
Units
Million INR/MW
% of Capex
%
INR/kWh
Value
75 - 100
2.5
17 - 19
3.5 - 3.8
•
•
•
•
Parameters
Capital Cost
O&M cost
IRR
LCOE
Units
Million INR/MW
% of Capex
%
INR/kWh
Value
44 - 65
2.5
17 - 21
3.2 - 4.0
•
•
•
•
Table 1 Cost Economics of Waste Heat Based Power Generation in Cement Clinkerization Units
Table 2 Cost Economics of Waste Gas (BFG) Based Power Generation in Iron and Steel Units
Sale of surplus WHR power: WHR power is marginally higher than APPC in the state. This is also higher than the current cost of coal power from old captive power plants of the industries. This prevents companies to invest in WHR system and finance it with no firm commitments for sale of power.Lack of best practice sharing in Industry: WHR adoption is still in nascent stage in the country. Most of the technology deployed in the industry has been imported and adapted to local conditions. These adaptation measures have resulted in higher energy recovery, better operating efficiencies and thus, significantly improving the cost economics.
•
•

19
Harnessing Waste Heat Recovery for Power Generation
WHR has significant potential in terms of additional electricity generation in the state of Karnataka. But to realise it, there is a need for specific policy interventions. Following are some of the conclusions from our analysis:
There is a strong merit in the government giving priority focus in developing WHR projects in the Cement sector, in the immediate term. There are 8 cement plants with capacity more than 1MTPA which are suitable for WHR solutions. Karnataka could explore mechanisms to support WHR energy projects. One option is to allow captive WHR projects to qualify towards RPOs. The second option is to have generation based incentive for WHR projects. This would push companies to prioritize investment into WHR plants.A robust ecosystem for WHR adoption could be built through active collaboration between companies, vendors and technical institutes. It is important that there is an institutionalized mechanism to share knowledge among companies operating in the same industry. Government could play an important role by bringing companies and research institutes together on common forum with an objective of disseminating knowledge.CTF administered by The World Bank may be a good fund to pursue, to help source low cost financing for cement plant owners to invest in WHR technology. As one of the Climate Investment Funds (CIF), CTF provides middle income countries with highly concessional resources to explore options to scale up the demonstration, deployment, and transfer of low carbon technologies in renewable energy, energy efficiency, and sustainable transport. The fund is already active in India and has given USD 100 million development assistance to Government of Himachal Pradesh.
•
•
•
•
•
Recommendations

20
2
Abundant solar resource is available in Karnata-ka, with 300 sunny days and low cosine losses due to proximity to equator.
Comprehensive solar policy exists at both central and state level to drive the adoption of Solar power.
The commercial load is expected to form over 50% of overall building demand. Solar power generation provides a good overlap with meeting this commercial sector demand.
A major thrust on large solar parks in the state, can be provisioned under the National Solar Mission.

21
Harnessing Waste Heat Recovery for Power Generation
Scaling up Grid Connected Solar3
Karnataka is blessed with abundant solar resource in the state, with 300 sunny days in a year and lower cosine losses due to its proximity to the equator. It is also one of the leading states in terms of adoption of solar water heating systems in the country and has a thriving manufacturing base across the value chain. Together with wind energy and hydro power, there is potential to substantially take the renewable energy share to more than 30% in the state. The recently launched Solar Policy 2014-2021 is a significant step in this direction. The policy is comprehensive and has ambitious targets. However, its success will depend largely on its implementation, requiring interdepartmental coordination.
Solar Policy 2014-2021 has set specific targets such as 400 MW of rooftop solar by 2017-18 with an annual capacity addition of 100 MW. The policy also proposes 1,600 MW of grid connected, utility scale solar power till 2021 with an annual target of 200-250 MW. These targets on grid connected solar power are the most substantive solar capacity targets in the policy. They are also aligned with energy demand characteristics of the state, central government policies under JNNSM (Jawaharlal Nehru National Solar Mission) and availability of developers.
The capacity targets in Solar Policy 2014-2021 are ambitious. This can be gauged from the fact that rooftop capacity addition in all of India is less than 100 MW per year. A conservative estimate shows that 30 million sq ft of building rooftop space is required every year for setting up 100 MW capacity of solar. The current solar policy is well structured and its specific aspect of relaxation of Floor Area Ratio (FAR) for setting up of solar rooftop is a game changer. Our assessment, based on interviews with solar developers and analysis of central policy suggests that Government of Karnataka (GoK) can help debottleneck site availability for setting up grid connected rooftop projects. Currently rooftop projects are fragmented and have small capacities which discourage large developers, who would
be instrumental in bringing capital for meeting annual policy targets.
For utility scale projects, Karnataka will have to attract projects through Jawaharlal Nehru National Solar Mission (JNNSM) mechanism to limit the subsidy support. JNNSM projects can avoid state subsidy support by about INR 48 crores/year on 100 MW of projects built under JNNSM as compared to that under state policy. Some of the savings can be used to help consolidate land parcels and lease it to prospective developers. Karnataka has traditionally not been the preferred destination for JNNSM projects as compared to Rajasthan and Madhya Pradesh due to limited availability of land parcels and land connectivity.
There are three specific initiatives which can be explored to accelerate capacity addition in the state. In the case of building-rooftop projects, GoK can help build a portfolio of rooftops for bidding by solar developers. For utility scale projects, solar parks with large contiguous lands and transmission connectivity can be offered to prospective developers to bid for solar capacity under JNNSM. Lastly, wind and solar projects can be co-located to help offset transmission costs and also result in better land utilization. This last initiative is already being pursued by Karnataka Renewable Energy Development Ltd. (KREDL).
A capacity addition of 2,000 MW would entail a direct investment of about INR 15,000 crores. This investment could be supported by generation based incentive of about INR 1,000-1,400 crores/year by the state. Solar energy deployment in socio-economically vulnerable districts can help generate additional economic activity in these districts thus helping to fulfil state economic goals. The socio economic vulnerability index developed by Institute for Social and Economic Change (ISEC) as part of this project shows high correlation between vulnerable districts and solar resource potential.
Executive Summary

22
3
Karnataka is rich in solar resources with 240-300 sunny days in a year. It was also the first southern state to notify its solar policy in 2011 and commissioned the first grid connected Solar Photo Voltaic (SPV) project in the country. It is estimated that commercial load will form over 50% of the overall building demand. Solar power generation has a good overlap with commercial sector demand with peak power generation during the day. Rooftop solar can help meet the peak demand for these buildings, thus providing valuable support to grid operators to manage base load power.
JNNSM has emerged as the key driver for growth of solar power in the country. It has set a target of adding 34,000 MW of grid connected solar power in the country by 2022, which is about 3% of the overall electricity consumption of India. The current national capacity deployment is about 2,500 MW. JNNSM provides an attractive opportunity for states to build solar power capacities as they tread further on the development path.
The current state Solar Policy 2014-2021 is comprehensive and lays out a roadmap for both on-grid and off-grid solar opportunities. It envisages solar contribution in overall electricity consumption to increase from 1.5% to 3% by 2021. This would require significant capacity additions in rooftop solar (400 MW by 2018) and utility-scale solar projects (1,600 MW by 2021).
There are broadly two sets of policies for development of solar power projects. The first policy is at the central level, defined under JNNSM. The second policy is the state specific solar policy. Some of the key parameters of these policies are:
Generation based incentive: All grid connected solar power projects, have long term power purchase agreements.Competitive reverse tariff bidding: Unlike wind, solar projects are awarded based on competitive bidding.Concessional duties on solar equipment: Concessional custom and import duties are applicable on solar equipment. However, there is ongoing debate on levy of dumping duty on solar modules which is resulting in some market uncertainty.
Accelerated depreciation benefits: All solar projects qualify for accelerated deprecation benefits.Must run dispatch order: Solar power has been classified as firm power and has been accorded Must Run status in dispatch schedules.
The Karnataka State Policy 2014-2021 is comprehensive in identifying markets for solar power adoption. Some of the unique features of this policy are:
Promotion of Distributed Generation: Specific capacity of utility scale projects, to promote distributed generation, has been allocated. It is especially designed for farmers who would be interested to convert some of their land holdings to set up solar power plants.Bundled Power Option: Following the lines of JNNSM, the policy allows for developers to set up solar projects and sell power under bundled scheme. This is promising for developers who can tie-up capacity within the state. It is unlikely that developers will source power from outside the state given the lack of transmission capacity under open access. Specific Policy Features for Rooftop Solar Projects:
The Net metering guidelines allow for surplus energy to be fed back into the grid and paid for at Karnataka Electricity Regulatory Commission (KERC), which is INR 9.05/kWh. This is a significant incentive for roof owners to add capacity. There is a cap on the capacity depending on the connected load. Also, the billing period for calculating surplus energy needs to be defined. Provision for amendment of bye laws with respect to FAR: Additional area can be created under SPV panels with light roofing. This is a game changer and should encourage solar adoption.
Solar Park Development: The policy is explicit in government’s focus to develop solar parks on lease basis to utilize uneven waste land. It contemplates providing a financial assistance of INR 1 crore for solar parks greater than 100 acres in backward areas, as identified by Nanjundappa committee. It also allows private developers to set up solar parks in the state, as a plug and play model.
At central government level, JNNSM is the flagship solar policy by Government of India. This mission is one of the eight missions under National Action Plan for Climate Change (NAPCC) and one of the most successful missions in terms of its performance against targets. The mission under the aegis of Ministry of New and Renewable Energy (MNRE) has adopted a three-phase approach,
Introduction
Policy Landscape
•
•
•
•
•
•
•
•
•
•
•

23
Harnessing Waste Heat Recovery for Power Generation
Scaling up Grid Connected Solar
spanning the remaining period of the 11th Plan and first year of the 12th Plan (up to 2012-13) as Phase I, the remaining 4 years of the 12th Plan (2013–17) as Phase II and the 13th Plan (2017–22) as Phase III. The mission is now in Phase II and intends to add about 750-1,000 MW/year through a bundled power sale arrangement. This scheme is beneficial for states as their subsidy outgo reduces considerably under this scheme.
As shown in Exhibit 1, Karnataka has attracted only 10 MW of the 750 MW capacity auctioned in the last round of JNNSM Projects. The state policy also saw low conversion from auctioned capacity to commissioned projects. Out of 233 MW auctioned in two phases, only 27 MW has been commissioned so far.
The key issue faced by utility scale solar projects, is land and transmission connectivity. The Karnataka Solar Policy 2014-2021 recommends supporting JNNSM projects in the state. However, there needs to be a concerted effort to attract more solar power projects under JNNSM, given the overall power shortage in Southern India. Variability in generation is also a deterrent for grid operators to provide transmission connectivity.
Karnataka solar policy envisages significant capacity additions in rooftop solar with annual capacity targets of 100 MW. A conservative estimate suggests that 100 MW of
•
•
•
•
Implementation Barriers
rooftop solar would require about 30 million sq ft of rooftop space. To put this in context, the current commercial floor space area in Bangaluru is 100 million sq ft. This study highlights some of the issues faced in rooftop solar projects across India and how Karnataka can take proactive actions.
It has emerged that rooftop solar is fragmented, complex and will require push beyond policy, to gain meaningful traction in capacity deployment. Based on conversations with developers, some of the key challenges for onsite rooftop solar deployment are:
Creditworthiness: Ensuring creditworthiness of customers who want to consume solar power on long-term basis, is critical for banks to lend for these projects. Scale: Rooftop solar projects are small and hence, not meaningful in the overall energy mix of a commercial building. A typical contribution of rooftop solar energy system would be less than 10% of the overall electricity consumption. This results in lower interest levels for large consumers of energy who are primarily concerned with reliability of power supply.Opportunity cost: Rooftop space is expensive and hence a 15 year lock in is difficult for deployment of solar systems. Karnataka solar policy provisions amending byelaws related to FAR, which should help address some of these issues. Ownership: Most of the large commercial buildings in Bangaluru are owned by developers having IT companies as tenants. This creates a situation where energy consumers are not decision makers with respect to installation of solar systems on the rooftops.
Orissa 20
Madhya Pradesh 250
Rajasthan 350
Tamil Nadu 10
Maharashtra 35
Karnataka 10
Andhra Pradesh 10
Gujarat 40
Other 25
Source: MNRE
Exhibit 1 Distribution of Solar Projects in MWs under Batch II of JNNSM Phase II

24
3
Currently, the state policy targets to add 1,600 MW of ground mounted solar power projects till 2021. There are two routes for adding this capacity. The first is to develop projects under the state program and the second is under JNNSM. A comparison between state SPV tariffs and JNNSM VGF (Viability Gap Funding) shows savings of INR 2.95/kWh (Exhibit 2). With an estimated annual generation of 1,650 MWh/year, this will translate to annual savings of about INR 48 crores/year in subsidy support. These savings in subsidy can be used for developing more solar parks and
rooftop projects. A 100 MW solar capacity would require about 550-650 acres of land. Savings in subsidy translate to about INR 8 lacs/acre equivalent of land value.
The key issue facing large scale utility solar projects is land and transmission connectivity. This can be addressed by building dedicated solar parks for projects under JNNSM or co-locating solar plants with wind farms after extensive technical due diligence. The latter has advantage of higher utilization of transmission capacity and ready availability of land. Both will translate to lower subsidy outgo for the state. However, a detailed technical assessment is needed to identify specific sites.
Optimization of Government Spending
Solar PV Rooftop Solar PV Rooftop Solarwith capital subsidy
JNNSM ground Solar PV
Solar Thermal
8.4
10.92
9.56
7.2
5.45
0
2
4
6
8
10
12
Source: KERC (2013)
Exhibit 2 Tariff (INR/KWh) of Solar Power Projects as Determined by KERC and Bid Projects

25
Harnessing Waste Heat Recovery for Power Generation
Scaling up Grid Connected Solar
GoK should build on its excellent solar policy to emerge as the leading solar energy generating state. It should pursue its targets in rooftop solar and ground mounted solar plants. There are some specific initiatives which we believe can help enhance the implementation of the solar policy.
Build portfolio of rooftops and auction it to private developers. KREDL should take the initiative, to identify cluster of rooftops with each cluster being at least MW scale. This would require detailed assessment of rooftop availability, distributional transformer loads and willingness of the building owners. As a starting point, rooftop spaces on government buildings can be aggregated and subsequently auctioned by KREDL for installation of solar systems. Identify sites for solar parks to be identified as per the state policy. KREDL can aggregate the sites, design the solar park, build transmission connectivity and then lease it to the developers. Asian Development Bank (ADB) Clean Energy Financing Partnership Facility (CEFPF) can be accessed for development of solar farms. These solar farms can then be made available to developers for setting up capacity under JNNSM. Set up technology demonstration projects, as provisioned in JNNSM. Solar thermal storage is one such technology which can help provide solar energy during peak demand (after sunset) and also improve the overall grid stability by providing firm quality power. Solar Energy Corporation of India (SECI) has been entrusted by MNRE, to set up technology demonstration projects. The state can provide site infrastructure in terms of land and transmission connectivity. This will help minimize subsidy support and also allow solar power to meet peak loads in the evening.
•
•
•
•
Recommendations

26
3
Wind Energy is an effective and affordable way to meet the state’s target of 20% renewable energy share in electricity demand by 2030.
Karnataka has high potential for wind energy, estimated at 100,000 MW out of which 2,200 MW is already installed.
The districts of Chikballpur ,Chamrajnagar and Chitradurga can be specifically explored for wind farm development given their high wind potential, proximity to Bengaluru and high socio-economic vulnerability.
Coupled with hydro power, variability in wind power supply can be effectively managed.

27
Harnessing Waste Heat Recovery for Power GenerationRenewing Wind Energy
RenewingWind Energy4
Wind energy is an effective and affordable way for Karnataka to meet 18% (share) target of its electricity demand by renewable energy by 2030. This would translate to a total capacity deployment of about 11,000 MW in the state. Wind energy generation offers significant co-benefits in terms of clean power, local job creation and reduced import dependence on coal.
Karnataka has the third largest installed base of wind capacity in the country. The current deployment is about 2200 MW for a state where the potential has been estimated to be over 100,000 MW (CSTEP, 2013). The capacity addition in Karnataka has plateaued to about 200 MW per year. However, Karnataka has had the slowest uptake in wind capacity, both in terms of year-on-year percentage and megawatts capacity, among the 4 states having significant on shore wind potential – others being Tamil Nadu, Maharashtra and Rajasthan. Moreover, most of the large wind farms proposed in the state are yet to take off and bulk of the capacity commissioned in state is fragmented, with 90% of the projects, of having less than 20 MW capacity.
It is estimated that over 9,000 MW of wind power capacity could be added by 2030. This includes 2,500 MW of additional capacity, beyond the current plan. At today’s technology costs, this entails an average investment of about INR 54,000 crores translating into an annualized investment outflow of INR 3,600 crores and capacity addition of 600 MW.
Some of the critical issues faced in the development of wind energy are limited land availability, lack of transmission capacity for wind energy and seasonal variability in wind generation. Government needs to resolve these issues to accelerate wind capacity addition, from 200 MW per year to about 600 MW per year.
There are two established mechanisms to support development of wind energy. The first mechanism is generation based incentive which has a longer track record and better support from financial institutions, due to certainty of revenues. It is completely dependent on the subsidy given by the state. The second mechanism is the Renewable Energy Certificate (REC) which is a market based mechanism. Government saves INR 1.13/kWh of generation based incentive for projects which are setup under REC mechanism. The success of attracting projects under REC mechanism is dependent on relative attractiveness of the state of Karnataka vis-à-vis other wind endowed states, primarily in terms of site availability and connectivity.
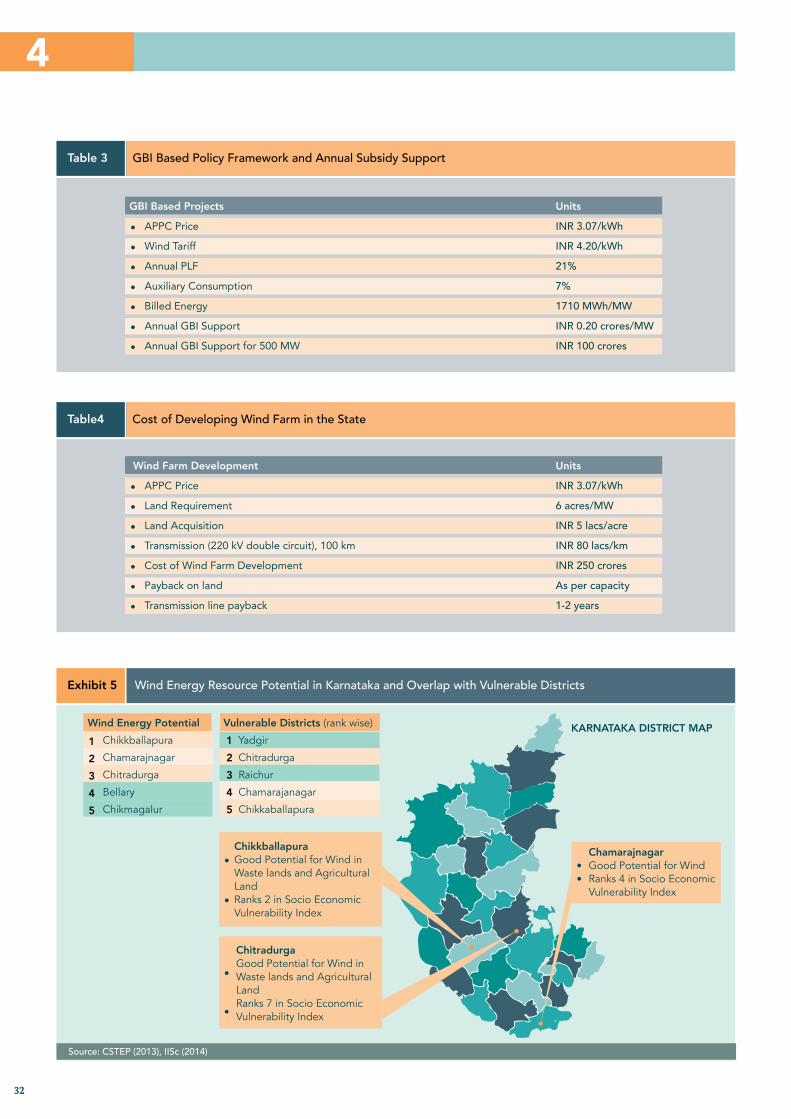
The districts of Chikballpur, Chamrajnagar and Chitradurga could be explored for wind farm development, for multiple reasons. First, these districts have high wind potential. Second, they are close to Bangaluru, which is the largest load center in the state, and third, they are relatively poor and more socio-economically vulnerable to climate change and hence in need of development opportunities. Karnataka Renewable Energy Development Limited (KREDL), has recently de-allocated about 2,500 MW of wind capacity of some developers on account of lack of progress. Consequently, some wind sites will free up allowing for immediate implementation on development of wind farms.
For this project, the Asian Development Bank (ADB) Clean Energy Financing Partnership Facility (CEFPF) is recommended for sourcing funds, to develop wind farm infrastructure. These funds would be either in the form of a grant, or low cost financing with potential investment of USD 3-5 million for building infrastructure for a 400-500 MW wind farm. These farms can then be marketed to prospective developers to invest in wind generation capacity. At the domestic level, the National Clean Energy Fund (NCEF) is a Government of India fund which can be explored for development of wind forecasting tools and grid integration pilots to consume higher share of renewable energy. NCEF allows for up to 40% Viability Gap Funding (VGF) and has a corpus of INR 15,000 crores.
Executive Summary

28
4
Wind Energy is the fastest growing renewable energy sector in the country with a cumulative installed capacity of over 22,000 MW. Historically wind energy has exceeded targets set under 5 year plans (10th and 11th plan). However since 2012 wind energy capacity additions have reduced significantly across India due to lapse of accelerated depreciation benefits and lack of enforcement of Renewable Power Obligations (RPO).
Wind power is a mature and scalable technology where India holds domestic advantage. It has a mature ecosystem of developers and manufacturers resulting in higher job creation potential.
This case study is intended for policy makers to assess the effectiveness of current policies in promoting wind energy deployment in the state. It also explores some of the key issues which are plaguing the wind sector in the state and how policy makers can help resolve these issues to debottleneck capacity addition.
Wind energy has grown in India with a Compound Annual Growth Rate (CAGR) of 45%. It has exceeded targets set
for it under both the 10th and 11th 5-year plans. Ministry of New and Renewable Energy (MNRE) has set a target of 15,000 MW in the 12th plan with an aggressive scenario of this target being raised to 25,000 MW. However, wind capacity additions have dropped significantly in last 2 years, primarily on account of lapse of Generation Based Incentive mechanism and failure of REC market mechanism due to lack of enforcement of RPO.
Exhibit 1 charts out the evolution of the wind sector in India and Karnataka since 2000. Wind energy sector has seen spurts of growth with different policy mechanisms and the development of a Clean Development Mechanism (CDM) market. While India as a whole witnessed varying growth trends in the wind sector, Karnataka had a consistent growth of wind capacity. However capacity addition has plateaued to about 200 MW per year since 2009. Over 9,000 MW of wind power capacity could be added by 2030. This translates to an annual capacity addition of 600 MW, but given the historical trend, focussed policy intervention would be needed in order to meet these targets.
Table 1 shows wind energy capacity addition in wind resource rich states. Tamil Nadu, with best wind resource potential continues to deploy more capacity than other states. Even though overall capacity additions have risen in
Introduction
2000
220 25 37 51 83 146 260 454 651 894 1106 1368 1536 174014561702
21253000
6270
7845
965510926
13065
16084
RPO and RECSchemes
19065
2002 2004 2012
CAGR of Wind Energy 32% for these years
Generation basedincentive – 0.50
INR /kWh
CER Price>20 EuroCAGR of Wind ~21%in these 3 years
CER Price ~10 EuroCAGR of Wind ~29% in these 3 years
Provision of Accelerated Dep.
Start of CDM Mechanism in India
CER Prices going downNew Market Mechanism Introduced
Installed capacity of Wind (in MW)CAGR for Wind Energy ~48% for last 12 years
2006 2008 2010
All IndiaKarnataka
Source: KREDL
Exhibit 1 Growth of Wind Energy Capacity in India and Karnataka
Growth and Potential of Wind Energy

29
Harnessing Waste Heat Recovery for Power GenerationRenewing Wind Energy
all other states, they have been relatively flat in Karnataka, which has now fallen behind Rajasthan in terms of cumulative capacity commissioned in the state. Some of the reasons cited by developers are transmission connectivity, lack of open access for captive consumers and lower tariffs. Rajasthan, which has clocked the highest growth rate in terms of wind capacity addition has invested significantly in transmission connectivity, allows open access for
evacuation of renewable power and has tiered wind energy tariffs depending on wind zones.
Technology and innovation have significantly increased the wind energy potential, and for Karnataka the wind capacity potential is estimated to be about 35,000 MW at 80 m hub height and 100,000 MW at 100 m hub height (CSTEP, 2013).Table 2 estimates the potential of wind energy addition at different hub heights.
Table 1 Wind Energy Capacity Addition in High Wind Energy Potential States
Table 2 Wind Energy Potential Estimate by CSTEP (2013)
Policy and Regulatory Landscape for Wind Energy
Wind energy policies have evolved as the sector has matured. There are different levels of incentives at both central and the state level across different stages of wind energy development. The most critical aspects of these policies are:
Generation based incentive (GBI): GBI is the most effective policy tool which incentivises production of wind energy. There is a central incentive of INR 0.50/kWh for all wind projects. In addition, all states have prescribed wind energy tariffs. Karnataka has set wind tariffs at INR 4.20/kWh. Renewable Portfolio Obligations (RPOs): Most of the states in India have RPOs. Karnataka has set 7-10% target
•
•
Capacity (MW) and corresponding CUF in Karnataka
Hub Height
80
100
Wasteland
5,000
13,000
Scrub Forests
5,000
9,000
Agricultural Land
35,000
100,000
CUF
25%
30%
•
•
State
Tamil Nadu
Karnataka
Maharashtra
Rajasthan
March-9
4304.5
431.1
11.1%
1327.4
316.0
31.2%
1938.9
183.0
10.4%
738.4
199.6
37.0%
March-8
4304.5
431.1
11.1%
1327.4
316.0
31.2%
1938.9
183.0
10.4%
738.4
199.6
37.0%
•
•
•
•
March-12
6,987.6
1083.2
18.3%
1933.5
203.5
11.8%
2733.3
422.5
18.3%
2070.7
545.9
35.8%
March-10
4907
602.5
14.0%
1473
145.6
11.0%
2078
139.1
7.2%
1088
349.6
47.3%
March-11
5904.4
997.4
20.3%
1730
257.0
17.4%
2310.8
232.8
11.2%
1524.8
436.8
40.1%
Lowest capacity addition as com-pared to otherstates.
Source: KREDL, InWEA, MNRE

30
4
for all non-solar renewable power generation.Capital subsidy: Capital subsidy in form of Accelerated Depreciation has been key driver in kick-starting wind sector in India. The policy focus has moved from capital subsidy to generation based incentives. There are capital subsidies available on import of equipment.Transmission connectivity: Transmission connectivity has to be provided by relevant state agencies.
Karnataka Renewable Energy Policy 2009-2014 is the flagship policy document for promotion of wind energy in the state, along with other renewable energy sources. This policy has set a target of wind energy capacity addition of about 600 MW per year. It has also classified renewable energy as “industry” thus allowing for allocation of government land for long term lease. The policy has also defined dispute resolution mechanisms and Green Energy cess to strengthen the transmission network.
There are two levels of barriers to growth of wind sector in India. The first level of barriers are related to quantum of central government GBI and performance of REC markets which impact the overall growth of wind sector in India. The second level of barriers are specific to a state and impact the overall performance of wind energy capacity addition in the state.
In case of Karnataka, there are three barriers impacting the wind energy capacity addition at the state level. These are:
Land availability and conversion: The process of identification of suitable land involves securing capacity allocation, installing wind masts for site identification and acquiring land, 2 years hence. Allocation of over 12,000 MW of capacity, has resulted in a lot of potential sites in the state being reserved by companies with no investment to develop a project. Most of these sites are good wind resource sites with at least 2 years of wind measurement data. This has led to scattered development of wind projects in the state. Exhibit 2 demonstrates that majority of the projects commissioned in Karnataka are less than 20 MW, indicating that the desirable trend of setting up large wind farms is largely missing in Karnataka KREDL. Transmission constraints: Lack of transmission capacity is a big hindrance in linking wind farms to the grid. Transmission capacity for wind is a combination of grid
infrastructure and variability in wind generation. The current policy requires a transmission company to bear the cost of providing grid connectivity to wind plants. Since these plants are located in remote areas and have a Plant Load Factor (PLF) of about 20-23%, transmission companies are reluctant to commit their limited financial resources for this activity. As a result, Karnataka Power Transmission Corporation Limited (KPTCL) as the transmission company, has challenges in providing grid connectivity and managing more wind capacity in the state. Bangalore Electricity Supply Company Limited (BESCOM) and surrounding districts account for over 48% of the overall electricity demand in Karnataka and are the biggest consumers of wind energy. They, along with KPTCL, are important stakeholders in success of wind plant deployment in the state. Generation variability: One of the key issues with wind is the variability in generation (Exhibit 3 and 4). This has direct bearing on the available transmission capacity. A combination of sophisticated forecasting tools along with dispatchable generation assets, is key to add more wind capacity in the state. In case of Karnataka, availability of large hydro as a dispatchable asset, provides the grid operator with flexibility in managing wind energy. Large wind farms can deploy weather stations and forecasting tools to improve wind generation dispatch schedules. This can enable the grid operators to increase the share of wind energy in the overall generation mix.
•
•
•
•
•
Barriers to Growth
Less than20MW
Greaterthan 20MW
Greaterthan 50MW
Greater than100 MW
Greater than150 MW
109
22
92 0
Source: KREDL
Exhibit 2 Wind Energy Projects by Capacity in Karnataka

31
Harnessing Waste Heat Recovery for Power GenerationRenewing Wind Energy
0
1
4
3
2
5
6
7
8
910
January February March April May June July August September October November December
5.14.7
3.9 3.6
5.1
7.98.7
8.2
5.6 5.05.8 6.0
Win
d Sp
eed
(m/s
)
00 0.5 1 1.5Time
Win
d Po
wer
(MW
)
(One minute interval readings) X 1042 2.5 3 3.5 4 4.5
100
200
300
400
500
600
700
800
900
Exhibit 3 Monthly Average Wind Speeds at 50m for One Location in Karnataka
Exhibit 4 Wind Power Generation in Karnataka in April 2011
Optimization of Government Spending
This study looks at two mechanisms to support growth of wind energy in India. The first mechanism is GBI based approach which has been instrumental in capacity addition. This approach will rely on private sector enterprise to add more capacity in the state. However this approach would need to be calibrated, given the industry trend towards PPP model with large single-site capacity additions. The second approach is to develop wind farm infrastructure by the government, which can then be marketed to prospective wind developers to set up projects under the REC
mechanism. A set of well-designed wind farms can help solve issues related to wind capacity addition, in a more integrated manner that are currently hindering capacity addition in Karnataka. Tables 3 and 4 compare the subsidy support for two approaches outlined above. It is assumed that with wind farm infrastructure in place, developers would set up projects under REC mechanism in the state. APPC (Average Pooled Power Cost) has been used as the base price. The differential between wind tariff and APPC has been defined as the state generation based incentive. Developing wind farm infrastructure and then marketing them to prospective developers is a more cost effective approach and will position Karnataka to bring in capacity under REC mechanism in the state.
Optimization of Government Spending
Source: CSTEP (2013)
Source: CSTEP (2013)
32
4
Table 3 GBI Based Policy Framework and Annual Subsidy Support
Table4 Cost of Developing Wind Farm in the State
Exhibit 5 Wind Energy Resource Potential in Karnataka and Overlap with Vulnerable Districts
Wind Energy PotentialChikkballapura
Chamarajnagar
Chitradurga
Bellary
Chikmagalur
12345
ChikkballapuraGood Potential for Wind in Waste lands and Agricultural LandRanks 2 in Socio Economic Vulnerability Index
•
•
ChitradurgaGood Potential for Wind in Waste lands and Agricultural LandRanks 7 in Socio Economic Vulnerability Index
•
•
Chamarajnagar Good Potential for Wind Ranks 4 in Socio Economic Vulnerability Index
••
Vulnerable Districts (rank wise)
Yadgir
Chitradurga
Raichur
Chamarajanagar
Chikkaballapura
12345
Wind Farm Development
APPC Price
Land Requirement
Land Acquisition
Transmission (220 kV double circuit), 100 km
Cost of Wind Farm Development
Payback on land
Transmission line payback
GBI Based Projects
APPC Price
Wind Tariff
Annual PLF
Auxiliary Consumption
Billed Energy
Annual GBI Support
Annual GBI Support for 500 MW
Units
INR 3.07/kWh6 acres/MWINR 5 lacs/acreINR 80 lacs/kmINR 250 croresAs per capacity1-2 years
Units
INR 3.07/kWhINR 4.20/kWh21%7%1710 MWh/MWINR 0.20 crores/MWINR 100 crores
•
•
•
•
•
•
•
•
•
•
•
•
•
•
KARNATAKA DISTRICT MAP
Source: CSTEP (2013), IISc (2014)

33
Harnessing Waste Heat Recovery for Power GenerationRenewing Wind Energy
Exhibit 6 Snapshot of ADB Clean Energy Financing Partnership Facility
Following are the recommendations made, based on the case study :
KREDL has recently de-allocated about 2,500 MW of wind capacity. This will result in freeing up of rich wind resource sites. KREDL could explore developing wind energy farms in the state of about 350-500 MW each and deploy site specific wind forecasting tools for better generation forecasts.There is high degree of overlap between wind energy potential and vulnerability of districts. Chamrajnagar, Chitradurga and Chikballapura are suitable districts to focus on in the first phase of wind farm development and addition of wind generation capacity (Exhibit 5).
ADB CEFPF (Exhibit 6) facility can be used for sourcing funds for development of wind farm infrastructure in the aforementioned districts.Wind forecasting tools and accurate forecasting are key enablers to integrate wind and hydro energy by grid operator. KREDL could provide a platform to facilitate interaction among developers, technology providers and regulators on best practices and standards.Given that barriers to wind development relate to various departmental domains, KREDL could consider facilitating a dialogue among the various government stakeholders to address those barriers. This could involve KPTCL, distribution companies and revenue department to analyze the performance of the current wind policy and way forward to boost annual capacity addition of wind energy.
•
•
•
•
•
•
•
•
•
•
•
•
•
•
•
•
Recommendations
What is the CEFPF?The CEFPF was established in 2007 to help improve energy security in developing member countries and decrease the rate of climate change. It will do this by financing the deployment of new, more efficient and less polluting supply and end-use technolo-gies, through either grant or non-grant resources.
Fund size: USD 250 million
What are the priorities?Deployment of new clean energy technologyProjects that lower the barriers to adopting clean energy technologiesProjects that increase access to modern forms of clean and efficient energy for the poorTechnical capacity programs for clean energy
What kind of activities are eligible?biomass, biofuel, biogasrural electrification and energy accessdistributed energy productionwaste-to-energy projectsdemand-side management projectsenergy-efficient district heating, transport, street lighting, buildings and end-use facilitiesclean energy power generation, transmission, and distribution
Who is eligible to receive financing?All DMCs are eligible for CEFPF resources
Expected Funding: USD 3-5 million
Source: http://www.adb.org/site/funds/funds/clean-energy-financing-partnership-facility

34
4
Declining area under food crops, increasing population and water foot print (65 Gm3/yr) has clearly warranted investments in efficient tech-nological choices to produce more crop per drop.
As a progressive state, Karnataka allocated INR 1 billion for promotion of MI systems in 2014.
Reduced labour and fertilizer (18-24%) and irrigation costs (40-45%) per hectare of drip irrigated area can increase farm profitability and bring more area under cultivation.
Sugarcane based cropping systems offer an opportunity to promote SPV based MI systems due to the potential volume of benefits generated; 186 TMC of water and INR 4.50 billion by way of savings in power.

35
Harnessing Waste Heat Recovery for Power GenerationRenewing Wind Energy
5With close to two-thirds of its geographical area under cultivation, Karnataka has distinction of being the largest producer of coffee and cocoa, and the third largest producer of sugar and plantation crops in India.
Karnataka’s population of 61 million in 2011 is expected to touch 67 million by 2017. According to a gap assessment study conducted by National Bank for Agriculture and Rural Development (NABARD) while the number of households is expected to increase at an annual rate of 1.79% between 2012-13 and 2016-17, the area under food grains is expected to decline at 0.52%. This clearly warrants investments in efficient technological choices that yield more crop per drop.
Hoping to hedge against the challenges of an uncertain climate, small and marginal farmers in the state have spiked the consumption of nitrogenous (N) fertilizers, leading to nitrate-induced water pollution and yield reduction in crops. The Central Ground Water Board (CGWB) statistics estimate that 24 of 30 districts logged nitrate levels that exceeded safe limits proposed by WHO (>45 mg NO
3/litre
of water).
There is a clear opportunity to integrate fertigation technologies with Micro Irrigation (MI) and realize much larger benefits and savings in fertilizer consumption and abatement of pollution. Karnataka is one of the top performing states when it comes to adoption and promotion of MI in agricultural sector. The state budget of 2014 has placed a clear emphasis on MI by distribution of sprinkler and drip irrigation sets for 28,000 hectare area, with 90% subsidy to all groups of farmers from 2014 (Government of Karnataka, 2014).
MI systems could reduce labour and fertilizer (18-24%) and irrigation costs (40-45%) per hectare of drip irrigated area and integrate opportunities for mitigation and adaptation in agricultural sector. Energy savings resulting from the adoption
of SPV-MI systems could be to the tune of 30,000/ha/year (KPMG, 2014. De Vlugt, Maarten, 2013. Bose et.al., 2006). There are three key barriers to adoption of SPV-MI systems: policies, technology, and cost economics. As per our analysis, adoption of SPV-MI systems in sugarcane crop offer the best possible means to overcome these barriers. For SPV-MI systems, the viability gap of INR 2-3 lacs/beneficiary could be bridged by promoting a buy-back model with sugar industries, a group-farming based rental model and/or Agricultural Produce Market Committee (APMC) led market-model. A combination of government subsidies from central and state schemes can also help finance the adoption and moderate the subsidy gap. Adoption could be first promoted in sugarcane growing areas where the potential for savings and increase in crop production is highest, while a dovetailed subsidy program, subsequently can help it expand to other crops.
Executive Summary
Boosting Micro Irrigation Opportunities

36
5
This case study will assist policy makers to evaluate the benefits of MI systems integrating SPV systems to target agricultural crops with heavy water requirements. The state water policy of Karnataka (2002) aims to: “…create an ultimate irrigation potential of 45 lac hectares under major, medium and minor irrigation projects. Facilitate creation of an additional irrigation potential of 16 lac hectares by individual farmers using ground water.”
Increasing variability in rainfall and water availability pose considerable challenges for realization of these policy goals. A declining trend in water productivity, and increasing environmental and economic costs can be addressed by adoption of water-efficient choices such as MI systems.
This study analyses the implications of enhancing water productivity for Karnataka and makes suitable recommendations to facilitate adoption of solar powered MI systems to increase water, nutrient and energy use efficiency in agriculture. This will help foster favourable environments for mass adoption of SPV-MI systems by farmers as well. Karnataka, as a leader in the adoption of MI systems is uniquely positioned to convert the achievements in acreage under MI to realize green growth benefits. On the other hand, the heavy reliance on rainfed farming, high solar insolation and rising nutrient costs, will also motivate farmers to adopt MI systems and reduce uncertainties in production with SPV technology.
A study by The Energy and Resources Institute (TERI) estimates that the loss due to power outage in the agriculture sector is 2-3.6% of total State Domestic Product (SDP) . Between 2004 and 2009, there was a decline of 3.2% in net ground-water availability in the state due to extraction exceeding replenishment. Average head has dropped in some districts from 15-20 feet to more than 150 feet in the last decade. There are about 16.45 lac electrical irrigation pump sets irrigating a gross area of 14.75 lac hectares in Karnataka (Department of Agriculture, 2011).
According to Center for Study of Science, Technology and Policy (CSTEP, 2014) if the current trend of inefficient water use and pumping continues in the future, the total power
subsidy bill, with a budgetary provision of INR 56 billion in the current fiscal year, could cross INR 400 billion by 2020, and reach INR 1 trillion by 2030, as the electricity consumption reaches 21 TWh. The power subsidy to the farm sector has grown at an average rate of 18% since 2007. The average cost of power purchase in Karnataka is INR 4.30 per unit from non-hydel channels while the average cost of solar power purchase is in the range of INR 6.93 - 8.40/unit.
As the state is transitioning to a service-driven economy, competing demands for water from other sectors, cannot be ignored. In contrast to a 3% Compounded Annual Growth Rate (CAGR) in water demand for all sectors combined, water demand from agriculture alone is set to grow by 25% over 2005 levels in 2025 to almost 40 Billion Cubic Meters (BCM) per annum (EMPRI, 2012. Ernst & Young, 2011). This makes a strong case for increasing water use efficiency in agriculture in the state. Integrating SPV-MI systems will help the state reap the benefits of a high solar power potential (24.70 GWp).
District level analysis of fertilizer consumption data show the highest increase in N consumption for Gulbarga (331.97%) followed by Kolar (212.46%), Chitradurga (193.73%) and Tumkur (191.50%) from 1996 to 2006. These districts together constitute one-third of all nitrate-linked water quality affected sites sampled in Karnataka. Agricultural input surveys indicate a very low proportion of net irrigated to cropped area in these districts. Curiously enough, these districts also figure among the districts with declining crop yields against increasing fertilizer consumption. Exhibit 1 below shows the relationship between rainfed agriculture and high nutrient loading.
Small farmers, as a category, consume N fertilizers the most, with the highest decadal increase (55%) in fertilizer consumption per unit of gross cropped area across all categories of farmers. Under irrigated conditions, Nitrogen loss due to leaching is shown to increase proportionately with the quantity of irrigation and N fertilizers applied. Under rainfed conditions, N loss due to runoff increases proportionately with intensity and variability of rainfall. Calculations indicate losses to the tune of INR 94 billion per year for the state by way of increased run off.
Introduction
Water-Energy Nexus
Water-Nutrient Nexus

37
Harnessing Waste Heat Recovery for Power Generation
Boosting Micro IrrigationOpportunities
Karnataka ranks among the top five states that has the highest levels of nitrate contamination in drinking water; 24 of the 30 districts logged nitrate levels that exceed safe limits proposed by WHO (>45 mg NO
3/litre of water). In
as many as 4,500 villages in Karnataka, groundwater is not fit for drinking purposes on account of high nutrient loads.
The annual cost of maintenance of NO3 levels in drinking
water at safer levels (10-15 mg) has been estimated to be in the range of INR 15-25 billion using the Environmental Burden of Disease methodology standardized by World Bank.
Agricultural output is impacted largely by on-farm, micro-level practices. Karnataka registered the lowest gains in productivity, among all southern states for the period 1983-84 to 2012-2013 (Mishra, S K, 2007. Center for Development Economics, 2012). Panel data from Karnataka (1955-1995) indicated that scaling up irrigation has not resulted in a substantial increase in overall food grains production. Similarly larger inputs of fertilizer have not led to desirable effect on yield; on the contrary, very large quantities of
fertilizers when added is shown to reduce the yield. Research studies led by the Bengaluru based Institute for Social and Economic Change (ISEC) also suggests that adoption of water-energy-and nutrient efficient technologies can lead to better factor productivity at farm when compared to other options.
Karnataka has the second largest area under dry land agriculture after Rajasthan in India. Development of groundwater resources is constrained by characteristic hard rock aquifers found in the state. At 65 billion cubic metre per year (Gm3/yr) for crop production, Karnataka has the third-largest green water foot print (volume of rainwater consumed for crop production) in India.
Under the 2014-15 “Solar Pumping Program for Irrigation and Drinking Water,” Ministry of New and Renewable Energy (MNRE) announced a provision of initial financing support of INR 400 crores in the fiscal year to meet 30% of the cost of SPV water pumping systems, thereby subsidizing 1,00,000 SPV water pumping systems. The MNRE provides subsidy for irrigation pump sets only up to 5 HP.
The Solar Farmers’ Scheme currently under consideration by the Government of Karnataka can enable the farmers overcome the price barriers in adoption of SPV-MI systems. With the help of subsidies or on his own, a farmer can
Health Implications of Nutrient Loading
Water-Food Nexus
Policy Landscape
Exhibit 1 Nitrogen Consumption Dynamics
Source: Agricultural input surveys (1996-2007)
0
1996-1997 2001-2002 2006-2007
1
2
3
4
5
6
7
Prop
ortio
n of
N A
pplie
d to
P &
K
Five Year Agricultural Input Surveys
Irrigated Areas(Food Crops)
Irrigated Areas (Non-Food Crops)
Non-Irrigated Areas(Food Crops)
Non-Irrigated Areas(Non-Food Crops)

38
5
Barriers and Opportunities
switch to solar-powered irrigation pump (IP) sets. A farmer who has not availed subsidies to adopt the SPV system can earn up to INR 9.56/unit while a subsidy-beneficiary will be able to earn INR 7.2/unit of electricity sold to the grid (Government of Karnataka, 2014).
The state budget of 2014 has placed a clear emphasis on MI by distribution of sprinkler and drip irrigation sets for 28,000 hectare area, with 90% subsidy to all groups of farmers from 2014 (Government of Karnataka, 2014). However the scale of adoption of fertigation and MI in the state could be enhanced to make it adequate and efficient to meet the nexus challenges described above. As a progressive state, Karnataka allocated INR 1 billion in the 2014 budget for promotion of MI systems.
Lessons from Indo-German Energy Program in Punjab and Rajasthan
The Punjab Energy Development Agency (PEDA) facilitated the installation of 1,850 SPV- IPs using a subsidy mix of MNRE subsidies, soft loans from IREDA, state government subsidy support and the 100% depreciation benefit through lease financing of the IP sets. This subsidy mix facilitated farmers to avail the system at 10% of the actual cost.
In Rajasthan, beneficiaries are expected to pay 14% of the system cost upfront. The Rajasthan Renewable Energy Corporation is providing a 30% subsidy from MNRE under the national solar mission while the state under Rashtriya Krishi Vikas Yojana (RKVY) is providing the remaining 56% subsidy.
Source: GIZ, 2014. Solar Water Pumping for Irrigation, Opportunities in Bihar, India
With a technology which has already proven to be successful in other parts of the country, MI systems can integrate irrigation and agricultural services to boost crop yields, and increasing irrigation efficiency holds the key to Karnataka’s agricultural growth.
Drip irrigation as a MI technology has succeeded in
transferring the cost-savings and efficiency gains in agricultural input usage to the farmers. While the average reduction of labour and fertilizer costs have been in the range of 18-24% per hectare of drip irrigated area, the potential rate of returns has been in the range of 40-45% per hectare. Fertilizer use efficiency of 60-80%, and water use efficiency of 90-95% is possible through drip irrigation systems (Planning Commission of India, 2012).Karnataka leads in the promotion and adoption of MI technology in agriculture. The state government has presented an ambitious plan to cover more area under MI in the current budget (Chief Minister’s Budget Speech, 2014). The current extent of adoption could be substantially scaled up to help the state harness efficiency and mitigation benefits from the technology. This represents strong potential for the growth of MI systems in this region. Solar Photo Voltaic (SPV) pump sets are competitive only with subsidised support for small and marginal farmers. The initial investment requirement for a SPV-MI pump set is in the range of INR 1.25 lac per kilo-watt (KW) capacity (Anonymous, 2014).Business models that offer single window systems for promotion of SPV-IP sets along with market/buyer support through Agricultural Produce Market Committees (APMCs) or processing/warehousing services can assure higher adoption rates.An inclusive and enabling policy regime could help achieve the promotion of SPV-MI systems in field crops/horticulture targeting small and marginal farmers who depend on groundwater resources. Suitable rental/lease/market based models to finance the capital requirement have to be identified.Sugarcane based cropping systems offer an opportunity to promote SPV based MI systems due to the potential volume of benefits generated; 186 TMC of water and INR 4.50 billion by way of savings in power. Sugarcane based systems also offer the institutional architecture for implementation of the scheme with enabling markets/industries, farmer associations and supply chains.
•
•
•
•
•
•

39
Harnessing Waste Heat Recovery for Power Generation
Boosting Micro IrrigationOpportunities
Recommendations
Following are the recommendations made based on the analysis:
The state government could build on the current thrust on MI to integrate and cover SPV systems in agriculture. Government’s focus on Solar Farmer Scheme is in line with this approach. The scope of MI schemes could be further expanded to promote fertigation and offered on integrated delivery or mission mode.A strong focus on sugarcane-based cropping systems could help generate maximum returns from the intervention and help in promoting adoption of SPV-MI systems in the state. Appropriate short-term implementation mechanisms including rental/lease of SPV pump sets managed by sugar mills or farmer cooperatives, industry or APMC-sponsored loan financing for SPV-MI systems, or a blend of APMC-and state sponsored loan financing could be explored to facilitate adoption of SPV-MI systems among different farmer categories. Financing opportunities available through MNRE, NABARD and various state schemes) brought under a single window system using a Special Purpose Vehicle (SPV) or Single Window System (SWS) like the Gujarat Green Revolution Company (GGRC) could help farmers access central and state government sponsored subsidies.Business models with lease arrangements for SPV pumps to farmers’ cooperatives or producer companies could be worked out in the case of marginal farmers whose willingness to pay is high, but affordability is low. Long term measures such as fostering a competitive manufacturing sector could help provide a level playing field for stakeholders and remove implementation barriers.
•
•
•
•
•

Anonymous. Micro Irrigation Systems Market - Global Industry Size, Market Share, Trends, Analysis and Forecast, 2012 – 2018. 2014.
BMTC Bangalore Metropolitan Transport, and Corporation. “Fifteenth Annual Administration Report of Bangalore Metropolitan Transport Corporation 2011-2012,” 2011.
Bose et.al. , The Energy and Resources Institute (TERI). Cost of unserved power in Karnataka, Energy Policy 34 (12): 1434-1447. 2006.
Center for Development Economics, Delhi School of Economics 2012
CPCB Central Pollution Control Board. Air Quality Monitoring, Emission Inventory and Source Apportionment Study for Indian Cities. National Summary Report, Decem-
ber 2010. www.cpcb.nic.in.
CSTEP Center for Study of Science, Technology & Policy. Transitioning Towards a Green Economy in Karnataka. 2014.
CSTEP Center for Study of Science, Technology & Policy. Wind Power in Karnataka and Andhra Pradesh: Potential Assessment, Costs, and Grid Implications. 2013.
De Vlugt, Maarten. Implementation of low carbon energy solutions for water irrigation in India, Universeteit Utrecht. 2013
Department of Agriculture, Government of Karnataka. Available online at: raitamitra.kar.nic.in/imp_agri_stat.html. 2011.
EBUSCO. “EBUSCO Electric Buses and Components.” Http://www.ebusco.eu/en/electric-Buses/ytp-1, 2014.
EMPRI Environmental Management & Policy Research Institute. State of Environment Report, Government of Karnataka. 2012.
Ernst & Young. Water Sector in India: Emerging investment opportunities. Available online at: http://www.ey.com/Publication/vwLUAssets/Water_sector_in_India/$FILE/
Water_Sector_in_India.pdf. 2011.
Karnataka Government Secretariat. “The Karnataka Solar Policy 2014-2021” 2014.
Government of Karnataka. Chief Minister’s Budget Speech, 2014. Available online at: http://finance.kar.nic.in/bud2014/bseng14.pdf. 2014.
Government of Karnataka. Guidelines for Surya Raitha scheme, 2014. Available online at: kredlinfo.in/Solaroffgrid/Surya%20raitha%20eng.pdf. 2014
Government of UK. Study Available at https://www.gov.uk/noise-pollution-economic-analysis. 2013.
Hosamane, Sateesh N., and G. P. Desai. “Urban Air Pollution Trend in India- Present Scenario.” Environment 2, no. 8 (2013). http://www.ijirset.com/upload/august/47_UR-
BAN.pdf.
IISc Indian Institute of Science. ‘Transitioning towards Climate Resilient Development in Karnataka’. 2014.
InWEA Indian Wind Energy Association. http://www.inwea.org/.
KERC Karnataka Electricity Regulatory Commission. “Tariff Order for Solar Power Generation- FY14-18,” October 10, 2013.
KPMG. Feasibility analyses for solar agricultural water pumps in India, Study for Shakti Foundation, India. 2014.
KREDL Karnataka Renewable Energy Development Limited. http://kredlinfo.in/projwind.aspx
KSRTC Karnataka State Road Transport Corporation. Annual Administration Report 2011-2012, 2011.
Mishra, S K. Trends in Growth of Agriculture Sector of the Indian Economy. Available online at: http://ideas.repec.org/p/ess/wpaper/id882.html. 2007.
MNRE Ministry of New and Renewable Energy. http://mnre.gov.in/
NEKRTC North Eastern Karnataka Road Transport Corporation. 12th Annual Administration Report 2011-12, March 2013.
NEMMP 2020. National Electric Mobility Mission Plan 2020. Available at: http://dhi.nic.in/NEMMP2020.pdf.2012.
NWKRTC North Western Karnataka Road Transport Corporation. “North Western Karnataka Road Transport Corporation Progress at a Glance : Highlights,” 2012.
Nylund, Nils-Olof, Kati Koponen, and Valtion teknillinen tutkimuskeskus. Fuel and Technology Alternatives for Buses: Overall Energy Efficiency and Emission Perfor-
mance, 2012.
Planning Commission of India. Performance evaluation of micro irrigation projects in India. Available online at: http://www.indiaenvironmentportal.org.in/files/file/
micro%20irrigation.pdf. 2012.
Ramachandra, T.V. and Shwetmala. Emissions from India’s transport sector: Statewise synthesis. 2009.
The World Bank. India: Diagnostic Assessment of Select Environmental Challenges- An Analysis of Physical and Monetory Losses of Environmental Health and Natural
Resources. An Analysis of Physical and Monetory Losses of Environmental Health and Natural Resources, 2013
References
•••••
•••••••
•••••
••••••••••••
•
••
Prof. M.B. Raje Gowda
www.flickr.com/photos/rameshng/13938784383/
http://pixabay.com/static/uploads/photo/2014/03/12/11/12/wind-285966__180.jpg
http://pixabay.com/en/alternative-blue-cell-clean-eco-21581/
Prof. M.B. Raje Gowda
Karunakar Rayker, www.flickr.com/photos/21932201@N04/2635903608
Prof. M.B. Raje Gowda
electronicsb2b.com/wp-content/uploads/2012/12/bhelsolar.jpg
www.flickr.com/photos/pankaj/557262557
Photo credits (page 4)
•••••••••


Global Green Growth Institute19F Jeongdong Bldg. 21-15 Jeongdong-gil Jung-gu Seoul 100-784 Republic of Korea
T: +82 2 2096 9991 F: +82 2 2096 9990