graduating pharmacy student survey - … · web viewgraduating pharmacy student surveysummary...
TRANSCRIPT

GRADUATING PHARMACY STUDENT SURVEYSUMMARY REPORT FOR DRAKE UNIVERSITY, 2007, 2008, 2009, 2010, 2011,2012,2013
Total number of responses:2007: 94 (72.9% response)2008: 106 (88.3% response)2009: 92 (68.7% response)2010: 77 (74.76% response)2011: 72 (69.9% response)2012: 65 (60.75%response)2013: 91 (74.0%response)
Demographic Information
Gender
ResponsePercentDrake2007
ResponsePercentNational
2007
ResponsePercentDrake2008
ResponsePercentNational
2008
Response PercentDrake2009
Response PercentDrake2010
ResponsePercentNational
2010Male 29.8% 36.7% 21.7% 32.0% 37.0% 26.0% 34.3%Female 70.2% 63.6% 78.3% 68.0% 63.0% 74.0% 65.7%Primary area of paid outside work experiences while in school
ResponsePercent
Community pharmacy MAE* NA NA MAE * MAE * NAInstitutional pharmacy MAE* NA NA MAE* MAE * NAOther pharmacy related MAE* NA NA MAE* MAE * NANon-Pharmacy related MAE* NA NA MAE* MAE * NAI did not work MAE* NA NA MAE* MAE * NAHours worked per week if paid for outside work during your final professional year
ResponsePercent
I did not work during my final professional year 34.0% 29.0% 33.0% 26.7% 47.8% 36.4% 28.5%
Less than 10 hours 37.2% 31.5% 48.1% 34.4% 32.6% 44.2% 36.5%10 to less than 15 hours 13.8% 20.1% 14.2% 20.3% 9.8% 15.6% 17.0%15 to less than 20 hours 9.6% 12.5% 1.9% 11.8% 3.3% 2.6% 9.7%20 to less than 30 hours 2.1% 4.8% 1.9% 4.9% 4.3% 0.0% 4.0%30 or more hours 3.2% 2.1% 0.9% 1.6% 0.0% 0.0% 1.3%No Answer 2.2% 1.3% 3.0%
Hours worked per week if paid for outside work during the academic year immediately prior to final professional year
ResponsePercent
I did not work during the academic year immediately prior to my final professional year
7.4%17.9% 6.6% 17.3% 14.1% 3.9% 16.6%
Less than 10 hours 13.8% 20.1% 15.1% 22.0% 19.6% 22.1% 25.4%10 to less than 15 hours 35.1% 25.2% 34.9% 24.2% 38.0% 37.7% 24.0%15 to less than 20 hours 25.5% 21.3% 32.1% 21.3% 19.6% 23.4% 17.7%20 to less than 30 hours 10.6% 10.7% 7.5% 10.0% 8.7% 7.8% 8.9%30 or more hours 7.4% 4.8% 3.8% 4.8% 0.0% 1.3% 4.3%

No Answer 3.1%
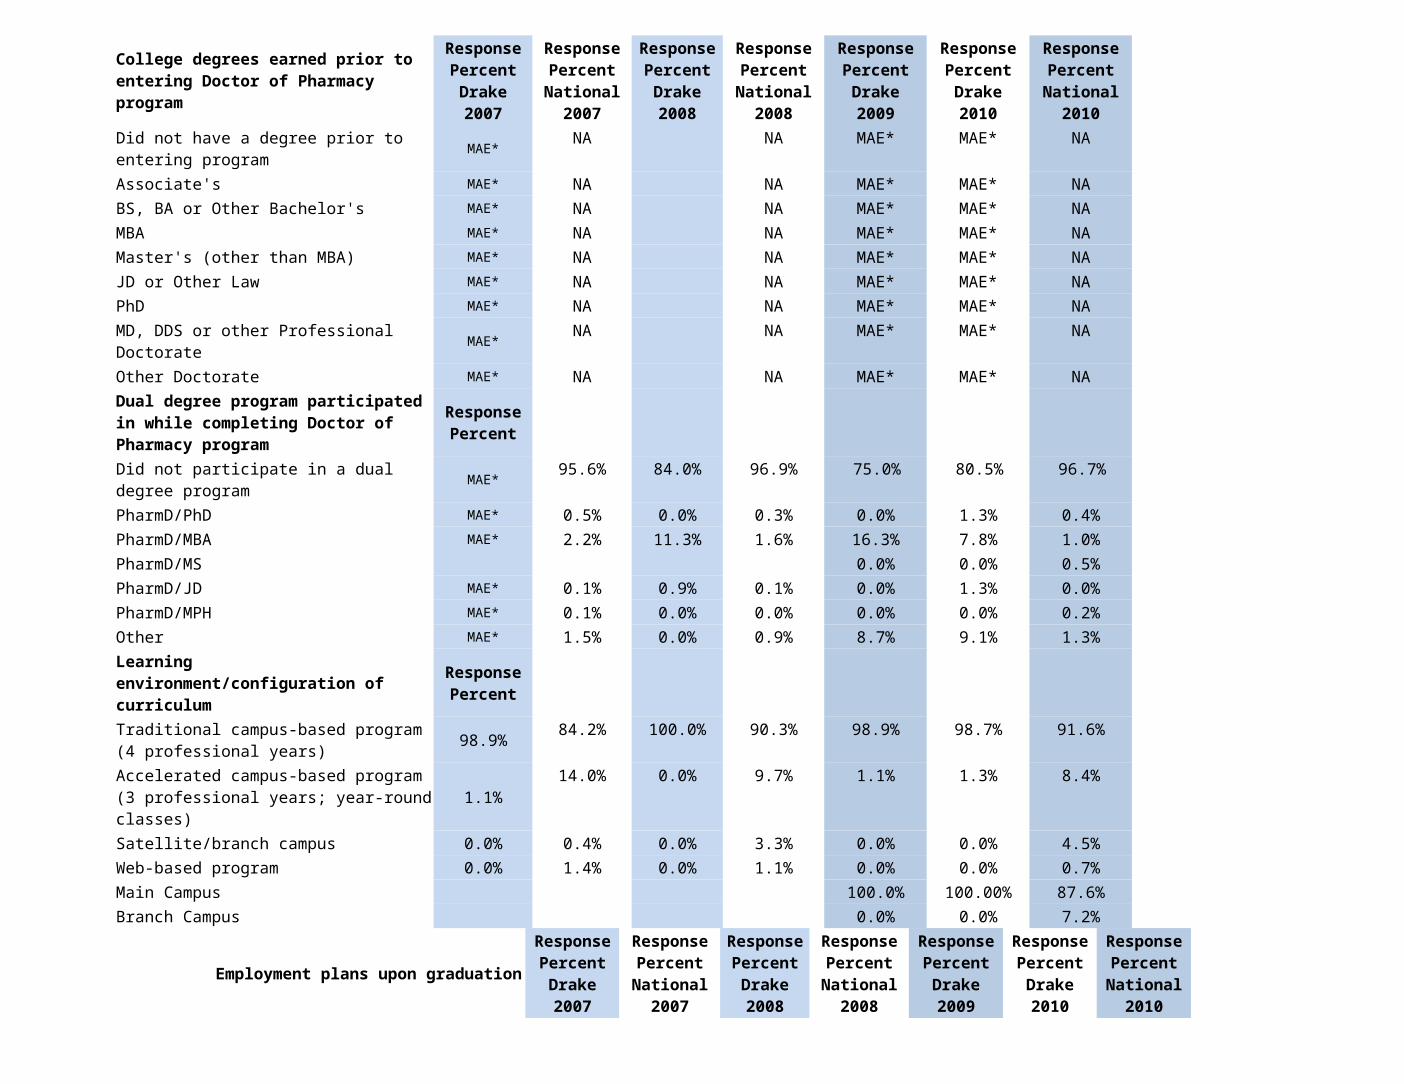
Employment plans upon graduation
ResponsePercentDrake2007
ResponsePercentNational
2007
ResponsePercentDrake2008
ResponsePercentNational
2008
ResponsePercentDrake2009
ResponsePercentDrake2010
ResponsePercentNational
2010Community Pharmacist -- Chain MAE* NA NA MAE* MAE* NACommunity Pharmacist -- Independent MAE* NA NA MAE* MAE* NAHospital Pharmacist MAE* NA NA MAE* MAE* NALong-term Care Pharmacist MAE* NA NA MAE* MAE* NAManaged Care Pharmacist MAE* NA NA MAE* MAE* NAPharmaceutical Industry MAE* NA NA MAE* MAE* NA
College degrees earned prior to entering Doctor of Pharmacy program
ResponsePercentDrake2007
ResponsePercentNational
2007
ResponsePercentDrake2008
ResponsePercentNational
2008
ResponsePercentDrake2009
ResponsePercentDrake2010
ResponsePercentNational
2010Did not have a degree prior to entering program MAE* NA NA MAE* MAE* NAAssociate's MAE* NA NA MAE* MAE* NABS, BA or Other Bachelor's MAE* NA NA MAE* MAE* NAMBA MAE* NA NA MAE* MAE* NAMaster's (other than MBA) MAE* NA NA MAE* MAE* NAJD or Other Law MAE* NA NA MAE* MAE* NAPhD MAE* NA NA MAE* MAE* NAMD, DDS or other Professional Doctorate MAE* NA NA MAE* MAE* NAOther Doctorate MAE* NA NA MAE* MAE* NADual degree program participated in while completing Doctor of Pharmacy program
ResponsePercent
Did not participate in a dual degree program MAE* 95.6% 84.0% 96.9% 75.0% 80.5% 96.7%PharmD/PhD MAE* 0.5% 0.0% 0.3% 0.0% 1.3% 0.4%PharmD/MBA MAE* 2.2% 11.3% 1.6% 16.3% 7.8% 1.0%PharmD/MS 0.0% 0.0% 0.5%PharmD/JD MAE* 0.1% 0.9% 0.1% 0.0% 1.3% 0.0%PharmD/MPH MAE* 0.1% 0.0% 0.0% 0.0% 0.0% 0.2%Other MAE* 1.5% 0.0% 0.9% 8.7% 9.1% 1.3%Learning environment/configuration of curriculum
ResponsePercent
Traditional campus-based program (4 professional years) 98.9% 84.2% 100.0% 90.3% 98.9% 98.7% 91.6%
Accelerated campus-based program (3 professional years; year-round classes) 1.1% 14.0% 0.0% 9.7% 1.1% 1.3% 8.4%
Satellite/branch campus 0.0% 0.4% 0.0% 3.3% 0.0% 0.0% 4.5%Web-based program 0.0% 1.4% 0.0% 1.1% 0.0% 0.0% 0.7%Main Campus 100.0% 100.00% 87.6%Branch Campus 0.0% 0.0% 7.2%
Pharmacist - Armed services or Regulator Agency MAE* NA NA MAE* MAE* NA
Pharmacist - Other Government MAE* NA NA MAE* MAE* NAProfessional Association MAE* NA NA MAE* MAE* NAOther Pharmacy Related Field MAE* NA NA MAE* MAE* NANon - Pharmacy Related Field MAE* NA NA MAE* MAE* NANo Plans for Employment in the coming year MAE* NA NA MAE* MAE* NA
Education upon graduation ResponsePercent
Pharmacy Residency Program MAE* NA NA MAE* MAE* NADual Pharmacy Residency - Master's Program MAE* NA NA MAE* MAE* NAPharmacy Master's Program MAE* NA NA MAE* MAE* NAPharmacy PhD Program MAE* NA NA MAE* MAE* NAMBA Program MAE* NA NA MAE* MAE* NAJD or Other Law Program MAE* NA NA MAE* MAE* NAOther Health Professions (MD, DDS, DVM, etc.) MAE* NA NA MAE* MAE* NAOther Non-Pharmacy Master's Program MAE* NA NA MAE* MAE* NANon-Pharmacy PhD Program MAE* NA NA MAE* MAE* NAFellowship MAE* NA NA MAE* MAE* NANo Plans for Further Education in the coming year MAE* NA NA MAE* MAE* NABorrowed money to help pay for your college expenses
ResponsePercent
Yes 93.6% 89.3% 86.8% 88.4% 81.5% 85.7% 88.7%No 6.4% 10.7% 13.2% 11.6% 18.5% 14.3% 11.3%*MAE=Multiple Answers Entered

Gender
ResponsePercentDrake2011
ResponsePercentNational
2011
Response Percent Drake 2012
Response Percent National
2012
ResponsePercentDrake2013
ResponsePercentNational
2013Male 44.4% 37.0% 30.8% 38.4% 36.3% 37.4%Female 55.6% 63.0% 69.2% 61.6% 63.7% 62.6%Age
ResponsePercent
25 or under 98.6% 50.5% 86.2% 49.3% 97.8% 48.1%26-30 1.4% 36.0% 12.3% 37.3% 2.2% 39.1%31-35 0.0% 8.1% 1.5% 8.2% 0.0% 8.3%36 or older 0.0% 5.3% 0.0 5.3% 0.0% 4.5%Primary area of paid outside work experiences while in school
ResponsePercent
Community pharmacy MAE* NA MAE* NA MAE* MAE*Institutional pharmacy MAE* NA MAE* NA MAE* MAE*Other pharmacy related MAE* NA MAE* NA MAE* MAE*Non-Pharmacy related MAE* NA MAE* NA MAE* MAE*I did not work MAE* NA MAE* NA MAE* MAE*Hours worked per week if paid for outside work during your final professional year
ResponsePercent
I did not work during my final professional year 33.3% 31.1% 27.7% 28.3% 31.9% 37.0%Less than 10 hours 43.1% 33.5% 46.2% 32.5% 46.2% 20.8%10 to less than 15 hours 13.9% 16.2% 13.8% 16.6% 12.1% 13.8%15 to less than 20 hours 4.2% 10.1% 4.6% 10.5% 5.5% 6.0%20 to less than 30 hours 4.2% 4.0% 4.6% 5.2% 1.1% 1.8%30 or more hours 0.0% 1.5% 0.0% 1.7% 2.2% 19.2%No Answer 1.4% 3.6% 3.1% 5.3% 1.1% 1.3%
Hours worked per week if paid for outside work during the academic year immediately prior to final professional year
ResponsePercent
Percent Response Percent Response
Percent Response
I did not work during the academic year immediately prior to my final professional year 13.9% 18.6% 6.2% 17.6% 4.4% 12.3%
Less than 10 hours 13.9% 24.3% 10.8% 22.7% 8.8% 27.4%10 to less than 15 hours 31.9% 23.1% 30.8% 22.8% 47.3% 25.1%15 to less than 20 hours 25.0% 17.1% 30.8% 17.5% 22.0% 19.0%20 to less than 30 hours 13.9% 8.8% 10.8% 9.5% 14.3% 9.7%30 or more hours 0.0% 4.3% 7.7% 4.6% 3.3% 4.5%No Answer 1.4% 3.8% 3.1% 5.4% 0.0% 2.0%
College degrees earned prior to entering Doctor of Pharmacy program
ResponsePercentDrake2011
ResponsePercentNational
2011
Response PercentDrake2012
Response Percent National
2012
ResponsePercentDrake2013
ResponsePercentNational
2013Did not have a degree prior to entering program MAE* NA MAE* NA MAE* MAE*Associate's MAE* NA MAE* NA MAE* MAE*BS, BA or Other Bachelor's MAE* NA MAE* NA MAE* MAE*MBA MAE* NA MAE* NA MAE* MAE*Master's (other than MBA) MAE* NA MAE* NA MAE* MAE*JD or Other Law MAE* NA MAE* NA MAE* MAE*PhD MAE* NA MAE* NA MAE* MAE*MD, DDS or other Professional Doctorate MAE* NA MAE* NA MAE* MAE*Other Doctorate MAE* NA MAE* NA MAE* MAE*Dual degree program participated in while completing Doctor of Pharmacy program
ResponsePercent
Did not participate in a dual degree program 89.1% 96.7% 80% 97.0% 79.0% 96.4%PharmD/PhD 0.0% 0.2% 0.0% 0.2% 1.1% 0.4%PharmD/MBA 12.5% 1.4% 15.4% 1.3% 11.0% 1.7%PharmD/MS 0.0% 0.4% 0.0% 0.2% 0.0% 0.2%PharmD/JD 1.4% 0.1% 0.0% 0.0% 0.0% 0.0%PharmD/MPH 0.0% 0.2% 0.0% 0.3% 1.1% 0.3%Other 4.2% 1.0% 4.6% 0.9% 7.7% 1.0%Estimated time of completion of ResponseDual degree program PercentAlready completed 5.6% 0.5% 3.1% 0.5% 8.8% 0.7%Less than 1 year 0.0% 0.3% 0.0% 0.1% 0.0% 0.3%1 year 0.0% 0.2% 1.5% 0.4% 1.1% 0.4%2 years 5.6% 0.7% 10.8% 0.9% 3.3% 1.0%3 years 4.2% 0.6% 3.1% 0.5% 7.7% 0.7%4 years 0.0% 0.4% 1.5% 0.3% 0.0% 0.7%5 years 0.0% 0.1% 0.0% 0.1% 0.0% 0.2%More than 5 years 0.0% 0.1% 0.0% 0.1% 0.0% 0.1%
Learning environment/configuration of curriculum ResponsePercent
Traditional campus-based program (4 professional years) 98.6% 90.4% 100.0% 90.1% 98.9% 87.2%
Accelerated campus-based program (3 professional years; year-round classes) 1.4% 9.6% 0.0% 9.9% 1.1% 12.8%
Enrolled learning environmentSatellite/branch campus 0.0% 10.2% 0.0% 8.9% 0.0% 10.4%Web-based program 0.0% 0.6% 0.0% 0.6% 0.0% 0.6%Main Campus 100.0% 89.2% 100.0% 90.5% 100% 89.0%Branch Campus 0.0% 0.0% 0.0% 0.0%


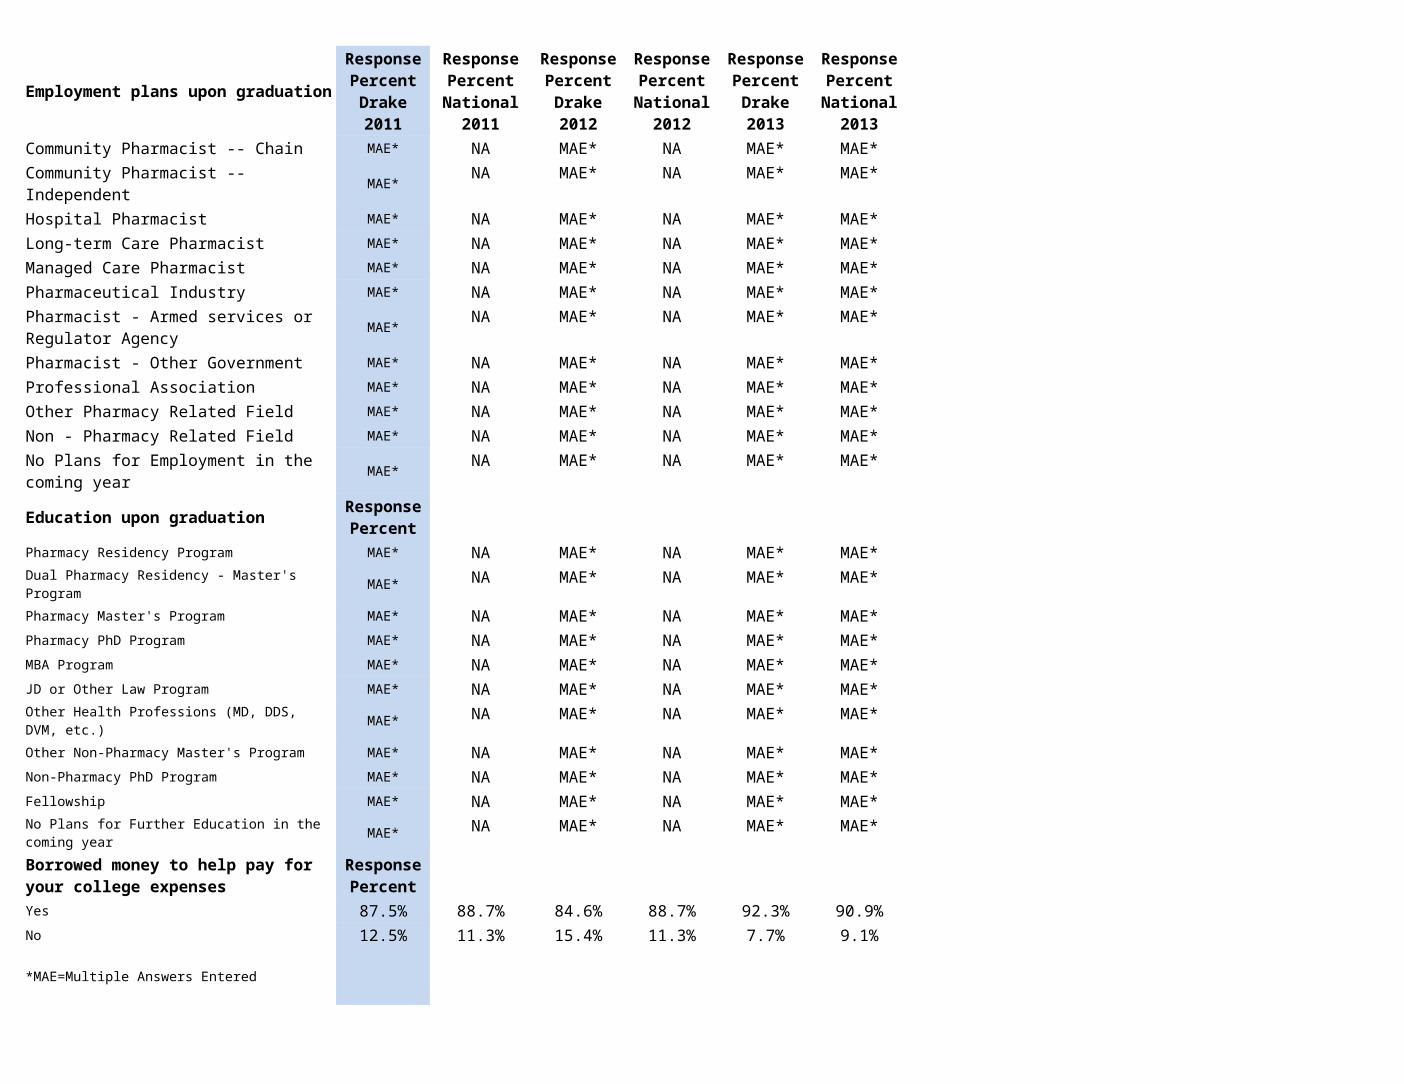
Employment plans upon graduation
ResponsePercentDrake2011
ResponsePercentNational
2011
Response Percent Drake 2012
Response Percent National
2012
ResponsePercentDrake2013
ResponsePercentNational
2013Community Pharmacist -- Chain MAE* NA MAE* NA MAE* MAE*Community Pharmacist -- Independent MAE* NA MAE* NA MAE* MAE*Hospital Pharmacist MAE* NA MAE* NA MAE* MAE*Long-term Care Pharmacist MAE* NA MAE* NA MAE* MAE*Managed Care Pharmacist MAE* NA MAE* NA MAE* MAE*Pharmaceutical Industry MAE* NA MAE* NA MAE* MAE*Pharmacist - Armed services or Regulator Agency MAE* NA MAE* NA MAE* MAE*
Pharmacist - Other Government MAE* NA MAE* NA MAE* MAE*Professional Association MAE* NA MAE* NA MAE* MAE*Other Pharmacy Related Field MAE* NA MAE* NA MAE* MAE*Non - Pharmacy Related Field MAE* NA MAE* NA MAE* MAE*No Plans for Employment in the coming year MAE* NA MAE* NA MAE* MAE*
Education upon graduation ResponsePercent
Pharmacy Residency Program MAE* NA MAE* NA MAE* MAE*Dual Pharmacy Residency - Master's Program MAE* NA MAE* NA MAE* MAE*Pharmacy Master's Program MAE* NA MAE* NA MAE* MAE*Pharmacy PhD Program MAE* NA MAE* NA MAE* MAE*MBA Program MAE* NA MAE* NA MAE* MAE*JD or Other Law Program MAE* NA MAE* NA MAE* MAE*Other Health Professions (MD, DDS, DVM, etc.) MAE* NA MAE* NA MAE* MAE*Other Non-Pharmacy Master's Program MAE* NA MAE* NA MAE* MAE*Non-Pharmacy PhD Program MAE* NA MAE* NA MAE* MAE*Fellowship MAE* NA MAE* NA MAE* MAE*No Plans for Further Education in the coming year MAE* NA MAE* NA MAE* MAE*Borrowed money to help pay for your college expenses
ResponsePercent
Yes 87.5% 88.7% 84.6% 88.7% 92.3% 90.9%No 12.5% 11.3% 15.4% 11.3% 7.7% 9.1%
*MAE=Multiple Answers Entered
KEY:
For combined ‘agree’ and ‘strongly agree’
~5% improvement from previous year or 9% improvement for two years
~5% decline from previous year or 9% over last two years
~5% lower than national average in same year
Section I: Professional Competencies/Outcomes
Indicate the degree to which you agree or disagree with these statements.* The top line indicates Drake survey results and the bottom line indicates the National survey results (Private and Public).
Strongly Agree Agree Disagree Strongly Disagree Unable to Comment
The PharmD Program prepared me to...
1. Gather and use specific information (e.g., patient histories, medical records) to identify patient medication-related problems. 2007
49% (46)48.3% (1362)
50% (47)50.0% (1409)
0% (0)1.1% (30)
1% (1)0.1% (3)
0% (0)0.5 (13)
Gather and use specific information (e.g., patient histories, medical records) to identify patient medication-related problems. 2008
42.5% (45) 51.9% (2931)
51.9% (55) 46.0% (2598)
2.8% (3) 1.2% (67)
1.9% (2) 0.4% (23)
0.9% (1) 0.4% (23)
Gather and use specific information (e.g., patient histories, medical records) to identify patient medication-related problems. 2009
53.3% (49) 52.0% (3418)
45.7% (42) 46.2% (3040)
1.1% (1) 1.3% (87)
0.0% (0) 0.3% (20)
0.0% (0) 0.2% (13)
Gather and use specific information (e.g., patient histories, medical records) to identify patient medication-related problems. 2010
59.7% (46)54.4% (4081)
40.3% (31)43.7% (3279)
0.0 (0)1.3% (96)
0.0% (0)0.3% (23)
0.0% (0)0.2% (17)
Gather and use specific information (e.g., patient histories, medical records) to identify patient medication-related problems. 2011
51.4% (37)54.7% (4352)
47.2% (34)43.2% (3436)
1.4% (1)1.3% (105)
0.0% (0)0.3% (22)
0.0% (0)0.4% (34)
Gather and use specific information (e.g., patient histories, medical records) to identify patient medication-related problems. 2012
63.1% (41)55.4% (4813)
36.9% (24)42.6% (3699)
0.0% (0)1.3% (113)
0.0% (0)0.5% (42)
0.0% (0)0.3% (25)
Gather and use specific information (e.g., patient histories, medical records) to identify patient medication-related problems. 2013
62.6%(57)54.7% (5148)
34.1%(31)43.4% (4081)
1.1%(1)1.1% (103)
1.1%(1)0.4% (36)
1.1%(1)0.4% (37)
2. Develop a patient care plan to manage each medication-related problem. 2007 39% (37)42.3% (1192)
57% (54)54.7% (1540)
2% (2)2.3% (64)
0% (0)0.2% (5)
1% (1)0.5% (15)
Develop a patient care plan to manage each medication-related problem. 2008 35.8% (38)46.7% (2637)
60.4% (64)50.9% (2871)
0.0% (0)1.5% (87)
2.8% (3)0.4% (24)
0.9% (1)0.4% (23)
Develop a patient care plan to manage each medication-related problem. 2009 47.8% (44) 47.8% (3141)
51.1% (47) 49.9% (3281)
1.1% (1) 1.8% (117)
0.0% (0) 0.3% (21)
0.0% (0) 0.3% (18)
Develop a patient care plan to manage each medication-related problem. 2010 53.2% (41)50.0% (3747)
46.8% (36)47.9% (3588)
0% (0)1.6% (121)
0% (0)0.3% (20)
0% (0)0.3% (20)
Develop a patient care plan to manage each medication-related problem. 2011 40.3% (29)49.5% (3934)
56.9% (41)47.9% (3811)
2.8% (2)1.8% (145)
0.0% (0)0.2% (18)
0.0% (0)0.5% (41)
Develop a patient care plan to manage each medication-related problem. 2012 49.2% (32)50.7% (4404)
47.7% (31)46.9% (4073)
3.1% (2)1.6% (141)
0.0% (0)0.5% (45)
0.0% (0)0.3% (29)
Develop a patient care plan to manage each medication-related problem. 2013 60.4%(55)50.8%(4780)
36.3% (33)46.8%(4404)
1.1% (1)1.5% (138)
1.1% (1)0.5% (44)
1.1% (1)0.4% (39)
3. Work with the health care team to implement the patient care plan. 2007 35% (33)37.9% (1068)
56% (53)55.7% (1569)
6% (6)5.3% (148)
1% (1)0.4% (11)
1% (1)0.7% (20)
Work with the health care team to implement the patient care plan. 2008 28.3% (30) 41.0% (2314)
63.2% (67) 52.6% (2969)
6.6% (7) 5.0% (284)
0.9% (1) 0.7% (41)
0.9% (1) 0.6% (34)
Work with the health care team to implement the patient care plan. 2009 42.4% (39) 41.2% (2710)
55.4% (51) 53.9% (3543)
2.2% (2) 4.2% (275)
0.0% (0) 0.4% (29)
0.0% (0) 0.3% (21)
Work with the health care team to implement the patient care plan. 2010 41.6% (32)43.4% (3256)
57.1% (44)51.5% (3857)
1.3% (1)4.1% (311)
0.0% (0)0.5% (41)
0.0% (0)0.4% (31)
Work with the health care team to implement the patient care plan. 2011 44.4% (32)43.1% (3424)
52.8% (38)51.5% (4094)
2.8% (2)4.2% (335)
0.0% (0)0.5% (43)
0.0% (0)0.7% (53)
Work with the health care team to implement the patient care plan. 2012 50.8% (33)41.7% (3625)
49.2% (32)52.2% (4533)
0.0% (0)4.6% (402)
0.0% (0)0.9% (78)
0.0% (0)0.6% (54)
Work with the health care team to implement the patient care plan. 2013 53.8% (49)42.7%(4017)
44.0% (40)51.7%(4860)
0.0% (0)4.2% (393)
1.1% (1)0.8% (74)
1.1% (1)0.6% (61)
4. Document pharmaceutical care activities. 2007 39% (37) 54% (51) 4% (4) 1% (1) 1% (1)

36.6% (1031) 57.4% (1617) 4.8% (134) 0.3% (8) 1.0% (27)
Document pharmaceutical care activities. 2008 31.1% (33) 40.4% (2282)
62.3% (66) 54.6% (3081)
4.7% (5) 3.7% (211)
0.9% (1) 0.6% (35)
0.9% (1) 0.6% (33)
Document pharmaceutical care activities. 2009 44.6% (41) 40.7% (2679)
52.2% (48) 54.3% (3572)
3.3% (3) 3.9% (259)
0.0% (0) 0.4% (29)
0.0% (0) 0.6% (39)
Document pharmaceutical care activities. 2010 35.1% (27)42.0% (3148)
58.4% (45)52.7% (3947)
6.5% (5)4.3% (323)
0.0% (0)0.5% (37)
0.0% (0)0.5% (41)
Document pharmaceutical care activities. 2011 38.9% (28)43.1% (3426)
56.9% (41)51.8% (4116)
4.2% (3)3.8% (303)
0.0% (0)0.5% (41)
0.0% (0)0.8% (63)
Document pharmaceutical care activities. 2012 56.9% (37)43.1% (3744)
43.1% (28)51.9% (4510)
0.0% (0)3.6% (313)
0.0% (0)0.8% (67)
0.0% (0)0.7% (58)
Document pharmaceutical care activities. 2013 45.1% (41)43.2%(4066)
51.6% (47)52.0%(4889)
1.1% (1)3.3% (314)
1.1% (1)0.7% (69)
1.1% (1)0.7% (67)
5. Interpret epidemiologic data relevant to specific diseases and their management. 2007
20% (19)26.4% (743)
68% (64)61.8% (1741)
10% (9)8.7% (245)
0% (0)0.8% (23)
2% (2)2.3% (65)
Interpret epidemiologic data relevant to specific diseases and their management. 2008 17.0% (18) 30.0% (1694)
70.8% (75) 59.7% (3366)
9.4% (10) 7.6% (429)
1.9% (2) 1.0% (55)
0.9% (1) 1.7% (98)
Interpret epidemiologic data relevant to specific diseases and their management. 2009 25.0% (23) 31.3% (2062)
68.5% (63) 57.8% (3804)
6.5% (6) 8.4% (550)
0.0% (0) 0.9% (61)
0.0% (0) 1.5% (101)
Interpret epidemiologic data relevant to specific diseases and their management. 2010 24.7% (19)32.1% (2407)
64.9% (50)58.0% (4345)
9.1% (7)7.4% (555)
0.0% (0)0.9% (64)
1.3% (1)1.7% (125)
Interpret epidemiologic data relevant to specific diseases and their management. 2011 29.2% (21)32.3% (2564)
58.3% (42)57.6% (4575)
12.5% (9)7.6% (603)
0.0% (0)0.8% (61)
0.0% (0)1.8% (146)
Interpret epidemiologic data relevant to specific diseases and their management. 2012 32.3% (21)30.4% (2639)
64.6% (42)57.8% (5028)
3.1% (2)8.5% (736)
0.0% (0)1.5% (127)
0.0% (0)1.9% (162)
Interpret epidemiologic data relevant to specific diseases and their management. 2013 37.4% (34)31.0%(2917)
54.9% (50)58.1%(5469)
4.4% (4)8.0% (751)
1.1% (1)1.2% (116)
2.2% (2)1.6% (152)
6. Interpret pharmacoeconomic data relevant to specific diseases and their management. 2007 21% (20)20.6% (579)
62% (58)59.0% (1661)
12% (11)15.5% (438)
2% (2)1.6% (46)
3% (3)3.3% (93)
Interpret economic data relevant to drug management and specific diseases. 2008 9.4% (10) 21.3% (1200)
72.6% (77) 57.9% (3266)
16.0% (17) 15.8% (893)
0.9% (1) 2.5% (142)
0.9% (1) 2.5% (141)
Interpret economic data relevant to treatment of disease. 2009 17.4% (16) 22.7% (1495)
64.1% (59) 56.3% (3703)
17.4% (16) 16.1% (1059)
1.1% (1) 2.1% (135)
0.0% (0) 2.8% (186)
Interpret economic data relevant to treatment of disease. 2010 20.8% (16)23.7% (1777)
54.5% (42)56.2% (4212)
20.8% (16)15.5% (1164)
1.3% (1)2.2% (167)
2.6% (2)2.3% (176)
Interpret economic data relevant to treatment of disease. 2011 15.3% (11)24.6% (1955)
50.0% (36)56.0% (4450)
31.9% (23)14.7% (1172)
1.4% (1)2.2% (176)
1.4% (1)2.5% (196)
Interpret economic data relevant to treatment of disease. 2012 15.4% (10)22.5% (1957)
56.9% (37)56.2% (4887)
16.9% (11)15.6% (1353)
3.1% (2)2.8% (241)
7.7% (5)2.9% (254)
Interpret economic data relevant to treatment of disease. 2013 29.7% (27)24.3%(2289)
46.2% (42)55.9%(5253)
15.4% (14)15.1%(1416)
4.4% (4)2.6% (242)
4.4% (4)2.2% (205)
7. Assure that medication use systems optimize patient outcomes. 2007 33% (31)30.8% (868)
54% (51)59.2% (1666)
9% (8)7.1% (199)
0% (0)0.6% (18)
4% (4)2.3% (65)
Manage the system of medication use to affect patients. 2008 21.7% (23) 36.0% (2029)
70.8% (75) 57.0% (3217)
4.7% (5) 4.1% (233)
0.9% (1) 0.6% (35)
1.9% (2) 2.3% (128)
Manage the system of medication use to affect patients. 2009 30.4% (28) 36.7% (2415)
63.0% (58) 57.0% (3752)
4.3% (4) 3.7% (243)
0.0% (0) 0.4% (27)
2.2% (2) 2.1% (141)
Manage the system of medication use to affect patients. 2010 33.8% (26)37.4% (2804)
61.0% (47)55.7% (4178)
2.6% (2)3.9% (291)
0.0% (0)0.5% (34)
2.6% (2)2.5% (189)
Manage the system of medication use to affect patients. 2011 26.4% (19)37.1% (2953)
63.9% (46)56.1% (4459)
6.9% (5)3.8% (305)
0.0% (0)0.5% (39)
2.8% (2)2.4% (193)
Manage the system of medication use to affect patients. 2012 30.8% (20) 61.5% (40) 6.2% (4) 0.0% (0) 1.5% (1)

36.7% (3191) 56.4% (4898) 4.0% (351) 0.9% (77) 2.0% (175)
Manage the system of medication use to affect patients. 2013 37.4% (34)38.1%(3581)
50.5% (46)55.2%(5190)
5.5% (5)4.0% (379)
1.1% (1)0.7% (70)
5.5% (5)2.0% (185)
8. Identify and use risk reduction strategies to minimize medication errors. 2007 27% (25)30.3% (853)
62% (58)59.9% (1687)
7% (7)7.5% (211)
1% (1)0.9% (26)
3% (3)1.7% (39)
Identify and use risk reduction strategies to minimize medication errors. 2008 17.0% (18) 35.7% (2014)
62.3% (66) 55.6% (3136)
16.0% (17) 6.6% (372)
2.8% (3) 1.0% (55)
1.9% (2) 1.1% (64)
Identify and use risk reduction strategies to minimize medication errors. 2009 26.1% (24) 36.6% (2408)
66.3% (61) 55.9% (3676)
7.6% (7) 5.8% (379)
0.0% (0) 0.7% (45)
0.0% (0) 1.1% (70)
Identify and use risk reduction strategies to minimize medication errors. 2010 29.9% (32)38.2% (2861)
58.4% (45)55.0% (4123)
11.7% (9)5.2% (393)
0.0% (0)0.6% (47)
0.0% (0)1.0% (72)
Identify and use risk reduction strategies to minimize medication errors. 2011 36.1% (26)38.6% (3069)
52.8% (38)54.7% (4346)
9.7% (7)5.0% (394)
1.4% (1)0.7% (56)
0.0% (0)1.1% (84)
Identify and use risk reduction strategies to minimize medication errors. 2012 32.3% (21)37.3% (3244)
64.6% (42)56.1% (4874)
3.1% (2)4.7% (411)
0.0% (0)0.9% (80)
0.0% (0)1.0% (83)
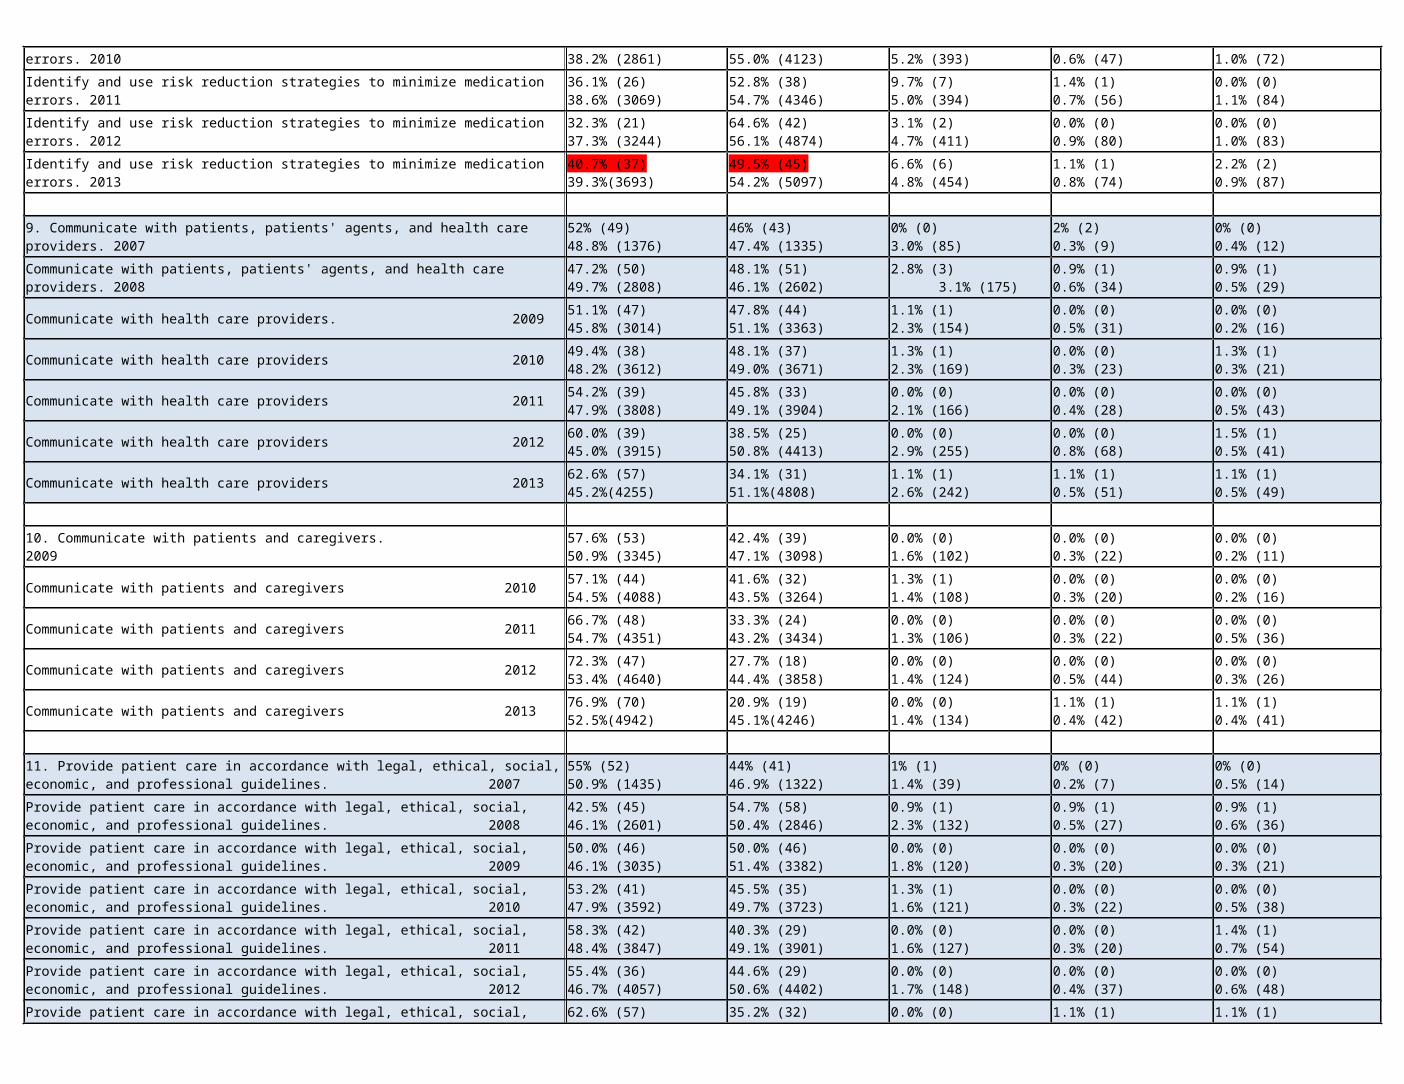
Identify and use risk reduction strategies to minimize medication errors. 2013 40.7% (37)39.3%(3693)
49.5% (45)54.2% (5097)
6.6% (6)4.8% (454)
1.1% (1)0.8% (74)
2.2% (2)0.9% (87)
9. Communicate with patients, patients' agents, and health care providers. 2007 52% (49)48.8% (1376)
46% (43)47.4% (1335)
0% (0)3.0% (85)
2% (2)0.3% (9)
0% (0)0.4% (12)
Communicate with patients, patients' agents, and health care providers. 2008 47.2% (50) 49.7% (2808)
48.1% (51) 46.1% (2602)
2.8% (3) 3.1% (175)
0.9% (1) 0.6% (34)
0.9% (1) 0.5% (29)
Communicate with health care providers. 2009 51.1% (47) 45.8% (3014)
47.8% (44) 51.1% (3363)
1.1% (1) 2.3% (154)
0.0% (0) 0.5% (31)
0.0% (0) 0.2% (16)
Communicate with health care providers 2010 49.4% (38)48.2% (3612)
48.1% (37)49.0% (3671)
1.3% (1)2.3% (169)
0.0% (0)0.3% (23)
1.3% (1)0.3% (21)
Communicate with health care providers 2011 54.2% (39)47.9% (3808)
45.8% (33)49.1% (3904)
0.0% (0)2.1% (166)
0.0% (0)0.4% (28)
0.0% (0)0.5% (43)
Communicate with health care providers 2012 60.0% (39)45.0% (3915)
38.5% (25)50.8% (4413)
0.0% (0)2.9% (255)
0.0% (0)0.8% (68)
1.5% (1)0.5% (41)
Communicate with health care providers 2013 62.6% (57)45.2%(4255)
34.1% (31)51.1%(4808)
1.1% (1)2.6% (242)
1.1% (1)0.5% (51)
1.1% (1)0.5% (49)
10. Communicate with patients and caregivers. 2009 57.6% (53) 50.9% (3345)
42.4% (39) 47.1% (3098)
0.0% (0) 1.6% (102)
0.0% (0) 0.3% (22)
0.0% (0) 0.2% (11)
Communicate with patients and caregivers 2010 57.1% (44)54.5% (4088)
41.6% (32)43.5% (3264)
1.3% (1)1.4% (108)
0.0% (0)0.3% (20)
0.0% (0)0.2% (16)
Communicate with patients and caregivers 2011 66.7% (48)54.7% (4351)
33.3% (24)43.2% (3434)
0.0% (0)1.3% (106)
0.0% (0)0.3% (22)
0.0% (0)0.5% (36)
Communicate with patients and caregivers 2012 72.3% (47)53.4% (4640)
27.7% (18)44.4% (3858)
0.0% (0)1.4% (124)
0.0% (0)0.5% (44)
0.0% (0)0.3% (26)
Communicate with patients and caregivers 2013 76.9% (70)52.5%(4942)
20.9% (19)45.1%(4246)
0.0% (0)1.4% (134)
1.1% (1)0.4% (42)
1.1% (1)0.4% (41)
11. Provide patient care in accordance with legal, ethical, social, economic, and professional guidelines. 2007
55% (52)50.9% (1435)
44% (41)46.9% (1322)
1% (1)1.4% (39)
0% (0)0.2% (7)
0% (0)0.5% (14)
Provide patient care in accordance with legal, ethical, social, economic, and professional guidelines. 2008
42.5% (45) 46.1% (2601)
54.7% (58) 50.4% (2846)
0.9% (1) 2.3% (132)
0.9% (1) 0.5% (27)
0.9% (1) 0.6% (36)
Provide patient care in accordance with legal, ethical, social, economic, and professional guidelines. 2009
50.0% (46) 46.1% (3035)
50.0% (46) 51.4% (3382)
0.0% (0) 1.8% (120)
0.0% (0) 0.3% (20)
0.0% (0) 0.3% (21)
Provide patient care in accordance with legal, ethical, social, economic, and professional guidelines. 2010
53.2% (41)47.9% (3592)
45.5% (35)49.7% (3723)
1.3% (1)1.6% (121)
0.0% (0)0.3% (22)
0.0% (0)0.5% (38)
Provide patient care in accordance with legal, ethical, social, economic, and professional guidelines. 2011
58.3% (42)48.4% (3847)
40.3% (29)49.1% (3901)
0.0% (0)1.6% (127)
0.0% (0)0.3% (20)
1.4% (1)0.7% (54)

Provide patient care in accordance with legal, ethical, social, economic, and professional guidelines. 2012
55.4% (36)46.7% (4057)
44.6% (29)50.6% (4402)
0.0% (0)1.7% (148)
0.0% (0)0.4% (37)
0.0% (0)0.6% (48)
Provide patient care in accordance with legal, ethical, social, economic, and professional guidelines. 2013
62.6% (57)46.2%(4346)
35.2% (32)50.7%(4765)
0.0% (0)2.1% (193)
1.1% (1)0.5% (49)
1.1% (1)0.6% (52)
12. Work with other stakeholders (e.g., patients and other health professionals) to engender a team approach to assure appropriate use of health care resources in providing patient care. 2007
34% (32)33.0% (931)
56% (53)56.7% (1598)
10% (9)7.1% (201)
0% (0)0.7% (21)
0% (0)2.3% (66)
Work with other stakeholders (e.g., patients and other health professionals) to engender a team approach to assure appropriate use of health care resources in providing patient care. 2008
24.5% (26) 37.5% (2117)
66.0% (70) 54.5% (3073)
6.6% (7) 5.9% (333)
0.9% (1) 0.8% (44)
1.9% (2) 1.3% (75)
Work with other stakeholders (e.g., patients and other health professionals) to engender a team approach to assure appropriate use of health care resources in providing patient care. 2009
35.9% (33) 37.6% (2473)
63.0% (58) 56.1% (3691)
1.1% (1) 4.8% (318)
0.0% (0) 0.4% (29)
0.0% (0) 1.0% (67)
Work with other stakeholders (e.g., patients and other health professionals) to engender a team approach to assure appropriate use of health care resources in providing patient care. 2010
39.0% (30)38.8% (2905)
58.4% (45)55.5% (4163)
1.3% (1)4.1% (311)
1.3% (1)0.4% (30)
0.0% (0)1.2% (87)
Work with other stakeholders (e.g., patients and other health professionals) to engender a team approach to assure appropriate use of health care resources in providing patient care. 2011
41.7% (30)39.5% (3137)
51.4% (37)54.3% (4314)
5.6% (4)4.4% (353)
0.0% (0)0.5% (37)
1.4% (1)1.4% (108)
Work with other stakeholders (e.g., patients and other health professionals) to engender a team approach to assure appropriate use of health care resources in providing patient care. 2012
46.2% (30)36.6% (3180)
53.8% (35)56.0% (4871)
0.0% (0)5.0% (432)
0.0% (0)1.0% (88)
0.0% (0)1.4% (121)
Work with other stakeholders (e.g., patients and other health professionals) to engender a team approach to assure appropriate use of health care resources in providing patient care. 2013
56.0% (51)38.2%(3592)
38.5% (35)54.2%(5101)
3.3% (3)5.5% (513)
1.1% (1)1.0% (96)
1.1% (1)1.1% (103)
13 Interpret and apply drug use policy and health policy. 2007 20% (19)25.4% (715)
54% (51)61.0% (1717)
18% (17)9.6% (270)
0% (0)1.1% (30)
7% (7)3.0% (84)
Interpret and apply drug use policy and health policy. 2008 11.3% (12) 28.6% (1615)
68.9% (73) 59.3% (3346)
16.0% (17) 8.8% (498)
1.9% (2) 0.9% (51)
1.9% (2) 2.3% (132)
Interpret and apply drug use policy and health policy. 2009 31.5% (29) 31.5% (2071)
58.7% (54)59.9% (3937)
8.7% (8)6.3% (413)
0.0% (0) 0.6% (41)
1.1% (1)1.8% (116)
Interpret and apply drug use policy and health policy. 2010 28.6% (22) 31.9% (2394)
57.1% (44)58.0% (349)
11.7% (9)7.4% (558)
0.0% (0) 0.7% (52)
2.6% (2)1.9% (143)
Interpret and apply drug use policy and health policy. 2011 26.4% (19)31.6% (2514)
54.2% (39)58.4% (4643)
16.7% (12)7.4% (591)
0.0% (0)0.6% (46)
2.8% (2)1.9% (155)
Interpret and apply drug use policy and health policy. 2012 21.5% (14)30.7% (2668)
69.2% (45)59.4% (5166)
9.2% (6)7.2% (626)
0.0% (0)0.9% (82)
0.0% (0)1.7% (150)
Interpret and apply drug use policy and health policy. 2013 29.7% (27)32.6%(3070)
53.8% (49)57.4%(5397)
9.9% (9)7.5% (708)
3.3% (3)1.2% (112)
3.3% (3)1.3% (118)
14. Work with other stakeholders (e.g., patients and other health professionals) to identify and resolve problems related to medication use. 2007
30% (28)35.8% (1007)
64% (60)57.4% (1617)
6% (6)5.0% (141)
0% (0)0.6% (18)
0% (0)1.2% (33)
Work with other stakeholders (e.g., patients and other health professionals) to identify and resolve problems related to medication use. 2008
27.4% (29) 38.7% (2186)
65.1% (69) 55.4% (3127)
5.7% (6) 4.3% (243)
0.9% (1) 0.6% (35)
0.9% (1) 0.9% (51)
Work with other stakeholders (e.g., patients and other health professionals) to identify and resolve problems related to medication use. 2009
45.7% (42) 39.5% (2596)
52.2% (48) 55.9% (3676)
1.1% (1) 3.5% (233)
1.1% (1) 0.3% (23)
0.0% (0) 0.8% (50)
Work with other stakeholders (e.g., patients and other health professionals) to identify and resolve problems related to medication use. 2010
48.1% (37)41.3% (3093)
51.9% (40)55.0% (4120)
0.0% (0)2.9% (216)
0.0% (0)0.3% (21)
0.0% (0)0.6% (46)
Work with other stakeholders (e.g., patients and other health professionals) to identify and resolve problems related to medication use. 2011
41.7% (30)40.7% (3235)
55.6% (40)54.7% (4348)
2.8% (2)3.4% (272)
0.0% (0)0.4% (272)
0.0% (0)0.8% (60)
Work with other stakeholders (e.g., patients and other health professionals) to identify and resolve problems related to medication use. 2012
46.2% (30)38.5% (3348)
53.8% (35)56.1% (4874)
0.0% (0)3.7% (318)
0.0% (0)0.8% (67)
0.0% (0)1.0% (85)
Work with other stakeholders (e.g., patients and other health professionals) to identify and resolve problems related to medication use. 2013
57.1% (52)39.6%(3721)
40.7% (37)54.6%(5139)
0.0% (0)4.1% (384)
1.1% (1)0.9% (86)
1.1% (1)0.8% (75)
15. Promote wellness and disease prevention services. 2007 32% (30)42.0% (1182)
57% (54)53.5% (1501)
7% (7)3.7% (104)
1% (1)0.4% (10)
2% (2)0.7% (20)
Promote wellness and disease prevention services. 2008 27.4% (29) 45.5% (2568)
65.1% (69) 50.4% (2843)
4.7% (5) 2.9% (163)
1.9% (2) 0.5% (31)
0.9% (1) 0.7% (37)
Promote wellness and disease prevention services. 2009 32.6% (30) 46.8% (3076)
63.0% (58) 50.3% (3312)
4.3% (4) 2.2% (144)
0.0% (0) 0.3% (18)
0.0% (0) 0.4% (28)
Promote wellness and disease prevention services. 2010 41.6% (32)49.4% (3705)
55.8% (43)48.0% (3601)
1.3% (1)1.8% (135)
0.0% (0)0.3% (22)
1.3% (1)0.4% (33)
Promote wellness and disease prevention services. 2011 41.7% (30)49.6% (3945)
50.0% (36)47.4% (3771)
6.9% (5)2.1% (165)
0.0% (0)0.3% (22)
1.4% (1)0.6% (46)
Promote wellness and disease prevention services. 2012 44.6% (29)47.0% (4084)
50.8% (33)49.9% (4338)
4.6% (3)1.9% (166)
0.0% (0)0.6% (53)
0.0% (0)0.6% (51)
Promote wellness and disease prevention services. 2013 51.6% (47)48.5%(4558)
46.2% (42)48.5%(4563)
0.0% (0)2.1% (195)
1.1% (1)0.5% (43)
1.1% (1)0.5% (46)
16. Practice pharmacy in interprofessional and collaborative practice settings. 2007 34% (32)40.8% (1149)
55% (52)53.0% (1492)
6% (6)4.9% (138)
0% (0)0.5% (13)
4% (4)0.8% (23)
Practice pharmacy in interprofessional and collaborative practice settings. 2008 34.9% (37) 43.9% (2477)
56.6% (60) 50.5% (2852)
3.8% (4) 3.8% (213)
2.8% (3)0.9% (50)
1.9% (2) 0.9% (50)
Practice pharmacy in interprofessional and collaborative practice settings. 2009 44.6% (41) 45.4% (2989)
53.3% (49) 50.4% (3315)
2.2% (2) 3.3% (217)
0.0% (0) 0.4% (26)
0.0% (0) 0.5% (31)
Practice pharmacy in interprofessional and collaborative practice settings. 2010 50.6% (39)48.5% (3637)
45.5% (35)48.1% (3605)
3.9% (3)2.5% (188)
0.0% (0)0.4% (29)
0.0% (0)0.5% (37)
Practice pharmacy in interprofessional and collaborative practice settings. 2011 50.00% (36)48.1% (3824)
44.4% (32)48.1% (3825)
5.6% (4)2.7% (213)
0.0% (0)0.4% (32)
0.0% (0)0.7% (55)
Practice pharmacy in interprofessional and collaborative practice settings. 2012 55.4% (36)46.4% (4036)
44.6% (29)49.1% (4266)
0.0% (0)3.2% (280)
0.0% (0)0.7% (64)
0.0% (0)0.5% (46)
Practice pharmacy in interprofessional and collaborative practice settings. 2013 57.1% (52)47.0%(4423)
39.6% (36)48.4%(4551)
1.1% (1)3.3% (315)
1.1% (1)0.6% (60)
1.1% (1)0.6% (56)
17. Retrieve, evaluate and manage professional information and literature. 2007 46% (43)47.7% (1343)
51% (48)48.8% (1375)
3% (3)2.8% (79)
0% (0)0.4% (10)
0% (0)0.4% (10)
Retrieve and evaluate the health sciences literature 2008 35.8% (38) 48.6% (2742)
55.7% (59) 47.4% (2675)
5.7% (6) 2.9% (162)
1.9% (2) 0.7% (37)
0.9% (1) 0.5% (26)
Search the health sciences literature. 2009 50.0% (46) 47.8% (44) 1.1% (1) 1.1% (1) 0.0% (0)

52.1% (3428) 44.7% (2940) 2.4% (155) 0.6% (40) 0.2% (15)
Search the health sciences literature. 2010 48.1% (37)53.6% (4017)
49.4% (38)43.4% (3250)
2.6% (2)2.3% (174)
0.0% (0)0.4% (32)
0.0% (0)0.3% (23)
Search the health sciences literature. 2011 61.1% (44)53.1% (4221)
33.3% (24)43.5% (3461)
5.6% (4)2.3% (185)
0.0% (0)0.6% (45)
0.0% (0)0.5% (37)
Search the health sciences literature. 2012 58.5% (38)52.5% (4566)
40.0% (26)44.8% (3891)
1.5%(1)1.7% (149)
0.0% (0)0.7% (57)
0.0% (0)0.3% (29)
Search the health sciences literature. 2013 65.9% (60)50.9%(4784)
30.8% (28)46.2%(4344)
0.0% (0)1.9% (183)
1.1% (1)0.5% (51)
2.2% (2)0.5% (43)
18. Evaluate the health sciences literature. 2009 39.1% (36) 46.8% (3080)
53.3% (49) 48.2% (3170)
7.6% (7) 3.9% (254)
0.0% (0) 0.8% (51)
0.0% (0) 0.3% (23)
Evaluate the health sciences literature. 2010 41.6% (32)47.9% (3589)
54.5% (42)47.8% (3584)
2.6% (2)3.3% (244)
1.3% (1)0.7% (55)
0.0% (0)0.3% (24)
Evaluate the health sciences literature. 2011 51.4% (37)48.0% (3812)
41.7% (30)47.3%(3756)
5.6% (4)3.4% (274)
1.4% (1)0.8% (63)
0.0% (0)0.6% (44)
Evaluate the health sciences literature. 2012 47.7% (31)47.9% (4163)
52.3% (34)48.1% (4178)
0.0% (0)2.8% (245)
0.0% (0)0.8% (73)
0.0% (0)0.4% (33)
Evaluate the health sciences literature. 2013 52.7% (48)47.4%(4454)
41.8% (38)48.2%(4535)
1.1% (1)3.1% (296)
1.1% (1)0.8% (76)
3.3% (3)0.5% (44)
19. Reflect critically on personal skills and actions and make plans to improve when necessary. 2007
29% (27)39.6% (1114)
66% (62)55.35 (1557)
5% (5)3.8% (108)
0% (0)0.4% (12)
0% (0)0.9% (25)
Reflect critically on personal skills and actions and make plans to improve when necessary. 2008
29.2% (31) 42.2% (2383)
65.1% (69)52.2% (2946)
3.8% (4) 4.1% (229)
0.9% (1) 0.7% (41)
0.9% (1) 0.8% (43)
Reflect critically on personal skills and actions and make plans to improve when necessary. 2009
37.0% (34) 42.7% (2807)
62.0% (57) 52.8% (3474)
1.1% (1) 3.3% (219)
0.0% (0) 0.7% (43)
0.0% (0) 0.5% (35)
Reflect critically on personal skills and actions and make plans to improve when necessary. 2010
42.9% (33)44.3% (3324)
55.8% (43)51.4% (3852)
1.3% (1)3.3% (248)
0.0% (0)0.5% (38)
0.0% (0)0.5% (34)
Reflect critically on personal skills and actions and make plans to improve when necessary. 2011
48.6% (35)44.2% (3517)
47.2% (34)51.2% (4069)
4.2% (3)3.2% (257)
0.0% (0)0.6% (47)
0.0% (0)0.7% (59)
Reflect critically on personal skills and actions and make plans to improve when necessary. 2012
52.3% (34)44.2% (3842)
43.1% (28)51.8% (4505)
4.6% (3)2.9% (248)
0.0% (0)0.6% (56)
0.0% (0)0.5% (41)
Reflect critically on personal skills and actions and make plans to improve when necessary. 2013
56.0% (51)45.1%(4240)
39.6% (36)50.7%(4771)
2.2% (2)2.9% (276)
1.1% (1)0.6% (60)
1.1% (1)0.6% (58)
20. Accept and respond to constructive feedback. 2007 38% (36)41.7% (1147)
56% (53)53.0% (1494)
4% (4)4.0% (112)
0% (0)0.5% (15)
1% (1)0.8% (22)
Accept and respond to constructive feedback. 2008 33.0% (35) 43.7% (2465)
58.5% (62) 50.7% (2858)
5.7% (6) 3.9% (222)
0.9% (1) 0.9% (48)
1.9% (2) 0.9% (49)
Accept and respond to constructive feedback. 2009 44.6% (41) 45.1% (2968)
54.3% (50) 50.3% (3307)
1.1% (1) 3.2% (212)
0.0% (0) 0.8% (50)
0.0% (0) 0.6% (41)
Accept and respond to constructive feedback. 2010 45.5% (35)46.3% (3473)
51.9% (40)49.4% (3704)
2.6% (2)3.0% (224)
0.0% (0)0.6% (43)
0.0% (0)0.7% (52)
Accept and respond to constructive feedback. 2011 50.0% (36)46.3% (3681)
41.7% (30)48.9% (3891)
8.3% (6)3.3% (259)
0.0% (0)0.7% (55)
0.0% (0)0.8% (63)
Accept and respond to constructive feedback. 2012 46.2% (30)46.2% (4012)
53.8% (35)49.8% (4329)
0.0% (0)2.7% (233)
0.0% (0)0.8% (67)
0.0% (0)0.6% (51)
Accept and respond to constructive feedback. 2013 56.0% (51)46.6%(4379)
39.6% (36)49.0%(4607)
2.2% (2)2.9% (275)
1.1% (1)0.8% (78)
1.1% (1)0.7% (66)
SECTION II: Doctor of Pharmacy Curriculum
Indicate the degree to which you agree or disagree with these statements.* The top line indicates Drake survey results and the bottom line indicates the National survey results (Private and Public).

Strongly Agree Agree Disagree Strongly Disagree Unable to Comment21. The curriculum followed a logical progression (i.e. courses were properly sequenced and integrated). 2007
20% (19)23.0% (645)
56% (53)56.6% (1591)
21% (20)17.6% (495)
2% (2)2.3% (64)
0% (0)0.5% (15)
The curriculum followed a logical progression (i.e. courses were properly sequenced and integrated). 2008
9.4% (10) 23.9% (1348)
54.7% (58) 55.2% (3112)
31.1% (33) 17.3% (974)
3.8% (4) 3.1% (174)
0.9% (1) 0.6% (34)
The sequence of courses was appropriate to build my knowledge and skills. 2009 27.2% (25) 28.7% (1885)
59.8% (55) 58.7% (3862)
13.0% (12) 10.8% (710)
0.0% (0) 1.5% (99)
0.0% (0) 0.3% (22)
The sequence of courses was appropriate to build my knowledge and skills. 2010 23.4% (18)29.7% (2225)
68.8% (53)57.4%(4300)
6.5% (5)10.7% (799)
0.0% (0)1.7% (129)
1.3% (1)0.6% (43)
The sequence of courses was appropriate to build my knowledge and skills. 2011 22.2% (16)29.3% (2327)
69.4% (50)57.4% (4563)
6.9% (5)11.2% (889)
1.4% (1)11.2% (889)
0.0% (0)0.6% (48)
The sequence of courses was appropriate to build my knowledge and skills. 2012 30.8% (20)28.9% (2508)
66.2%(43)58.2% (5062)
3.0% (2)10.4% (903)
0.0% (0)1.9% (163)
0.0% (0)0.6% (56)
The sequence of courses was appropriate to build my knowledge and skills. 2013 38.5% (35)30.2%(2837)
58.2% (53)57.4%(5403)
2.2% (2)9.7% (913)
0.0% (0)2.0% (191)
1.1% (1)0.6% (61)
22. I developed the skills needed to prepare me for continued learning after graduation. 2007 36% (34)36.6% (1029)
62% (58)57.8% (1624)
1% (1)4.0% (111)
0% (0)0.9% (24)
1% (1)0.8% (22)
I developed the skills needed to prepare me for continued learning after graduation. 2008 26.4% (28) 37.6% (2120)
66.0% (70) 56.7% (3198)
5.7% (6) 4.1% (231)
0.9% (1) 0.9% (48)
0.9% (1) 0.8% (45)
I developed the skills needed to prepare me for continued learning after graduation. 2009 44.6% (41) 40.4% (2658)
54.3% (50) 55.9% (3680)
1.1% (1) 2.6% (168)
0.0% (0) 0.4% (29)
0.0% (0) 0.7% (43)
I developed the skills needed to prepare me for continued learning after graduation. 2010 39.0% (30)42.7% (3200)
61.0% (47)53.5% (4011)
0.0% (0)2.6% (193)
0.0% (0)0.4% (32)
0.0% (0)0.8% (60)
I developed the skills needed to prepare me for continued learning after graduation. 2011 43.1% (31)42.6% (3384)
51.4% (37)53.4% (4241)
2.8% (2)2.6% (209)
2.8% (2)0.5% (209)
0.0% (0)1.0% (79)
I developed the skills needed to prepare me for continued learning after graduation. 2012 50.8% (33)40.8% (3546)
49.2% (32)54.3% (4718)
0.0% (0)3.4% (299)
0.0% (0)0.7% (57)
0.0% (0)0.8% (72)
I developed the skills needed to prepare me for continued learning after graduation. 2013 56.0% (51)41.0%(3853)
42.9% (39)54.7%(5144)
0.0% (0)2.8% (261)
0.0% (0)0.7% (67)
1.1% (1)0.9% (80)
23. I was provided opportunities to engage in active learning (e.g., laboratories, recitations, student portfolios, problem-based learning, in-class activities). 2007
35% (33)40.0% (1125)
64% (60)53.8% (1511)
1% (1)5.0% (140)
0% (0)0.6% (18)
0% (0)0.6% (16)
I was provided opportunities to engage in active learning (e.g., laboratories, recitations, student portfolios, problem-based learning, in-class activities). 2008
26.4% (28) 42.2% (2379)
66.0% (70) 52.6% (2969)
6.6% (7) 4.0% (225)
0.0% (0) 0.7% (38)
0.9% (1) 0.5% (31)
I was provided opportunities to engage in active learning (e.g., laboratories, recitations, student portfolios, problem-based learning, in-class activities). 2009
52.2% (48) 44.2% (2905)
44.6% (41) 51.6% (3393)
2.2% (2) 3.2% (213)
0.0% (0) 0.6% (40)
1.1% (1)0.4% (27)
I was provided opportunities to engage in active learning (e.g., laboratories, recitations, student portfolios, problem-based learning, in-class activities). 2010
36.4% (28)46.5% (3486)
62.3% (48)49.4% (3706)
0.0% (0)3.1% (233)
1.3% (1)0.6% (44)
0.0% (0)0.4% (27)
I was provided opportunities to engage in active learning (e.g., laboratories, recitations, student portfolios, problem-based learning, in-class activities). 2011
51.4% (37)46.3% (3679)
47.2% (34)49.9% (3968)
1.4% (1)2.7% (216)
0.0% (0)0.5% (40)
0.0% (0)0.6% (46)
I was provided opportunities to engage in active learning (e.g., laboratories, recitations, student portfolios, problem-based learning, in-class activities). 2012
55.4% (36)46.3% (4024)
43.1% (28)50.3% (4371)
1.5% (1)2.4% (207)
0.0% (0)0.6% (51)
0.0% (0)0.4% (39)
I was provided opportunities to engage in active learning (e.g., laboratories, recitations, student portfolios, problem-based learning, in-class activities). 2013
54.9% (50)46.1%(4340)
44.0% (40)50.2%(4724)
0.0% (0)2.5% (234)
0.0% (0)0.6% (57)
1.1% (1)0.5% (50)
24. I was encouraged to ask questions in class. 2007 31% (29)32.9% (925)
62% (58)54.7% (1535)
7% (7)9.5% (266)
0% (0)1.4% (38)
0% (0)1.6% (44)
I was encouraged to ask questions in class. 2008 26.4% (28) 33.2% (1875)
61.3% (65) 55.0% (3102)
10.4% (11) 8.6% (485)
0.9% (1) 2.0% (111)
0.9% (1) 1.2% (69)
I was encouraged to ask questions in class. 2009 45.7% (42) 35.3% (2324)
53.3% (49) 54.5% (3582)
1.1% (1) 7.9% (519)
0.0% (0) 1.3% (84)
0.0% (0) 1.0% (69)
I was encouraged to ask questions in class. 2010 33.8% (26)37.3% (2794)
58.4% (45)51.9% (3891)
7.8% (6)8.4% (633)
0.0% (0)1.2% (92)
0.0% (0)1.1% (86)
I was encouraged to ask questions in class. 2011 38.9% (28) 54.2% (39) 4.2% (3) 2.8% (2) 0.0% (0)

37.8% (3004) 52.1% (4143) 7.5% (598) 1.4% (115) 1.1% (89)
I was encouraged to ask questions in class. 2012 40.0% (26)36.7% (3192)
56.9% (37)53.2% (4626)
3.1% (2)7.3% (635)
0.0% (0)1.4% (126)
0.0% (0)1.3% (113)
I was encouraged to ask questions in class. 2013 51.6% (47)38.5%(3617)
45.1% (41)53.0%(4983)
2.2% (2)6.4% (603)
0.0% (0)1.3% (122)
1.1% (1)0.9% (80)
25. I am satisfied with the overall availability of pharmacy-related elective courses. 2007 22% (21)22.1% (620)
49% (46)46.9% (1317)
19% (18)22.0% (618)
7% (7)6.8% (190)
2% (2)2.3% (64)
Pharmacy-related elective courses met my needs as a Pharm.D. Student. 2008 17.9% (19)27.8% (1566)
54.7% (58)48.5% (2734)
16.0% (17) 15.7% (883)
6.6% (7) 4.8% (271)
4.7% (5) 3.3% (188)
Pharmacy-related elective courses met my needs as a Pharm.D. student. 2009 19.6% (18)30.6% (2015)
56.5% (52) 50.1% (3295)
16.3% (15) 13.6% (893)
2.2% (2) 3.4% (222)
5.4% (5) 2.3% (153)
Pharmacy-related elective courses met my needs as a Pharm.D. student. 2010 29.9% (23)32.2% (2417)
51.9% (40)48.8% (3656)
15.6% (12)13.1% (984)
0.0% (0)3.3% (244)
2.6% (2)2.6% (195)
Pharmacy-related elective courses met my needs as a Pharm.D. student. 2011 40.3% (29)32.7% (2602)
43.1% (31)50.1% (3979)
11.1% (8)11.5% (914)
2.8% (2)3.0% (240)
2.8% (2)2.7% (214)
Pharmacy-related elective courses met my needs as a Pharm.D. student. 2012 38.5% (25)33.2% (2888)
52.3% (34)51.3% (4460)
3.1% (2)10.9% (949)
0.0% (0)3.0% (257)
6.2% (4)1.6% (138)
Pharmacy-related elective courses met my needs as a Pharm.D. student. 2013 41.8% (38)36.0%(3383)
48.4% (44)50.7%(4765)
3.3% (3)9.4% (888)
2.2% (2)2.4% (225)
4.4% (4)1.5% (144)
26. Course loads were reasonable and balanced. 2007 21% (20)20.3% (571)
61% (57)60.7% (1706)
16% (15)15.8% (445)
2% (2)2.5% (71)
0% (0)0.6% (16)
Course loads were reasonable. 2008 19.8% (21) 24.2% (1367)
67.0% (71) 61.0% (3443)
11.3% (12) 11.1% (627)
0.9% (1) 3.0% (168)
0.9% (1) 0.7% (37)
Course loads were reasonable. 2009 23.9% (22) 26.6% (1752)
69.6% (64)62.4% (4102)
5.4% (5) 8.4% (552)
1.1% (1) 2.0% (133)
0.0% (0) 0.6% (39)
Course loads were reasonable. 2010 26.0% (20)27.0% (2010)
72.7% (56)61.4% (4600)
1.3% (1)9.3% (695)
0.0% (0)1.9% (142)
0.0% (0)0.5% (38)
Course loads were reasonable. 2011 31.9% (23)27.9% (2220)
62.5% (45)60.9% (4839)
5.6% (4)8.8% (696)
0.0% (0)1.7% (132)
0.0% (0)0.8% (62)
Course loads were reasonable. 2012 36.9% (24)27.2% (2365)
60.0% (39)61.3% (5327)
1.5% (1)8.7% (758)
0.0% (0)2.1% (183)
1.5% (1)0.7% (59)
Course loads were reasonable. 2013 41.8% (38)28.9%(2718)
53.8% (49)60.2%(5660)
3.3% (3)7.9% (746)
0.0% (0)2.2% (208)
1.1% (1)0.8% (73)
27. The program included opportunities to develop professional attitudes, ethics and behaviors. 2007
45% (42)38.5% (1093)
50% (47)53.5% (1504)
5% (5)5.1% (144)
0% (0)1.6% (45)
0% (0)0.9% (24)
The program included opportunities to develop professional attitudes, ethics and behaviors. 2008
29.2% (31) 39.8% (2246)
68.9% (73) 53.3% (3007)
0.9% (1) 4.6% (258)
0.0% (0) 1.4% (81)
0.9% (1) 0.9% (50)
The program included opportunities to develop professional attitudes, ethics and behaviors. 2009
42.4% (39) 41.9% (2759)
57.6% (53) 53.1% (3490)
0.0% (0) 3.4% (222)
0.0% (0) 0.9% (58)
0.0% (0) 0.7% (49)
The program included opportunities to develop professional attitudes, ethics and behaviors. 2010
40.3% (31)43.8% (3286)
57.1% (44)51.1% (3831)
2.6% (2)3.5% (260)
0.0% (0)0.8% (60)
0.0% (0)0.8% (59)
The program included opportunities to develop professional attitudes, ethics and behaviors. 2011
44.4% (32)42.4% (3373)
50.0% (36)52.4% (4164)
2.8% (2)3.6% (284)
1.4% (1)0.8% (67)
1.4% (1)0.8% (61)
The program included opportunities to develop professional attitudes, ethics and behaviors. 2012
44.6% (29)41.3% (3589)
55.4% (36)53.4% (4645)
0.0% (0)3.6% (314)
0.0% (0)1.0% (89)
0.0% (0)0.6% (55)
The program included opportunities to develop professional attitudes, ethics and behaviors. 2013
52.7% (48)42.5%(3993)
42.9% (39)52.7%(4957)
3.3% (3)3.1% (293)
0.0% (0)1.0% (95)
1.1% (1)0.7% (67)
SECTION III: Pharmacy Practice Experiences
Indicate the degree to which you agree or disagree with these statements.* The top line indicates Drake survey results and the bottom line indicates the National survey results (Private and Public).

Strongly Agree Agree Disagree Strongly Disagree Unable to Comment28. My introductory pharmacy practice experiences were valuable in helping me to achieve my professional competencies. 2007
11% (10)22.6% (635)
48% (45)51.3% (1440)
29% (27)18.0% (506)
12% (11)4.5% (127)
1% (1)3.5% (98)
My introductory pharmacy practice experiences were valuable in helping me to prepare for my advanced pharmacy practice experiences. 2008
5.7% (6) 23.5% (1326)
50.0% (53) 48.1% (2715)
34.0% (36)18.2% (1026)
9.4% (10) 5.1% (289)
0.9% (1) 5.1% (286)
My introductory pharmacy practice experiences were valuable in helping me to prepare for my advanced pharmacy practice experiences. 2009
9.8% (9) 24.4% (1603)
50.0% (46) 50.0% (3288)
34.8% (32) 16.6% (1093)
4.3% (4) 4.0% (262)
1.1% (1) 5.0% (332)
My introductory pharmacy practice experiences were valuable in helping me to prepare for my advanced pharmacy practice experiences. 2010
14.3% (11)24.1% (1809)
46.8% (36)48.5% (3637)
32.5% (25)17.0% (1275)
6.5% (5)4.4% (329)
0.0% (0)5.9% (446)
My introductory pharmacy practice experiences were valuable in helping me to prepare for my advanced pharmacy practice experiences. 2011
20.8% (15)26.3% (2087)
56.9% (41)51.8% (4116)
16.7% (12)15.8% (1258)
5.6%(4)4.1% (329)
0.0% (0)2.0% (159)
My introductory pharmacy practice experiences were valuable in helping me to prepare for my advanced pharmacy practice experiences. 2012
29.2% (19)26.1% (2266)
60.0% (39)52.5% (4562)
10.8% (7)15.8% (1369)
0.0% (0)4.3% (371)
0.0% (0)1.4% (124)
My introductory pharmacy practice experiences were valuable in helping me to prepare for my advanced pharmacy practice experiences. 2013
26.4% (24)26.3%(2472)
61.5% (56)55.2%(5189)
8.8% (8)13.8%(1295)
2.2% (2)4.0% (375)
1.1% (1)0.8% (74)
29. My introductory pharmacy practice experiences permitted my involvement in direct patient care responsibilities in both community and institutional settings. 2007
11% (10)21.3% (599)
56% (53)48.9% (1371)
24% (23)21.2% (594)
6% (6)4.9% (138)
2% (2)3.7% (104)
My introductory pharmacy practice experiences permitted my involvement in direct patient care responsibilities in both community and institutional settings. 2008
5.7% (6) 22.4% (1265)
50.9% (54)46.8% (2643)
34.9% (37) 20.4% (1153)
7.5% (8) 4.9% (276)
0.9% (1) 5.4% (305)
My introductory pharmacy practice experiences permitted my involvement in direct patient care responsibilities in both community and institutional settings. 2009
8.7% (8) 23.0% (1510)
57.6% (53) 48.3% (3177)
30.4% (28)19.4% (1275)
3.3% (3) 4.0% (261)
0.0% (0) 5.4% (355)
My introductory pharmacy practice experiences permitted my involvement in direct patient care responsibilities in both community and institutional settings. 2010
11.7% (9)23.4% (1751)
53.2% (41)47.5% (3558)
31.2% (24)19.0% (1424)
3.9% (3) 3.9% (293)
0.0% (0)6.3% (470)
My introductory pharmacy practice experiences permitted my involvement in direct patient care responsibilities in both community and institutional settings. 2011
18.1% (13)25.8% (2052)
65.3% (47)51.3% (4075)
12.5% (9)16.9% (1345)
4.2% (3)3.7% (293)
0.0% (0)2.3% (184)
My introductory pharmacy practice experiences permitted my involvement in direct patient care responsibilities in both community and institutional settings. 2012
26.2% (17)26.0% (2259)
66.2% (43)52.0% (4519)
7.7% (5)16.7% (1452)
0.0% (0)3.8% (329)
0.0% (0)1.5% (133)
My introductory pharmacy practice experiences permitted my involvement in direct patient care responsibilities in both community and institutional settings. 2013
30.8% (28)27.0%(2543)
58.2% (53)54.1%(5084)
8.8% (8)14.8%(1391)
1.1% (1)3.3% (314)
1.1% (1)0.8% (73)
30. The sites available for introductory pharmacy practice experiences were of high quality. 2007
6% (6)19.5% (547)
57% (54)53.9% (1511)
27% (25)16.9% (475)
7% (7)4.0% (112)
2% (2)5.7% (160)
The sites available for introductory pharmacy practice experiences were of high quality. 2008
6.6% (7) 20.8% (1174)
56.6% (60) 51.1% (2884)
28.3% (30) 16.6% (937)
4.7% (5) 4.1% (230)
3.8% (4) 7.4% (417)
The sites available for introductory pharmacy practice experiences were of high quality. 2009
9.8% (9) 23.1% (1521)
57.6% (53) 51.9% (3416)
27.2% (25) 14.6% (960)
4.3% (4) 3.0% (198)
1.1% (1) 7.3% (483)
The sites available for introductory pharmacy practice experiences were of high quality. 2010
13.0% (10)23.3% (1746)
57.1% (44)52.1% (3903)
24.7% (19)13.5% (1014)
3.9% (3)3.0% (225)
1.3% (1)8.1% (608)
The sites available for introductory pharmacy practice experiences were of high quality. 2011
16.7% (12)25.9% (2058)
55.6% (40)53.9% (4287)
20.8% (15)13.5% (1073)
4.2% (3)2.9% (227)
2.8% (2)3.8% (304)
The sites available for introductory pharmacy practice experiences were of high quality. 2012
20.0% (13)25.3% (2201)
69.2% (45)56.1% (4875)
10.8% (7)12.7% (1105)
0.0% (0)3.1% (272)
0.0% (0)2.7% (239)
The sites available for introductory pharmacy practice experiences were of high quality. 2013
23.1% (21)27.2%(2554)
60.4% (55)56.4%(5302)
12.1% (11)12.0%(1128)
1.1% (1)2.9% (275)
3.3% (3)1.6% (146)
But improved from 2 yrs ago But improved from 2 yrs ago31. The process by which I was assigned sites for introductory pharmacy practice experiences was satisfactory. 2007
9% (8)19.5% (546)
66% (62)53.5% (1501)
16% (15)14.7% (413)
7% (7)6.3% (176)
2% (2)6.0% (169)
The process by which I was assigned sites for introductory pharmacy practice experiences worked well. 2008
7.5% (8) 21.5% (1213)
67.0% (71) 50.2% (2833)
22.6% (24)14.6% (825)
1.9% (2) 5.6% (317)
0.9% (1) 8.0% (454)
The process by which I was assigned sites for introductory pharmacy practice experiences was fair. 2009
20.7% (19) 25.6% (1686)
66.3% (61) 54.2% (3568)
8.7% (8) 8.0% (525)
3.3% (3) 3.3% (216)
1.1% (1) 8.9% (583)
The process by which I was assigned sites for introductory pharmacy practice experiences was fair. 2010
22.1% (17)26.7% (2005)
68.8% (53)52.9% (3966)
7.8% (6)7.7% (577)
1.3% (1)2.6% (196)
0.0% (0)10.0% (752)

The process by which I was assigned sites for introductory pharmacy practice experiences was fair. 2011
19.4% (14)28.8% (2292)
59.7% (43)54.8% (43.57)
13.9% (10)7.6% (605)
2.8% (2)3.2% (255)
4.2% (3)5.5% (440)
The process by which I was assigned sites for introductory pharmacy practice experiences was fair. 2012
29.2% (19)28.5% (2477)
64.6% (42)57.0% (4951)
3.1% (2)7.4% (647)
0.0% (0)3.0% (265)
3.1% (2)4.0% (352)
The process by which I was assigned sites for introductory pharmacy practice experiences was fair. 2013
31.9% (29)29.7%(2797)
56.0% (51)58.0%(5455)
5.5% (5)6.7% (633)
2.2% (2)3.0% (278)
4.4% (4)2.6% (242)
32. During my advanced pharmacy practice experiences I was able to develop my patient care skills in the community pharmacy setting. 2007
34% (32)37.8% (1062)
55% (52)52.5% (1473)
9% (8)6.6% (184)
1% (1)1.7% (47)
1% (1)1.5% (41)
During my advanced practice experiences in the community pharmacy setting, I was able to develop my patient care skills. 2008
34.9% (37) 37.6% (2123)
51.9% (55) 48.0% (2708)
9.4% (10) 9.4% (528)
2.8% (3) 2.7% (151)
0.9% (1) 2.3% (132)
In the community pharmacy setting, I was able to apply my patient care skills. 2009 42.4% (39) 41.9% (2757)
50.0% (46) 47.8% (3144)
7.6% (7) 7.2% (471)
0.0% (0) 2.0% (132)
0.0% (0)1.1% (74)
In the community pharmacy setting, I was able to apply my patient care skills. 2010 41.6% (32)42.3% (3170)
51.9% (40)47.8% (3584)
6.5% (5)7.0% (526)
0.0% (0)1.7% (124)
0.0% (0)1.2% (92)
In the community pharmacy setting, I was able to apply my patient care skills. 2011 50.0% (36)44.5% (3539)
41.7% (30)46.6% (3707)
5.6% (4)5.9% (470)
2.8% (2)1.7% (136)
0.0% (0)1.2% (97)
In the community pharmacy setting, I was able to apply my patient care skills. 2012 40.0% (26)44.2% (3838)
56.9% (37)47.1% (4095)
1.5% (1)5.8% (505)
0.0% (0)1.8% (158)
1.5% (1)1.1% (96)
In the community pharmacy setting, I was able to apply my patient care skills. 2013 56.0% (51)44.7%(4202)
36.3% (33)47.7%(4484)
5.5% (5)5.0% (471)
0.0% (0)1.8% (166)
2.2% (2)0.9% (82)
33. During my advanced pharmacy practice experiences I was able to develop my patient care skills in an ambulatory care clinic. 2007
46% (43)40.2% (1128)
49% (46)47.7% (1339)
2% (2)6.6% (184)
2% (2)1.7% (49)
1% (1)3.8% (108)
During my advanced practice experiences in the ambulatory care setting, I was able to develop my patient care skills. 2008
45.3% (48) 51.6% (2909)
50.9% (54) 40.0% (2254)
2.8% (3) 4.0% (223)
0.0% (0) 1.5% (87)
0.9% (1) 3.0% (169)
In the ambulatory care setting, I was able to apply my patient care skills. 2009 57.6% (53) 52.0% (3423)
39.1% (36) 41.6% (2737)
2.2% (2) 3.0% (200)
1.1% (1) 1.2% (79)
0.0% (0) 2.1% (139)
In the ambulatory care setting, I was able to apply my patient care skills. 2010 55.8% (43)54.0% (4050)
44.2% (34)39.6% (2970)
0.0% (0)3.2% (242)
0.0% (0)0.9% (68)
0.0% (0)2.2% (166)
In the ambulatory care setting, I was able to apply my patient care skills. 2011 59.7% (43)55.3% (4395)
34.7% (25)39.2% (3118)
4.2% (3)2.8% (222)
0.0% (0)1.0% (77)
1.4% (1)1.7% (137)
In the ambulatory care setting, I was able to apply my patient care skills. 2012 58.5% (38)54.9% (4773)
40.0% (26)39.8% (3456)
0.0% (0)2.7% (234)
1.5% (1)1.1% (99)
0.0% (0)1.5% (130)
In the ambulatory care setting, I was able to apply my patient care skills. 2013 67.0% (61)55.1%(5184)
30.8% (28)40.5%(3812)
1.1% (1)2.5% (234)
0.0% (0)0.9% (80)
1.1% (1)1.0% (95)
34. During my advanced pharmacy practice experiences I was able to develop my patient care skills in a hospital or health-system pharmacy setting. 2007
38% (36)40.2% (1127)
59% (55)53.0% (1488)
2% (2)4.9% (137)
0% (0)1.1% (32)
1% (1)0.8% (22)
During my advanced practice experiences in the hospital or health-system pharmacy setting, I was able to develop my patient care skills. 2008
34.0% (36) 39.7% (2242)
50.0% (53) 45.6% (2572)
12.3% (13) 9.8% (553)
2.8% (3) 3.0% (171)
0.9% (1) 1.8% (103)
In the hospital or health-system pharmacy setting, I was able to apply my patient care skills. 2009
41.3% (38) 41.4% (2726)
55.4% (51) 48.2% (3169)
3.3% (3) 7.4% (484)
0.0% (0) 2.1% (136)
0.0% (0) 1.0% (63)
In the hospital or health-system pharmacy setting, I was able to apply my patient care skills. 2010
45.5% (35)43.4% (3253)
51.9% (40)47.2% (3538)
2.6% (2)6.8% (510)
0% (0)1.5% (115)
0% (0)1.1% (80)
In the hospital or health-system pharmacy setting, I was able to apply my patient care skills. 2011
41.7% (30)45.7% (3631)
51.4% (37)45.8% (3639)
6.9% (5)6.2% (493)
0.0% (0)1.4% (112)
0.0% (0)0.9% (74)
In the hospital or health-system pharmacy setting, I was able to apply my patient care skills. 2012
49.2% (32)45.5% (3951)
47.7% (31)46.3% (4025)
3.1% (2)5.9% (515)
0.0% (0)1.4% (126)
0.0% (0)0.9% (75)
In the hospital or health-system pharmacy setting, I was able to apply my patient care skills. 2013
60.4% (55)45.8%(4304)
31.9% (29)46.4%(4366)
6.6% (6)5.6% (524)
0.0% (0)1.4% (130)
1.1% (1)0.9% (81)
35. During my advanced pharmacy practice experiences I was able to develop my patient care skills in an inpatient/acute care hospital 2007
39% (37)39.3% (1102)
57% (54)52.4% (1470)
2% (2)5.6% (158)
0% (0)1.3% (36)
1% (1)1.4% (40)
During my advanced practice experiences in the inpatient/acute care setting, I was able to develop 49.1% (52) 41.5% (44) 6.6% (7) 1.9% (2) 0.9% (1)

my patient care skills. 2008 47.4% (2673) 43.3% (2441) 5.1% (285) 1.4% (78) 2.9% (165)
In the inpatient/acute care setting, I was able to apply my patient care skills. 2009 54.3% (50) 46.6% (3066)
42.4% (39) 46.2% (3042)
3.3% (3) 4.3% (280)
0.0% (0) 1.0% (68)
0.0% (0) 1.9% (122)
In the inpatient/acute care setting, I was able to apply my patient care skills. 2010 50.6% (39)48.5% (3639)
45.5% (35)45.2% (3386)
3.9% (3)3.6% (272)
0.0% (0)0.8% (58)
0.0% (0)1.9% (141)
In the inpatient/acute care setting, I was able to apply my patient care skills. 2011 45.8% (33)49.7% (3952)
52.8% (38)44.5% (3539)
1.4% (1)3.4% (273)
0.0% (0)0.9% (69)
0.0% (0)1.5% (116)
In the inpatient/acute care setting, I was able to apply my patient care skills. 2012 52.3% (34)49.4% (4296)
43.1% (28)45.3% (3937)
3.1% (2)2.9% (256)
0.0% (0)0.8% (73)
1.5% (1)1.5% (130)
In the inpatient/acute care setting, I was able to apply my patient care skills. 2013 67.0% (61)49.8%(4685)
29.7% (27)45.1%(4238)
1.1% (1)2.9% (274)
0.0% (0)0.8% (79)
2.2% (2)1.4% (129)
36. The need for continuity of care throughout the health care system was emphasized in the advanced pharmacy practice experiences. 2007
33% (31)34.7% (973)
56% (53)56.0% (1572)
6% (6)7.2% (202)
1% (1)1.0% (28)
3% (3)1.5% (33)
The need for continuity of care throughout the health care system was emphasized in the advanced pharmacy practice experiences. 2008
30.2% (32) 39.3% (2217)
65.1% (69) 52.8% (2977)
3.8% (4) 5.9% (331)
0.0% (0) 1.0% (56)
0.9% (1) 1.1% (61)
The need for continuity of care throughout the health care system was emphasized in the advanced pharmacy practice experiences. 2009
35.9% (33) 40.4% (2658)
60.9% (56) 52.2% (3432)
3.3% (3) 5.5% (361)
0.0% (0) 0.7% (46)
0.0% (0) 1.2% (81)
The need for continuity of care throughout the health care system was emphasized in the advanced pharmacy practice experiences. 2010
39.0% (30)42.6% (3191)
57.1% (44)49.8% (3734)
1.3% (1)5.8% (434)
0.0% (0)0.7% (51)
2.6% (2)1.1% (86)
The need for continuity of care throughout the health care system was emphasized in the advanced pharmacy practice experiences. 2011
51.4% (37)43.5% (3456)
48.6% (35)50.3% (3995)
0.0% (0)4.5% (360)
0.0% (0)0.6% (50)
0.0% (0)1.1% (88)
The need for continuity of care throughout the health care system was emphasized in the advanced pharmacy practice experiences. 2012
46.2% (30)43.6% (3788)
50.8% (33)50.3% (4376)
3.1% (2)4.5% (390)
0.0% (0)0.8% (68)
0.0% (0)0.8% (70)
The need for continuity of care throughout the health care system was emphasized in the advanced pharmacy practice experiences. 2013
54.9% (50)44.6%(4198)
40.7% (37)50.1%(4712)
3.3% (3)3.6% (342)
0.0% (0)0.6% (60)
1.1% (1)1.0% (93)
37. The variety of the available advanced pharmacy practice experience electives met my needs as a student. 2007
35% (33)32.9% (923)
56% (53)52.0% (1459)
5% (5)10.1% (284)
1% (1)4.1% (116)
2% (2)0.9% (24)
The variety of the available advanced pharmacy practice experience electives met my needs as a student. 2008
39.6% (42) 36.4% (2056)
51.9% (55) 49.2% (2775)
6.6% (7) 9.6% (539)
0.0% (0) 3.7% (208)
1.9% (2) 1.1% (64)
The variety of the available advanced pharmacy practice experience electives met my needs as a student. 2009
53.3% (49) 39.4% (2592)
45.7% (42) 48.9% (3217)
1.1% (1) 8.2% (540)
0.0% (0) 2.8% (181)
0.0% (0) 0.7% (48)
The variety of the available advanced pharmacy practice experience electives met my needs as a student. 2010
54.5% (42)40.5% (3034)
44.2% (34)47.6% (3569)
1.3% (1)8.6% (645)
0.0% (0)2.7% (202)
0.0% (0)0.6% (46)
The variety of the available advanced pharmacy practice experience electives met my needs as a student. 2011
55.6% (40)42.6% (3388)
43.1% (31)47.8% (3796)
1.4% (1)6.7% (534)
0.0% (0)2.0% (157)
0.0% (0)0.9% (74)
The variety of the available advanced pharmacy practice experience electives met my needs as a student. 2012
63.1% (41)42.4% (3682)
36.9% (24)47.8% (4157)
0.0% (0)6.9% (603)
0.0% (0)2.1% (186)
0.0% (0)0.7% (64)
The variety of the available advanced pharmacy practice experience electives met my needs as a student. 2013
62.6% (57)43.4%(4078)
33.0% (30)47.7%(4488)
2.2% (2)6.1% (570)
0.0% (0)2.1% (199)
2.2% (2)0.7% (70)
38. I was academically prepared to enter my advanced pharmacy practice experiences. 2007 32% (30)31.1% (872)
61% (57)58.2% (1633)
6% (6)8.5% (239)
0% (0)1.4% (39)
1% (1)0.9% (25)
I was academically prepared to enter my advanced pharmacy practice experiences. 2008 19.8% (21) 69.8% (74) 8.5% (9) 0.9% (1) 0.9% (1)
I was academically prepared to enter my advanced pharmacy practice experiences. 2009 44.6% (41) 36.2% (2384)
54.3% (50) 55.9% (3676)
0.0% (0) 6.0% (394)
1.1% (1) 1.1% (73)
0.0% (0) 0.8% (51)
I was academically prepared to enter my advanced pharmacy practice experiences. 2010 39.0% (30)37.7% (2823)
59.7% (46)54.2% (4062)
1.3% (1)6.2% (468)
0.0% (0)1.2% (92)
0.0% (0)0.7% (51)
I was academically prepared to enter my advanced pharmacy practice experiences. 2011 34.7% (25)38.4% (3050)
55.6% (40)53.0% (4215)
2.8% (2)6.6% (522)
5.6% (4)1.1% (91)
1.4% (1)0.9% (71)
I was academically prepared to enter my advanced pharmacy practice experiences. 2012 43.1% (28)37.9% (3291)
56.9% (37)53.6% (4662)
0.0% (0)6.4% (553)
0.0% (0)1.4% (121)
0.0% (0)0.7% (65)
I was academically prepared to enter my advanced pharmacy practice experiences. 2013 56.0% (51)38.5%(3619)
41.8% (38)53.8%(5060)
1.1% (1)5.7% (540)
0.0% (0)1.3% (121)
1.1% (1)0.7% (65)

39. The sites available for advanced pharmacy practice experiences were of high quality. 2007 35% (33)31.3% (879)
55% (52)55.9% (1569)
4% (4)8.9% (250)
2% (2)2.3% (64)
3% (3)1.6% (46)
The sites available for advanced pharmacy practice experiences were of high quality. 2008 36.8% (39) 33.1% (1867)
54.7% (58)54.3% (3066)
6.6% (7) 8.7% (489)
0.0% (0) 2.4% (135)
1.9% (2) 1.5% (85)
The sites available for advanced pharmacy practice experiences were of high quality. 2009 42.4% (39) 35.8% (2353)
55.4% (51) 54.0% (3554)
1.1% (1) 7.3% (479)
1.1% (1) 1.9% (124)
0.0% (0) 1.0% (68)
The sites available for advanced pharmacy practice experiences were of high quality. 2010 37.7% (29)37.2% (2786)
55.8% (43)52.7% (3953)
6.5% (5)7.2% (542)
0.0% (0)1.8% (133)
0.0% (0)1.1% (82)
The sites available for advanced pharmacy practice experiences were of high quality. 2011 47.2% (34)39.6% (3150)
47.2% (34)52.1% (4145)
5.6% (4)5.8% (459)
0.0% (0)1.3% (104)
0.0% (0)1.1% (91)
The sites available for advanced pharmacy practice experiences were of high quality. 2012 50.8% (33)40.2% (3490)
49.2% (32)51.3% (4461)
0.0% (0)6.0% (519)
0.0% (0)1.5% (134)
0.0% (0)1.0% (88)
The sites available for advanced pharmacy practice experiences were of high quality. 2013 56.0% (51)40.2% (3779)
41.8% (38)51.9%(4879)
1.1% (1)5.3% (502)
0.0% (0)1.6% (152) 1.1% (1)
1.0% (93)
40. The process by which I was assigned sites for advanced pharmacy practice experiences was satisfactory. 2007
31% (29)27.8% (779)
55% (52)52.2% (1465)
7% (7)12.0% (336)
5% (5)6.6% (185)
1% (1)1.5% (42)
The process by which I was assigned sites for advanced pharmacy practice experiences worked well. 2008
33.0% (35) 30.2% (1703)
55.7% (59) 48.7% (2748)
6.6% (7) 12.9% (728)
1.9% (2) 6.8% (386)
2.8% (3) 1.4% (77)
The process by which I was assigned sites for advanced pharmacy practice experiences was fair. 2009
50.0% (46)34.8% (2286)
42.4% (39)52.3% (3440)
5.4% (5) 7.6% (500)
2.2% (2) 3.9% (257)
0.0% (0) 1.4% (95)
The process by which I was assigned sites for advanced pharmacy practice experiences was fair. 2010
48.1% (37)36.3% (2723)
42.9% (33)49.6% (3719)
9.1% (7)8.4% (632)
0.0% (0)4.1% (308)
0.0% (0)1.5% (114)
The process by which I was assigned sites for advanced pharmacy practice experiences was fair. 2011
58.3% (42)38.6% (3072)
40.3% (29)49.2% (3909)
1.4% (1)7.1% (562)
0.0% (0)3.6% (286)
0.0% (0)1.5% (120)
The process by which I was assigned sites for advanced pharmacy practice experiences was fair. 2012
50.8% (33)38.4% (3334)
47.7% (31)50.3% (4370)
1.5% (1)6.7% (586)
0.0% (0)3.3% (290)
0.0% (0)1.3% (112)
The process by which I was assigned sites for advanced pharmacy practice experiences was fair. 2013
64.8% (59)39.0%(3667)
33.0% (30)50.8%(4776)
0.0% (0)5.8% (546)
0.0% (0)3.2% (299)
2.2% (2)1.2% (117)
41. Overall, my advanced practice experiences were of a scope, intensity and duration necessary to support my achievement of professional competencies. 2007
37% (35)34.3% (964)
54% (51)56.9% (1598)
6% (6)6.9% (193)
1% (1)1.2% (35)
1% (1)0.3% (18)
Overall, my advanced practice experiences were valuable in helping me to achieve the professional competencies. 2008
43.4% (46) 43.0% (2424)
53.8% (57) 51.0% (2876)
1.9% (2) 4.1% (233)
0.0% (0) 1.1% (64)
0.9% (1) 0.8% (45)
Overall, my advanced practice experiences were valuable in helping me to achieve the professional competencies. 2009
57.6% (53) 44.8% (2948)
42.4% (39)50.6% (3331)
0.0% (0) 3.1% (206)
0.0% (0) 0.8% (53)
0.0% (0) 0.6% (40)
Overall, my advanced practice experiences were valuable in helping me to achieve the professional competencies. 2010
55.8% (43)46.9% (3514)
42.9% (33)48.3% (3621)
1.3% (1)3.1%(234)
0.0% (0)0.9% (71)
0.0% (0)0.7% (56)
Overall, my advanced practice experiences were valuable in helping me to achieve the professional competencies. 2011
59.7% (43)48.7% (3873)
38.9% (28)47.4% (3765)
1.4% (1)2.6% (206)
0.0% (0)0.6%
0.0% (0)0.7% (54)
Overall, my advanced practice experiences were valuable in helping me to achieve the professional competencies. 2012
69.2% (45)49.5% (4306)
30.8% (20)46.6% (4050)
0.0% (0)2.5% (218)
0.0% (0)0.8% (68)
0.0% (0)0.6% (50)
Overall, my advanced practice experiences were valuable in helping me to achieve the professional competencies. 2013
72.5% (66)49.0%(4609)
26.4% (24)47.2%(4442)
0.0% (0)2.2% (210)
0.0% (0)0.8% (72)
1.1% (1)0.8% (72)
42. My pharmacy practice experiences allowed me to have direct interaction with diverse patient populations (e.g., age, gender, ethnic and/or cultural background, disease states, etc.). 2007
41% (39)45.7% (1282)
52% (49)50.2% (1411)
5% (5)3.2% (90)
0% (0)0.5% (14)
1% (1)0.4% (11)

My pharmacy practice experiences allowed me to have direct interaction with diverse patient populations (e.g., age, gender, ethnic and/or cultural background, disease states, etc.) 2008
48.1% (51) 49.1% (2771)
50.9% (54) 46.6% (2631)
0.0% (0) 3.1% (175)
0.0% (0) 0.7% (37)
0.9% (1) 0.5% (28)
My pharmacy practice experiences allowed me to have direct interaction with diverse patient populations (e.g., age, gender, ethnic and/or cultural background, disease states, etc.). 2009
53.3% (49) 51.3% (3375)
45.7% (42) 45.5% (2996)
1.1% (1) 2.3% (154)
0.0% (0) 0.4% (27)
0.0% (0) 0.4% (26)
My pharmacy practice experiences allowed me to have direct interaction with diverse patient populations (e.g., age, gender, ethnic and/or cultural background, disease states, etc.). 2010
55.8% (43)53.0% (3973)
44.2% (34)43.6% (3268)
0.0% (0)2.5% (191)
0.0% (0)0.4% (29)
0.0% (0)0.5% (35)
My pharmacy practice experiences allowed me to have direct interaction with diverse patient populations (e.g., age, gender, ethnic and/or cultural background, disease states, etc.). 2011
58.3% (42)52.9% (4207)
37.5% (27)44.2% (3513)
2.8% (2)2.0% (160)
1.4% (1)0.3% (27)
0.0% (0)0.5% (42)
My pharmacy practice experiences allowed me to have direct interaction with diverse patient populations (e.g., age, gender, ethnic and/or cultural background, disease states, etc.). 2012
56.9% (37)53.1% (4619)
43.1% (28)44.3% (3851)
0.0% (0)1.8% (154)
0.0% (0)0.4% (39)
0.0% (0)0.3% (29)
My pharmacy practice experiences allowed me to have direct interaction with diverse patient populations (e.g., age, gender, ethnic and/or cultural background, disease states, etc.). 2013
65.9% (60)53.8%(5063)
33.0% (30)43.9%(4125)
0.0% (0)1.4% (136)
0.0% (0)0.4% (39)
1.1% (1)0.4% (42)
43. My pharmacy practice experiences allowed me to collaborate with health care professionals other than pharmacists. 2007
49% (46)45.8% (1287)
49% (46)49.7% (1396)
1% (1)3.5% (98)
0% (0)0.5% (15)
1% (1)0.4% (12)
My pharmacy practice experiences allowed me to collaborate with other health care professionals. 2008
58.5% (62) 51.0% (2880)
39.6% (42) 45.4% (2564)
0.9% (1) 2.5% (142)
0.0% (0) 0.5% (29)
0.9% (1) 0.5% (27)
My pharmacy practice experiences allowed me to collaborate with other health care professionals. 2009
56.5% (52) 52.0% (3421)
43.5% (40) 45.5% (2995)
0.0% (0) 1.7% (109)
0.0% (0) 0.5% (30)
0.0% (0) 0.3% (23)
My pharmacy practice experiences allowed me to collaborate with other health care professionals. 2010
62.3% (48)54.3% (4074)
37.7% (29)43.1% (3231)
0.0% (0)1.8% (135)
0.0% (0)0.3% (26)
0.0% (0)0.4% (30)
My pharmacy practice experiences allowed me to collaborate with other health care professionals. 2011
63.9% (46)54.0% (4290)
34.7% (25)43.4% (3452)
1.4% (1)1.7% (134)
0.0% (0)0.4% (30)
0.0% (0)0.5% (43)
My pharmacy practice experiences allowed me to collaborate with other health care professionals. 2012
61.5% (40)52.8% (4588)
38.5% (25)44.9% (3901)
0.0% (0)1.6% (135)
0.0% (0)0.4% (34)
0.0% (0)0.4% (34)
My pharmacy practice experiences allowed me to collaborate with other health care professionals. 2013
71.4% (65)53.6%(5042)
26.4% (24)43.9%(4126)
1.1% (1)1.6% (154)
0.0% (0)0.4% (38)
1.1% (1)0.5% (45)
SECTION IV: Student Services
Indicate the degree to which you agree or disagree with these statements.* The top line indicates Drake survey results and the bottom line indicates the National survey results (Private and Public).
Strongly Agree Agree Disagree Strongly Disagree Did not Utilize44. I am satisfied with the academic advising made available to me by the college/school. 2007
15% (14)20.8% (518)
43% (40)47.2% (1177)
30% (28)17.0% (425)
7% (7)5.4% (134)
5% (5)9.6% (240)
The academic advising met my needs. 2008 50.9% (54) 55.7% (3144)
37.7% (40) 15.7% (886)
11.3% (12)28.6% (1612)
Academic advising met my needs. 2009 10.9% (10) 22.2% (1460)
54.3% (50) 45.4% (2987)
19.6% (18) 12.0% (791)
9.8% (9) 4.6% (301)
5.4% (5) 15.8% (1039)
Academic advising met my needs. 2010 15.6% (12)23.9% (1792)
49.4% (38)44.8% (3355)
27.3% (21)11.7% (877)
6.5% (5)4.0% (298)
1.3% (1)15.7% (1174)
Academic advising met my needs. 2011 26.4% (19)24.7% (1964)
34.7% (25)44.6% (3544)
23.6% (17)11.4% (904)
9.7% (7)4.0% (320)
5.6% (4)15.3% (1217)
Academic advising met my needs. 2012 15.4% (10)22.9% (1987)
49.2% (32)45.7% (3975)
16.9% (11)11.4% (989)
9.2% (6)4.2% (361)
9.2% (6)15.9% (1380)
Academic advising met my needs. 2013 20.9% (19)24.5%(2308)
58.2% (53)47.1%(4432)
14.3% (13)10.3% (972)
4.4% (4)4.2% (396)
2.2% (2)13.8%(1297)
45. I am satisfied with the career planning and guidance made available to me by the college/school. 2007
13% (12)16.7% (416)
46% (43)44.1% (1098)
28% (26)20.2% (503)
7% (7)5.9% (146)
6% (6)13.2% (329)
The career planning and guidance met my needs. 2008 39.6% (42) 21.7% (23) 38.7% (41)

40.2% (2270) 16.7% (941) 43.1% (2431)
Career planning and guidance met my needs. 2009 8.7% (8) 16.7% (1099)
41.3% (38) 38.4% (2528)
16.3% (15) 15.6% (1023)
6.5% (6) 5.4% (354)
27.2% (25) 23.9% (1574)
Career planning and guidance met my needs. 2010 11.7% (9)16.8% (1258)
45.5% (35)37.5% (2812)
23.4% (18)16.6% (1244)
6.5% (5)5.3% (399)
13.0% (10) 23.8% (1783)
Career planning and guidance met my needs. 2011 20.8% (15)16.8% (1339)
43.1% (31)37.6% (2992)
13.9% (10)16.6% (1323)
8.3% (6)5.8% (461)
13.9% (10)23.1% (1834)
Career planning and guidance met my needs. 2012 7.7% (5)15.0% (1307)
56.9% (37)38.3% (3325)
16.9% (11)16.8% (1462)
6.2% (4)6.5% (564)
12.3% (8)23.4% (2034)
Career planning and guidance met my needs. 2013 11.0% (10)17.9%(1688)
46.2% (42)39.8%(3742)
11.0% (10)15.1%(1423)
5.5% (5)5.8% (546)
26.4% (24)21.3%(2006)
46. I am satisfied with the tutoring and academic reinforcement services made available to me by the college/school. 2007
7% (7)15.5% (386)
41% (39)41.1% (1024)
18% (17)13.1% (327)
3% (3)3.8% (94)
30% (28)26.6% (663)
Tutoring services met my needs. 2008 13.2% (14) 23.9% (1347)
9.4% (10) 9.1% (512)
77.4% (82)67.1% (3783)
Tutoring services met my needs. 2009 9.8% (9) 12.2% (802)
37.0% (34) 26.8% (1764)
4.3% (4) 7.6% (500)
3.3% (3) 2.7% (179)
45.7% (42) 50.7% (3333)
Tutoring services met my needs. 2010 5.2% (4)12.2% (916)
24.7% (19)25.5% (1914)
7.8% (6)7.8% (587)
1.3% (1)2.6% (197)
61.0% (0)51.8% (3882)
Tutoring services met my needs. 2011 5.6% (4)12.6% (1004)
13.9% (10)26.9% (2141)
4.2% (3)6.9% (551)
5.6% (4)2.4% (192)
70.8% (51)51.1% (4061)
Tutoring services met my needs. 2012 4.6% (3)11.6% (1008)
30.8% (20)27.2% (2366)
7.7% (5)7.7% (671)
1.5% (1)2.8% (246)
55.4% (36)50.6% (4401)
Tutoring services met my needs. 2013 3.3% (3)14.4%(1354)
17.6% (16)29.4%(2768)
5.5% (5)7.2% (678)
2.2% (2)2.6% (245)
71.4% (65)46.4%(4360)
47. I am satisfied with the financial aid advisement and guidance made available to me by the college/school. 2007
9% (8)16.2% (403)
50% (47)45.7% (1140)
24% (23)18.2% (454)
9% (8)8.6% (214)
9% (8)11.3% (283)
The financial aid advising met my needs. 2008 48.1% (51) 56.4% (3180)
20.8% (22) 19.1% (1079)
31.1% (33)24.5% (1383)
Financial aid advising met my needs. 2009 7.6% (7) 17.5% (1149)
53.3% (49) 44.8% (2950)
10.9% (10) 12.9% (847)
2.2% (2) 6.4% (422)
26.1% (24) 18.4% (1210)
Financial aid advising met my needs. 2010 10.4% (8)18.4% (1379)
54.5% (42)44.4% (3328)
11.7% (9)12.2% (916)
3.9% (3)6.1% (457)
19.5% (15)18.9% (1416)
Financial aid advising met my needs. 2011 9.7% (7)19.4% (1542)
41.7% (30)45.2% (3594)
18.1% (13)10.9% (867)
6.9% (5)5.5% (438)
23.6% (17)19.0% (1508)
Financial aid advising met my needs. 2012 6.2% (4)17.6% (1529)
38.5% (25)46.5% (4041)
13.8% (9)11.9% (1038)
6.2% (4)5.4% (470)
35.4% (23)18.6% (1614)
Financial aid advising met my needs. 2013 5.5% (5)19.6%(1846)
40.7% (37)46.3%(4354)
7.7% (7)10.4% (979)
5.5% (5)5.8% (545)
40.7% (37)17.9%(1681)
48. I am satisfied with the student health and wellness services (e.g., counseling services, campus pharmacy, primary care clinics, etc.) made available to me by the college/school. 2007
19% (18)18.4% (459)
48% (45)44.7% (1115)
12% (11)12.0% (299)
6% (6)6.4% (160)
15% (14)18.5% (460)
The student health and wellness services (e.g. immunizations, counseling services, campus pharmacy, primary care clinics, etc.) met my needs. 2008
72.6% (77) 63.4% (3577)
12.3% (13) 12.6% (710)
15.1% (16)24.0% (1355)
Student health and wellness services (e.g. immunizations, counseling, primary care clinics, etc.) met my needs. 2009
20.7% (19) 24.7% (1624)
59.8% (55) 49.1% (3228) 5.4% (5)
7.3% (478)
2.2% (2) 3.9% (258)
12.0% (11) 15.1% (990)
Student health and wellness services (e.g. immunizations, counseling, primary care clinics, etc.) met my needs. 2010
19.5% (15)25.0% (1872)
64.9% (50)47.9% (3591)
9.1% (7)7.9% (589)
3.9% (3)3.3% (250)
2.6% (2)15.9% (1194)
Student health and wellness services (e.g. immunizations, counseling, primary care clinics, etc.) met my needs. 2011
22.2% (16)25.4% (2023)
55.6% (40)49.2% (3913)
9.7% (7)7.0% (556)
2.8% (2)3.2% (256)
9.7% (7)15.1% (1201)

Student health and wellness services (e.g. immunizations, counseling, primary care clinics, etc.) met my needs. 2012
18.5% (12)24.5% (2130)
52.3% (34)49.5% (4301)
18.5% (12)6.7% (582)
0.0% (0)3.5% (300)
10.8% (7)15.9% (1379)
Student health and wellness services (e.g. immunizations, counseling, primary care clinics, etc.) met my needs. 2013
15.4% (14)25.6%(2403)
54.9% (50)48.6%(4569)
7.7% (7)6.6% (620)
2.2% (2)3.6% (334)
19.8% (18)15.7%(1479)
SECTION V: The Student Experience
Indicate the degree to which you agree or disagree with these statements.* The top line indicates Drake survey results and the bottom line indicates the National survey results (Private and Public).
Strongly Agree Agree Disagree Strongly Disagree Unable to Comment49. The college/school of pharmacy provided timely information about news, events and important matters within the college/school of pharmacy. 2007
30% (28)27.5% (771)
68% (64)58.9% (1651)
2% (2)9.1% (254)
0% (0)2.9% (82)
0% (0)1.7% (47)
The college/school of pharmacy provided timely information about news, events and important matters within the college/school of pharmacy. 2008
96.2% (102) 85.5% (4822)
0.9% (1) 11.9% (669)
2.8% (3)2.7% (151)
The college/school of pharmacy provided timely information about news, events and important matters within the college/school of pharmacy. 2009
43.5% (40) 34.7% (2282)
55.4% (51) 56.4% (3707)
0.0% (0) 6.2% (407)
0.0% (0) 1.7% (115)
1.1% (1) 1.0% (67)
The college/school of pharmacy provided timely information about news, events and important matters within the college/school of pharmacy. 2010
39.0 (30)36.1% (2704)
57.01% (44)55.3% (4144)
1.3% (1)6.1% (454)
1.3% (1)1.6% (121)
1.3% (1)1.0% (73)
The college/school of pharmacy provided timely information about news, events and important matters within the college/school of pharmacy. 2011
40.3% (29)38.0% (3023)
55.6% (40)53.4% (4246)
1.4% (1)5.6% (448)
1.4% (1)1.7% (139)
1.4% (1)1.2% (93)
The college/school of pharmacy provided timely information about news, events and important matters within the college/school of pharmacy. 2012
35.4% (23)33.8% (2937)
63.1% (41)56.4% (4905)
0.0% (0)6.6% (577)
0.0% (0)1.9% (166)
1.5% (1)1.2% (107)
The college/school of pharmacy provided timely information about news, events and important matters within the college/school of pharmacy. 2013
46.2% (42)33.9%(3190)
50.5% (46)56.6%(5324)
2.2% (2)6.3% (594)
0.0% (0)2.0% (191)
1.1% (1)1.1% (106)
50. Information was made available to me regarding post-graduate education and training opportunities (e.g., residencies, fellowships, graduate school). 2007
29% (27)29.4% (825)
63% (59)57.3% (1608)
7% (7)9.0% (253)
1% (1)2.0% (55)
0% (0)2.2% (63)
Information was made available to me regarding post-graduate education and training opportunities (e.g., residencies, fellowships, graduate school). 2008
93.4% (99) 86.6% (4887)
4.7% (5) 10.4% (586)
1.9% (2)3.0% (169)
Information was made available to me about additional educational opportunities (e.g., residencies, fellowships, graduate school). 2009
38.0% (35) 36.4% (2395)
55.4% (51) 53.8% (3541)
5.4% (5) 7.0% (461)
1.1% (1) 1.5% (100)
0.0% (0) 1.2% (81)
Information was made available to me about additional educational opportunities (e.g., residencies, fellowships, graduate school). 2010
39.0% (30)37.3% (2797)
57.1% (44)54.0% (4047)
2.6% (2)6.2% (464)
1.3% (1)1.5% (116)
0.0% (0)1.0% (74)
Information was made available to me about additional educational opportunities (e.g., residencies, fellowships, graduate school). 2011
38.9% (28)38.2% (3035)
48.6% (35)52.9% (4202)
9.7% (7)6.1% (486)
1.4% (1)1.6% (128)
1.4% (1)1.2% (98)
Information was made available to me about additional educational opportunities (e.g., residencies, fellowships, graduate school). 2012
36.9% (24)35.4% (3077)
56.9% (37)54.7% (4758)
4.6% (3)6.8% (588)
1.5% (1)1.9% (169)
0.0% (0)1.2% (100)
Information was made available to me about additional educational opportunities (e.g., residencies, fellowships, graduate school). 2013
41.8% (38)36.1%(3396)
47.3% (43)55.2%(5189)
9.9% (9)5.8% (547)
0.0% (0)1.6% (146)
1.1% (1)1.4% (127)
51. The college/school's administration responded to problems and issues of concern to the student body. 2007
16% (15)20.0% (560)
65% (61)52.8% (1482)
10% (9)14.4% (405)
0% (0)8.0% (225)
10% (9)4.7% (133)
The college/school's administration responded to problems and issues of concern to the student body. 2008
72.6% (77) 71.5% (4036)
12.3% (13)21.6% (1218)
15.1% (16)6.9% (388)
The college/school's administration responded to problems and issues of concern to the student body. 2009
19.6% (18) 26.1% (1716)
65.2% (60)53.4% (3515)
7.6% (7) 11.8% (779)
1.1% (1) 4.7% (310)
6.5% (6) 3.9% (258)
The college/school's administration responded to problems and issues of concern to the student body. 2010
19.5% (15)27.8% (2081)
67.5% (52)53.8% (4031)
7.8% (6)10.8% (806)
1.3% (1)4.0% (300)
3.9% (3)3.7% (278)
The college/school's administration responded to problems and issues of concern to the student body. 27.8% (20) 54.2% (39) 5.6% (4) 5.6% (4) 6.9% (5)

2011 28.9% (2301) 52.0% (4132) 10.7% (848) 4.1% (326) 4.3% (342)The college/school's administration responded to problems and issues of concern to the student body. 2012
21.5% (14)25.8% (2246)
60.0% (39)54.0% (4696)
9.2% (6)11.8% (1029)
1.5% (1)4.3% (374)
7.7% (5)4.0% (347)
The college/school's administration responded to problems and issues of concern to the student body. 2013
27.5% (25)28.0%(2636)
62.6% (57)53.7%(5047)
3.3% (3)10.5% (989)
3.3% (3)4.4% (410)
3.3% (3)3.4% (323)
52. A clear process existed for students to follow when raising issues with the college/school administration. 2007
11% (10)18.1% (507)
45% (42)47.1% (1322)
22% (21)19.4% (544)
0% (0)7.1% (199)
22% (21)8.3% (232)
I was aware of the process for raising issues with the college/school administration. 2008 60.4% (64) 73.1% (4123)
25.5% (27) 19.4% (1095)
14.2% (15)7.5% (424)
I was aware of the process for raising issues with the college/school administration. 2009 16.3% (15) 24.9% (1638)
62.0% (57) 53.7% (3533)
13.0% (12)14.3% (938)
2.2% (2) 2.7% (180)
6.5% (6) 4.4% (289)
I was aware of the process for raising issues with the college/school administration. 2010 13.0% (10)26.1% (1954)
59.7% (46)54.1% (4057)
20.8% (16)13.7% (1029)
1.3% (1)2.3% (174)
5.2% (4)3.8% (282)
I was aware of the process for raising issues with the college/school administration. 2011 27.8% (20)26.6% (2115)
41.7% (30)54.3% (4317)
13.9% (10)12.1% (959)
8.3% (6)2.6% (206)
8.3% (6)4.4% (352)
I was aware of the process for raising issues with the college/school administration. 2012 16.9% (11)25.3% (2201)
61.5% (40)54.1% (4705)
12.3% (8)13.1% (1142)
3.1% (2)3.2% (282)
6.2% (4)4.2% (362)
I was aware of the process for raising issues with the college/school administration. 2013 20.9% (19)26.2%(2462)
50.5% (46)55.0%(5173)
23.1% (21)12.1%(1140)
1.1% (1)2.8% (266)
4.4% (4)3.9% (364)
53. I was aware that student representatives served on college/school committees with responsibility for curriculum and other matters. 2007
26% (24)28.6% (801)
66% (62)57.7% (1618)
7% (7)9.0% (953)
1% (1)2.5% (69)
0% (0)2.3% (64)
I was aware that student representatives served on college/school committees with responsibility for curriculum and other matters. 2008
87.7% (93) 87.1% (4915)
7.5% (8) 10.1% (569)
4.7% (5)2.8% (158)
I was aware that student representatives served on college/school committees with responsibility for curriculum and other matters. 2009
33.7% (31 32.9% (2161)
64.1% (59) 57.2% (3763)
2.2% (2) 6.4% (420)
0.0% (0) 1.9% (123)
0.0% (0) 1.7% (111)
I was aware that student representatives served on college/school committees with responsibility for curriculum and other matters. 2010
26.0% (20)34.8% (2608)
68.8% (53)56.3% (4220)
2.6% (2)5.7% (431)
1.3% (1)1.4% (108)
1.3% (1)1.7% (129)
I was aware that student representatives served on college/school committees with responsibility for curriculum and other matters. 2011
37.5% (27)36.0% (2860)
56.9% (41)55.3% (4399)
4.2% (3)5.3% (423)
1.4% (3)1.5% (119)
0.0% (0)1.9% (148)
I was aware that student representatives served on college/school committees with responsibility for curriculum and other matters. 2012
41.5% (27)33.8% (2940)
53.8% (35)56.6% (4924)
4.6% (3)6.1% (529)
0.0% (0)1.9% (169)
0.0% (0)1.5% (130)
I was aware that student representatives served on college/school committees with responsibility for curriculum and other matters. 2013
33.0% (30)34.0%(3202)
60.4% (55)56.4%(5304)
4.4% (4)6.0% (561)
1.1% (1)2.0% (184)
1.1% (1)1.6% (154)
54. The college/school of pharmacy provided an environment and culture that promoted mutual respect among students and other members of the college/school community (e.g., faculty, administrators, staff). 2007
24% (23)25.9% (727)
67% (63)57.5% (1613)
3% (3)9.9% (277)
1% (1)4.4% (123)
4% (4)2.2% (63)
The college/school of pharmacy is welcoming to students with diverse backgrounds. 2008 88.7% (94) 91.6% (5167)
2.8% (3) 4.6% (260)
8.5% (9)3.8% (215)
The college/school of pharmacy is welcoming to students with diverse backgrounds.2009 35.9% (33) 44.4% (2919)
59.8% (55) 49.3% (3246)
3.3% (3) 2.7% (176)
0.0% (0) 1.3% (83)
1.1% (1) 2.3% (154)
The college/school of pharmacy is welcoming to students with diverse backgrounds. 2010 36.4% (28)46.0% (3448)
54.5% (42)48.5% (3633)
0.0% (0)2.4% (178)
1.3% (1)1.0% (74)
7.8% (6)2.2% (163)
The college/school of pharmacy is welcoming to students with diverse backgrounds. 2011 43.1% (31)46.8% (3717)
44.4% (32)47.9% (3809)
4.2% (3)2.1% (169)
0.0% (0)1.1% (85)
8.3% (6)2.1% (169)
The college/school of pharmacy is welcoming to students with diverse backgrounds. 2012 41.5% (27)44.9% (3901)
52.3% (34)49.9% (4333)
1.5% (1)2.2% (193)
0.0% (0)1.3% (113)
4.6% (3)1.7% (152)
The college/school of pharmacy is welcoming to students with diverse backgrounds. 2013 42.9% (39)45.4%(4267)
44.0% (40)49.9%(4690)
4.4% (4)2.0% (184)
1.1% (1)1.0% (98)
7.7% (7)1.8% (166)
55. The admissions process of the college/school of pharmacy was satisfactory and well organized 22% (21) 63% (59) 10% (9) 1% (1) 4% (4)

2007 25.0% (700) 59.8% (1676) 8.1% (227) 3.4% (94) 3.7% (105)
The admissions process of the college/school of pharmacy was well organized. 2008 84.0% (89) 83.1% (4691)
6.6% (7) 10.8% (612)
9.4% (10)6.0% (339)
The admissions process of the college/school of pharmacy was well organized. 2009 27.2% (25) 35.5% (2334)
64.1% (59) 53.6% (3524)
3.3% (3) 5.5% (359)
0.0% (0) 2.1% (138)
5.4% (5) 3.4% (223)
The admissions process of the college/school of pharmacy was well organized. 2010 31.2% (24)37.9% (2841)
61.0% (47)51.5% (3858)
0.0% (0)5.4% (405)
1.3% (1)2.3% (176)
6.5% (5)2.9% (216)
The admissions process of the college/school of pharmacy was well organized. 2011 30.6% (22)38.2% (3037)
55.6% (40)52.8% (4201)
4.2% (3)4.2% (336)
2.8% (2)1.8% (142)
6.9% (5)2.9% (233)
The admissions process of the college/school of pharmacy was well organized. 2012 40.0% (26)37.2% (3233)
53.8% (35)53.2% (4620)
1.5% (1)4.9% (430)
0.0% (0)1.8% (155)
4.6% (3)2.9% (254)
The admissions process of the college/school of pharmacy was well organized. 2013 35.2% (32)37.9%(3568)
59.3% (54)53.5%(5031)
4.4% (4)4.6% (432)
0.0% (0)1.7% (162)
1.1% (1)2.3% (212)
56. The college/school of pharmacy had a student government that effectively communicated student opinions and perspectives to the faculty or administration. 2007
11% (10)21.0% (588)
51% (48)53.8% (1509)
14% (13)12.6% (354)
2% (2)3.7% (104)
22% (21)8.9% (250)
The college/school of pharmacy had a student government that effectively communicated student opinions and perspectives to the faculty or administration. 2008
63.2% (67) 74.6% (4209)
9.4% (10) 14.7% (827)
27.4% (29)10.7% (606)
The college/school of pharmacy had a student government that effectively communicated student opinions and perspectives to the faculty or administration. 2009
17.4% (16) 29.8% (1957)
63.0% (58) 52.4% (3449)
8.7% (8) 8.8% (582)
1.1% (1) 3.0% (198)
9.8% (9) 6.0% (392)
The college/school of pharmacy had a student government that effectively communicated student opinions and perspectives to the faculty or administration. 2010
15.6% (12)30.8% (2308)
55.8% (43)50.6% (3791)
13.0% (10) 8.6% (645)
1.3% (1)2.6% (192)
14.3% (11)7.5% (560)
The college/school of pharmacy had a student government that effectively communicated student opinions and perspectives to the faculty or administration. 2011
27.8% (20)31.5% (2504)
50.0% (36)52.1% (4145)
5.6% (4)7.5% (597)
6.9% (5)2.4% (191)
9.7% (7)6.4% (512)
The college/school of pharmacy had a student government that effectively communicated student opinions and perspectives to the faculty or administration. 2012
24.6% (16)29.9% (2598)
53.8% (35)52.5% (4562)
10.8% (7)8.4% (734)
1.5% (1)2.7% (231)
9.2% (6)6.5% (567)
The college/school of pharmacy had a student government that effectively communicated student opinions and perspectives to the faculty or administration. 2013
25.3% (23)31.3%(2948)
56.0% (51)53.4%(5018)
5.5% (5)8.0% (749)
1.1% (1)2.7% (250)
12.1% (11)4.7% (440)
57. The college/school of pharmacy made use of a variety of means (e.g., course evaluations, student surveys, focus groups, meetings with administrative leaders) to obtain student perspectives on curriculum, student services, faculty/student relationships and other aspects of the program. 2007
21% (20)25.6% (717)
69% (65)59.6% (1668)
5% (5)9.6% (269)
0% (0)3.0% (84)
4% (4)2.2% (63)
The college/school of pharmacy made use of a variety of means (e.g., course evaluations, student surveys, focus groups, meetings with administrative leaders) to obtain student perspectives on curriculum, student services, faculty/student relationships and other aspects of the program. 2008
84.9% (90) 84.7% (4776)
10.4% (11) 11.5% (651)
4.7% (5)3.8% (215)
The college/school of pharmacy made use of a variety of means (e.g., course evaluations, student surveys, focus groups, meetings with administrative leaders) to obtain student perspectives on curriculum, student services, faculty/student relationships and other aspects of the program. 2009
29.3% (27) 36.0% (2368)
64.1% (59) 53.5% (3522)
5.4% (5) 6.7% (444)
0.0% (0) 2.1% (138)
1.1% (1) 1.6% (106)
The college/school of pharmacy made use of a variety of means (e.g., course evaluations, student surveys, focus groups, meetings with administrative leaders) to obtain student perspectives on curriculum, student services, faculty/student relationships and other aspects of the program. 2010
28.6% (22)37.6% (2821)
62.3% (48)52.0% (3899)
6.5% (5)6.4% (478)
2.6% (2)2.0% (151)
0.0% (0)2.0% (147)
The college/school of pharmacy made use of a variety of means (e.g., course evaluations, student surveys, focus groups, meetings with administrative leaders) to obtain student perspectives on curriculum, student services, faculty/student relationships and other aspects of the program. 2011
40.3% (29)
39.2% (3114)
48.6% (35)51.7% (4110)
6.9% (5)5.4% (426)
1.4% (1)1.8% (146)
2.8% (2)1.9% (153)
The college/school of pharmacy made use of a variety of means (e.g., course evaluations, student surveys, focus groups, meetings with administrative leaders) to obtain student perspectives on curriculum, student services, faculty/student relationships and other aspects of the program. 2012
41.5% (27)36.6% (3185)
53.8% (35)53.6% (4659)
3.1% (2)6.0% (518)
0.0% (0)1.8% (157)
1.5% (1)2.0% (173)
The college/school of pharmacy made use of a variety of means (e.g., course evaluations, student surveys, focus groups, meetings with administrative leaders) to obtain student perspectives on curriculum, student services, faculty/student relationships and other aspects of the program. 2013
40.7% (37)36.9%(3468)
53.8% (49)54.1%(5092)
3.3% (3)5.6% (530)
0.0% (0)1.8% (169)
2.2% (2)1.6% (146)
58. Faculty, administrators and staff were committed to serving as positive role models for students. 2007
43% (40)30.2% (846)
54% (51)57.4% (1610)
3% (3)8.0% (225)
0% (0)2.1% (60)
0% (0)2.2% (63)
Faculty, administrators and staff were committed to serving as positive role models for students. 2008
95.3% (101) 87.2% (4919)
2.8% (3) 9.9% (556)
1.9% (2)2.9% (166)

Faculty, administrators and staff were committed to serving as positive role models for students. 2009
42.4% (39) 37.7% (2478)
54.3% (50) 54.7% (3601)
3.3% (3) 4.8% (317)
0.0% (0) 1.6% (108)
0.0% (0) 1.1% (74)
Faculty, administrators and staff were committed to serving as positive role models for students. 2010
44.2% (34)39.4% (2951)
53.2% (41)52.9% (3967)
2.6% (2)4.9% (371)
0.0% (0)1.5% (115)
0.0% (0)1.2% (92)
Faculty, administrators and staff were committed to serving as positive role models for students. 2011
40.3% (29)39.7% (3156)
55.6% (40)52.6% (4182)
4.2% (3)4.9% (392)
0.0% (0)1.4% (108)
0.0% (0)1.4% (111)
Faculty, administrators and staff were committed to serving as positive role models for students. 2012
47.7% (31)40.0% (3475)
52.3% (34)52.7% (4580)
0.0% (0)4.4% (386)
0.0% (0)1.5% (131)
0.0% (0)1.4% (120)
Faculty, administrators and staff were committed to serving as positive role models for students. 2013
53.8% (49)39.0%(3666)
44.0% (40)53.1%(4993)
1.1% (1)4.6% (433)
0.0% (0)2.0% (188)
1.1% (1)1.3% (125)
59. Overall, preceptors modeled professional attributes and behaviors in the pharmacy practice experiences. 2007
45% (42)35.0% (983)
53% (50)60.2% (1689)
2% (2)3.0% (84)
0% (0)0.9% (26)
0% (0)0.8% (23)
Overall, preceptors modeled professional attributes and behaviors in the pharmacy practice experiences. 2008
99.1% (105) 94.4% (5324)
0.0% (0) 4.6% (261)
0.9% (1)1.0% (57)
Overall, preceptors modeled professional attributes and behaviors in the pharmacy practice experiences. 2009
48.9% (45) 41.2% (2708)
51.1% (47) 55.0% (3618)
0.0% (0) 2.3% (151)
0.0% (0) 1.1% (71)
0.0% (0) 0.5% (30)
Overall, preceptors modeled professional attributes and behaviors in the pharmacy practice experiences. 2010
49.4% (38)43.1% (3229)
48.1% (37)53.4% (4006)
1.3% (1)2.3% (172)
1.3% (1)0.7% (51)
0.0% (0)0.5% (38)
Overall, preceptors modeled professional attributes and behaviors in the pharmacy practice experiences. 2011
45.8% (33)43.1% (3429)
52.8% (38)53.4% (4248)
1.4% (1)2.0% (159)
0.0% (0)0.7% (55)
0.0% (0)0.7% (58)
Overall, preceptors modeled professional attributes and behaviors in the pharmacy practice experiences. 2012
47.7% (31)42.9% (3731)
52.3% (34)53.5% (4654)
0.0% (0)2.3% (199)
0.0% (0)0.7% (59)
0.0% (0)0.6% (49)
Overall, preceptors modeled professional attributes and behaviors in the pharmacy practice experiences. 2013
57.1% (52)42.6%(4003)
41.8% (38)53.5%(5031)
0.0% (0)2.4% (229)
0.0% (0)0.9% (81)
1.1% (1)0.6% (61)
60. Overall, preceptors provided me with individualized instruction, guidance and evaluation that met my needs as a Doctor of Pharmacy student. 2007
40% (38)33.5% (940)
53% (50)59.1% (1659)
3% (3)5.3% (149)
1% (1)1.0% (29)
2% (2)1.0% (28)
Overall, preceptors provided me with individualized instruction, guidance and evaluation that met my needs as a Doctor of Pharmacy student. 2008
99.1% (105) 92.0% (5189)
0.0% (0) 6.8% (381)
0.9% (1)1.3% (72)
Overall, preceptors provided me with individualized instruction, guidance and evaluation that met my needs as a Doctor of Pharmacy student. 2009
43.5% (40) 39.5% (2600)
52.2% (48) 54.7% (3599)
3.3% (3) 4.1% (269)
0.0% (0) 1.1% (70)
1.1% (1) 0.6% (40)
Overall, preceptors provided me with individualized instruction, guidance and evaluation that met my needs as a Doctor of Pharmacy student. 2010
42.9% (33)41.6% (3116)
53.2% (41)53.1% (3982)
1.3% (1)3.7% (275)
2.6% (2)1.0% (73)
0.0% (0)0.7% (50)
Overall, preceptors provided me with individualized instruction, guidance and evaluation that met my needs as a Doctor of Pharmacy student. 2011
43.1% (31)41.9% (3329)
55.6% (40)53.3% (4235)
1.4% (1)3.2% (256)
0.0% (0)0.9% (69)
0.0% (0)0.8% (60)
Overall, preceptors provided me with individualized instruction, guidance and evaluation that met my needs as a Doctor of Pharmacy student. 2012
50.8% (33)41.6% (3620)
49.2% (32)53.5% (4654)
0.0% (0)3.3% (283)
0.0% (0)0.8% (73)
0.0% (0)0.7% (62)
Overall, preceptors provided me with individualized instruction, guidance and evaluation that met my needs as a Doctor of Pharmacy student. 2013
56.0% (51)42.5%(3997)
42.9% (39)52.9%(4971)
0.0% (0)3.1% (288)
0.0% (0)0.9% (82)
1.1% (1)0.7% (67)
61. I was aware of expected behaviors with respect to professional and academic conduct. 2007 54% (51)46.7% (1309)
46% (43)51.8% (1453)
0% (0)0.9% (26)
0% (0)0.2% (5)
0% (0)0.4% (12)
I was aware of expected behaviors with respect to professional and academic conduct. 2008 99.1% (105) 97.9% (5524)
0.0% (0) 1.5% (86)
0.9% (1)0.6% (32)
I was aware of expected behaviors with respect to professional and academic conduct. 2009 55.4% (51) 52.3% (3436)
43.5% (40) 46.4% (3051)
0.0% (0) 0.7% (46)
1.1% (1) 0.5% (30)
0.0% (0) 0.2% (15)
I was aware of expected behaviors with respect to professional and academic conduct. 2010 54.5% (42)54.0% (4046)
44.2% (34)44.7% (3352)
0.0% (0)0.7% (49)
1.3% (1)0.3% (25)
0.0% (0)0.3% (24)
I was aware of expected behaviors with respect to professional and academic conduct. 2011 50.0% (36) 42.2% (34) 1.4% (1) 1.4% (1) 0.0% (0)
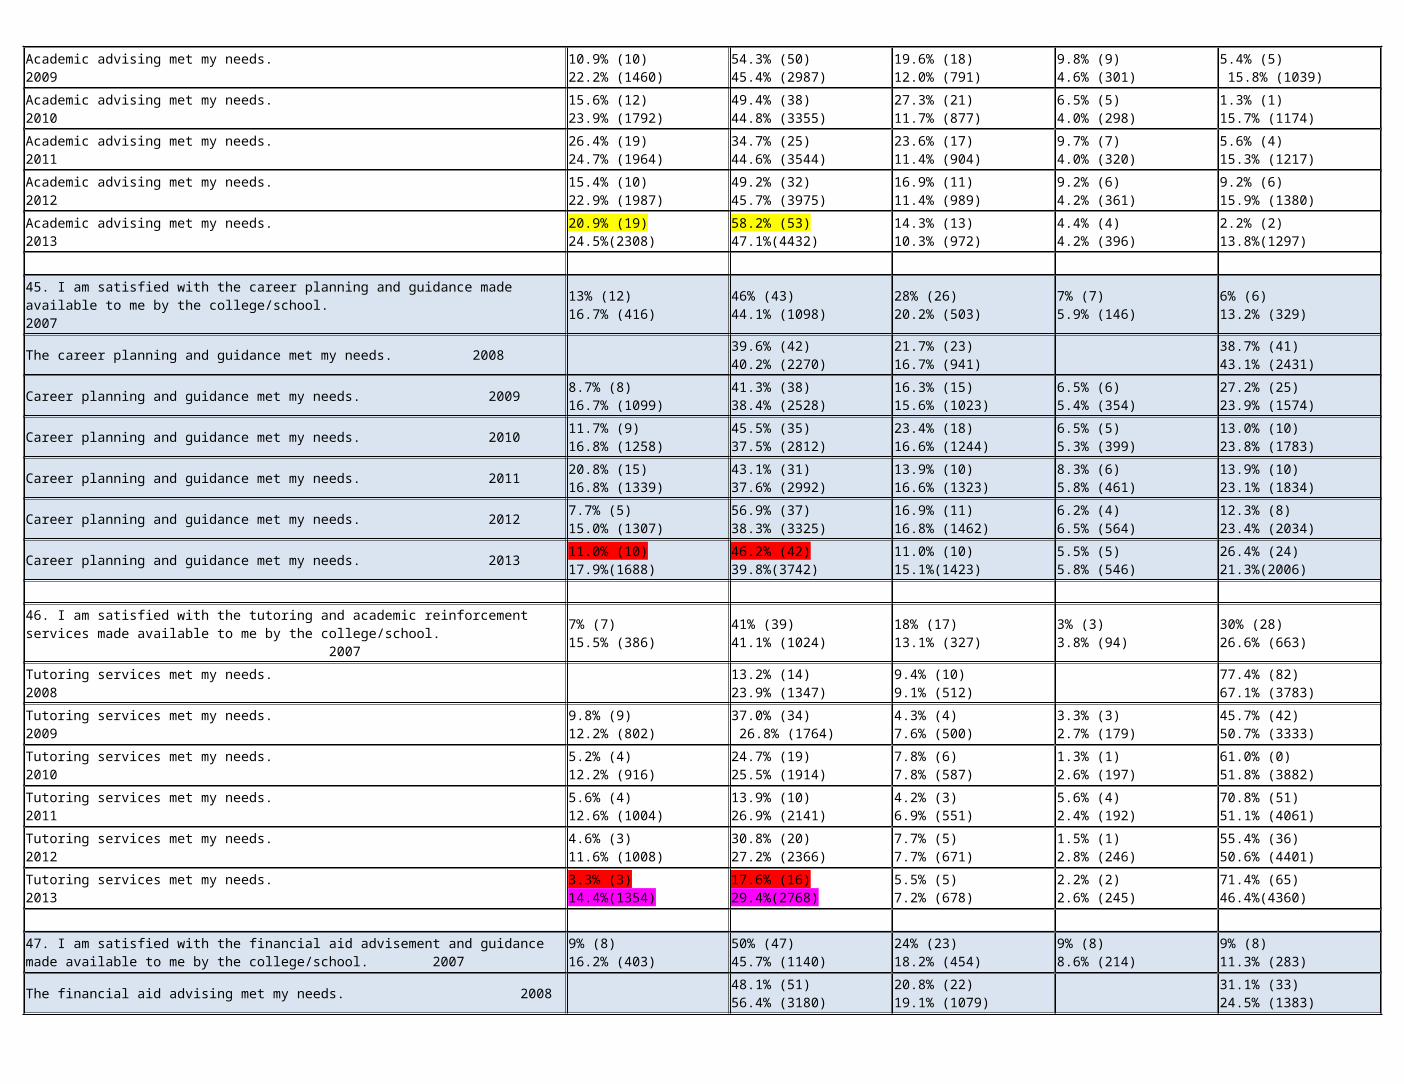
53.6% (4257) 44.8% (3560) 0.8% (60) 0.5% (36) 0.5% (36)
I was aware of expected behaviors with respect to professional and academic conduct. 2012 63.1% (41)52.3% (4549)
36.9% (24)46.2% (4019)
0.0% (0)0.6% (56)
0.0% (0)0.4% (34)
0.0% (0)0.4% (34)
I was aware of expected behaviors with respect to professional and academic conduct. 2013 68.1% (62)51.7%(4861)
29.7% (27)46.4%(4365)
0.0% (0)0.9% (84)
1.1% (1)0.5% (44)
1.1% (1)0.5% (51)
62. The college/school of pharmacy effectively managed academic misconduct by students. 2007
12% (11)18.6% (523)
38% (36)44.6% (1250)
21% (20)13.0% (365)
3% (3)7.2% (202)
26% (24)16.6% (465)
The college/school of pharmacy effectively managed academic misconduct by students. 2008
53.8% (57) 65.2% (3678)
21.7% (23) 16.4% (923)
24.5% (26)18.5% (1041)
The college/school of pharmacy effectively managed academic misconduct by students. 2009
20.7% (19) 26.9% (1771)
46.7% (43) 43.4% (2857)
12.0% (11) 9.5% (626)
4.3% (4) 4.9% (323)
16.3% (15) 15.2% (1001)
The college/school of pharmacy effectively managed academic misconduct by students. 2010
22.1% (17)27.3% (2048)
49.4% (38)42.7% (3198)
5.2% (4)9.0% (672)
1.3% (1)4.9% (371)
22.1% (17)16.1% (1207)
The college/school of pharmacy effectively managed academic misconduct by students. 2011
25.0% (18)28.2% (2239)
38.9% (28)43.0% (3419)
12.5% (9)8.8% (703)
1.4% (1)5.1% (404)
22.2% (16)14.9% (1184)
The college/school of pharmacy effectively managed academic misconduct by students. 2012
33.8% (22)28.3% (2456)
46.2% (30)44.7% (3882)
6.2% (4)8.8% (762)
4.6% (3)4.9% (425)
9.2% (6)13.4% (1167)
The college/school of pharmacy effectively managed academic misconduct by students. 2013
34.1% (31)29.9%(2814)
39.6% (36)46.4%(4360)
2.2% (2)8.2% (771)
1.1% (1)4.5% (427)
23.1% (21)11.0%(1033)
63. The college/school of pharmacy effectively managed professional misconduct by students. 2007
16% (15)17.9% (502)
40% (38)45.3% (1271)
7% (7)11.1% (312)
3% (3)6.8% (191)
33% (31)18.8% (528)
The college/school of pharmacy effectively managed professional misconduct by students. 2008
58.5% (62) 64.5% (3638)
13.2% (14) 15.4% (871)
28.3% (30)20.1% (1133)
The college/school of pharmacy effectively managed professional misconduct by students. 2009
18.5% (17) 25.6% (1686)
54.3% (50) 44.0% (2895)
7.6% (7) 9.2% (602)
0.0% (0) 4.5% (298)
19.6% (18) 16.7% (1097)
The college/school of pharmacy effectively managed professional misconduct by students. 2010
23.4% (18)26.3% (1970)
48.1% (37)43.2% (3241)
6.5% (5)8.3% (625)
1.3% (1)4.4% (333)
20.8% (16)17.7% (1327)
The college/school of pharmacy effectively managed professional misconduct by students. 2011
25.0% (18)27.7% (2201)
27.8% (20)43.7% (3476)
26.4% (19)8.0% (634)
2.8% (2)4.5% (355)
18.1% (13)16.1% (1283)
The college/school of pharmacy effectively managed professional misconduct by students. 2012
32.3% (21)27.5% (2394)
49.2% (32)45.2% (3932)
4.6% (3)8.6% (751)
3.1% (2)4.1% (358)
10.8% (7)14.5% (1257)
The college/school of pharmacy effectively managed professional misconduct by students. 2013
35.2% (32)29.7%(2795)
38.5% (35)46.7%(4396)
5.5% (5)7.5% (704)
1.1% (1)4.3% (403)
19.8% (18)11.8%(1107)
64 The college/school's administration and faculty encouraged me to participate in regional, state or national pharmacy meetings 2007
24% (23)33.9% (949)
61% (57)54.4% (1524)
13% (12)7.6% (212)
0% (0)1.6% (45)
2% (2)2.6% (73)
The college/school's administration and faculty encouraged me to participate in regional, state or national pharmacy meetings 2008
86.8% (92) 86.1% (4858)
7.5% (8) 9.6% (543)
5.7% (6)4.3% (241)
The college/school's administration and faculty encouraged me to participate in regional, state or national pharmacy meetings. 2009
22.8% (21) 39.0% (2566)
70.7% (65) 50.1% (3297)
3.3% (3) 6.6% (435)
2.2% (2) 1.5% (100)
1.1% (1) 2.7% (180)
The college/school's administration and faculty encouraged me to participate in regional, state or national pharmacy meetings. 2010
37.7% (29)40.2% (3011)
50.6% (39)50.5% (3783)
7.8% (6)5.6% (423)
1.3% (1)1.3% (94)
2.6% (2)2.5% (185)
The college/school's administration and faculty encouraged me to participate in regional, state or national pharmacy meetings. 2011
37.5% (27)40.8% (3241)
54.2% (39)50.2% (3993)
6.9% (5)5.0% (397)
1.4% (1)1.4% (109)
0.0% (0)2.6% (209)
The college/school's administration and faculty encouraged me to participate in regional, state or national pharmacy meetings. 2012
40.0% (26)39.1% (3401)
55.4% (36)51.5% (4475)
3.1% (2)5.6% (490)
0.0% (0)1.5% (132)
1.5% (1)2.2% (194)
The college/school's administration and faculty encouraged me to participate in regional, state or national pharmacy meetings. 2013
45.1% (41)39.4%(3709)
46.2% (42)51.5%(4847)
6.6% (6)5.3% (503)
1.1% (1)1.6% (150)
1.1% (1)2.1% (196)
65. The college/school of pharmacy was supportive of student professional organizations 2007 37% (35)41.4% (1160)
55% (52)51.7% (1450)
5% (5)3.0% (85)
0% (0)1.1% (32)
2% (2)2.7% (77)
The college/school of pharmacy was supportive of student professional organizations. 2008 95.3% (101) 92.0% (5190)
1.9% (2) 4.5% (252)
2.8% (3)3.5% (200)

The college/school of pharmacy was supportive of student professional organizations. 2009 37.0% (34) 45.8% (3013)
55.4% (51) 48.8% (3212)
3.3% (3) 2.2% (143)
0.0% (0) 1.0% (65)
4.3% (4) 2.2% (145)
The college/school of pharmacy was supportive of student professional organizations. 2010 46.8% (36)47.6% (3569)
48.1% (37)47.2% (3541)
3.9% (3)2.3% (171)
0.0% (0)1.0% (77)
1.3% 91)1.8% (138)
The college/school of pharmacy was supportive of student professional organizations. 2011 41.7% (30)46.6% (3708)
54.2% (39)48.4% (3848)
2.8% (2)1.9% (149)
0.0% (0)0.9%(71)
1.4% (1)2.2% (173)
The college/school of pharmacy was supportive of student professional organizations. 2012 50.8% (33)44.7% (3883)
49.2% (32)50.2% (4366)
0.0% (0)2.0% (176)
0.0% (0)1.0% (85)
0.0% (0)2.1% (182)
The college/school of pharmacy was supportive of student professional organizations. 2013 52.7% (48)45.2%(4252)
44.0% (40)49.7%(4671)
0.0% (0)2.0% (187)
0.0% (0)1.1% (104)
3.3% (3)2.0% (191)
66. I was aware of opportunities to participate in research activities with faculty. 2007 16% (15)19.7% (552)
41% (39)47.8% (1340)
34% (32)21.4% (601)
3% (3)5.6% (158)
5% (5)5.4% (152)
I was aware of opportunities to participate in research activities with faculty. 2008 50.9% (54) 69.6% (3928)
38.7% (41) 23.2% (1307)
10.4% (11)7.2% (407)
I was aware of opportunities to participate in research activities with faculty. 2009 8.7% (8) 25.5% (1680)
50.0% (46) 45.6% (3001)
29.3% (27) 18.9% (1244)
9.8% (9) 4.8% (318)
2.2% (2) 5.1% (335)
I was aware of opportunities to participate in research activities with faculty. 2010 13.0% (10)26.5% (1990)
42.9% (33)45.9% (3444)
36.4% (28)17.5% (1312)
3.9% (3)5.1% (381)
3.9% (3)4.9% (369)
I was aware of opportunities to participate in research activities with faculty. 2011 18.1% (13)28.4% (2260)
38.9% (28)46.8% (3724)
31.9% (23)16.4% (1302)
9.7% (7)3.8% (306)
1.4% (1)4.5% (357)
I was aware of opportunities to participate in research activities with faculty. 2012 18.5% (12)28.3% (2458)
43.1% (28)48.3% (4199)
30.8% (20)15.5% (1346)
1.5% (1)4.2% (369)
6.2% (4)3.7% (320)
I was aware of opportunities to participate in research activities with faculty. 2013 14.3% (13)30.2%(2838)
42.9% (39)49.4%(4643)
25.3% (23)13.3%(1252)
9.9% (9)3.9% (363)
7.7% (7)3.3% (309)
SECTION VI: Facilities, Experiential Sites and Educational Resources
Indicate the degree to which you agree or disagree with these statements.* The top line indicates Drake survey results and the bottom line indicates the National survey results (Private and Public).
Strongly Agree Agree Disagree Strongly Disagree Unable to Comment67. The physical facilities of the college/school of pharmacy were well maintained, adequately equipped and provided a safe and comfortable environment for teaching and learning in the program. 2007
21% (20)30.5% (855)
60% (56)54.9% (1539)
18% (17)11.1% (312)
1% (1)2.5% (71)
0% (0)1.0% (28)
The campus provided a safe and comfortable environment for teaching and learning. 2008 26.4% (28) 45.2% (2553)
66.0% (70) 47.9% (2701)
4.7% (5) 4.7% (265)
1.9% (2) 1.4% (80)
0.9% (1) 0.8% (43)
My campus learning environment was safe. 2009 32.6% (30) 44.6% (2933)
65.2% (60) 50.2% (3300)
2.2% (2) 3.3% (215)
0.0% (0) 1.1% (70)
0.0% (0) 0.9% (60)
My campus learning environment was safe. 2010 41.6% (32)48.7% (3647)
55.8% (43)47.1% (3529)
1.3% (1)3.0% (223)
1.3% (1)0.8% (61)
0.0% (0)0.5% (36)
My campus learning environment was safe. 2011 44.4% (32)49.1% (3902)
52.8% (38)46.0% (3656)
2.8% (2)3.3% (264)
0.0% (0)0.9% (70)
0.0% (0)0.7% (57)
My campus learning environment was safe. 2012 40.0% (26)47.0% (4084)
58.5% (38)47.7% (4148)
1.5% (1)3.5% (305)
0.0% (0)1.0% (89)
0.0% (0)0.8% (66)
My campus learning environment was safe. 2013 39.6% (36)45.5%(4278)
57.1% (52)48.7%(4578)
2.2% (2)3.7% (346)
1.1% (1)1.2% (115)
0.0% (0)0.9% (88)
68. The computer and other information technology resources provided by the college/school of pharmacy and/or elsewhere on campus met my needs. 2007
39% (37)31.2% (874)
54% (51)53.3% (1496)
6% (6)11.4% (321)
0% (0)3.7% (103)
0% (0)0.4% (11)
The computer and other information technology resources provided by the college/school of pharmacy and/or elsewhere on campus met my needs. 2008
31.1% (33) 40.0% (2258)
50.0% (53) 46.6% (2628)
13.2% (14) 9.7% (549)
3.8% (4) 3.0% (169)
1.9% (2) 0.7% (38)

The computer and other information technology resources provided by the college/school of pharmacy and/or elsewhere on campus were conducive to learning. 2009
45.7% (42)41.7% (2746)
53.3% (49) 50.3% (3312)
1.1% (1) 5.9% (390)
0.0% (0) 1.5% (99)
0.0% (0) 0.5% (31)
The computer and other information technology resources provided by the college/school of pharmacy and/or elsewhere on campus were conducive to learning. 2010
48.1% (37)42.8% (3210)
49.4% (38)49.0% (3674)
1.3% (1)5.9% (442)
1.3% (1)1.9% (139)
0.0% (0)0.4% (31)
The computer and other information technology resources provided by the college/school of pharmacy and/or elsewhere on campus were conducive to learning. 2011
41.7% (30)42.7% (3393)
51.4% (37)49.3% (3916)
4.2% (3)5.6% (444)
1.4% (1)1.7% (137)
1.4% (1)0.7% (59)
The computer and other information technology resources provided by the college/school of pharmacy and/or elsewhere on campus were conducive to learning. 2012
52.3% (34)40.3% (3502)
46.2% (30)50.3% (4373)
1.5% (1)6.5% (567)
0.0% (0)2.2% (190)
0.0% (0)0.7% (60)
The computer and other information technology resources provided by the college/school of pharmacy and/or elsewhere on campus were conducive to learning. 2013
46.2% (42)39.4%(3701)
48.4% (44)51.1%(4806)
4.4% (4)6.7% (634)
0.0% (0)2.1% (199)
1.1% (1)0.7% (65)
69. The laboratories and other simulated environments (e.g., model pharmacy) of the college/school of pharmacy met my needs. 2007
14% (13)25.5% (715)
66% (62)57.4% (1611)
15% (14)11.8% (332)
4% (4)3.6% (100)
1% (1)0.4% (11)
The laboratories and other simulated environments (e.g., model pharmacy) of the college/school of pharmacy met my needs. 2008
8.5% (9) 33.1% (1865)
61.3% (65) 50.4% (2842)
23.6% (25) 11.2% (631)
2.8% (3) 3.0% (171)
3.8% (4) 2.4% (133)
The laboratories and other non-classroom environments were conducive to learning. 2009 20.7% (19) 36.2% (2381)
75.0% (69) 56.4% (3712)
4.3% (4) 4.9% (323)
0.0% (0) 1.5% (96)
0.0% (0) 1.0% (66)
The laboratories and other non-classroom environments were conducive to learning. 2010 32.5% (25)39.2% (2941)
66.2% (51)53.5% (4011)
1.3% (1)5.1% (385)
0.0% 90)1.1% (84)
0.0% (0)1.0% (75)
The laboratories and other non-classroom environments were conducive to learning. 2011 31.9% (23)40.8% (3245)
63.9% (46)52.9% (4206)
4.2% (3)4.1% (323)
0.0% 1.0% (80)
0.0% 1.2% (95)
The laboratories and other non-classroom environments were conducive to learning. 2012 47.7% (31)39.3% (3414)
52.3% (34)54.0% (4692)
0.0% (0)4.3% (372)
0.0% (0)1.3% (113)
0.0% (0)1.2% (101)
The laboratories and other non-classroom environments were conducive to learning. 2013 37.4% (34)39.7%(3737)
60.4% (55)54.5%(5124)
1.1% (1)3.4% (320)
0.0% (0)1.1% (103)
1.1% (1)1.3% (121)
70. The classrooms in the college/school of pharmacy or elsewhere on campus met my needs.2008
9.4% (10) 34.2% (1930)
59.4% (63) 52.8% (2980)
24.5% (26) 9.9% (558)
5.7% (6) 2.2% (124)
0.9% (1)0.9% (50)
The classrooms in the college/school of pharmacy or elsewhere on campus were conducive to learning. 2009
17.4% (16) 35.9% (2359)
63.0% (58) 54.1% (3558)
18.5% (17) 7.8% (512)
1.1% (1) 1.7% (114)
0.0% (0) 0.5% (35)
The classrooms in the college/school of pharmacy or elsewhere on campus were conducive to learning. 2010
26.0% (20)38.8% (2911)
67.5% (52)52.7% (3954)
2.6% (2)6.5% (487)
3.9% (3)1.5% (109)
0.0% (0)0.5% (35)
The classrooms in the college/school of pharmacy or elsewhere on campus were conducive to learning. 2011
23.6% (17)40.8% (3244)
48.6% (35)51.0% (4054)
23.6% (17)6.2% (494)
4.2% (3)1.4% (115)
0.0% (0)0.5% (42)
The classrooms in the college/school of pharmacy or elsewhere on campus were conducive to learning. 2012
41.5% (27)38.5% (3344)
58.5% (38)53.0% (4609)
0.0% (0)6.1% (531)
0.0% (0)1.6% (139)
0.0% (0)0.8% (69)
The classrooms in the college/school of pharmacy or elsewhere on campus were conducive to learning. 2013
38.5% (35)39.2%(3685)
57.1% (52)53.0%(4986)
2.2% (2)5.5% (518)
1.1% (1)1.6% (151)
1.1% (1)0.7% (65)
71. The study areas available in the college/school of pharmacy or elsewhere on campus met my needs. 2007
13% (12)26.6% (746)
69% (65)53.7% (1506)
13% (12)13.3% (372)
4% (4)4.5% (127)
1% (1)1.9% (54)
The study areas in the college/school of pharmacy or elsewhere on campus met my needs. 2008
12.3% (13) 31.9% (1800)
66.0% (70) 47.2% (2662)
17.9% (19) 14.1% (798)
2.8% (3) 4.8% (268)
0.9% (1) 2.0% (114)
The study areas in the college/school of pharmacy or elsewhere on campus were conducive to learning. 2009
29.3% (27) 35.4% (2327)
58.7% (54) 52.0% (3420)
9.8% (9) 8.3% (548)
1.1% (1) 2.9% (189)
1.1% (1) 1.4% (94)
The study areas in the college/school of pharmacy or elsewhere on campus were conducive to learning. 2010
35.1% (27)36.8% (2759)
58.4% (45)50.1% (3759)
1.3% (1)8.7% (653)
2.6% (2)3.1% (233)
2.6% (2)1.2% (92)
The study areas in the college/school of pharmacy or elsewhere on campus were conducive to learning. 2011
33.3% (24)38.2% (3036)
51.4% (37)49.9% (3965)
11.1% (8)7.9% (627)
2.8% (2)2.5% (202)
1.4% (1)1.5% (119)
The study areas in the college/school of pharmacy or elsewhere on campus were conducive to learning. 2012
38.5% (25)36.1% (3136)
52.3% (34)51.3% (4462)
7.7% (5)7.7% (667)
1.5% (1)3.3% (287)
0.0% (0)1.6% (140)
The study areas in the college/school of pharmacy or elsewhere on campus were conducive to learning. 2013
39.6% (36)36.9%(3473)
50.5% (46)51.4%(4831)
8.8% (8)7.3% (688)
0.0% (0)3.1% (290)
1.1% (1)1.3% (123)
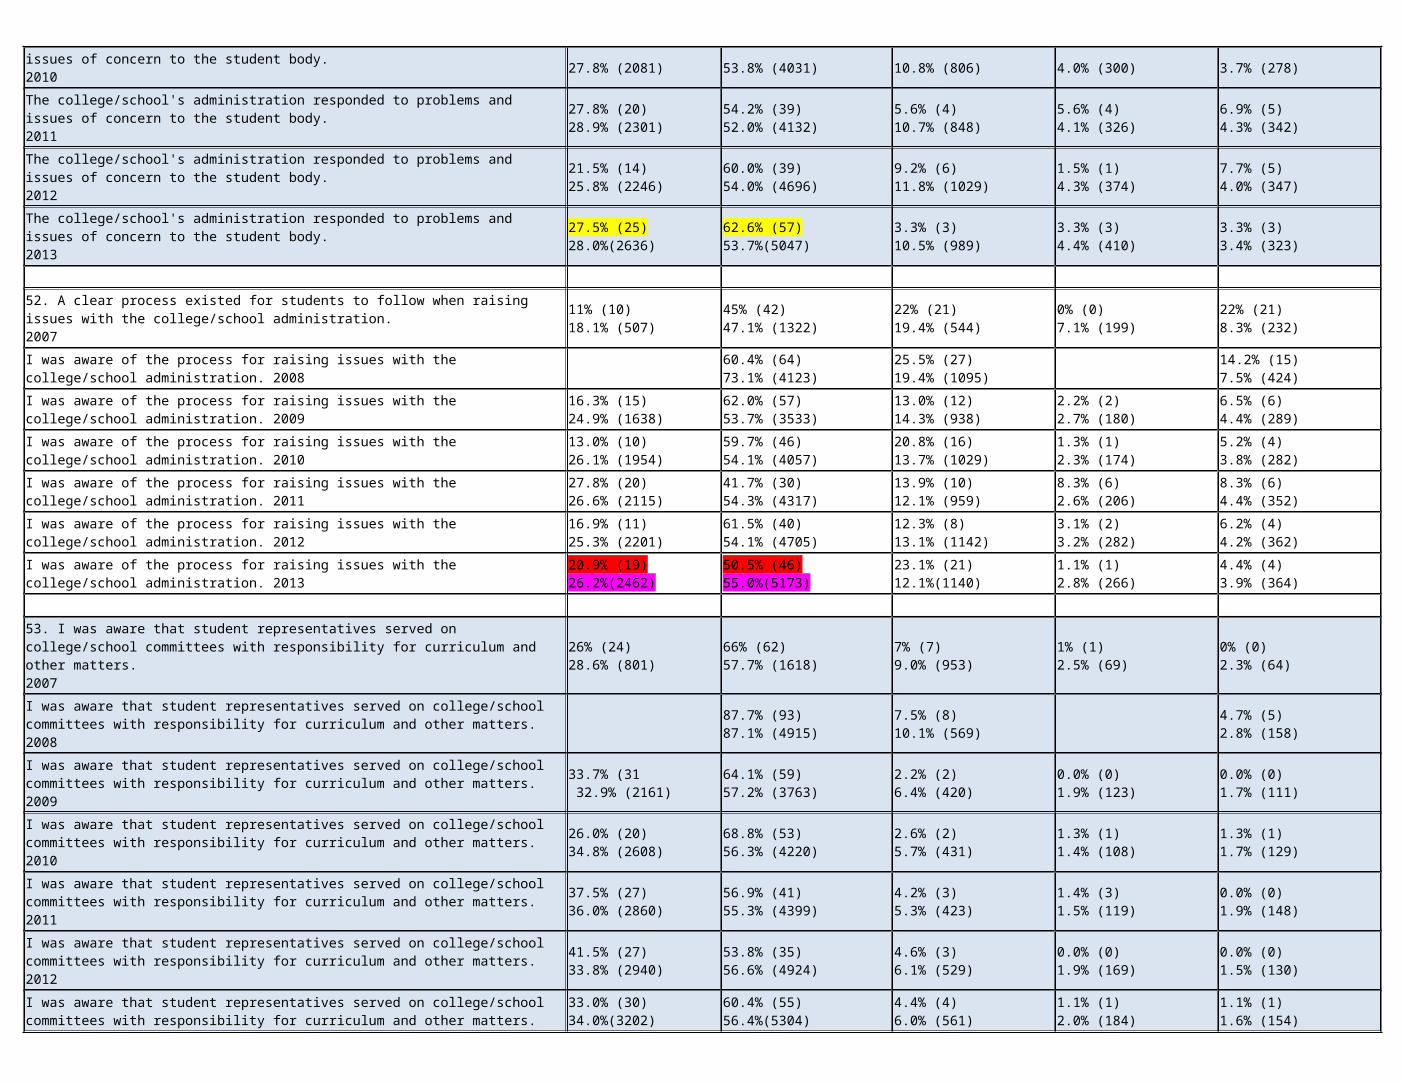
72. The common spaces such as lounges, lobbies or other areas for relaxation and socialization available in the college/school of pharmacy or elsewhere on campus met my needs. 2007
17% (16)25.2% (706)
62% (58)52.8% (1482)
16% (15)15.8% (443)
3% (3)4.2% (118)
2% (2)2.1% (58)
The common spaces such as lounges, lobbies or other areas for relaxation and socialization available in the college/school of pharmacy or elsewhere on campus met my needs. 2008
11.3% (12) 31.5% (1780)
73.6% (78) 47.7% (2690)
9.4% (10) 14.5% (817)
3.8% (4) 4.4% (250)
1.9% (2) 1.9% (105)
The common spaces such as lounges, lobbies or other areas for relaxation and socialization available in the college/school of pharmacy or elsewhere on campus met my needs. 2009
26.1% (24) 33.1% (2176)
64.1% (59) 50.9% (3349)
6.5% (6) 11.1% (727)
1.1% (1) 3.5% (227)
2.2% (2) 1.5% (99)
The common spaces such as lounges, lobbies or other areas for relaxation and socialization available in the college/school of pharmacy or elsewhere on campus met my needs. 2010
32.5% (25)34.1% (2558)
61.0% (47)49.0% (3670)
5.2% (4)11.5% (861)
0.0% (0)3.7% (278)
1.3% (1)1.7% (129)
The common spaces such as lounges, lobbies or other areas for relaxation and socialization available in the college/school of pharmacy or elsewhere on campus met my needs. 2011
31.92% (23)35.7% (2839)
52.8% (38)48.6% (3865)
12.5% (9)10.7% (849)
1.4% (1)3.3% (266)
1.4% (1)1.6% (130)
The common spaces such as lounges, lobbies or other areas for relaxation and socialization available in the college/school of pharmacy or elsewhere on campus met my needs. 2012
32.3% (21)34.1% (2960)
53.8% (35)50.3% (4372)
12.3% (8)10.0% (868)
0.0% (0)3.9% (340)
1.5% (1)1.7% (152)
The common spaces such as lounges, lobbies or other areas for relaxation and socialization available in the college/school of pharmacy or elsewhere on campus met my needs. 2013
38.5% (35)36.0%(3387)
51.6% (47)49.9%(4695)
8.8% (8)9.2% (862)
0.0% (0)3.4% (320)
1.1% (1)1.5% (141)
73. On-campus access to educational resources (e.g., library, electronic data bases, drug information center) met my needs. 2007
33% (31)37.6% (1056)
59% (55)53.1% (1491)
9% (8)6.8% (191)
0% (0)1.3% (37)
0% (0)1.1% (31)
On-campus access to educational resources (e.g., library, electronic data bases, drug information center) met my needs 2008
22.6% (24) 43.0% (2426)
70.8% (75) 49.1% (2772)
3.8% (4) 5.1% (287)
1.9% (2) 1.9% (105)
0.9% (1) 0.9% (52)
On-campus access to educational resources (e.g., library, electronic data bases, drug information center) was conducive to learning. 2009
37.0% (34) 44.9% (2954)
58.7% (54) 49.7% (3270)
3.3% (3) 3.5% (228)
1.1% (1) 1.4% (91)
0.0% (0) 0.5% (35)
On-campus access to educational resources (e.g., library, electronic data bases, drug information center) was conducive to learning. 2010
35.1% (27)45.9% (3440)
61.0% (47)47.9% (3594)
1.3% (1)4.0% (301)
2.6% (2)1.5% (113)
0.0% (0)0.6% (48)
On-campus access to educational resources (e.g., library, electronic data bases, drug information center) was conducive to learning. 2011
45.8% (33)46.8% (3723)
51.4% (37)48.1% (3820)
1.4% (1)3.4% (269)
1.4% (1)0.9% (73)
0.0% (0)0.8% (64)
On-campus access to educational resources (e.g., library, electronic data bases, drug information center) was conducive to learning. 2012
49.2% (32)44.4% (3855)
49.2% (32)49.6% (4313)
1.5% (1)3.5% (303)
0.0% (0)1.6% (141)
0.0% (0)0.9% (80)
On-campus access to educational resources (e.g., library, electronic data bases, drug information center) was conducive to learning. 2013
52.7% (48)44.1%(4150)
42.9% (39)49.9%(4695)
3.3% (3)3.4% (323)
0.0% (0)1.6% (146)
1.1% (1)1.0% (91)
74. Off-campus (e.g., during experiential rotations) access to educational resources (e.g., library, electronic data bases, drug information center) met my needs. 2007
40% (38)34.7% (974)
57% (54)55.1% (1545)
2% (2)6.6% (185)
0% (0)1.8% (50)
0% (0)1.8% (51)
During pharmacy practice experiences access to educational resources (e.g., library, electronic data bases, drug information center) met my needs. 2008
30.2% (32) 42.2% (2381)
61.3% (65) 49.1% (2768)
5.7% (6) 5.7% (320)
1.9% (2) 2.1% (119)
0.9% (1) 1.0% (54)
During pharmacy practice experiences access to educational resources (e.g. library, electronic data bases, drug information center) was conducive to learning. 2009
33.7% (31) 43.5% (2862)
60.9% (56) 50.8% (3343)
5.4% (5) 3.8% (253)
0.0% (0) 1.3% (83)
0.0% (0) 0.6% (37)
During pharmacy practice experiences access to educational resources (e.g. library, electronic data bases, drug information center) was conducive to learning. 2010
37.7% (29)44.9% (3367)
55.8% (43)49.8% (3732)
6.5% (5)3.6% (272)
0.0% (0)1.0% (76)
0.0% (0)0.7% (49)
During pharmacy practice experiences access to educational resources (e.g. library, electronic data bases, drug information center) was conducive to learning. 2011
50.0% (36)46.1% (3665)
47.2% (34)49.3% (3917)
2.8% (2)3.0% (236)
0.0% (0)0.9% (74)
0.0% (0)0.7% (57)
During pharmacy practice experiences access to educational resources (e.g. library, electronic data bases, drug information center) was conducive to learning. 2012
49.2% (32)45.3% (3941) 50.8% (33)
49.7% (4324)0.0% (0)3.0% (258)
0.0% (0)1.3% (114)
0.0% (0)0.6% (55)
During pharmacy practice experiences access to educational resources (e.g. library, electronic data bases, drug information center) was conducive to learning. 2013
54.9% (50)44.8%(4210)
42.9% (39)50.7%(4772)
0.0% (0)2.6% (244)
1.1% (1)1.2% (109)
1.1% (1)0.7% (70)
SECTION VII: Overall Impressions
Indicate the degree to which you agree or disagree with these statements.* The top line indicates Drake survey results and the bottom line indicates the National survey results (Private and Public).
Strongly Agree Agree Disagree Strongly Disagree Unable to Comment
75. I am prepared to enter pharmacy practice. 2007 33% (31)34.3% (962)
60% (56)59.3% (1664)
5% (5)4.3% (122)
0% (0)0.6% (18)
2% (2)1.4% (39)

I am prepared to enter pharmacy practice. 2008 29.2% (31) 39.3% (2217)
65.1% (69) 54.8% (3093)
3.8% (4) 4.3% (241)
0.0% (0) 0.4% (24)
1.9% (2) 1.2% (67)
I am prepared to enter pharmacy practice. 2009 39.1% (36) 39.7% (2611)
57.6% (53) 55.3% (3640)
2.2% (2) 3.2% (209)
1.1% (1) 0.6% (41)
0.0% (0) 1.2% (77)
I am prepared to enter pharmacy practice. 2010 45.5% (35)41.2% (3088)
53.2% (41)54.2% (4064)
1.3% (1)3.2% (240)
0.0% (0)0.4% (32)
0.0% (0)1.0% (72)
I am prepared to enter pharmacy practice. 2011 37.5% (27)41.1% (3271)
54.2% (39)54.1% (4299)
4.2% (3)3.2% (251)
1.4% (1)0.5% (41)
2.8% (2)1.1% (87)
I am prepared to enter pharmacy practice. 2012 41.5% (27)40.1% (3489)
58.5% (38)54.8% (4759)
0.0% (0)3.6% (309)
0.0% (0)0.6% (53)
0.0% (0)0.9% (82)
I am prepared to enter pharmacy practice. 2013 47.3% (43)39.7%(3730)
51.6% (47)55.0%(5177)
1.1% (1)3.3% (306)
0.0% (0)0.8% (77)
0.0% (0)1.2% (115)
76. If I were starting my college career over again I would choose to study pharmacy. 2007 40% (38)45.8% (1284)
48% (45)43.9% (1230)
9% (8)5.3% (150)
1% (1)1.6% (45)
2% (2)3.4% (96)
If I were starting my college career over again I would choose to study pharmacy. 2008 34.0% (36) 48.4% (2732)
49.1% (52) 39.6% (2236)
6.6% (7) 6.4% (363)
0.9% (1) 1.6% (90)
9.4% (10) 3.9% (221)
If I were starting my college career over again I would choose to study pharmacy. 2009 43.5% (40) 47.7% (3139)
48.9% (45) 40.9% (2690)
3.3% (3) 6.3% (416)
1.1% (1) 1.9% (126)
3.3% (3) 3.1% (207)
If I were starting my college career over again I would choose to study pharmacy. 2010 36.4% (28)47.8% (3580)
44.2% (34)39.6% (2969)
15.6% (12)7.4% (553)
1.3% (1)2.1% (156)
2.6% (2)3.2% (238)
If I were starting my college career over again I would choose to study pharmacy. 2011 38.9% (28)44.0% (3497)
41.7% (30)40.7% (3237)
6.9% (5)8.6% (683)
6.9% (5)2.8% (220)
5.6% (4)3.9% (312)
If I were starting my college career over again I would choose to study pharmacy. 2012 44.6% (29)40.8% (3546)
41.5% (27)41.0% (3565)
10.8% (7)10.2% (886)
1.5% (1)3.7% (320)
1.5% (1)4.3% (375)
If I were starting my college career over again I would choose to study pharmacy. 2013 40.7% (37)40.9%(3842)
46.2% (42)43.0%(4044)
8.8% (8)8.6% (809)
2.2% (2)3.5% (327)
2.2% (2)4.1% (383)
77. If I were starting my pharmacy program over again I would choose the same college/school of pharmacy. 2007
32% (30)34.4% (966)
45% (42)39.2% (1099)
18% (17)13.1% (368)
1% (1)7.0% (196)
4% (4)6.3% (176)
If I were starting my pharmacy program over again I would choose the same college/school of pharmacy. 2008
30.2% (32) 39.6% (2233)
49.1% (52) 37.2% (2097)
11.3% (12) 12.1% (684)
1.9% (2) 5.6% (317)
7.5% (8) 5.5% (311)
If I were starting my pharmacy program over again I would choose the same college/school of pharmacy. 2009
43.5% (40) 44.5% (2928)
50.0% (46) 38.4% (2529)
4.3% (4) 9.1% (599)
1.1% (1) 4.2% (273)
1.1% (1) 3.8% (249)
If I were starting my pharmacy program over again I would choose the same college/school of pharmacy. 2010
42.9% (33)44.5% (3336)
45.5% (35)38.3% (2871)
5.2% (4)8.9% (666)
3.9% (3)4.2% (314)
2.6% (2)4.1% (309)
If I were starting my pharmacy program over again I would choose the same college/school of pharmacy. 2011
43.1% (31)42.2% (3351)
31.9% (23)41.7% (3312)
13.9% (10)8.6% (682)
6.9% (5)3.9% (307)
4.2% (3)3.7% (297)
If I were starting my pharmacy program over again I would choose the same college/school of pharmacy. 2012
47.7% (31)40.1% (3485)
47.7% (31)42.8% (3722)
4.6% (3)8.8% (769)
0.0% (0)4.5% (395)
0.0% (0)3.7% (321)
If I were starting my pharmacy program over again I would choose the same college/school of pharmacy. 2013
50.5% (46)39.3%(3699)
44.0% (40)44.8%(4212)
4.4% (4)7.8% (733)
1.1% (1)5.0% (467)
0.0% (0)3.1% (294)
78. I would recommend a career in pharmacy to a friend or relative. 2007 45% (42)50.9% (1427)
49% (46)43.0% (1205)
4% (4)2.9% (82)
0% (0)0.5% (14)
2% (2)2.7% (77)
I would recommend a career in pharmacy to a friend or relative. 2008 35.8% (38) 50.4% (2845)
56.6% (60) 42.2% (2379)
2.8% (3) 3.3% (187)
0.0% (0) 1.0% (54)
4.7% (5) 3.1% (177)
I would recommend a career in pharmacy to a friend or relative. 2009 46.7% (43) 51.0% (3353)
50.0% (46) 42.0% (2761)
1.1% (1) 4.2% (277)
0.0% (0) 1.0% (68)
2.2% (2) 1.8% (119)
I would recommend a career in pharmacy to a friend or relative. 2010 41.6% (32)47.3% (3543)
50.6% (39)41.8% (3135)
6.5% (5)6.1% (454)
1.3% (1)1.6% (123)
0.0% (0)3.2% (241)
I would recommend a career in pharmacy to a friend or relative. 2011 30.6% (22)40.2% (3196)
51.4% (37)43.8% (3482)
11.1% (8)9.7% (772)
4.2% (3)2.7% (213)
2.8% (2)3.6% (286)
I would recommend a career in pharmacy to a friend or relative. 2012 32.3% (21)34.9% (3031)
44.6% (29)42.9% (3727)
12.3% (8)13.5% (1170)
0.0% (0)4.2% (367)
10.8% (7)4.6% (397)

I would recommend a career in pharmacy to a friend or relative. 2013 35.2% (32)36.8%(3464)
46.2% (42)46.0%(4324)
14.3% (13)10.3% (965)
1.1% (1)3.3% (312)
3.3% (3)3.6% (340)