pharmacy strategic plan - pharmacy...
TRANSCRIPT

8/24/2009 1
Pharmacy Strategic Plan
Implementation and Measurement of a Standard Pharmacy Clinical Practice
Model Across a Multi-Hospital System
Pharmacy Strategic Plan
Implementation and Measurement of a Standard Pharmacy Clinical Practice
Model Across a Multi-Hospital System
Steve Pickette, B.S. Pharm., BCPSDirector System, Pharmacy Clinical Services
Steve Pickette, B.S. Pharm., BCPSDirector System, Pharmacy Clinical Services

8/24/2009 2
OVERVIEWOVERVIEW
Role of Clinical Pharmacist
PH&S Pharmacy Strategic Plan
“Standard” Practice Model
Implementation Challenges
Outcomes Measures
Next Steps
Conclusions

8/24/2009 33
Providence Health & Services as of December 31, 2008
Employees 49,434
States 5
Hospital ministries 26
Ambulatory centers 12
Employed physicians 822
Health plan members 283,769
Long-term care beds 1,827
Assisted living units 636

8/24/2009 4
Long Range Vision for Pharmacy Work Force in Hospitals and Health Systems
ASHP Statement on Pharmaceutical Care Am J Hosp Pharm. 1993; 50:1720-3
Clinical Pharmacy Services in the U.S. in 2020: Services and Staffing Pharmacotherapy 2004 Apr;24(4): 427-40
ASHP Council on Education and Workforce Development Am J Health-Syst Pharm – Vol 64 Jun 15, 2007

8/24/2009 5
Role of the Pharmacist in HospitalsRole of the Pharmacist in Hospitals
Reviewing individual patients’ medication orders for safety and effectiveness and taking corrective action as indicated
Collaboratively managing medication therapy for individual patients.
Educating patients and caregivers about medications and their use.
Leading continuous improvements in the medication use process.
Leading the interdisciplinary and collaborative development of mediation use policies and procedures.
Am J Health-Syst Pharm – Vol 64 Jun 15, 2007

8/24/2009 6
Clinical Pharmacist Affect Mortality
Review of patient data base for nearly 3 million patients at 885 hospitals.
Compared hospitals with 14 different pharmacy clinical services to those without.
Seven services associated with reduced mortality rate.
Drug Use evaluation
Patient Education
ADR Management
Pharmacy Protocol Management
Code Team Participation
Admission Drug Histories
Participation on Rounds.

8/24/2009 Pharmacotherapy 2007;27(4): 481-493 7
Clinical Pharmacy Services and Mortality Rates
Clinical Pharmacy Services and Mortality Rates
Relationship between clinical pharmacist staffing and deaths/1000 admissions
0102030405060
1 2 3 4 5
Number of Clinical Pharmacists/100 occupied beds
Num
ber o
f dea
ths/
100
occu
pied
bed
s
Number ofdeaths/1000Admissions

8/24/2009 8
How Common Are these Services?
Only 38% of hospitals overall have service specific pharmacists review therapy.
72% at hospitals greater than 400 beds
26% at hospitals 200 beds or less
Only 24% of hospitals have pharmacists reviewing medication therapy for 75% or more of patients.
Am J Health-Syst Pharm—Vol 64 Mar 1, 2007
8/24/2009 9
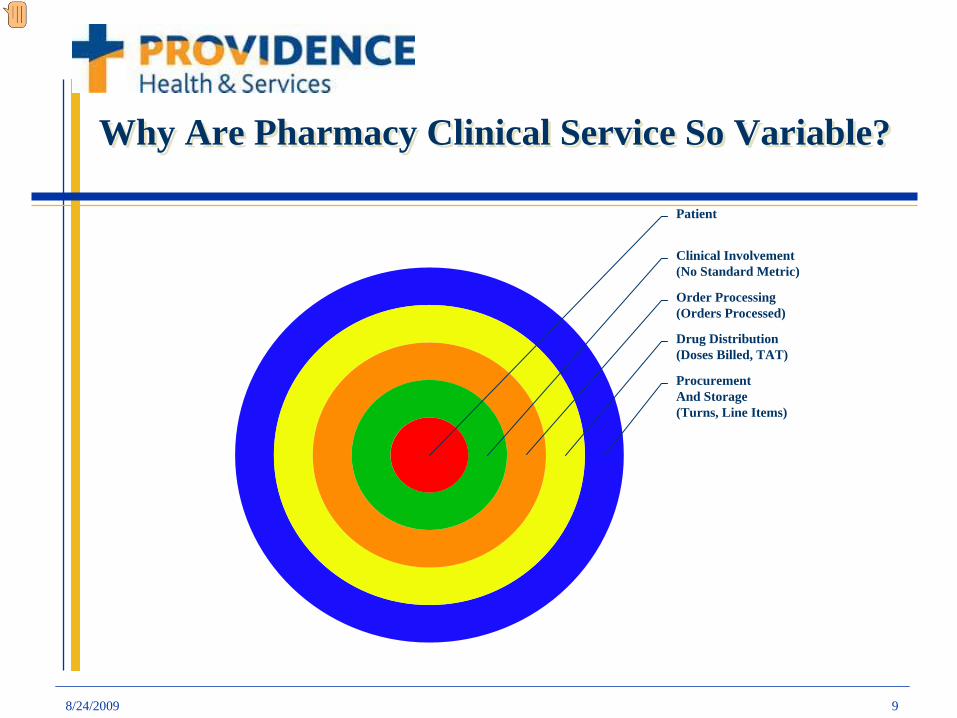
ProcurementAnd Storage(Turns, Line Items)
Drug Distribution(Doses Billed, TAT)
Order Processing(Orders Processed)
Clinical Involvement(No Standard Metric)
Patient
Why Are Pharmacy Clinical Service So Variable? Why Are Pharmacy Clinical Service So Variable?

Pharmacy Resource Council Strategic Plan Framework
Pharmacy Resource Council Strategic Plan Framework
PH&S Mission, Vision & ValuesPH&S Mission, Vision & ValuesWe will succeed as “One Ministry Committed to Excellence”
Foundation
Operating Commitments
PeopleCentered
Mission Inspired
Service Oriented
QualityFocused
FinanciallyResponsible
System StrategyPRC Vision:Enhancing quality of life through safe & effective medication use
PRC Outcomes:• Utilize a standardized system to demonstrate the value of clinical pharmacy• 100% of CMS clinical quality indicators met relative to pharmaceutical care• Implement technology solutions to eliminate preventable medication adverse events• Pharmacist will review the therapy of 100% of patients with complex & high-risk medication
regimens • Achieve system-wide target of 90% compliance with market share contracts• Develop & adopt a standardized training and competency assessment program at least
biannually with 100% compliance• Compliance with regulatory requirements
PRC Strategic Priorities:Attract and retain the best workforce
Leverage System Wide Capabilities
Tactics: (specific Steps to Achieve Individual Strategies)
• Participate in and develop education programs.
• Develop HR strategy
• Career advancement
• Implement proven technology applications
• Coordinate and enhance pharmacy informatics resource
• Standardize technology
Leverage Technology
• System wide reporting tool
• Benchmark internally and externally
• Implement standard practice model
Enhance Quality & Scope of Pharmacy Clinical Services
• Direct patient care
• Communicate success
• Develop Common Metrics / Benchmarking Program
• Regional P&T Process
• Shared services / resources
• Identify and share best practice

8/24/2009 11
Clinical Practice Initiative for Pharmacy
Clinical Practice Initiative for Pharmacy
Enhance the quality and scope of pharmacy clinical services
Implement a standard clinical practice model for pharmacy
Implement reporting tool for clinical pharmacy interventions
Develop standard metric to measure and benchmark clinical services system wide

8/24/2009 12
PRACTICE MODEL OPTIONSPRACTICE MODEL OPTIONS
Order Review Based
Target Drug Based
Rounding Based
Profile Review Based
CPOE Based?

8/24/2009 13
ORDER REVIEW BASEDORDER REVIEW BASEDGOOD POINTS
Potentially Economical
Avoids Most Major Drug Related Problems (DRPs)
Concurrent
Unit Pharmacist Aware of Current Therapy
Address Issues Quickly After Order Written
BAD POINTS
Dispensing a Priority for All Pharmacists
Difficult to Follow Up on Complex Issues
No Time for Projects
Difficult to Get Big Picture of Care
Perception of RPh Role
Single-Check Only

8/24/2009 14
TARGET DRUG BASEDTARGET DRUG BASEDGOOD POINTS
Efficient/ Economical
Address Most Major DRPs
RPh Able to Prioritize
Improved Perception of RPh Role
Can Allow for Protocol/ Project Time
BAD POINTS
Missed Opportunities for Improved Care
Narrow Focus
Disconnected From Big Picture of Patient Care
Perceived as Having Narrow Focus/Role by Hospital Staff
Reactive

8/24/2009 15
ROUNDING BASEDROUNDING BASEDGOOD POINTS
Comprehensive Care
Proactive Input
Incorporation of RPh into Healthcare Team
Improve as Practitioner
Opportunity to Educate Physicians and Other Staff
BAD POINTS
Inefficient
Requires Hospitalist and/ or Teaching Model for Medical Care

8/24/2009 16
PROFILE REVIEW BASEDPROFILE REVIEW BASEDGOOD POINTS
Efficient/ Economical
Address Most DRPs
RPh Able to Prioritize
Improved Perception of RPh Role
Can Allow for Protocol/ Project Time
Ability to be Proactive
BAD POINTS
Requires Resources in Staffing and Tools
Rely on Order Review by core staff
Not as Complete Care as Rounding Model

8/24/2009 17
PH&S “Standard” Practice ModelPH&S “Standard” Practice Model
Unit-based Clinical Staff
Defined (Specialized) Clinical Services
Profile Review / Rounding
Documentation Program
Clinical Decision Support
Centralized Order Entry
Standards of Care / Protocols

8/24/2009 18
Practice Model RequirementsPractice Model RequirementsDistribution:
Staff Dedicated to Order Review
Order Image Scanner Technology
Distribution Efficiency: e.g. Tech Check Tech, Triage Tech/RPh, Automation
Clinical Practice:
Staff Dedicated to Drug Therapy Management
Intervention Program (Quantifi®)
Decision Support Tools (Sentri 7®)

8/24/2009 19
STANDARDS OF PRACTICESTANDARDS OF PRACTICE
Workflow
Documentation
Order Entry Review
Profile Review
Rounding
Competencies
Preceptor

8/24/2009 20
DEDICATED STAFF OPTIONS - PER CLINICAL SERVICE
DEDICATED STAFF OPTIONS - PER CLINICAL SERVICE
Single RPh 2 RPh’s 3 or more
Highly Specialized GeneralizedSpecialized & Generalized

8/24/2009 21
2 RPH’S - PER CLINICAL SERVICE2 RPH’S - PER CLINICAL SERVICE
Alternating Between Clinical Service and Distribution (e.g. month on, month off)
Still build relationships
Professional development
Opportunity to work with a partner
High level of care
Time for projects
Students
More flexible, can scope for any hospital size
Comprehend whole pharmacy process
High level of staff satisfaction
8/24/2009 22
Where the Rubber Hits the Road – Implementation Challenges
Where the Rubber Hits the Road – Implementation Challenges
Training
CHANGE!
Resources
F.T.E.s
I.T. Resources
Automation, scanning equipment, etc
Recruitment

8/24/2009 23
Financial Impact of Practice ModelFinancial Impact of Practice Model1. Documented changes in therapy by pharmacist
– direct and cost avoidance combined savings2. Supply costs3. Premier Outlook® benchmark dataEvaluation of Three Providence Hospitals
Providence Sacred Heart Medical Center (PSHMC)
Providence Holy Family Hospital (PHFH)
St. Patrick Hospital (SPH)

8/24/2009 24
Sacred Heart Medical CenterSacred Heart Medical Center
2004 Goal: Document Financial Impact of Pharmacy Clinical Practice Model
12 “decentralized” clinical services already established
Implementation of clinical documentation program.
Savings by intervention type per service (values based on cost-avoidance)
Performance report shared monthly with each clinical service
Track total expense and benchmark data
8/24/2009 25
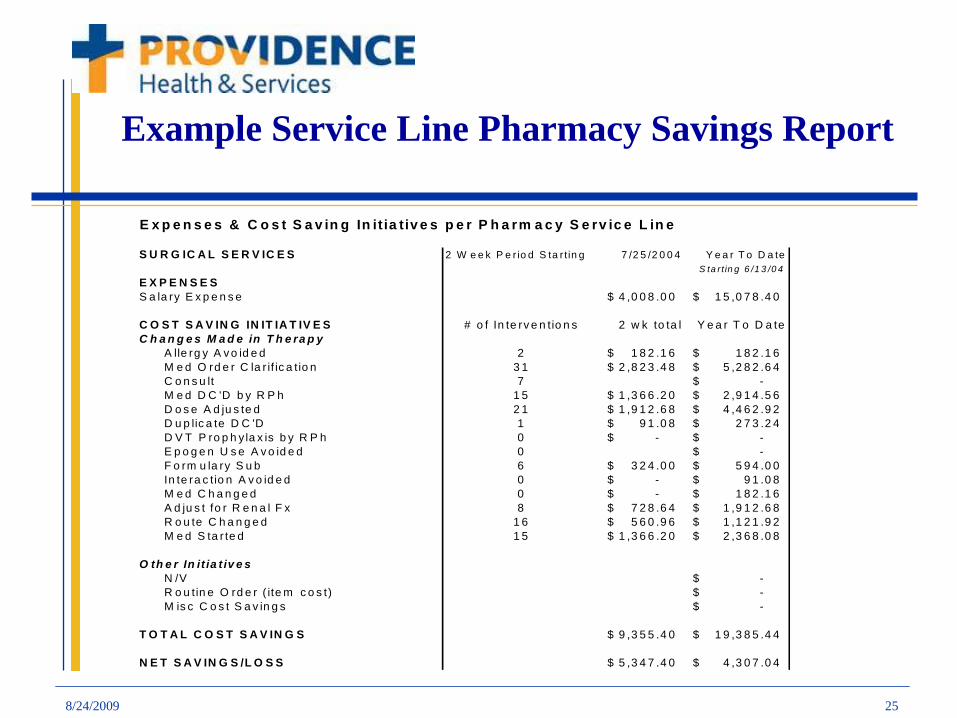
Example Service Line Pharmacy Savings Report
E x p e n s e s & C o s t S a v in g In it ia tiv e s p e r P h a rm a c y S e rv ic e L in e
S U R G IC A L S E R V IC E S 2 W e e k P e r io d S ta r t in g 7 /2 5 /2 0 0 4 Y e a r T o D a teS ta rt in g 6 /1 3 /0 4
E X P E N S E SS a la ry E x p e n s e 4 ,0 0 8 .0 0$ 1 5 ,0 7 8 .4 0$
C O S T S A V IN G IN IT IA T IV E S # o f In te rv e n tio n s 2 w k to ta l Y e a r T o D a teC h a n g e s M a d e in T h e ra p y
A lle rg y A v o id e d 2 1 8 2 .1 6$ 1 8 2 .1 6$ M e d O rd e r C la r if ic a tio n 3 1 2 ,8 2 3 .4 8$ 5 ,2 8 2 .6 4$ C o n s u lt 7 -$ M e d D C 'D b y R P h 1 5 1 ,3 6 6 .2 0$ 2 ,9 1 4 .5 6$ D o s e A d ju s te d 2 1 1 ,9 1 2 .6 8$ 4 ,4 6 2 .9 2$ D u p lic a te D C 'D 1 9 1 .0 8$ 2 7 3 .2 4$ D V T P ro p h y la x is b y R P h 0 -$ -$ E p o g e n U s e A v o id e d 0 -$ F o rm u la ry S u b 6 3 2 4 .0 0$ 5 9 4 .0 0$ In te ra c tio n A v o id e d 0 -$ 9 1 .0 8$ M e d C h a n g e d 0 -$ 1 8 2 .1 6$ A d ju s t fo r R e n a l F x 8 7 2 8 .6 4$ 1 ,9 1 2 .6 8$ R o u te C h a n g e d 1 6 5 6 0 .9 6$ 1 ,1 2 1 .9 2$ M e d S ta r te d 1 5 1 ,3 6 6 .2 0$ 2 ,3 6 8 .0 8$
O th e r In it ia t iv e sN /V -$ R o u tin e O rd e r ( ite m c o s t) -$ M is c C o s t S a v in g s -$
T O T A L C O S T S A V IN G S 9 ,3 5 5 .4 0$ 1 9 ,3 8 5 .4 4$
N E T S A V IN G S /L O S S 5 ,3 4 7 .4 0$ 4 ,3 0 7 .0 4$

8/24/2009 26
Initial Service Financial ReportExpenses & Cost Saving Initiatives All Pharmacy Service Lines
2 weeks starting YTD7/25/2004 Starting 6/13/04Salary Expense Dollars Saved Profit/Loss Salary Expense Dollars Saved Profit/Loss
ED/OR 3,235$ 2,509$ ($726) 12,352$ 10,489$ ($1,863)ICU 6,165$ 5,340$ ($825) 21,814$ 24,092$ $2,278Peds 3,598$ 9,202$ $5,604 29,992$ 22,280$ ($7,712)NICU 3,598$ 4,977$ $1,379 10,456$ 9,928$ ($527)Peds Onc 3,923$ 8,065$ $4,141 13,366$ 18,736$ $5,370Surg 4,008$ 9,355$ $5,347 15,078$ 19,385$ $4,307Neur/Nephro 4,884$ 2,799$ ($2,085) 15,645$ 11,016$ ($4,629)Cardiology 4,070$ 7,075$ $3,005 14,815$ 12,988$ ($1,827)Oncology 4,070$ 5,042$ $972 14,815$ 11,509$ ($3,306)CTT 4,070$ 9,480$ $5,410 15,954$ 14,006$ ($1,949)Psych 3,253$ 2,256$ ($997) 12,044$ 5,953$ ($6,091)IMR 1,712$ 783$ ($929) 6,847$ 783$ ($6,064)Total 46,586$ 66,883$ 20,297$ 183,178$ 161,165$ ($22,013)

8/24/2009 27
Report from 12/12/2004
Expenses & Cost Saving Initiatives All Pharmacy Service Lines
2 weeks starting YTD12/12/2004 Starting 6/13/04Salary Expense Cost Saving Iniatives NET SAVINGS/LOSS Salary Expense Cost Saving Iniatives NET SAVINGS/LOSS
ED/OR 2,931$ 5,927$ $2,996 44,587$ 55,353$ $10,766ICU 4,885$ 6,410$ $1,525 78,654$ 150,632$ $71,978Peds 2,687$ 14,406$ $11,719 49,459$ 138,032$ $88,573NICU 1,647$ 3,481$ $1,834 47,117$ 55,364$ $8,247Peds Onc 3,354$ 7,926$ $4,572 53,708$ 107,795$ $54,087Surg 4,264$ 12,155$ $7,891 64,257$ 116,590$ $52,333Neur/Nephro 4,393$ 6,783$ $2,390 65,220$ 65,481$ $261Cardiology 3,903$ 7,419$ $3,516 59,742$ 68,275$ $8,533Oncology 3,903$ 4,873$ $970 59,742$ 78,035$ $18,293CTT 3,908$ 16,319$ $12,411 62,312$ 99,278$ $36,966Psych 2,606$ 2,476$ ($130) 43,936$ 32,741$ ($11,195)IMR 1,224$ 308$ ($916) 23,474$ 27,494$ $4,020Total 39,705$ 88,483$ $48,778 649,946$ 995,070$ $345,124

8/24/2009 28
Cost Savings Documented PSHMC (savings from documentation program)
Cost Savings Documented PSHMC (savings from documentation program)
Overall Pharmacy Clinical Service Profit/Loss
0
20000
40000
60000
80000
100000
120000
7/11/2
0047/1
8/2004
7/25/2
0048/1
/2004
8/8/20
048/1
5/2004
8/22/2
0048/2
9/2004
9/5/20
049/1
2/2004
9/19/2
0049/2
6/2004
10/3/
2004
10/10
/2004
10/17
/2004
10/24
/2004
10/31
/2004
11/7/
2004
11/14
/2004
11/21
/2004
11/28
/2004
2 Week Starting Date
Dol
lars
Salary Expense Dollars Saved via Interventions/Projects
Conversion date
8/24/2009 29
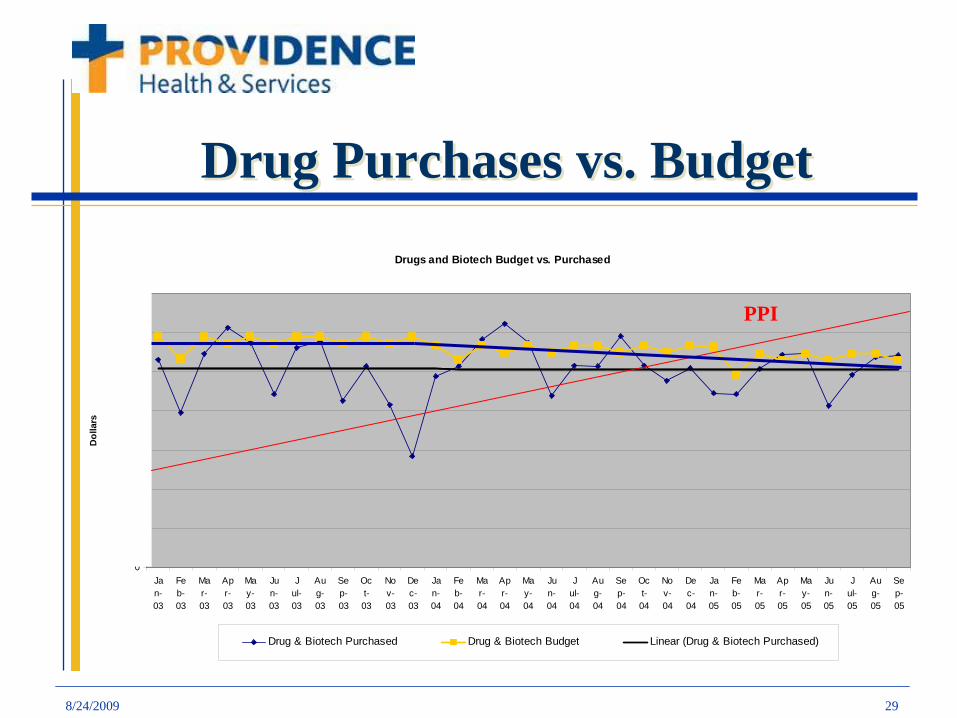
Drug Purchases vs. BudgetDrug Purchases vs. BudgetDrugs and Biotech Budget vs. Purchased
0
200000
400000
600000
800000
1000000
1200000
1400000
Jan-03
Feb-03
Mar-03
Apr-03
May-03
Jun-03
Jul-03
Aug-03
Sep-03
Oct-03
Nov-03
Dec-03
Jan-04
Feb-04
Mar-04
Apr-04
May-04
Jun-04
Jul-04
Aug-04
Sep-04
Oct-04
Nov-04
Dec-04
Jan-05
Feb-05
Mar-05
Apr-05
May-05
Jun-05
Jul-05
Aug-05
Sep-05
Dol
lars
Drug & Biotech Purchased Drug & Biotech Budget Linear (Drug & Biotech Purchased)
PPI

Facility
Average Monthly Volume
Worked FTEs
Total Worked
Hours/UnitTotal Paid
Hrs/Unit Benefit %Overtime
%Labor
Exp/Unit - WISupply
Exp/UnitOther
Exp/UnitTotal
Exp/Unit - WI
61 21,458 63.06 0.51 0.59 12.35% 3.00% $18.67 $43.67 $2.38 $64.71Peer 25th 21,123 46.68 0.38 0.41 7.74% 2.98% $14.78 $48.59 $1.37 $64.75Peer 33rd 21,730 48.28 0.38 0.41 7.95% 3.71% $14.95 $49.16 $1.66 $65.02Peer 50th 22,411 48.47 0.38 0.42 8.35% 4.42% $15.28 $54.77 $2.14 $74.06
144 23,067 48.35 0.37 0.41 9.77% 0.69% $14.26 $49.18 $0.45 $63.8998 19,226 41.67 0.38 0.41 7.09% 5.10% $15.61 $46.81 $2.62 $65.037 21,755 48.59 0.39 0.42 7.96% 3.74% $14.95 $72.82 $1.67 $89.45
140 35,870 88.66 0.43 0.47 8.73% 7.41% $18.45 $60.36 $4.28 $83.0961 21,458 63.06 0.51 0.59 12.35% 3.00% $18.67 $43.67 $2.38 $64.71
Peer 25th 21,123 46.68 0.38 0.41 7.74% 2.98% $14.78 $48.59 $1.37 $64.75Peer 33rd 21,730 48.28 0.38 0.41 7.95% 3.71% $14.95 $49.16 $1.66 $65.02Peer 50th 22,411 48.47 0.38 0.42 8.35% 4.42% $15.28 $54.77 $2.14 $74.06
Regional 25th 5,940 16.31 0.45 0.50 8.58% 2.18% $16.19 $47.78 $1.01 $66.71Regional 33rd 6,368 18.86 0.51 0.56 8.77% 2.19% $16.56 $52.23 $1.41 $68.26Regional 50th 7,641 22.53 0.52 0.57 9.55% 3.46% $18.07 $56.69 $2.04 $74.54National 25th 3,934 10.04 0.36 0.41 8.08% 0.80% $12.75 $41.15 $0.94 $57.02National 33rd 5,177 12.67 0.38 0.42 8.71% 1.14% $13.93 $43.18 $1.42 $60.61National 50th 7,641 18.95 0.42 0.47 10.10% 1.79% $15.46 $50.15 $2.39 $67.63
DEMOGRAPHICS LABOR EXPENSE
Summary
Detail
Premier Outlook Report Q4 2005 SHMC
Pharmacy: CMI Adjusted Pt. Days

8/24/2009 31
Pharmacy Labor vs. Drug ExpensePharmacy Labor vs. Drug Expense
Drug ExpenseLabor Expense

8/24/2009 32
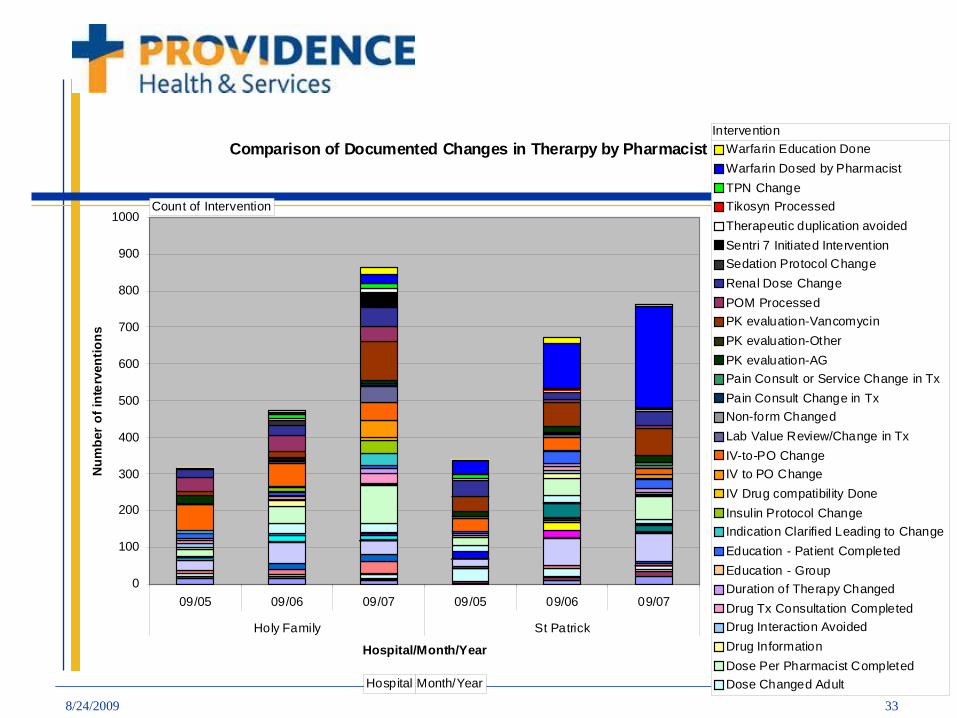
HFH, SPH Conversions 2006HFH, SPH Conversions 2006
HFH: converted from “target drug” model
Added 3.2 total additional F.T.E.
Established 3 clinical services (200 beds)
SPH: “unit based order entry” model
Centralized order review – Pyxis Connect®
Implemented operational efficiencies
Phone tree, tech check tech, triage RPh, etc.
Documentation using clinical intervention software
8/24/2009 33
Comparison of Documented Changes in Therarpy by Pharmacist 9-06 vs 9-07
0
100
200
300
400
500
600
700
800
900
1000
09/05 09/06 09/07 09/05 09/06 09/07
Holy Family St Patrick
Hospital/Month/Year
Num
ber
of in
terv
entio
ns
Warfarin Education DoneWarfarin Dosed by PharmacistTPN ChangeTikosyn ProcessedTherapeutic duplication avoidedSentri 7 Initiated InterventionSedation Protocol ChangeRenal Dose ChangePOM ProcessedPK evaluation-VancomycinPK evaluation-OtherPK evaluation-AGPain Consult or Service Change in TxPain Consult Change in TxNon-form ChangedLab Value Review/Change in TxIV-to-PO ChangeIV to PO ChangeIV Drug compatibility DoneInsulin Protocol ChangeIndication Clarified Leading to ChangeEducation - Patient CompletedEducation - GroupDuration of Therapy ChangedDrug Tx Consultation CompletedDrug Interaction AvoidedDrug InformationDose Per Pharmacist CompletedDose Changed Adult
Count of Intervention
Hospital Month/Year
Intervention

8/24/2009 34
Dollars Saved Per Patient Day (combined cost avoidance and direct)
Dollars Saved Per Patient Day (combined cost avoidance and direct)
0
5101520
2530
HFH HFH HFH SPH SPH SPH
Prior to practicemodelPeriod followingpractice model
Hospital / Year9/05 9/059/06 9/069/07 9/07

8/24/2009 35
Cost Avoidance Calculations
Intervention Number Increase Per Year
Clinical Impact Per Evidence
Cost Avoidance
Chemo Dose Eval/Change
72 3.6 ADE prevented (1 per 20)
$7,920
Drug Therapy Consult
96 9% reduced LOS $7,200
Warfarin Per Pharmacist
53 Cost benefit 11.4:1 $9,850
Warfarin Ed 48 17% decrease in readmit at 30 days
$9,984
Dose Per Pharmacist
660 20 ADE prevented (1 per 33)
$72,600
Total 833 $107,554
Solucient Pharmacy Clinical Services Intervention Worksheet, Thomson Healthcare – Action O-I
8/24/2009 36
Pharmaceutical Expense Trend
Supply costs trended down for both hospitals beginning with the quarter the model was implemented.
The pharmacy supply costs per case mix adjusted patient day have trended down each year for three years at each hospital.
The total pharmacy expense is below the 25th
percentile, despite labor expense above the 50th percentile.

8/24/2009 37
Endorsements
“I fully support the implementation of the pharmacy clinical practice model as it delivers a significant return on investment both financially and on improving quality of care”
Tom Corley, President, HFH

8/24/2009 38
Number of Interventions Documented Per Case-Mix Adjusted Admit June 2009
0.00
0.02
0.04
0.06
0.08
0.10
0.12
0.14
0.16
0.18
PSHMC
SPHPSVMC
PPMC
PCHPAMCPHFHPSJM
CPNH
PMEDHPLC
OMTPLC
OMSPPSPHSJH
CMCH
PHCMCPHRMCPSMMC
PMILH PSH

8/24/2009 39
Examples of Pharmacy Interventions From Documentation Program at PH&S Hospitals Examples of Pharmacy Interventions From Documentation Program at PH&S Hospitals
Nitroprusside discontinued in a patient with compromised renal function (scr=6.1) avoiding a high risk of cyanide toxicity.
Metformin discontinued in patients with poor renal function and/or receiving contrast avoiding risk of lactic acidosis.
Patient admitted on warfarin with no INR ordered. INR ordered per pharmacy and held when level came back >6 therefore reducing the risk of bleeding.
Heparin infusion stopped by pharmacist for an aPTT of 198 while also on warfarin which put the patient at a high risk of bleeding.

8/24/2009 40
CONCLUSIONSCONCLUSIONS
Clinical pharmacist have a significant impact that can be measured
Effective management of drug utilization results in decreased supply costs
Pharmacy productivity benchmarking should include a metric for clinical pharmacist activity and combine labor with supply cost
Return on investment is greater than the cost for clinical pharmacists

8/24/2009 41
QUESTIONS?QUESTIONS?