goldcorp - corporate update - nov 2012
TRANSCRIPT
CORPORATE UPDATE
NOVEMBER 2012
Forward Looking Statements
This presentation contains “forward-looking statements”, within the meaning of the United States Private Securities Litigation Reform Act of 1995 and applicable Canadian securities legislation, concerning the business, operations and financial performance and condition of Goldcorp Inc. (“Goldcorp”). Forward-looking statements include, but are not limited to, statements with respect to the future price of gold, silver, copper, lead and zinc, the estimation of mineral reserves and resources, the realization of mineral reserve estimates, the timing and amount of estimated future production, costs of production, capital expenditures, costs and timing of the development of new deposits, success of exploration activities, permitting time lines, hedging practices, currency exchange rate fluctuations, requirements for additional capital, government regulation of mining operations, environmental risks, unanticipated reclamation expenses, timing and possible outcome of pending litigation, title disputes or claims and limitations on insurance coverage. Generally, these forward-looking statements can be identified by the use of forward-looking terminology such as “plans”, “expects” or “does not expect”, “is expected”, “budget”, “scheduled”, “estimates”, “forecasts”, “intends”, “anticipates” or “does not anticipate”, “believes” or variations of such words and phrases or statements that certain actions, events or results “may”, “could”, “would”, “might” or “will be taken”, “occur” or “be achieved”. Forward-looking statements are subject to known and unknown risks, uncertainties and other factors that may cause the actual results, level of activity, performance or achievements of Goldcorp to be materially different from those expressed or implied by such forward-looking statements, including but not limited to: risks related to the integration of acquisitions; risks related to international operations; risks related to joint venture operations; actual results of current exploration activities; actual results of current reclamation activities; conclusions of economic evaluations; changes in project parameters as plans continue to be refined; future prices of gold, silver, copper, lead and zinc; possible variations in ore reserves, grade or recovery rates; failure of plant, equipment or processes to operate as anticipated; accidents, labour disputes; delays in obtaining governmental approvals or financing or in the completion of development or construction activities and other risks of the mining industry, as well as those factors discussed in the section entitled “Description of the Business – Risk Factors” in Goldcorp’s annual information form for the year ended December 31, 2011 available at www.sedar.com. Although Goldcorp has attempted to identify important factors that could cause actual results to differ materially from those contained in forward-looking statements, there may be other factors that cause results not to be as anticipated, estimated or intended. There can be no assurance that such statements will prove to be accurate, as actual results and future events could differ materially from those anticipated in such statements. Accordingly, readers should not place undue reliance on forward-looking statements. Goldcorp does not undertake to update any forward-looking statements that are included in this document, except in accordance with applicable securities laws.
2
All amounts are in U.S. dollars, unless otherwise stated.
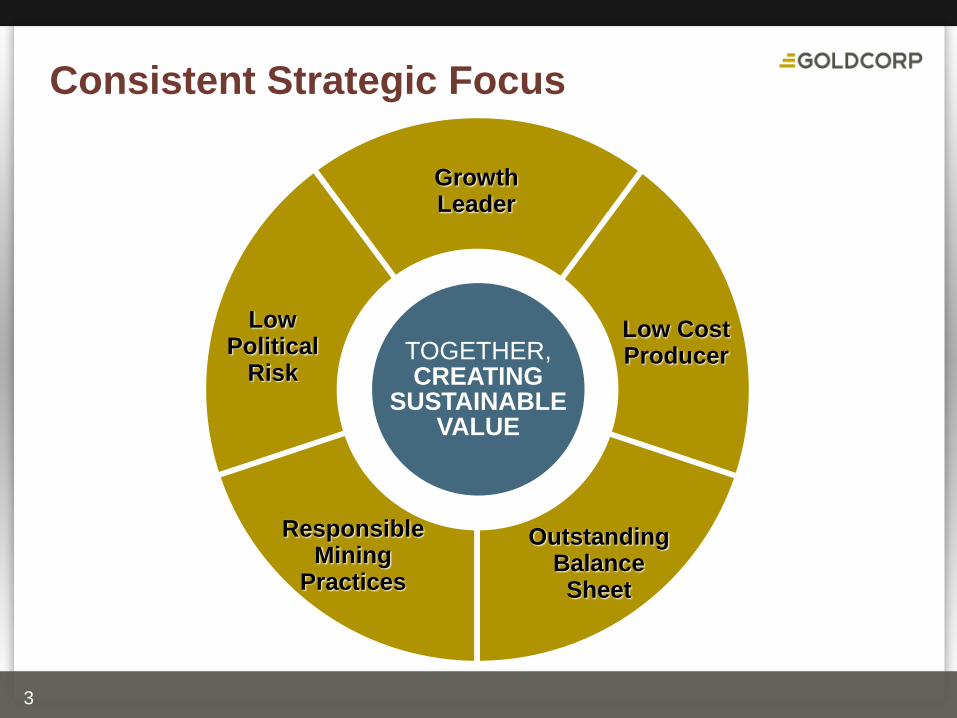
Consistent Strategic Focus
3
TOGETHER, CREATING
SUSTAINABLE VALUE
Growth Leader
Low Cost Producer
Outstanding Balance Sheet
Responsible Mining
Practices
Low Political
Risk
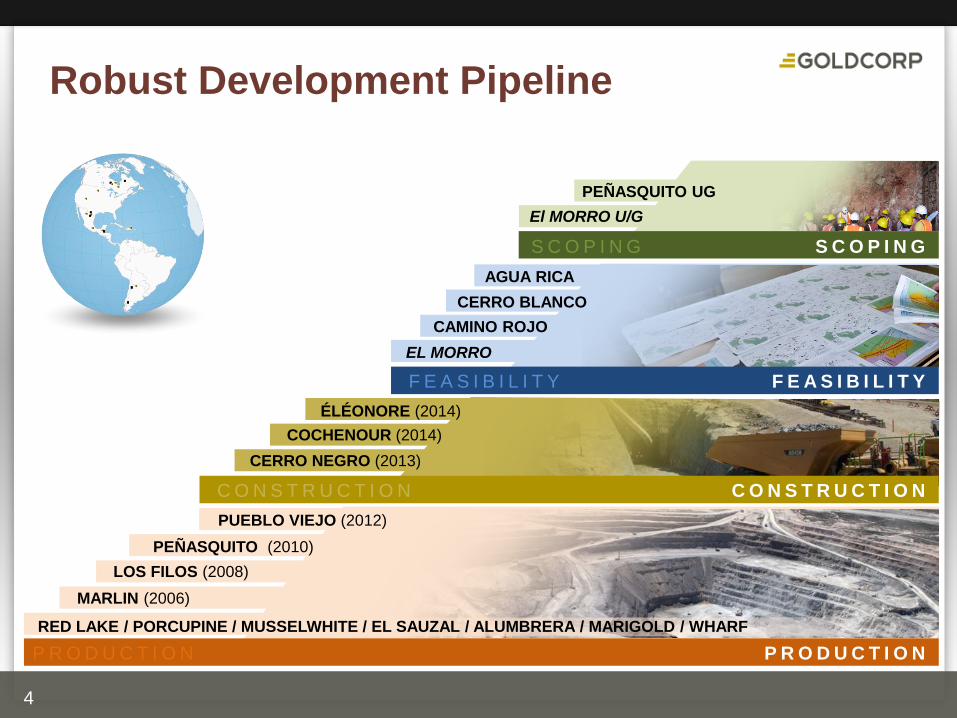
PUEBLO VIEJO (2012)
CERRO NEGRO (2013)
COCHENOUR (2014)
ÉLÉONORE (2014)
Robust Development Pipeline
4
MARLIN (2006)
LOS FILOS (2008)
PEÑASQUITO (2010)
EL MORRO
CAMINO ROJO
CERRO BLANCO
AGUA RICA
PEÑASQUITO UG
S C O P I N G
F E A S I B I L I T Y
P R O D U C T I O N
C O N S T R U C T I O N
S C O P I N G
F E A S I B I L I T Y
P R O D U C T I O N
C O N S T R U C T I O N
RED LAKE / PORCUPINE / MUSSELWHITE / EL SAUZAL / ALUMBRERA / MARIGOLD / WHARF
El MORRO U/G
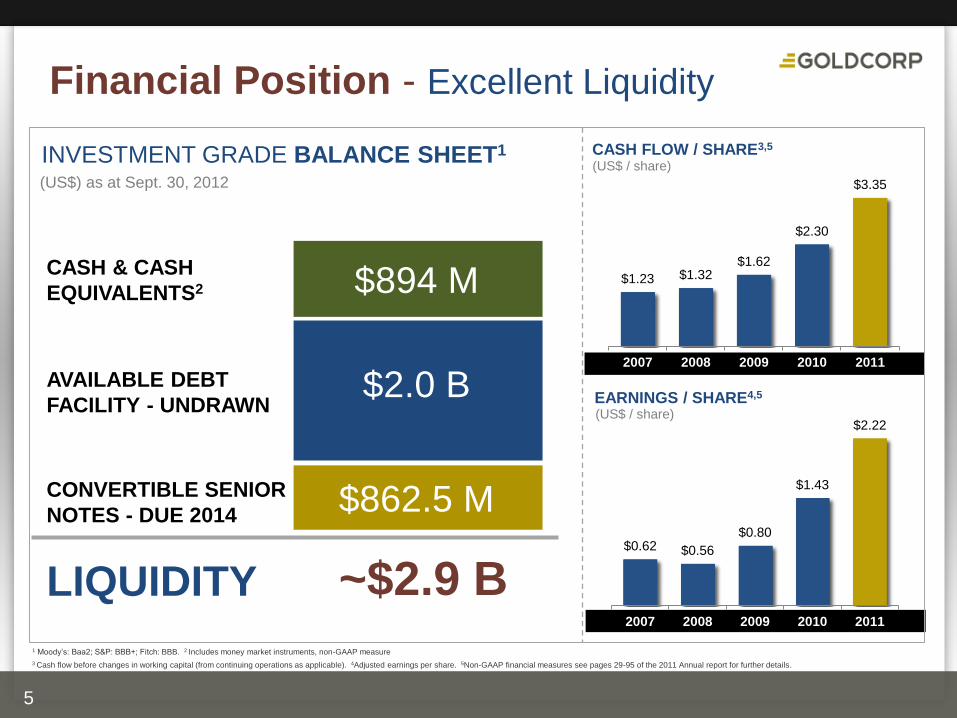
(US$) as at Sept. 30, 2012
INVESTMENT GRADE BALANCE SHEET1
Financial Position - Excellent Liquidity
5
1 Moody’s: Baa2; S&P: BBB+; Fitch: BBB. 2 Includes money market instruments, non-GAAP measure
CASH & CASH
EQUIVALENTS2
AVAILABLE DEBT
FACILITY - UNDRAWN
CONVERTIBLE SENIOR
NOTES - DUE 2014
$894 M
$2.0 B
$862.5 M
~$2.9 B LIQUIDITY $0.62 $0.56
$0.80
$1.43
$2.22
2007 2008 2009 2010 2011
CASH FLOW / SHARE3,5
EARNINGS / SHARE4,5
(US$ / share)
(US$ / share)
3 Cash flow before changes in working capital (from continuing operations as applicable). 4Adjusted earnings per share. 5Non-GAAP financial measures see pages 29-95 of the 2011 Annual report for further details.
$1.23 $1.32 $1.62
$2.30
$3.35
2007 2008 2009 2010 2011
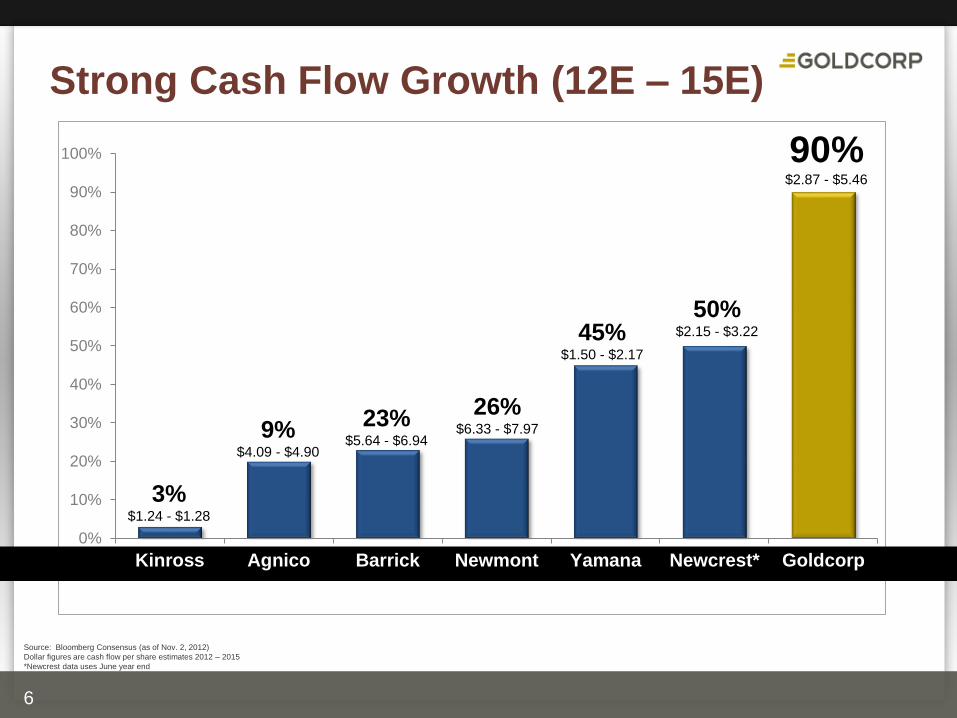
Strong Cash Flow Growth (12E – 15E)
6
0%
10%
20%
30%
40%
50%
60%
70%
80%
90%
100%
Kinross Agnico Barrick Newmont Yamana Newcrest* Goldcorp
90% $2.87 - $5.46
26% $6.33 - $7.97
23% $5.64 - $6.94
9% $4.09 - $4.90
3% $1.24 - $1.28
Source: Bloomberg Consensus (as of Nov. 2, 2012)
Dollar figures are cash flow per share estimates 2012 – 2015
*Newcrest data uses June year end
45% $1.50 - $2.17
50% $2.15 - $3.22
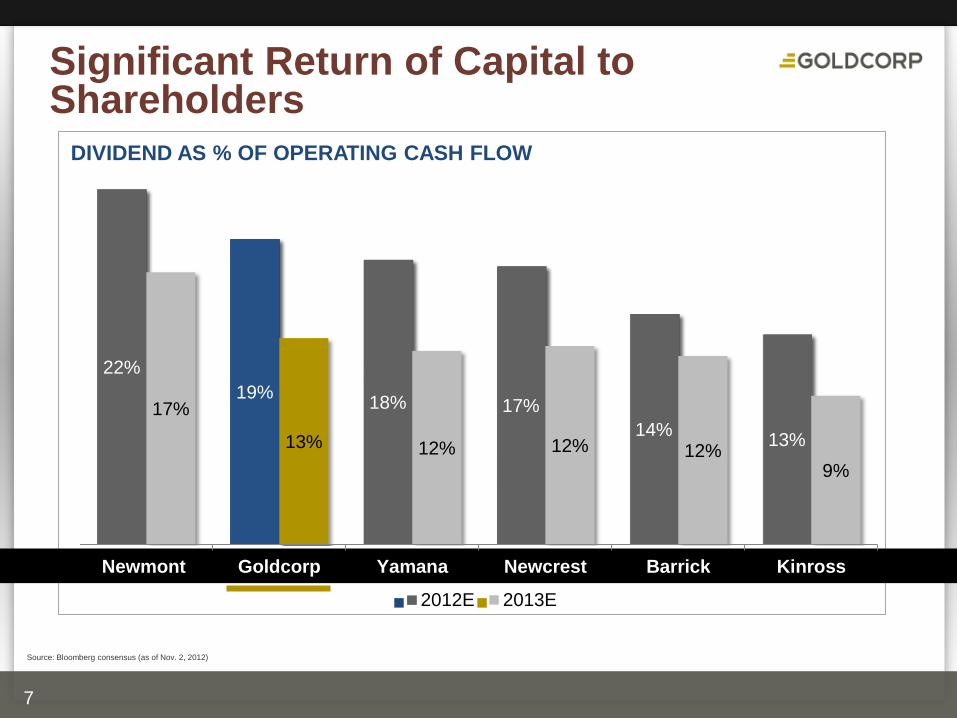
Significant Return of Capital to Shareholders
7
22%
19% 18% 17%
14% 13%
17%
13% 12% 12% 12% 9%
Newmont Goldcorp Yamana Newcrest Barrick Kinross
2012E 2013E
DIVIDEND AS % OF OPERATING CASH FLOW
Source: Bloomberg consensus (as of Nov. 2, 2012)
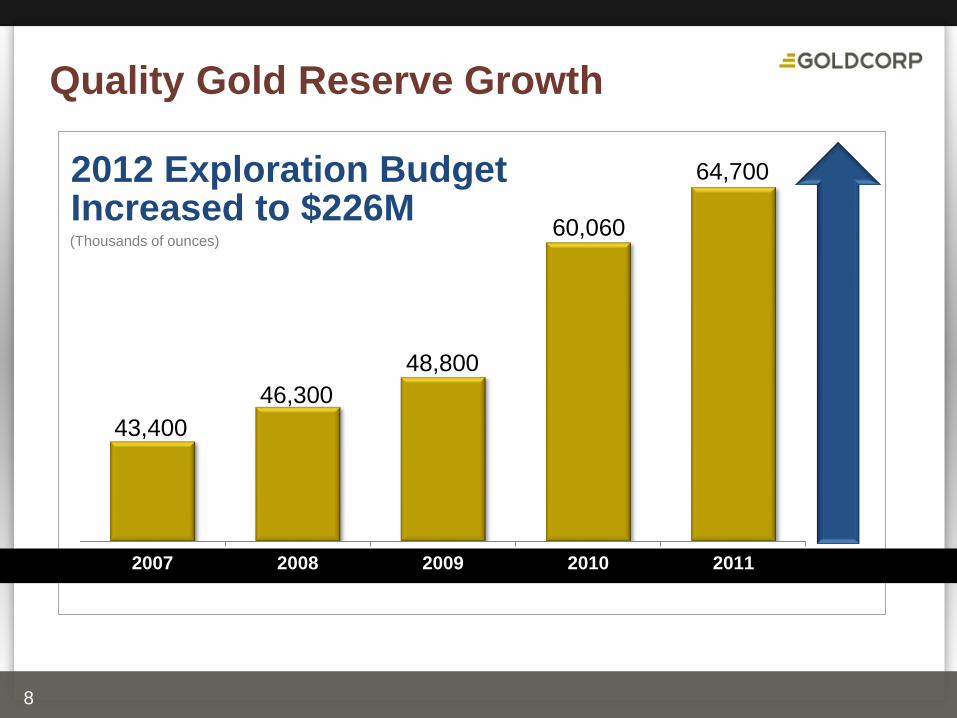
Quality Gold Reserve Growth
8
2007 2008 2009 2010 2011
2012 Exploration Budget Increased to $226M (Thousands of ounces)
43,400
46,300
48,800
60,060
64,700
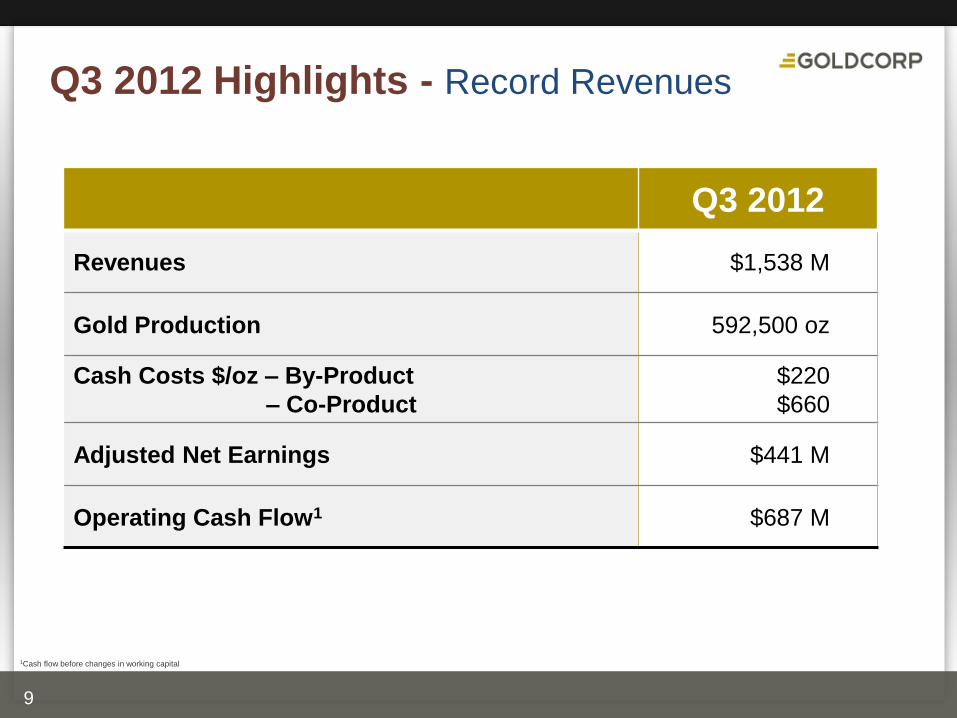
Q3 2012 Highlights - Record Revenues
9
Q3 2012
Revenues $1,538 M
Gold Production 592,500 oz
Cash Costs $/oz – By-Product
– Co-Product
$220
$660
Adjusted Net Earnings $441 M
Operating Cash Flow1 $687 M
1Cash flow before changes in working capital
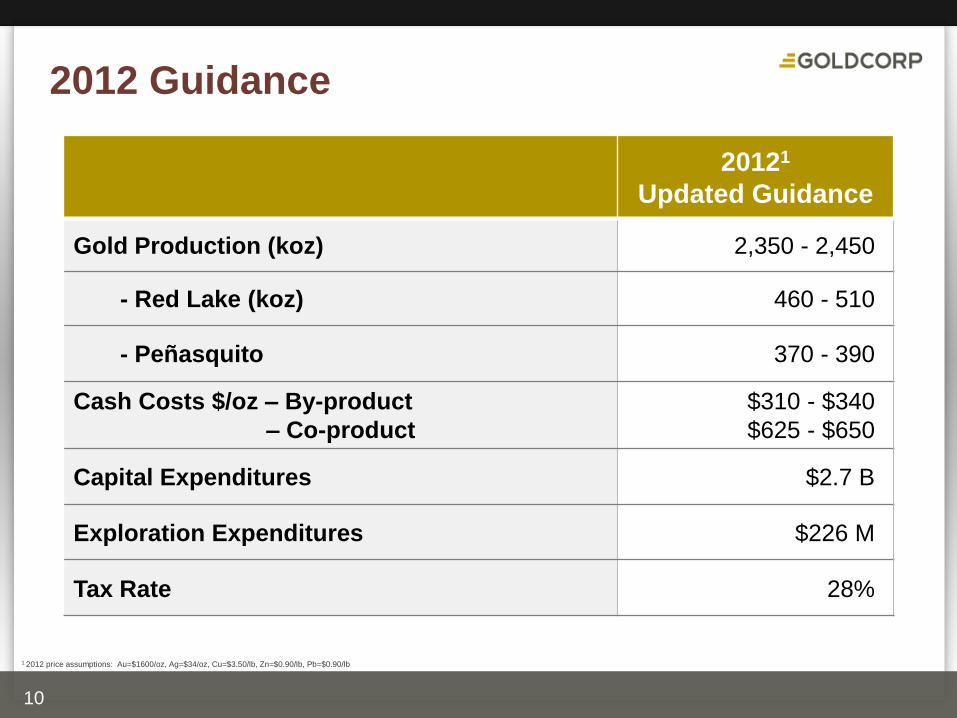
2012 Guidance
10
20121
Updated Guidance
Gold Production (koz) 2,350 - 2,450
- Red Lake (koz) 460 - 510
- Peñasquito 370 - 390
Cash Costs $/oz – By-product
– Co-product
$310 - $340
$625 - $650
Capital Expenditures $2.7 B
Exploration Expenditures $226 M
Tax Rate 28%
1 2012 price assumptions: Au=$1600/oz, Ag=$34/oz, Cu=$3.50/lb, Zn=$0.90/lb, Pb=$0.90/lb
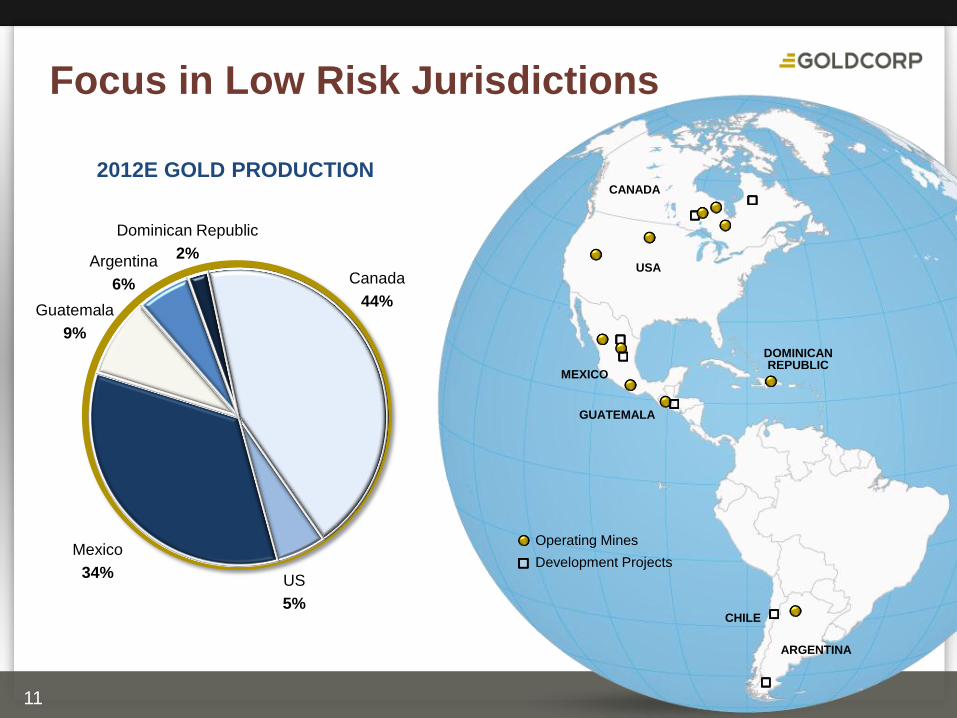
Focus in Low Risk Jurisdictions
11
CANADA
ARGENTINA
DOMINICAN REPUBLIC
MEXICO
GUATEMALA
USA
Operating Mines
Development Projects
CHILE
Canada
44%
US
5%
Mexico
34%
Guatemala
9%
Dominican Republic
2% Argentina
6%
2012E GOLD PRODUCTION
DOMINICAN REPUBLIC
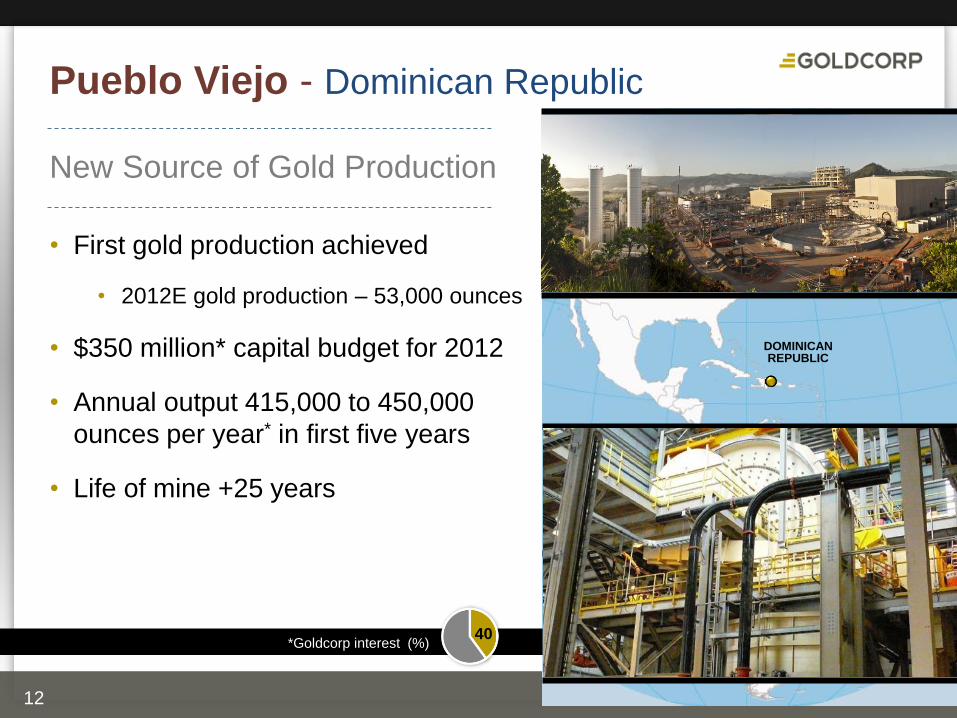
Pueblo Viejo - Dominican Republic
12
New Source of Gold Production
*Goldcorp interest (%)
40
• First gold production achieved
• 2012E gold production – 53,000 ounces
• $350 million* capital budget for 2012
• Annual output 415,000 to 450,000
ounces per year* in first five years
• Life of mine +25 years
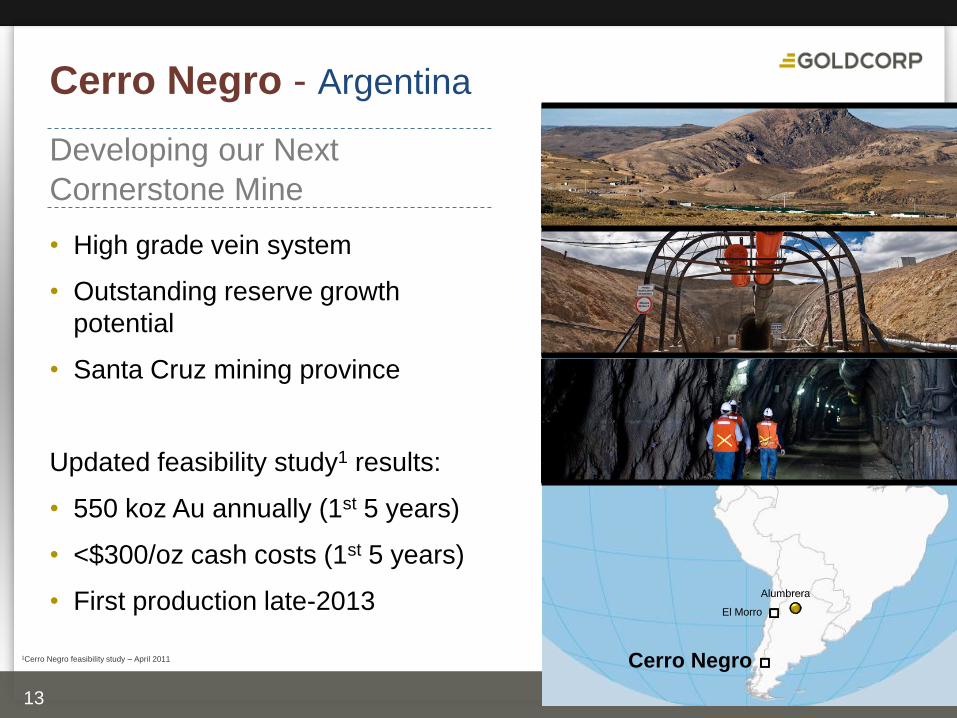
Cerro Negro - Argentina
• High grade vein system
• Outstanding reserve growth
potential
• Santa Cruz mining province
Updated feasibility study1 results:
• 550 koz Au annually (1st 5 years)
• <$300/oz cash costs (1st 5 years)
• First production late-2013
13
Developing our Next
Cornerstone Mine
Cerro Negro
Alumbrera
El Morro
1Cerro Negro feasibility study – April 2011
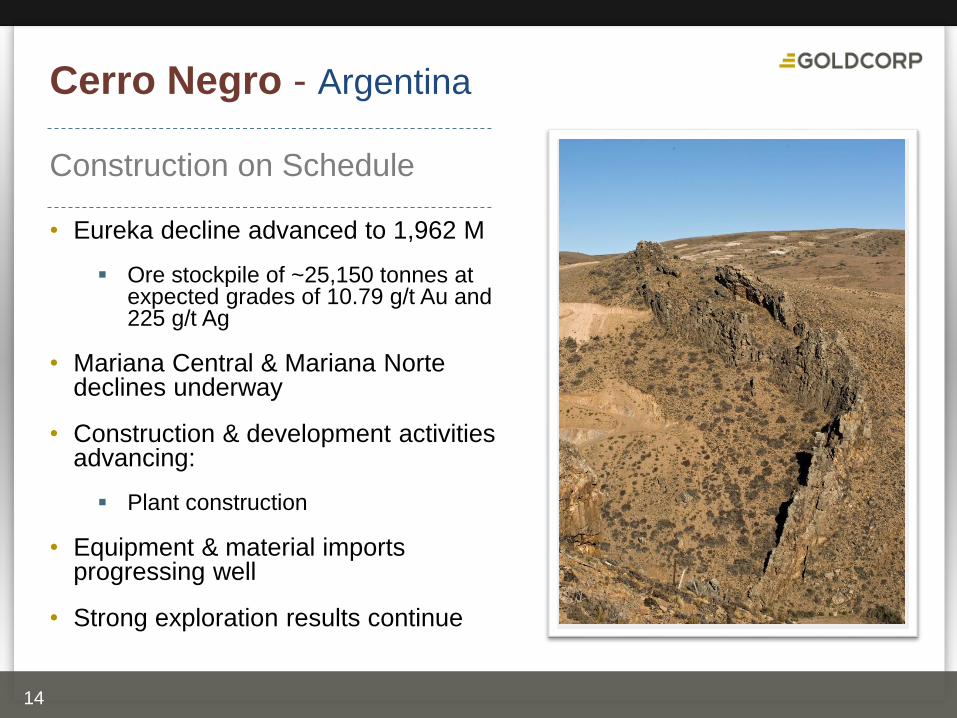
Cerro Negro - Argentina
• Eureka decline advanced to 1,962 M
Ore stockpile of ~25,150 tonnes at expected grades of 10.79 g/t Au and 225 g/t Ag
• Mariana Central & Mariana Norte declines underway
• Construction & development activities advancing:
Plant construction
• Equipment & material imports progressing well
• Strong exploration results continue
14
Construction on Schedule
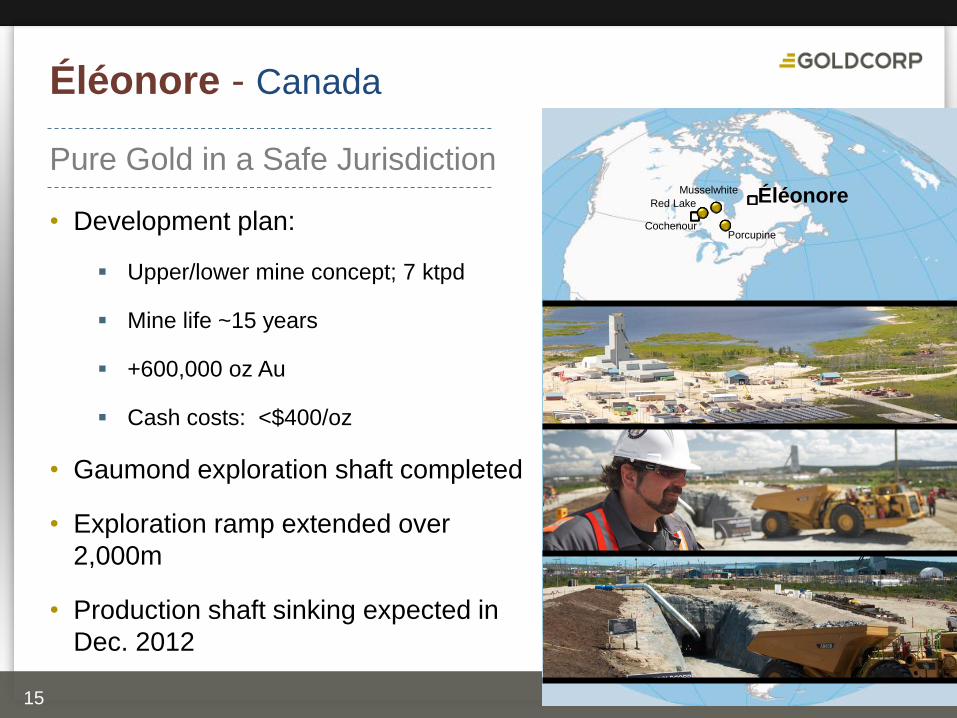
Éléonore - Canada
• Development plan:
Upper/lower mine concept; 7 ktpd
Mine life ~15 years
+600,000 oz Au
Cash costs: <$400/oz
• Gaumond exploration shaft completed
• Exploration ramp extended over
2,000m
• Production shaft sinking expected in
Dec. 2012
15
Pure Gold in a Safe Jurisdiction Red Lake
Cochenour
Musselwhite
Porcupine
Éléonore
Cerro Negro
Alumbrera
El Morro
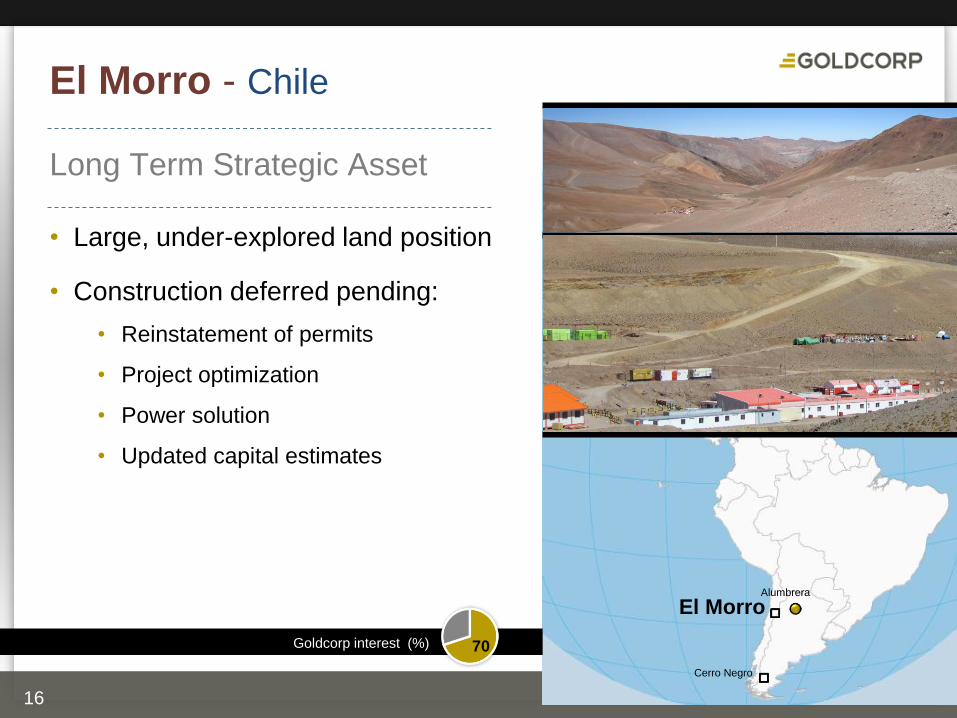
El Morro - Chile
16
Long Term Strategic Asset
Goldcorp interest (%)
70
• Large, under-explored land position
• Construction deferred pending:
• Reinstatement of permits
• Project optimization
• Power solution
• Updated capital estimates
Red Lake
Cochenour
Musselwhite
Porcupine
Éléonore
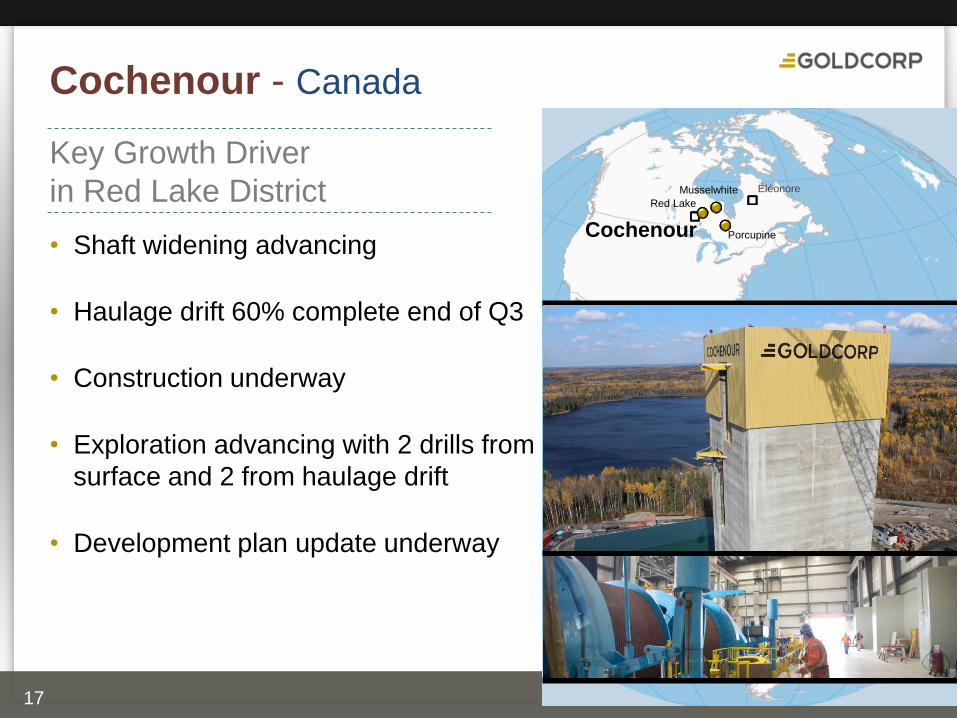
Cochenour - Canada
• Shaft widening advancing
• Haulage drift 60% complete end of Q3
• Construction underway
• Exploration advancing with 2 drills from
surface and 2 from haulage drift
• Development plan update underway
17
Key Growth Driver
in Red Lake District
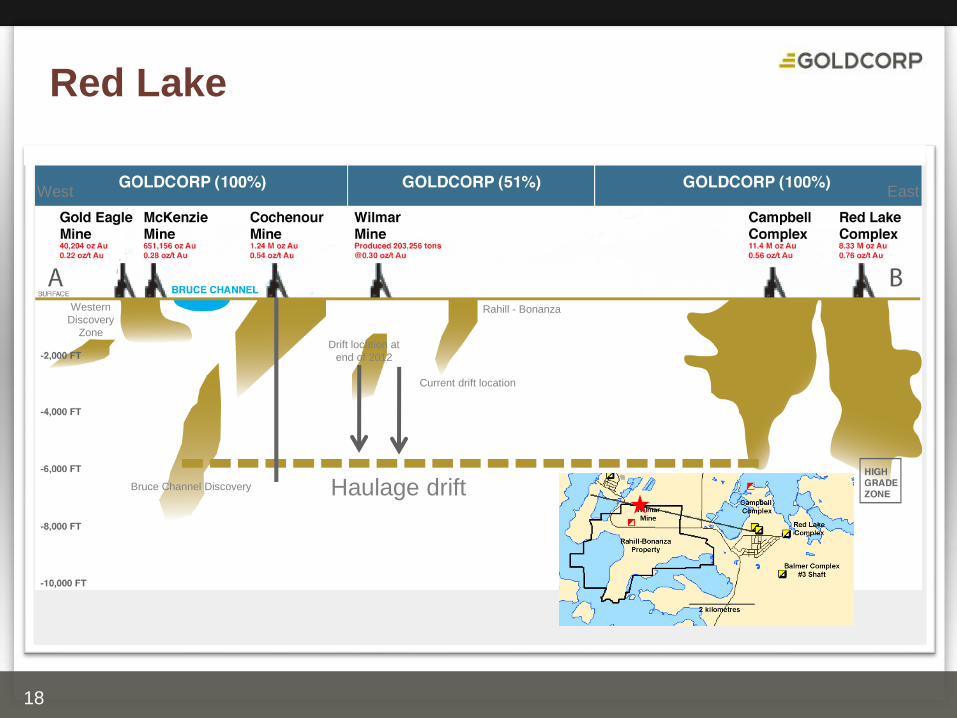
Red Lake
18
Haulage drift
Rahill - Bonanza
Bruce Channel Discovery
Western
Discovery
Zone
East West
Drift location at
end of 2012
Current drift location
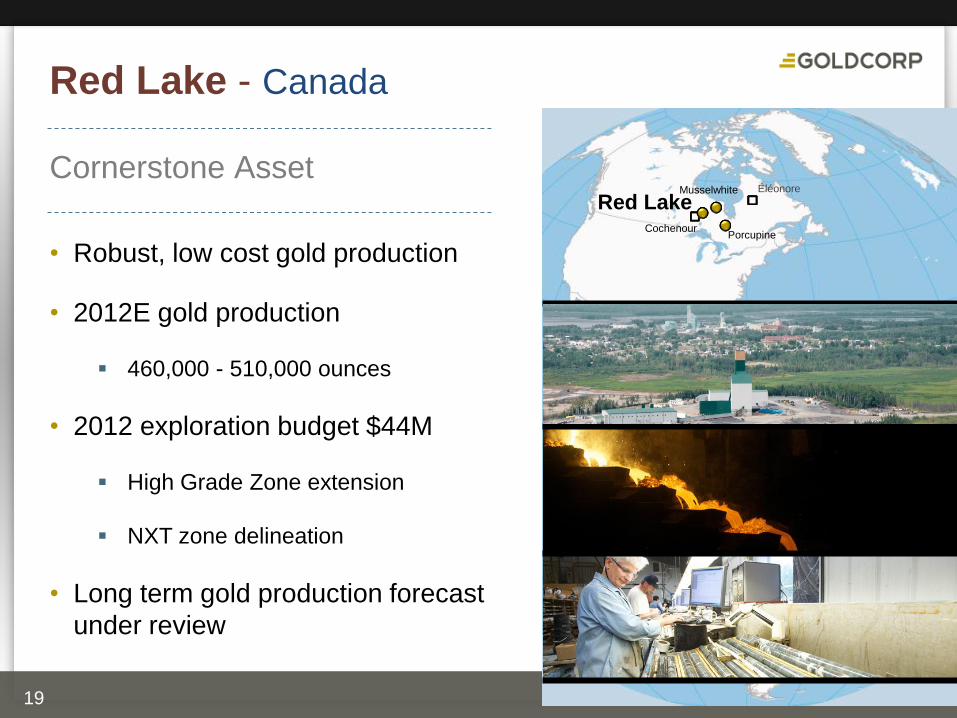
Red Lake - Canada
• Robust, low cost gold production
• 2012E gold production
460,000 - 510,000 ounces
• 2012 exploration budget $44M
High Grade Zone extension
NXT zone delineation
• Long term gold production forecast
under review
19
Cornerstone Asset Red Lake
Cochenour
Musselwhite
Porcupine
Éléonore
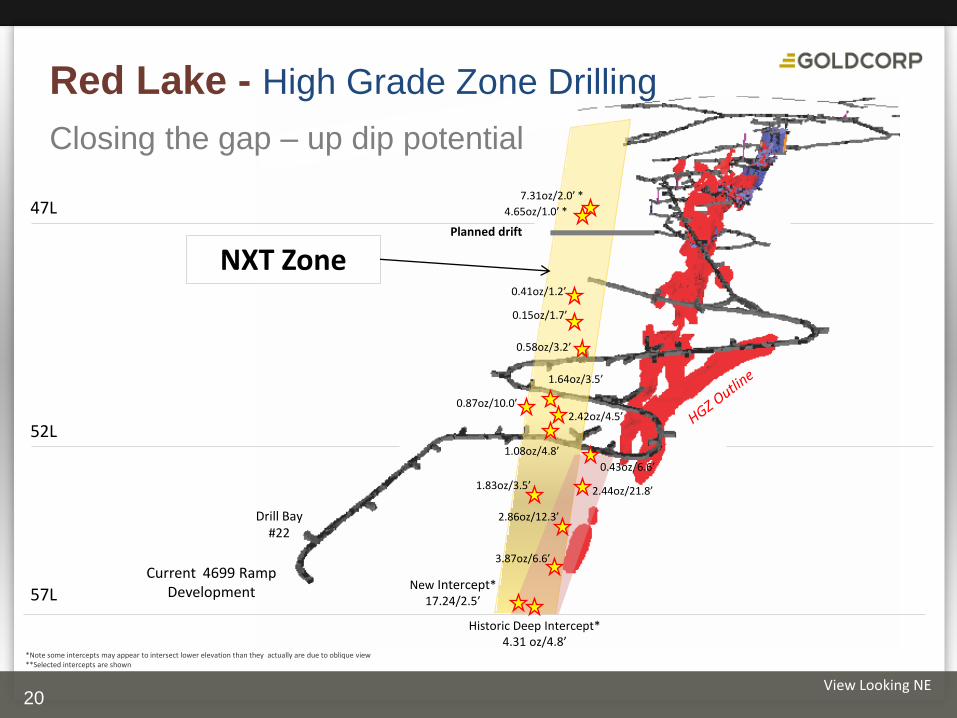
Historic Deep Intercept* 4.31 oz/4.8’
Current 4699 Ramp Development
Drill Bay #22
View Looking NE
57L
52L
47L
1.08oz/4.8’
2.42oz/4.5’
1.83oz/3.5’
0.87oz/10.0’
1.64oz/3.5’
NXT Zone
4.65oz/1.0’ *
7.31oz/2.0’ *
0.41oz/1.2’
0.15oz/1.7’
0.58oz/3.2’
New Intercept* 17.24/2.5’
3.87oz/6.6’
2.86oz/12.3’
Planned drift
2.44oz/21.8’
0.43oz/6.6’
*Note some intercepts may appear to intersect lower elevation than they actually are due to oblique view **Selected intercepts are shown
Closing the gap – up dip potential
Red Lake - High Grade Zone Drilling
20
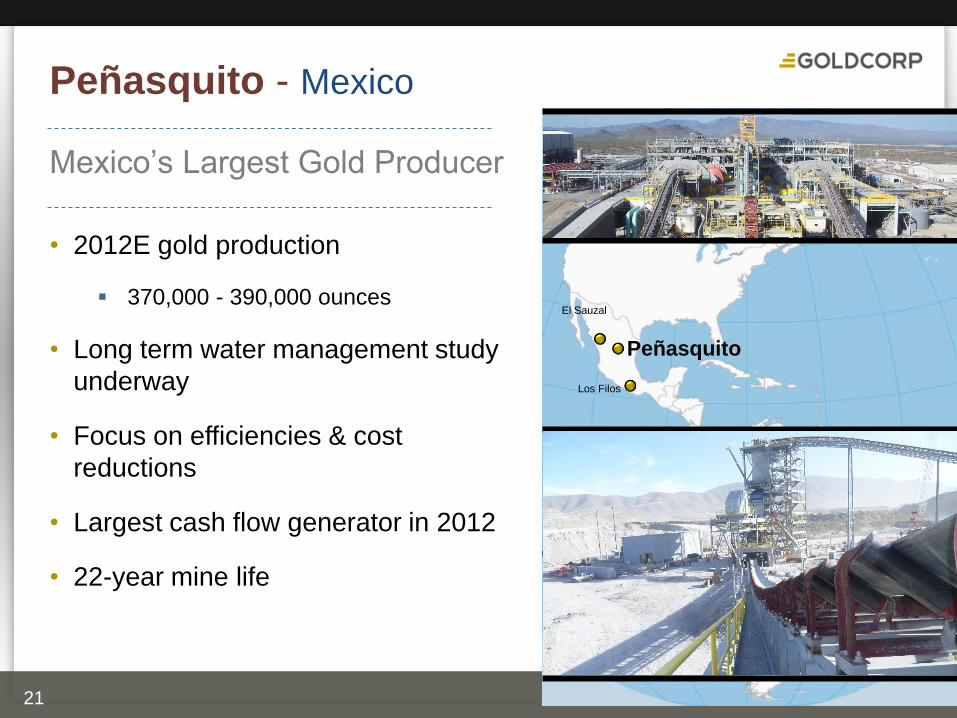
Peñasquito
Los Filos
El Sauzal
Peñasquito - Mexico
• 2012E gold production
370,000 - 390,000 ounces
• Long term water management study
underway
• Focus on efficiencies & cost
reductions
• Largest cash flow generator in 2012
• 22-year mine life
21
Mexico’s Largest Gold Producer
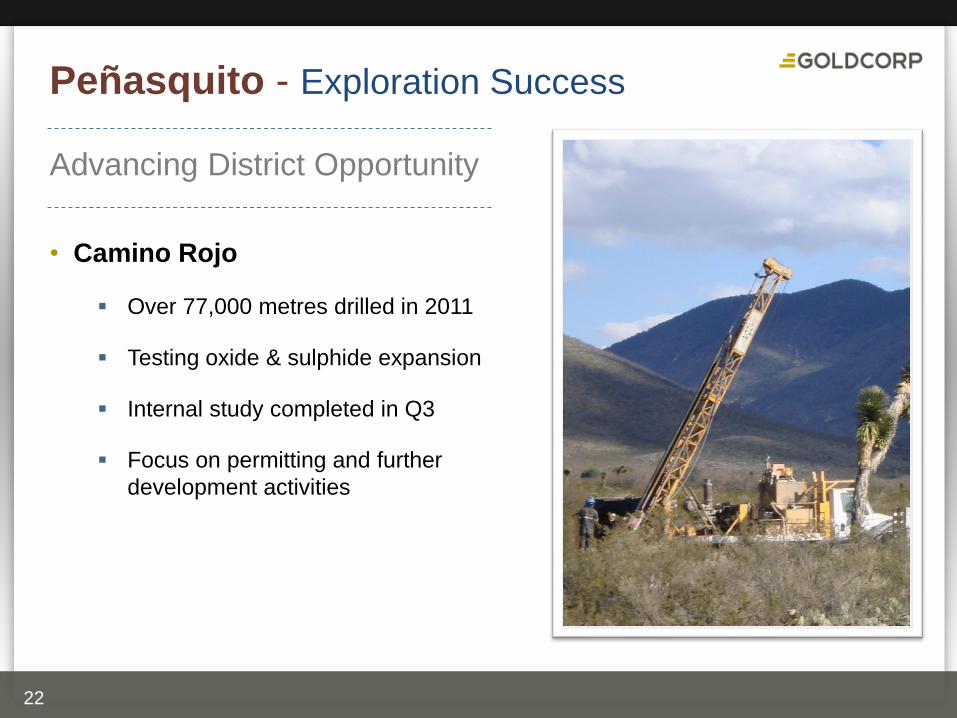
Peñasquito - Exploration Success
• Camino Rojo
Over 77,000 metres drilled in 2011
Testing oxide & sulphide expansion
Internal study completed in Q3
Focus on permitting and further
development activities
22
Advancing District Opportunity
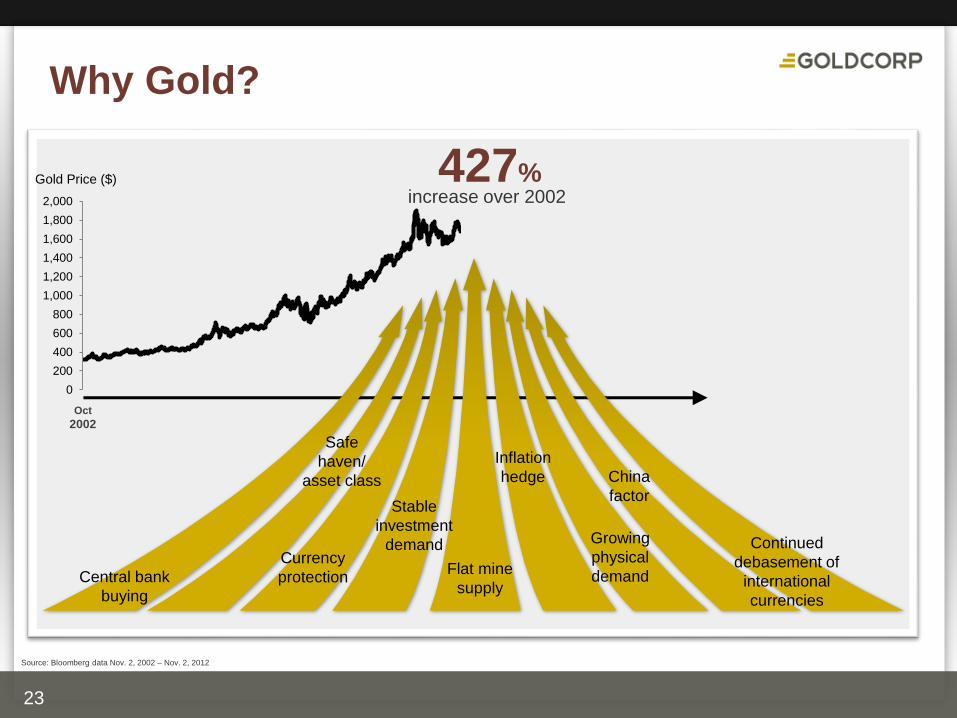
Why Gold?
23
427%
Central bank
buying
Flat mine
supply
Stable
investment
demand
Safe
haven/
asset class
Inflation
hedge
Currency
protection
Growing
physical
demand
China
factor
Continued
debasement of
international
currencies
increase over 2002
Oct
2002
Source: Bloomberg data Nov. 2, 2002 – Nov. 2, 2012
Gold Price ($)
0
200
400
600
800
1,000
1,200
1,400
1,600
1,800
2,000
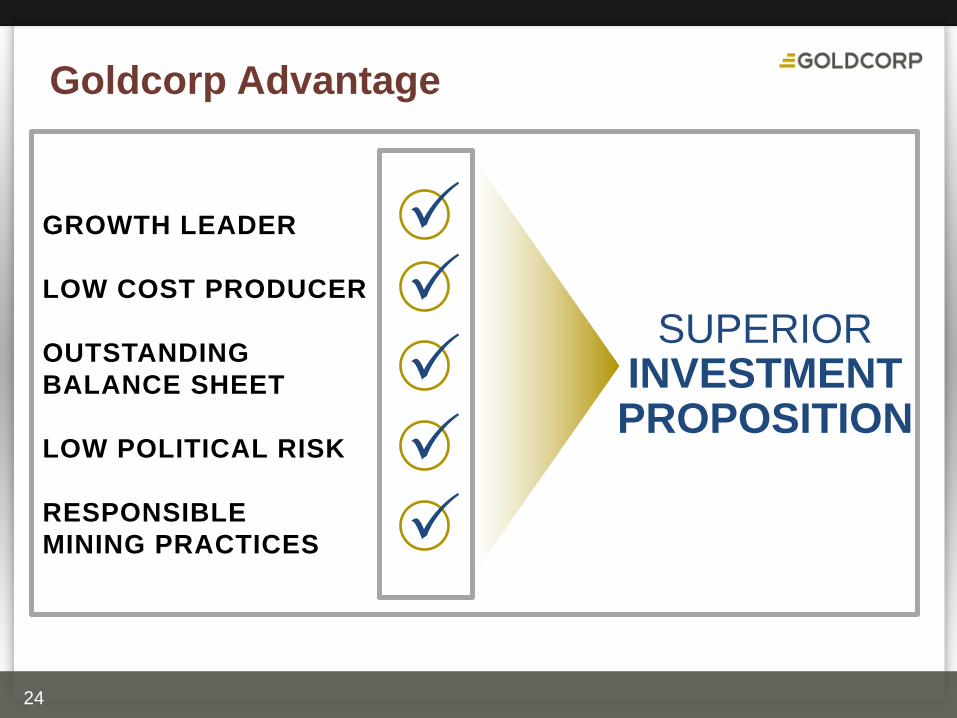
Goldcorp Advantage
24
SUPERIOR INVESTMENT PROPOSITION
GROWTH LEADER
LOW COST PRODUCER
OUTSTANDING
BALANCE SHEET
LOW POLITICAL RISK
RESPONSIBLE
MINING PRACTICES
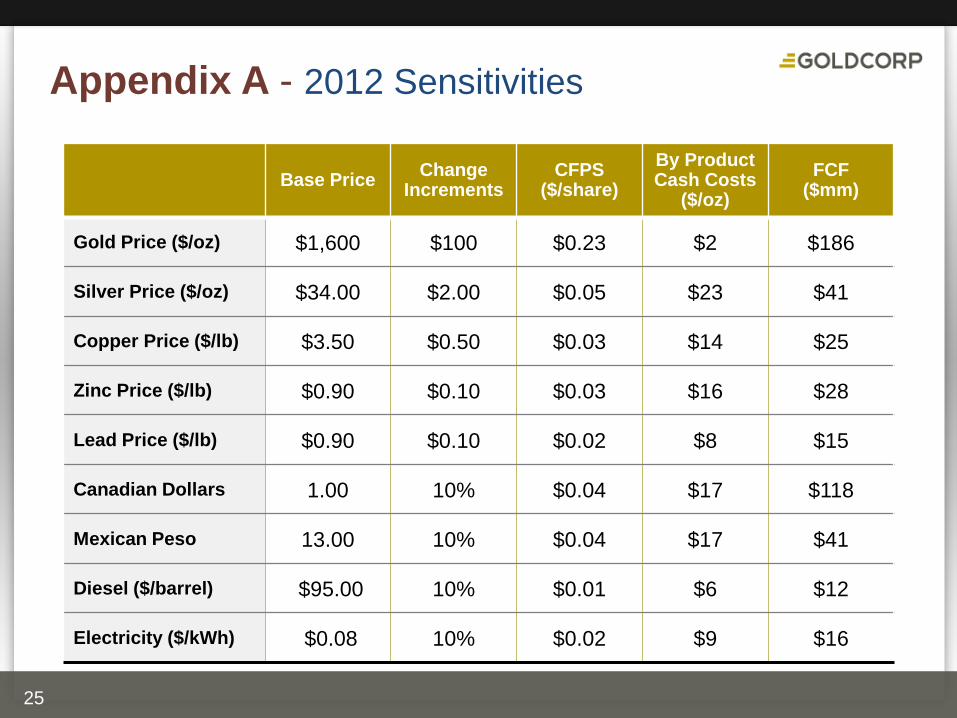
Appendix A - 2012 Sensitivities
25
Base Price Change
Increments CFPS
($/share)
By Product Cash Costs
($/oz)
FCF ($mm)
Gold Price ($/oz) $1,600 $100 $0.23 $2 $186
Silver Price ($/oz) $34.00 $2.00 $0.05 $23 $41
Copper Price ($/lb) $3.50 $0.50 $0.03 $14 $25
Zinc Price ($/lb) $0.90 $0.10 $0.03 $16 $28
Lead Price ($/lb) $0.90 $0.10 $0.02 $8 $15
Canadian Dollars 1.00 10% $0.04 $17 $118
Mexican Peso 13.00 10% $0.04 $17 $41
Diesel ($/barrel) $95.00 10% $0.01 $6 $12
Electricity ($/kWh) $0.08 10% $0.02 $9 $16
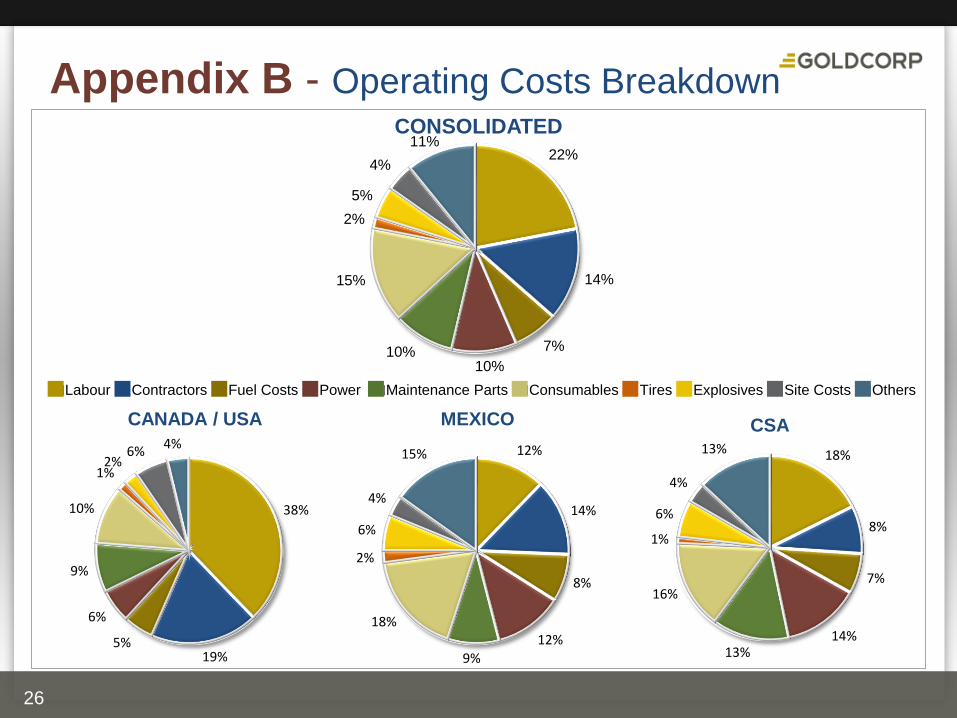
38%
19% 5%
6%
9%
10%
1% 2%
6% 4%
CANADA / USA
12%
14%
8%
12%
9%
18%
2%
6%
4%
15%
MEXICO
18%
8%
7%
14% 13%
16%
1%
6%
4%
13%
CSA
Appendix B - Operating Costs Breakdown
26
22%
14%
7%
10% 10%
15%
2%
5%
4%
11% CONSOLIDATED
Labour Contractors Fuel Costs Power Maintenance Parts Consumables Tires Explosives Site Costs Others
Endnotes
27
1. Goldcorp has included non-GAAP performance measures, total cash costs, by-product and co-product, per gold ounce, throughout this presentation. Total cash costs are defined as cost of sales divided by ounces of gold and silver sold or pounds of copper sold. The calculation of total cash costs per ounce of gold is net of by-product sales revenue (by-product copper revenues for Alumbrera; by-product silver revenues for Marlin at market silver prices; by-product lead, zinc and 75% of the silver for Peñasquito at market silver prices and 25% of the silver for Peñasquito at $3.90 per silver ounce sold to Silver Wheaton). The Company reports total cash costs on a sales basis. In the gold mining industry, this is a common performance measure but does not have any standardized meaning. The Company follows the recommendations of the Gold Institute Production Cost Standard. The Company believes that, in addition to conventional measures prepared in accordance with GAAP, certain investors use this information to evaluate the Company’s performance and ability to generate cash flow. Accordingly, it is intended to provide additional information and should not be considered in isolation or as a substitute for measures of performance prepared in accordance with GAAP. Total cash costs on a by-product basis are calculated by deducting by-product copper, silver, lead and zinc sales revenues from production cash costs.
Production costs in 2012 are allocated to each co-product based on the ratio of actual sales volumes multiplied by budget metals prices of $1,600 per ounce of gold, $34 per ounce of silver, $3.50 per pound of copper, $0.90 per pound of lead and $0.90 per pound of zinc, rather than realized sales prices.
2. All Mineral Reserves and Mineral Resources have been calculated as at December 31, 2011 in accordance with the standards of the Canadian Institute of Mining, Metallurgy and Petroleum and National Instrument 43-101, or the AusIMM JORC equivalent. Calculations of Mineral Reserves and Mineral Resources, as well as other scientific and technical information concerning Goldcorp’s mineral properties contained in this presentation, is based upon information that has been prepared by employees of Goldcorp, its joint venture partners or its joint venture operating companies, as applicable, under the supervision of Maryse Belanger, Senior Vice-President, Technical Services, who is qualified person under National Instrument 43-101. Reserve calculations incorporate current and/or expected mine plans and cost levels at each property. Varying cut-off grades have been used depending on the mine and type of ore contained in the reserves. Goldcorp’s normal data verification procedures have been employed in connection with the calculations. For a breakdown of Reserves and Resources by category and for a more detailed description of the key assumptions, parameters and methods used in calculating Goldcorp’s Reserves and Resources, see Goldcorp’s Annual information Form/ Form 40-F or the relevant technical reports on file with Canadian provincial securities regulatory authorities and the U.S. Securities and Exchange Commission.
Cautionary Note to United States Investors Concerning Estimates of Measured, Indicated and Inferred Resources: United States investors are advised that while such terms are recognized and required by Canadian regulations, the United States Securities and Exchange Commission does not recognize them. “Inferred Mineral Resources” have a great amount of uncertainty as to their existence, and as to their economic and legal feasibility. It cannot be assumed that all or any part of an Inferred Mineral Resource will ever be upgraded to a higher category. Under Canadian rules, estimates of Inferred Mineral Resources may not form the basis of feasibility or other economic studies. United States investors are cautioned not to assume that all or any part of Goldcorp’s Measured or Indicated Mineral Resources will ever be converted into Mineral Reserves. United States investors are also cautioned not to assume that all or any part of an Inferred Mineral Resource exists, or is economically or legally mineable.
3. Goldcorp’s exploration programs are designed and conducted under the supervision of Charlie Ronkos, Senior Vice-President, Exploration of Goldcorp. For information on geology, exploration activities generally, and drilling and analysis procedures on Goldcorp’s material properties, see Goldcorp’s Annual Information Form/Form 40-F on file with Canadian provincial securities regulatory authorities and the U.S. Securities and Exchange Commission.