gold nanorod in reverse micelles: a fitting fusion to ... · pdf filegold nanorod in reverse...
TRANSCRIPT
S1
Gold nanorod in reverse micelles: a fitting fusion to catapult lipase activity
Subhabrata Maiti, Moumita Ghosh and Prasanta Kumar Das*
Department of Biological Chemistry, Indian Association for the Cultivation of Science,
Jadavpur, Kolkata-700032, India. E-mail: [email protected]
Electronic Supplementary Information (ESI)
Materials.
Chromobacterium viscosum lipase (E.C.3.1.1.3 Type XII), HAuCl4 (30 wt. %) in dilute
hydrochloric acid solution, FITC and uranyl acetate were purchased from Sigma-Aldrich
Chemical Company, USA and were used as received. Analytical grade CTAB was purchased
from Spectrochem (India) and it was crystallized three times from methanol/diethyl ether.
Recrystallized CTAB was without minima in its surface tension plot. HPLC-grade isooctane,
n-hexanol, ascorbic acid, NaBH4, sodium salt of fluorescein and all other reagents were
purchased from SRL (India) and were of highest analytical grade. Trisodium citrate, silver
nitrate was procured from Merck (India). The UV-visible absorption spectra were recorded
on a Varian Cary-50 spectrophotometer. Bruker Avance DPX-300 spectrophotometer was
used to perform 1H NMR spectra. Substrate, p-nitrophenyl-n-octanoate was synthesized
following previously reported protocols.1
Preparation of gold nanorod (GNR). GNR-solution having different aspect ratio was
synthesized by following protocols described elsewhere (Reference 5 in the main
manuscript). Briefly, 5 mL of aqueous solution of cetyltrimethylammonium bromide (CTAB)
was prepared with HAuCl4. The final concentrations of CTAB and HAuCl4 were 0.1 M and 1
mM, respectively. Next, ascorbic acid and AgNO3 were added in this solution so that reaction
Electronic Supplementary Material (ESI) for Chemical CommunicationsThis journal is © The Royal Society of Chemistry 2011

S2
concentration of ascorbic acid was 2 mM and that of AgNO3 was 0.10, 0.15 and 0.20 mM,
respectively for GNR-1, GNR-2 and GNR-3. The solution color changed from orange to
colorless upon the addition of ascorbic acid. Finally, 50μL of 1mM freshly prepared aqueous
NaBH4 solution was added. The solution color started to appear pink-violet within few min
indicating the formation of gold nanorods.
This GNR-solution was ultracentrifugated at 40000 rpm for 30 min to remove excess
CTAB by discarding the supernatant. The GNR-residue was then dispersed with phosphate
buffer (pH=6, 20mM), which was used to prepare microemulsions, to check enzyme activity
and for all other studies.
Preparation of reverse micelles and GNR-doped reverse micelles.
The requisite quantity of CTAB was dispersed in isooctane in a 2 mL volumetric flask, to
which the calculated amount of n-hexanol was added to attain the corresponding z ([n-
hexanol]/[surfactant]) value and shaken vigorously. Finally, aqueous buffer (phosphate)
solution was added (to reach the corresponding W0), and the whole suspension was vortexed
to obtain a clear homogeneous solution of CTAB (50 mM)/isooctane/n-hexanol/water reverse
micelle. GNR-doped reverse micelle was prepared by following the same procedure where
abovementioned GNR-solution was used to attain desired concentration and rest of the
volume was made up with buffer as when needed to achieve corresponding W0.
Activity of lipase in reverse micelle.
The second-order rate constant (k2) in lipase-catalyzed hydrolysis of p-nitrophenyl-n-
octanoate in w/o microemulsions was determined spectrophotometrically at the isosbestic
points (Table S1) as described previously.1,2 In a typical experiment, 4.5 μL of the aqueous
enzyme stock solution (0.34 mg/mL) followed by 10 μL of the substrate stock solution (0.45
M) in isooctane were added to the previously prepared 50 mM CTAB or GNR doped CTAB
reverse micelle solution (1.5 mL) at pH=6 (pH refers to the pH of the aqueous buffer
Electronic Supplementary Material (ESI) for Chemical CommunicationsThis journal is © The Royal Society of Chemistry 2011

S3
solutions used for preparing the w/o microemulsions; pH within the water pool of w/o
microemulsions did not vary significantly, <1 unit),1 in a cuvette to make the particular W0
and reactant concentrations. It was then shaken by hand until solution becomes clear. The
initial linear rate of increase in absorbance of liberated p-nitrophenol was then recorded at
their respective isosbestic points (λiso). The overall concentrations of lipase and p-
nitrophenyl-n-octanoate were 1.02 × 10⁻⁶ g/mL and 3 ×10⁻³ M, respectively. Although the
lipase was essentially confined to the dispersed water droplets (at the oil/water interface), for
simplicity, the concentration of reactants were referred to the overall concentration to avoid
the complexity of the volume fraction of water droplet in the w/o microemulsions and the
partitioning coefficient of the substrate.1,2 Furthermore we measured the second-order rate
constant (k2) instead of first-order Michaelis–Menten catalytic constant (kcat), since the initial
rate of lipase catalyzed hydrolysis of p-nitrophenyl-n-octanoate was observed to be first order
with respect to the substrate concentration (Figure S2).1
Circular Dichroism (CD) Spectra. The CD spectra of Lipase in CTAB and GNR-doped CTAB reverse micelles with varying W0
were recorded in Jasco J-815 using 2 mm path length cell at wavelength 220-300 nm with a
scan speed of 50 nm/min (CD spectra could not be measured below 220 nm due to off scale
signal). All the spectra were corrected by subtracting a blank spectrum (without enzyme) and
accumulated 6 times. Results were expressed in terms of mean residue ellipticity
(degcm2dmol-1). The final concentration of the lipase was 25 μg/mL.
TEM Studies.
4 µL of the solution containing the GNRs (either in water or reverse micelles) were placed on
300-mesh Cu coated TEM grid and dried under vacuum for 4 h before taking TEM images.
For the negatively stained images of lipase in CTAB reverse micelles in absence and
presence of GNR, aqueous solution (4 μL) of freshly prepared uranyl acetate (2 %, w/v) was
Electronic Supplementary Material (ESI) for Chemical CommunicationsThis journal is © The Royal Society of Chemistry 2011
S4
used. Final concentration of protein and Au was 2.5 μg/mL and 20 μM within reverse
micelle. TEM measurements were performed on JEOL JEM 2010 microscope.
Fluorescence studies
The luminescence spectra of FITC were taken by exciting at wavelength of 495 nm in water,
isooctane and the CTAB reverse micelles at different z and W0 both in absence and presence
of GNR solution. FITC in DMSO (5 μL) was diluted to 1 mL solution (water, isooctane or
the microemulsion of CTAB) before taking the luminescence spectra. Final concentration of
FITC was 5 μg/mL. The excitation and emission slits were kept at 5 nm. Fluorescence spectra
were recorded in Varian Cary Eclipse luminescence spectrometer.
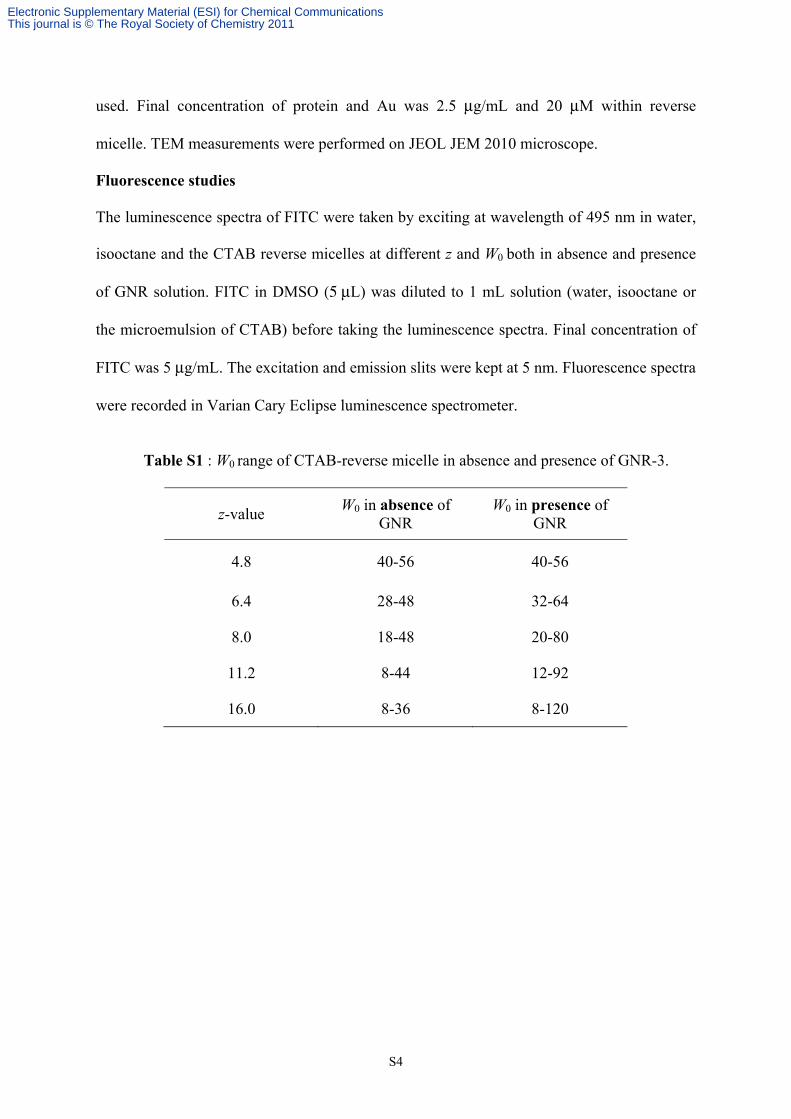
Table S1 : W0 range of CTAB-reverse micelle in absence and presence of GNR-3.
z-value W0 in absence of
GNR W0 in presence of
GNR
4.8 40-56 40-56
6.4 28-48 32-64
8.0 18-48 20-80
11.2 8-44 12-92
16.0 8-36 8-120
Electronic Supplementary Material (ESI) for Chemical CommunicationsThis journal is © The Royal Society of Chemistry 2011
S5
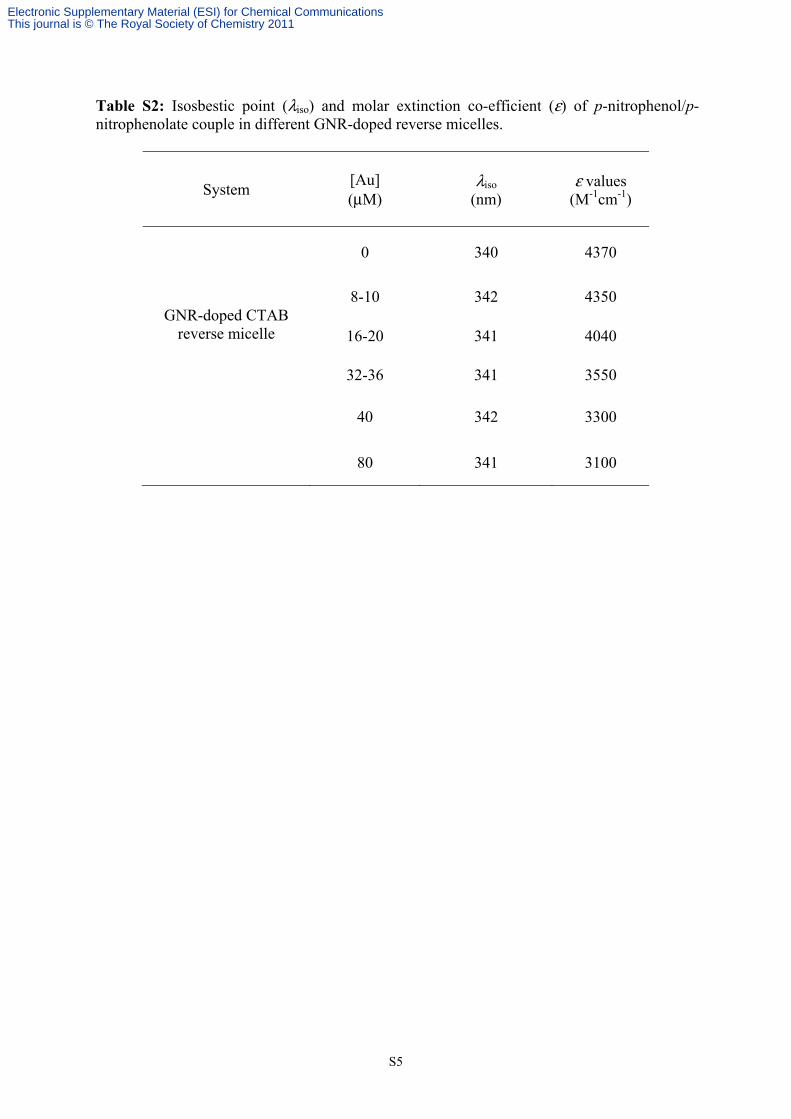
Table S2: Isosbestic point (λiso) and molar extinction co-efficient (ε) of p-nitrophenol/p-nitrophenolate couple in different GNR-doped reverse micelles.
System [Au] (μM)
λiso (nm)
ε values (M-1cm-1)
GNR-doped CTAB reverse micelle
0 340 4370
8-10 342 4350
16-20 341 4040
32-36 341 3550
40 342 3300
80 341 3100
Electronic Supplementary Material (ESI) for Chemical CommunicationsThis journal is © The Royal Society of Chemistry 2011

S6
Fig. S1 a) UV-vis spectra of the synthesized GNR. (b-d) TEM images of GNR-1, GNR-2 and GNR-3, respectively. e) UV-Vis spectra of GNR-1, GNR-2 and GNR-3 in CTAB-reverse
micelle (z= 8.0, W0=40, [Au]=40 μM). (f-h)TEM images of GNR-1, GNR-2 and d) GNR-3, respectively in reverse micelle at same condition.
Fig. S2 Plot of second order rate constant (k2) of lipase hydrolysis of p-nitrophenyl-n-octanoate in GNR-doped CTAB-reverse micelle with varying substrate concentration at z = 6.4 and W0 = 44. [CTAB] = 50mM
Electronic Supplementary Material (ESI) for Chemical CommunicationsThis journal is © The Royal Society of Chemistry 2011
S7
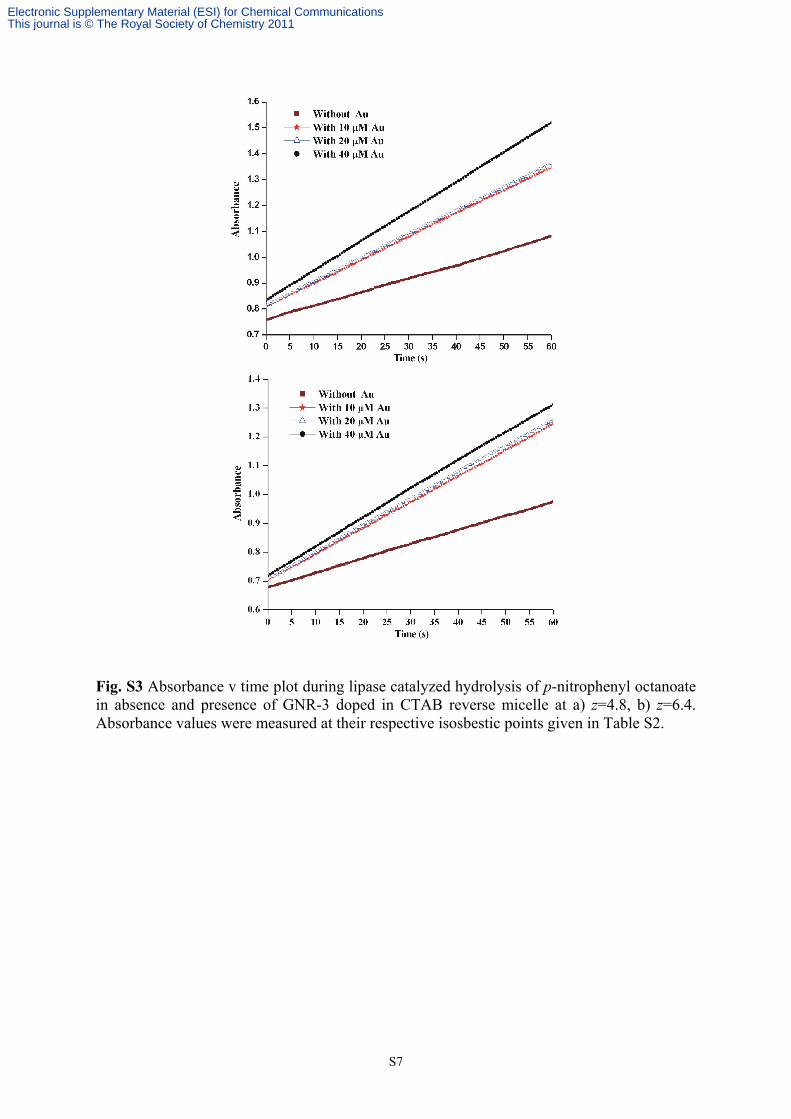
Fig. S3 Absorbance v time plot during lipase catalyzed hydrolysis of p-nitrophenyl octanoate in absence and presence of GNR-3 doped in CTAB reverse micelle at a) z=4.8, b) z=6.4. Absorbance values were measured at their respective isosbestic points given in Table S2.
Electronic Supplementary Material (ESI) for Chemical CommunicationsThis journal is © The Royal Society of Chemistry 2011

S8
Fig. S4 Variation of the second-order rate constant k2 for the lipase-catalyzed hydrolysis of p-nitrophenyl-n-octanoate in GNR-3 doped CTAB reverse micelles with varying Au concentrations at different z and 25 °C. [CTAB]=50 mM, [enzyme]=1.02 μgmL-1, [substrate]= 3 mM.
Fig. S5 Fluorescence spectra of FITC a) in aqueous pH=6 phosphate buffer in absence and presence of varying concentration of GNR; b) in 50mM CTAB-reverse micelle at z=6.4, W0=44 in absence and presence of different GNR concentration; c) in CTAB-reverse micelle in absence and presence of GNR at z=6.4 with increasing W0 and constant [Au]=40 μM. The excitation and emission slit width were 5 nm. References: 1. D. Das, P. K. Das, Langmuir, 2003, 19, 9114; D. Das, S. Roy, R. N. Mitra, A. Dasgupta, P. K. Das, Chem. Eur. J., 2005, 11, 4881. 2. A. Shome, S. Roy, P. K. Das, Langmuir, 2007, 23, 4130; P. D. I. Fletcher, B. H. Robinson, R. B. Freedman, C. Oldfield, J. Chem. Soc. Faraday Trans., 1985, 81, 2667.
Electronic Supplementary Material (ESI) for Chemical CommunicationsThis journal is © The Royal Society of Chemistry 2011