global talent monitor - shl.ru · global talent monitor global talent trends q1 2017 employee...
TRANSCRIPT
Global Talent MonitorGlobal Talent Trends Q1 2017
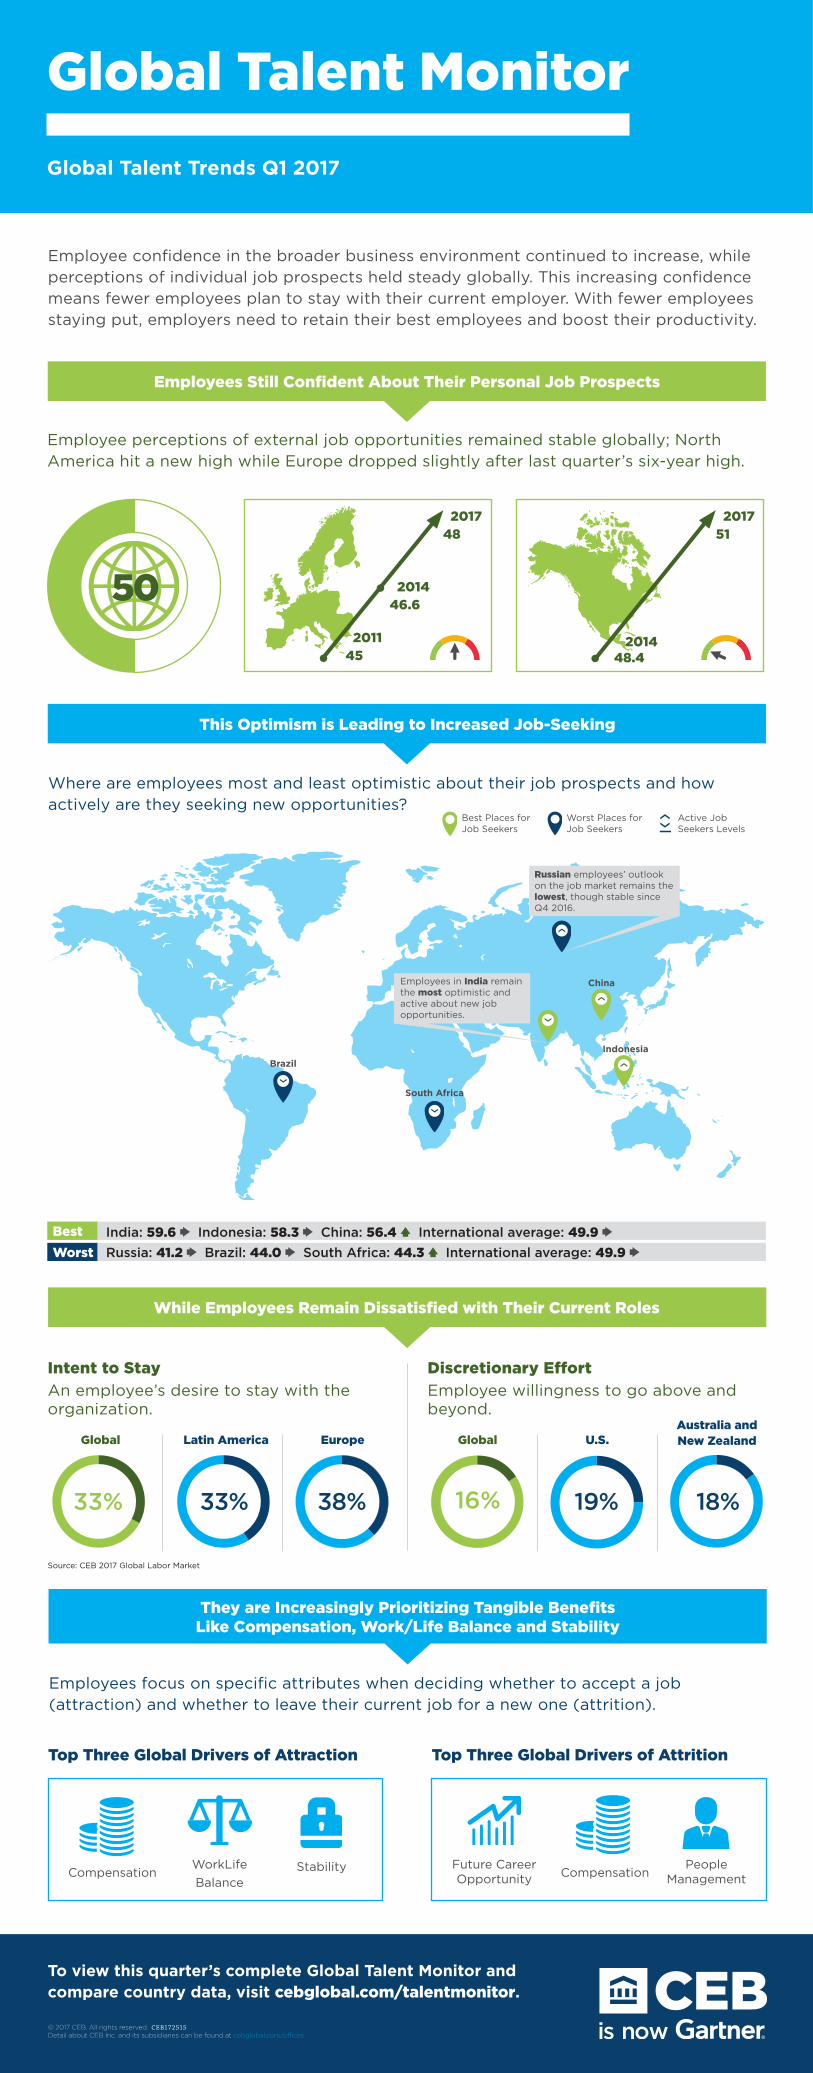
Employee confidence in the broader business environment continued to increase, while perceptions of individual job prospects held steady globally. This increasing confidence means fewer employees plan to stay with their current employer. With fewer employees staying put, employers need to retain their best employees and boost their productivity.
Employees Still Confident About Their Personal Job Prospects
© 2017 CEB. All rights reserved. CEB172515 Detail about CEB Inc. and its subsidiaries can be found at cebglobal.com/offices.
Employee perceptions of external job opportunities remained stable globally; North America hit a new high while Europe dropped slightly after last quarter’s six-year high.
Intent to StayAn employee’s desire to stay with the organization.
Discretionary EffortEmployee willingness to go above and beyond.
While Employees Remain Dissatisfied with Their Current Roles
Employees focus on specific attributes when deciding whether to accept a job (attraction) and whether to leave their current job for a new one (attrition).
They are Increasingly Prioritizing Tangible Benefits Like Compensation, Work/Life Balance and Stability
Top Three Global Drivers of Attraction Top Three Global Drivers of Attrition
StabilityWorkLifeBalance
Future Career Opportunity
People ManagementCompensation Compensation
Where are employees most and least optimistic about their job prospects and how actively are they seeking new opportunities?
Worst Places for Job Seekers
Best Places for Job Seekers
Active Job Seekers Levels
Russian employees’ outlook on the job market remains the lowest, though stable since Q4 2016.
Employees in India remain the most optimistic and active about new job opportunities.
This Optimism is Leading to Increased Job-Seeking
Indonesia
China
Brazil
South Africa
BestWorst
India: 59.6 Indonesia: 58.3 China: 56.4 International average: 49.9 Russia: 41.2 Brazil: 44.0 South Africa: 44.3 International average: 49.9
201145
201446.6
201748
2014 48.4
201751
Source: CEB 2017 Global Labor Market
Global Global Latin America U.S.EuropeAustralia and New Zealand
50
To view this quarter’s complete Global Talent Monitor and compare country data, visit cebglobal.com/talentmonitor.
16%33% 19%33% 38% 18%