geomorphic assessment w ountyline evee etback …
TRANSCRIPT
GEOMORPHIC ASSESSMENT
WHITE RIVER AT COUNTYLINE LEVEE SETBACK PROJECT
Prepared for King County
Department of Natural Resources and Parks
Prepared by Herrera Environmental Consultants, Inc.

GEOMORPHIC ASSESSMENT
WHITE RIVER AT COUNTYLINE LEVEE SETBACK PROJECT
Prepared for King County
Department of Natural Resources and Parks Water and Land Resources Division
River and Floodplain Management Section 201 South Jackson Street, Suite 600
Seattle, Washington 98104
Prepared by Herrera Environmental Consultants, Inc.
2200 Sixth Avenue, Suite 1100 Seattle, Washington 98121 Telephone: 206/441-9080
December 12, 2013

i jr 10-04770-000 white river geomorphic assessment
CONTENTS Introduction ................................................................................................. 1
Project Site and Study Area ......................................................................... 3 Underlying Constraints and Assumptions .......................................................... 3
Methodology ................................................................................................. 7
Field Reconnaissance ................................................................................. 7 Geomorphic Response ................................................................................ 7 Sediment Budget ...................................................................................... 9
Coarse Sediment Budget ...................................................................... 9 Fine Sediment Budget ......................................................................... 9
Results ...................................................................................................... 11
Field Reconnaissance and Existing Subsurface Data ............................................ 11 Geomorphic Response ............................................................................... 13
Historical Context of Site Conditions ....................................................... 14 Potential for Erosion in the Left Bank Wetland Following Project Completion ...... 22 Expected Geomorphic Evolution with Project ............................................ 22 Future Conditions in the Absence of the Project ......................................... 27
Sediment Budget ..................................................................................... 27 Coarse Sediment Budget ..................................................................... 29 Fine Sediment Budget ........................................................................ 31
Summary of Findings ...................................................................................... 33
References ................................................................................................. 35
Appendix A Sand Flux Calculations

ii jr 10-04770-000 white river geomorphic assessment
TABLES Table 1. Summary of Analog Sites Used in This Study. ................................... 8
Table 2. Sediment Budget Summary of Most Likely Conditions for the Project Site. .................................................................................. 28
FIGURES Figure 1. White River Countyline Levee Setback Project Site and Study Area. ........ 5
Figure 2. Sand Deposited in the Left Bank Area Near the King-Pierce County Boundary Line. ...................................................................... 10
Figure 3. Placed Gravel and Cobble Scoured and Exposed on Top of the Left Bank Levee Where Frequent Overtopping Occurs Near the County Boundary Line. ...................................................................... 12
Figure 4. Photograph Facing Downstream of the Left Bank Levee Overtopping Area Near the County Boundary Line During the February 2012 High Flow Event at Approximately 6,700 cfs (King County 2012a). ............... 12
Figure 5, Sheet A. Historical ICRI Map (c. 1914) of the Countyline Reach from Sometime Prior to the Completion of the Levees, but After the Formation of the ICRI. ............................................................. 15
Figure 5, Sheet B. Historical ICRI Map (c. 1914) of the Countyline Reach from Sometime Prior to the Completion of the Levees, but After the Formation of the ICRI. ............................................................. 17
Figure 6. Subsurface Sampling at the White River Countyline Project Site, Pacific, Washington. ............................................................... 19
Figure 7. Expected Fully Evolved White River Countyline Levee Conditions, 30 Years Following Construction. .................................................... 23
December 2013
Geomorphic Assessment — White River at Countyline Levee Setback Project 1
IINTRODUCTION The White River at Countyline Levee Setback (Countyline) project is a flood risk reduction and salmon recovery project located on the left (east) bank of the White River between river mile (RM) 5.0 and RM 6.33. Implementation of the Countyline project will reconnect approximately 115 acres of forested wetland and historical floodplain to the main stem of the White River by removing the existing left bank levee and constructing a new setback levee and biorevetment along the eastern edge of the project boundary. The reconnection of the historical floodplain to the White River has the potential to alter sediment transport and deposition within the project reach and downstream of the project site. The geomorphic response to the proposed project and the associated impacts to the White River are expected to vary through time depending on the magnitude, frequency, and duration of future river flows. This memorandum also describes significant geomorphic risks that are expected if the proposed project is not implemented.
In partial fulfillment of Task 300.3 of Herrera’s contract with King County for analysis and design of the proposed project (Contract #E00187E10), this technical memorandum outlines the approach, analytical methods, and results of a geomorphic assessment of the potential evolution of the floodplain within the project site after levee removal and the potential evolution of the project site and surrounding vicinity for existing and future conditions if the project is not constructed. Specifically, this technical memorandum describes the geomorphic assessments completed under two separate subtasks:
1. Task 300.1, which included a field reconnaissance of the project site, a characterization of the likely floodplain evolution following project completion, and quantitative assessments of the volumes of coarse and fine sediment that may be deposited within the project site and exported from the project site over the short-term (after about 3 years), the medium-term (after about 10 to 15 years), and with fully evolved conditions (expected to occur after about 30 years) following project completion.
2. Task 300.2, which included a characterization of the likely physical effects of the exported coarse and fine sediment on the White River channel adjacent to and downstream of the project site to RM 4.75 over the short-term, the medium-term and fully evolved condition after project completion. The characterization also included the effects of fine sediment export to the left bank wetland within the project site.
Much of the information discussed in this memorandum is summarized in several other reports and memoranda associated with the project. These documents include:
Herrera (2010) – A sediment trends analysis of the lower White River (Contract #E00111E08: Task 6). This report and its appendices documented past geomorphic change in the White River channel and its floodplain from RM 4.5 to RM 10.6 and predicted future trends in this broader area.
December 2013
2 Geomorphic Assessment — White River at Countyline Levee Setback Project
Herrera (2011a) – Calibration document for the RiverFLO-2D model for both sediment transport and hydraulics (Contract #E00146E08: Task 6). It provides information with regards to flow pathways throughout the site and quantitative estimates of sediment transport in a range of flood events.
Herrera (2011b) - Summary of findings in the form of an email from a field visit to a reference site in the upper Puyallup River, dated September 7, 2011 (Contract #E00187E10: Task 200.7). Unlike the proposed project, the loss of levee at the reference site was from natural erosion processes and not intentional removal. The findings indicate that the floodplain area of the reference site was reengaged in a stepwise fashion, with all woody vegetation sequentially scoured away yielding a largely braided system.
Herrera (2012a) – Technical memorandum summarizing the methods and results of hydraulic and sediment transport modeling completed as of spring 2012 (Contract #E00187E10: Task 200.4). This document concluded that sediment transport modeling was insufficiently accurate to provide reasonable estimates of future geomorphic change. The document recommended an alternative approach using expert geomorphic prediction based upon historical sediment trends and sediment budget volume calculations coupled to the hydraulic model results and a detailed analysis of similar reference sites.
Herrera (2012b) – Technical memorandum documenting the process used to generate future geomorphic surfaces (channel and floodplain) for the hydraulic modeling (Contract #E00187E10: Task 300.4). In particular, several calculations were made in the process of constructing the future surfaces. These calculations provided estimates of channel erosion and deposition volumes for particular events that may occur (e.g., avulsions, channel filling, sites of splay formation, etc.), both in existing and proposed conditions.
Herrera (2012c) – Technical memorandum documenting the approach to the remainder of the hydraulic modeling, following the decision to halt further sediment transport modeling, along with the results of the first set of model simulations completed as of June 2012 (Contract #E00187E10: Task 200.9). The model results included the first six sets of simulations covering both existing and most likely proposed conditions immediately following construction, 3 years into the future, and in “fully evolved” conditions. These results identified the suite of potential hydraulic impacts from construction of the project.
In addition to the earlier work listed above, this technical memorandum benefits from other hydraulic modeling performed under Task 200.8 (Contract #E00187E10), which was ongoing as of the time this technical memorandum was prepared. In particular, the hydraulic modeling and future surface development progressed in a stepwise fashion so as to incrementally estimate future geomorphic change. This process served as a check on the predicted geomorphic changes imposed by the project team. In turn, some of the analysis described herein was used to provide the basis for estimates made in the modeling, particularly those modeling scenarios that examined the formation of new channel networks in the left bank wetland at the project site.

December 2013
Geomorphic Assessment — White River at Countyline Levee Setback Project 3
Project Site and Study Area The proposed project is on the left (east) bank of the White River between river mile (RM) 5.00 and RM 6.33, downstream of the A Street Bridge. The project site lies mostly within the cities of Pacific and Sumner, with a portion of the project area extending into unincorporated Pierce County (Figure 1).
The study area extends between approximately RM 4.4 and RM 6.7. A study area larger than the project site is required to determine risks to adjacent infrastructure, such as the A Street Bridge, the Burlington Northern and Santa Fe Railway (BNSF) Bridge, 8th Street E (also known as Stewart Road SE) and its bridge crossing over the river, and private development on both sides of the White River.
Underlying Constraints and Assumptions The nature and pace of floodplain evolution following levee setback will depend on the location and elevation of the levee removal footprint, the magnitude and timing of future flows in the White River, and initial sediment deposition and bed scour at the left bank wetland flow inlet location. In order to proceed with the geomorphic analysis described herein, several assumptions regarding the constraints and conditions during floodplain reconnection are necessary. These assumptions are supported by the findings of previous geomorphic studies of the White River, similar river systems that have been restored elsewhere in western Washington, and the synthesis of field observations at the project site made over the course of several years by members of the project design team. In presenting these assumptions, it is recognized that various sources of uncertainty, flow variability, variability in potential channel response, natural fluctuations in the range of sediment movement, and uncertainties in previous models developed for the project may lead to outcomes that vary considerably from the most likely scenario simulated by Herrera (2012c) and described in detail in this technical memorandum. In light of these inherent uncertainties, the geomorphic analysis presented in this technical memorandum incorporates the following underlying assumptions, which are considered to span the entire spectrum of possible outcomes, ranging from minor to substantial geomorphic change:
The project site will not be influenced by volcanic events on Mount Rainier, as these events have return intervals much greater than the service life of the proposed project.
The US Army Corps of Engineers will not significantly change its operational protocol at the Mud Mountain Dam, which controls flow rates in the lower White River.
Flood fighting on the downstream left bank would prevent a full avulsion of the White River eastward and across 8th Street E.
Flood fighting along the right bank in the project site vicinity would limit channel migration in that direction.


December 2013
Geomorphic Assessment — White River at Countyline Levee Setback Project 5
Must fall on odd-numbered page
Figure 1. White River Countyline Levee Setback Project Site and Study Area.
11x17
Next page blank for back of 11x17 figure


December 2013
Geomorphic Assessment — White River at Countyline Levee Setback Project 7
MMETHODOLOGY Field Reconnaissance Two Herrera geomorphologists, accompanied by King County staff, conducted a 1-day field reconnaissance of the project reach on February 16, 2012. The purpose of the field reconnaissance was to observe and document existing conditions within the left bank wetland and floodplain along potential channel alignments that may develop as a result of the project and to observe and document existing conditions downstream and west of the project area (on the right bank) that might be impacted by the project. The flow in the White River at R Street near Auburn (USGS gage #12100490) was approximately 1,200 cubic feet per second (cfs) during the field reconnaissance and precluded crossing the active channel by foot.
Existing geomorphic conditions were documented in the field on maps (recent aerial photographs and lidar topography), in field notes, and with a digital camera. Shallow test pits were dug to a depth of approximately 24 to 36 inches with a hand shovel to observe and document surficial sediment at various locations throughout the left bank wetland and on sand and gravel bars. The locations of selected features were mapped using a GPS receiver and were added to mapped locations of shallow soil probes previously dug by others in the left bank wetland and floodplain area.
The field reconnaissance occurred on foot and began on the left bank upstream of the A Street Bridge. The field team walked the gravel bar and left bank levee and entered the wetland near RM 6.01. The team proceeded to circle the eastern edge of the wooded area in the left bank wetland and returned to the left bank levee near RM 5.85. The reconnaissance continued south along the left bank levee, to the 8th Street E Bridge near RM 5.00. From there, the reconnaissance team drove to Butte Avenue and investigated the right bank area on foot from RM 5.25 to RM 5.16. The team then drove to the end of 140th Court E and walked the left bank of the river from approximately RM 4.44 to RM 4.75. Finally, the team drove to the intersection of 8th Street E and 142nd Avenue E to investigate the left bank floodplain and stormwater drainage facilities along 8th Street E to determine if improvements to the hydraulic model had to be made in that area to accurately simulate flood flow crossing the roadway.
Geomorphic Response The results of the field reconnaissance and synthesis of existing information, subsurface data from previous investigations, historical channel activity, and professional judgment were used to identify likely locations of side-channel formation, sediment erosion and export from the site, and sediment deposition within the project site following project construction. In addition to these sources of site-specific information, three analog sites on the west slope of the Washington Cascades that have undergone recent levee removal and/or setback were considered in the analysis. These analog project sites are summarized in Table 1.
Decenber 2013
8 Geomorphic Assessment — White River at Countyline Levee Setback Project
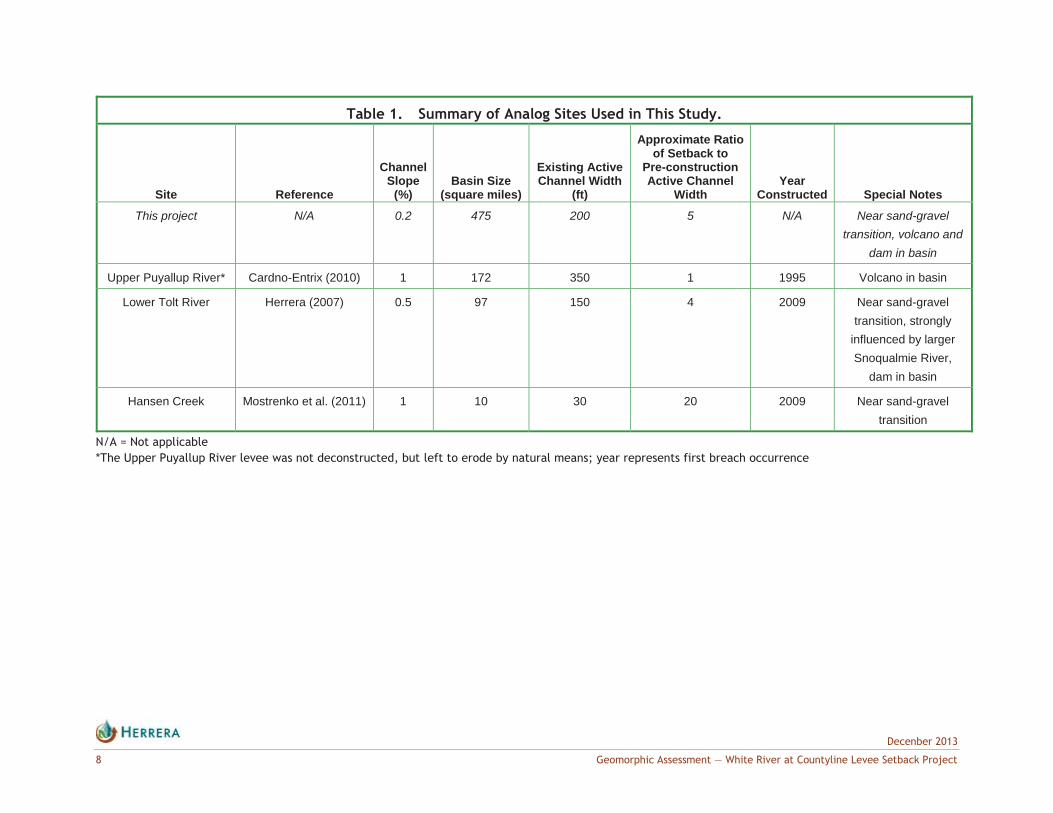
Table 1. Summary of Analog Sites Used in This Study.
Site Reference
Channel Slope
(%) Basin Size
(square miles)
Existing Active Channel Width
(ft)
Approximate Ratio of Setback to
Pre-construction Active Channel
Width Year
Constructed Special Notes
This project N/A 0.2 475 200 5 N/A Near sand-gravel transition, volcano and
dam in basin
Upper Puyallup River* Cardno-Entrix (2010) 1 172 350 1 1995 Volcano in basin
Lower Tolt River Herrera (2007) 0.5 97 150 4 2009 Near sand-gravel transition, strongly
influenced by larger Snoqualmie River,
dam in basin
Hansen Creek Mostrenko et al. (2011) 1 10 30 20 2009 Near sand-gravel transition
N/A = Not applicable *The Upper Puyallup River levee was not deconstructed, but left to erode by natural means; year represents first breach occurrence

December 2013
Geomorphic Assessment — White River at Countyline Levee Setback Project 9
In addition to the analog sites, derivation of the topographic surfaces for hydraulic modeling of future site conditions required the calculation of sediment erosion and deposition quantities. The estimated quantities, described below, were informative with respect to the volumes of sediment imported and exported under existing conditions (as estimated by King County [2012b]). These relationships provided estimates of the time required for certain changes to occur and the overall volumes of expected sediment infill at the project site. Finally, sand fluxes to the reconnected off-channel areas were estimated using the hydraulic model results incrementally, after completion of each modeled scenario, providing insight with regards to the storage capacity of the restored area over time and the amount of probable fine-grained sediment export (see Appendix A).
Sediment Budget The sediment budget was constructed using King County data in combination with a historical analysis, including the conclusions and findings of Herrera (2011), and an analysis of other streams (analog sites) in western Washington that have been restored in recent years. The model simulations were also used to estimate the sand flux to restored off-channel areas at the project site. It was critical to calculate the expected flux of sand (and finer sediments) into the left bank wetland area within the project site in order to understand the potential flood risk reduction benefits of the project. The potential coarse sediment fraction (bedload deposition) that can deposit within the site is essentially limited by the amount of coarse sediment delivered in the White River to the project site at A Street. Coarse sediment delivered to the site is well represented by bedload flux measurements at R Street (Czuba et al. 2011) minus what is deposited between R and A Streets, and coarse sediment deposition nearly equates to the observed annual deposition in recent years.
Coarse Sediment Budget Coarse sediment is defined as sediment particles with diameters the size of gravel (0.08 inches, or 2 millimeters) and greater. This material moves exclusively via bedload within the project site. To assess the impacts of the project on coarse sediment transport and deposition, comparable levee setback projects (analog sites) were considered with regard to their general effects, and in particular to evaluate the likelihood of the expected sequestration of coarse sediment in the left bank wetland. These impacts were assessed along with erosion volumes in the new channel complex and the volumes of incoming material documented by Czuba et al. (2011).
Fine Sediment Budget Fine sediment is defined as sediment particles with diameters less than 2 mm, which typically is found in suspended load in the river flow (i.e., sand, silt and clay). This does not mean that sand cannot (and will not) be transported as bedload within the project site. In fact, it will likely be common that sand is transported as bedload in inundated vegetated off-channel areas, as is currently found near the existing levee section that is frequently overtopped at the site (Figure 2). Sand will also be transported as bedload if the supply rate of sand exceeds the transport capacity of that size fraction. This might explain why a fraction (about 30 percent) of the “bed material” (i.e., the sediment material found on the riverbed, the

Decenber 2013
10 Geomorphic Assessment — White River at Countyline Levee Setback Project
elevations of which have been measured in previous repeated surveys of the main channel by King County) is composed of sand.
Figure 2. Sand Deposited in the Left Bank Area Near the King-Pierce County Boundary Line.
To estimate the downstream impact of changes in fine sediment supply due to the project, the volume of fine sediment that could potentially erode from the left bank wetland and the resulting net export of this fine sediment from the project site was compared to the known sediment throughput measured by Czuba et al. (2011). To be conservative, this calculation assumes that the entire left bank wetland will be eroded down to the elevation of the thalweg at the entrance point of flow to the left bank wetland and to the elevation of the thalweg at the flow exit point back into the mainstem channel near RM 5.25. In most locations this eroded zone varies between 1 and 3 feet in depth below the existing ground surface, above the level of the intermittent gravel seen throughout the site (see Figure 6 below). In reality, complete erosion to thalweg depths across the entire channel width is not likely for the braided channel morphology that is expected to form, but it is uncertain how much less will be eroded following project construction. This assumed depth of erosion means the eroded volume will be completely fine-grained material. The resultant volume of potential fine sediment erosion in the wetland was then compared to the estimated amount of sand retained in the wetland (as described in Appendix A) and the total amount of fine-grained sediment input into the study area documented by Czuba et al. (2011).
December 2013
Geomorphic Assessment — White River at Countyline Levee Setback Project 11
RRESULTS This section presents the results of the geomorphic analyses described above. It begins with observations made on-site in the late winter of 2012. Based upon these observations, observations made at analog sites, a historical analysis of channel dynamics within the project site, and the hydraulic model results performed to date (Herrera 2012c), possible geomorphic change following project completion is discussed and a most likely scenario is defined. Based upon the hydraulic modeling performed to date (Herrera 2012c), sand flux estimations made from those results (see Appendix A) and previous sediment accounting studies (Herrera 2010; King County 2012b), a sediment budget for the project site is presented for both fine grained and coarse sediment material. Impacts of changes in off-site sediment export in the future are then discussed in detail.
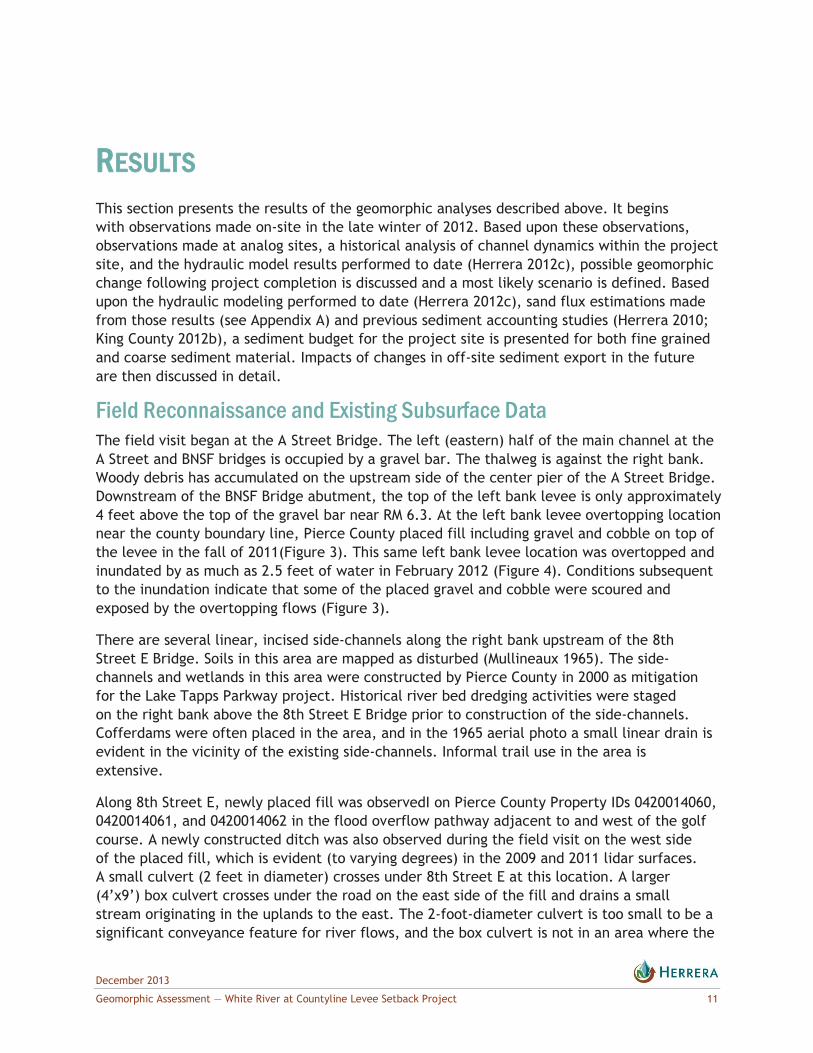
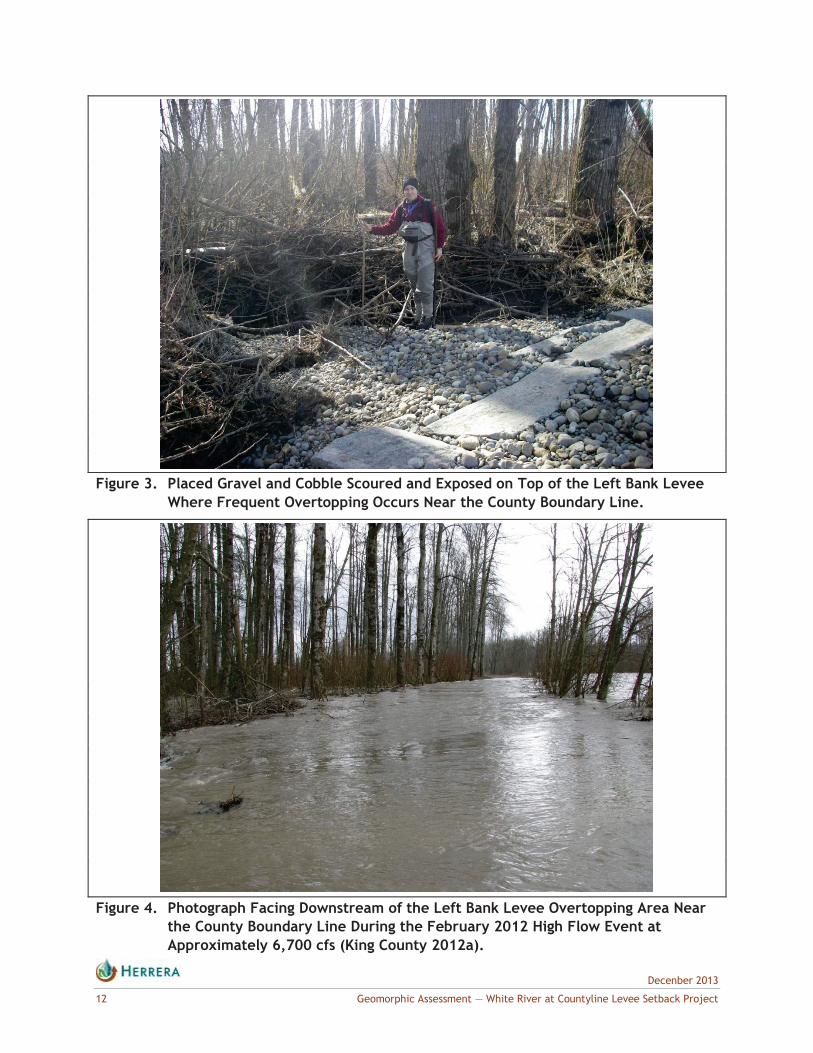
Field Reconnaissance and Existing Subsurface Data The field visit began at the A Street Bridge. The left (eastern) half of the main channel at the A Street and BNSF bridges is occupied by a gravel bar. The thalweg is against the right bank. Woody debris has accumulated on the upstream side of the center pier of the A Street Bridge. Downstream of the BNSF Bridge abutment, the top of the left bank levee is only approximately 4 feet above the top of the gravel bar near RM 6.3. At the left bank levee overtopping location near the county boundary line, Pierce County placed fill including gravel and cobble on top of the levee in the fall of 2011(Figure 3). This same left bank levee location was overtopped and inundated by as much as 2.5 feet of water in February 2012 (Figure 4). Conditions subsequent to the inundation indicate that some of the placed gravel and cobble were scoured and exposed by the overtopping flows (Figure 3).
There are several linear, incised side-channels along the right bank upstream of the 8th Street E Bridge. Soils in this area are mapped as disturbed (Mullineaux 1965). The side-channels and wetlands in this area were constructed by Pierce County in 2000 as mitigation for the Lake Tapps Parkway project. Historical river bed dredging activities were staged on the right bank above the 8th Street E Bridge prior to construction of the side-channels. Cofferdams were often placed in the area, and in the 1965 aerial photo a small linear drain is evident in the vicinity of the existing side-channels. Informal trail use in the area is extensive.
Along 8th Street E, newly placed fill was observedI on Pierce County Property IDs 0420014060, 0420014061, and 0420014062 in the flood overflow pathway adjacent to and west of the golf course. A newly constructed ditch was also observed during the field visit on the west side of the placed fill, which is evident (to varying degrees) in the 2009 and 2011 lidar surfaces. A small culvert (2 feet in diameter) crosses under 8th Street E at this location. A larger (4’x9’) box culvert crosses under the road on the east side of the fill and drains a small stream originating in the uplands to the east. The 2-foot-diameter culvert is too small to be a significant conveyance feature for river flows, and the box culvert is not in an area where the
Decenber 2013
12 Geomorphic Assessment — White River at Countyline Levee Setback Project
Figure 3. Placed Gravel and Cobble Scoured and Exposed on Top of the Left Bank Levee
Where Frequent Overtopping Occurs Near the County Boundary Line.
Figure 4. Photograph Facing Downstream of the Left Bank Levee Overtopping Area Near
the County Boundary Line During the February 2012 High Flow Event at Approximately 6,700 cfs (King County 2012a).

December 2013
Geomorphic Assessment — White River at Countyline Levee Setback Project 13
hydraulic model runs have indicated roadway overtopping. Therefore, based on the field reconnaissance, neither structure was included in the hydraulic model or in the assessment of the geomorphic response to the project.
There is evidence of recent sand deposition on the left bank of the river near approximate RM 4.6, downstream of the 8th Street E Bridge. Additionally, there is evidence of recent erosion of the gravel bar on the left bank at the large meander bend near RM 4.4.
In addition to the photographic documentation obtained during the field reconnaissance, subsurface sediment composition was investigated at several locations using a hand shovel to a depth of about 2 feet (Figure 2) to assess the potential for flows to remobilize those materials (i.e., sand, gravel, etc.) in future flood events. Although gravel bars are delineated in the left bank wetland and floodplain on historical maps of the area from the Inter-County River Improvement (ICRI) surveys (Figures 5A and 5B), none of the hand probes that were located more than few feet away from the existing levee found coarse material at the surface. Most of the surficial material within 3 feet of the floodplain ground surface is sand, with occasional silt lenses and high organic content. Figure 6 shows the location of the hand probes, along with locations of borings, test pits and hand auger holes previously completed by others. Subsurface data from the locations shown in Figure 6 indicate that aside from the immediate vicinity of the existing left bank levee where disturbance has been historically significant, there is very little gravel in the top 3 feet of the soil column away from the levee. Gravel was found regularly and intermittently throughout the left bank wetland at greater depths in hand auger and hand probe investigations by Shannon & Wilson (2009) and Paragon Research Associates (2011). However, these gravel deposits are generally thin (a few feet thick) and spatially sporadic, which is consistent with the spatially intermittent gravel bars shown on a historical map of the Stuck River (Figures 5A and 5B).
Geotechnical borings (King County 2012c) indicate that deeper than the shallow gravel, the substrate becomes finer again, though not as completely fine as the surface layer. Based on the subsurface data described here and the available data on White River sediment flux (Czuba 2011), it is assumed that the proportion of coarse material found in floodplain deposits at the project site is similar to what has been observed in the sediment load supplied to the site (i.e., 90 percent suspended load consisting of sand, silt and clay and 10 percent bedload consisting of predominantly gravel and cobble).
Geomorphic Response Estimation of future geomorphic change is aided by understanding past changes at the project site, particularly as they relate to the erosion of near-surface materials, which are the remnants of these changes. Historical documents indicate that the study area has experienced extreme changes in sediment supply and inundation in the past century (Banks 1907; Roberts 1920; Herrera 2010). While the conditions experienced in the past are not necessarily representative of existing conditions because of subsequent development (e.g., the current lack of large-scale dredging operations, the construction of Mud Mountain Dam, etc.), these past changes provide context and insight into potential geomorphic response to the project and the type of sediment to be encountered if erosion of certain areas occurs. Although much of the history of the site is documented in related existing literature (e.g., Herrera 2010; King County 2010), a brief history of the study area is recounted here as it

Decenber 2013
14 Geomorphic Assessment — White River at Countyline Levee Setback Project
relates to the evolution of the near surface, particularly the left bank wetland, in the project site.
Historical Context of Site Conditions Predevelopment Conditions The Kent and Stuck River valleys (formerly part of Puget Sound) filled with sediment following deglaciation approximately 16,000 years ago (Collins and Montgomery 2011). Radiocarbon dating of organic material in sediment obtained from borings drilled by King County (2012c) at the project site indicate that the White River fan was laid down over the past 5,000 years by the erosion and deposition of lahar (volcaniclastic mudflow, such as the 5,700-year-old Osceola mudflow) sediment deposited in the White River canyon. There have been several smaller mudflow (lahar) events since the massive Osceola mudflow (Zehfuss et al. 2003). At the project site, the White River has been confined by erosion into the fan deposits over the past 1,000 years (i.e., since the last major mudflow event), as seen in the large, steep bank at the east edge of the left bank wetland. Despite the erosive conditions, the Stuck River likely did not transport as much coarse sediment in the past because of the reduced flow available (much of the flow and coarse sediment went north to the Green River) and the presence of ubiquitous wood debris. Further, it is likely that the sand-gravel transition in the river was near, or even upstream of, the project site. It is common that deforestation, installation of flood protection infrastructure, and other modern development processes cause downstream migration of the sand-gravel transition (Frings et al. 2009), which now occurs in the White River between 8th Street E and the confluence with the Puyallup River. Finally, the project site likely contained abundant large woody debris prior to development, with many smaller channels draining through broken forest as described well in recent Puget Sound wide investigations of predevelopment conditions in the area (Collins and Montgomery 2011).
Circa 1867 to 1906 Prior to the major flood in 1906, the bulk of the White River water and sediment exited the White River canyon near present-day approximate RM 8 and flowed north to join the Green River near Auburn. At the time of initial human settlement in the mid-1800s, the Stuck River (now the White River at the project site) was only an overflow outlet distributary channel for the White River (Collins and Montgomery 2011) and appears to have transported very little coarse (gravel/cobble) material. This inference is based on the great amount of wood in the channel and distributed overbank flow across the White River alluvial fan and the remainder of the Kent Valley (Collins and Sheikh 2005). The historical Stuck River was so small or its channels so dispersed that its full length was not surveyed continuously (in a process referred as “meandering”) in preparation of General Land Office maps of the area during 1867 to 1891 (Collins and Sheikh 2004). However, the size of the Stuck River channel and the portion of the White River flow that it conveyed seems to have increased by the end of the 1800s, as reported by a subsequent surveyor who observed Stuck River channel widths of 400 feet to 600 feet, and stated “From one-fourth to one-third of the total volume of the White River, at low water, passes down the Stuck River. At high water, probably one half goes down Stuck River” (Ober 1898). Thus, Stuck River conditions during this time period seem to have been variable and transitional due to the channel incision that occurred prior to development and

December 2013
Geomorphic Assessment — White River at Countyline Levee Setback Project 15
Must fall on odd-numbered page
Figure 5, Sheet A. Historical ICRI Map (c. 1914) of the Countyline Reach from Sometime Prior to the Completion of the Levees, but After the Formation of the ICRI.
11x17
Next page blank for back of 11x17 figure


December 2013
Geomorphic Assessment — White River at Countyline Levee Setback Project 17
Must fall on odd-numbered page
Figure 5, Sheet B. Historical ICRI Map (c. 1914) of the Countyline Reach from Sometime Prior to the Completion of the Levees, but After the Formation of the ICRI.
11x17
Next page blank for back of 11x17 figure


December 2013
Geomorphic Assessment — White River at Countyline Levee Setback Project 19
Must fall on odd-numbered page
Figure 6. Subsurface Sampling at the White River Countyline Project Site, Pacific, Washington.
11x17
Next page blank for back of 11x17 figure

December 2013
Geomorphic Assessment — White River at Countyline Levee Setback Project 21
the deposition of coarse sediment in subsequent years, described below. Because the project site is at the distal edge of the fan, it would have been dominated by delivery and deposition of fine-grained material when most of the water and sediment in the White River flowed north to join the Green River, as appears to have been the case for most of this time period. The rapid expansion of flow at the exit of the White River canyon would have resulted in most of the coarse sediment depositing upstream of the project site. While patches of gravel are observed in the present-day alluvium beneath the project site ground surface, these are relatively rare and may have been deposited at times in the recent geologic past when the Stuck River carried more flow than it did during the nineteenth century.
1906-1930s The mainstem White River avulsed to the Stuck River during the 1906 flood event due to a debris jam that formed near Auburn. Following the avulsion, the construction of the Auburn Wall in 1915 ensured that the avulsion was permanent and complete. This forced the entire flow of the White River down the path of the former Stuck River. Immediately following the avulsion, there was very little in the way of natural levees and no built levees to confine the path of flood waters, though they were directed deliberately towards the Puyallup River. As a result, the White River system lost much of its historical floodplain storage capacity in the combined flow routes to the Green River and through the Stuck River distributary system. The coarse sediment supply likely increased to the project site in this time period because of reduced floodplain storage upstream (as compared to pre-1906 levels), and the sand-gravel transition likely migrated downstream of the project site, leaving large gravel bars throughout the floodplain (Figures 5A and 5B; Frings et al. 2009) as the river began to change to its current configuration. The unconstrained nature of the channel was undesirable to European settlers in the area and precipitated the construction of large levees to confine the flow, including the left bank levee at the project site. It is uncertain what year the levees were completed. From aerial photographs, it is clear that in 1931 there remained significant disturbance into the left bank wetland. However, by the time of the 1936 aerial photograph, it appears that much of the existing levee infrastructure was in place.
1930s to Present Levee construction between the BNSF railroad and 8th Street E induced sediment deposition within the channel because the river could not occupy large sections of the historical floodplain where sediment loads would otherwise be deposited. The White River channel in the Countyline project reach was dredged repeatedly until 1986 (King County 2010) to remove accumulating sediments. Since the cessation of dredging in 1986, deposition has continued (Herrera 2010). Sediment volumes deposited following cessation of dredging were initially higher due to the available storage volume for the sediment to occupy, and have diminished steadily in recent decades to the present. However, rates of sediment deposition continue to vary widely in the Countyline reach of the river, with the highest rate of deposition since the first available data in 1969 occurring in 2007 to 2009 (King County 2012b).
The levees appear to be in the same configuration as in the original design plans (Roberts 1920). The extent to which the levees were overtopped shortly after their construction is uncertain, though the presence of fine-grained materials in the left bank wetland (Figure 6) suggests that overtopping may have occurred at least occasionally. Levee overtopping

Decenber 2013
22 Geomorphic Assessment — White River at Countyline Levee Setback Project
frequency was reduced, at least initially, by the completion of Mud Mountain Dam in 1948, which significantly reduced the flood flow rates in the lower White River. It is clear that the recent and regular levee overtopping at the county line limited the type of material delivered to the floodplain to fine grained material (sand, silt and clay). As noted previously, the thickness of sand below the ground surface in the left bank wetland is approximately 3 feet in most locations (see Figure 6). This thickness equates to an average deposition rate of about one-third of an inch per year (slightly less than 1 centimeter per year) since the levee was constructed at the project site, if the levee was completed in 1935. This deposition rate is typical of off-channel floodplains, where sediment accumulation rates have been measured by more accurate methods (e.g., Lokas et al. 2010).
Potential for Erosion in the Left Bank Wetland Following Project Completion The pattern of events affecting the site described above have limited the amount of gravel deposited in the left bank wetland since about the 1930s. Gravel either deposited upstream or was isolated from this area by levees, except during the period of 1906-1930s, as observed in historical aerials taken in 1931 and 1936. The limited presence of gravel will limit its off-site export following project completion. The prevailing fine-grained materials at the surface of the left bank wetland will likely be exported when it is re-engaged following project completion. If the uppermost 3 feet of material is eroded in the path of concentrated flow, it is unlikely that the river will be able to erode vertically further for two reasons: 1) because the channel gradient through the wetland area decreases and is not steep enough to induce incision greater than 3 feet (i.e., erosion to this depth would necessitate a particularly flat portion of the profile somewhere else), and 2) the river will no longer be confined to one location where its erosive forces would need to be dissipated vertically; instead it could migrate laterally into fine-grained sediments in other portions of the wetland. Erosion that forms a headcut in the main channel bed is expected just downstream of the remaining levee because of the reductions in water surface elevations at this point; however, any of this eroded material will likely deposit a short distance from where it was eroded because of the coarse substrate size (mostly cobble) in the main channel.
Expected Geomorphic Evolution with Project From the historical behavior of this river system described above and the suite of behaviors seen in a range of analog sites and other examples in the scientific literature, there are four general possibilities for future site conditions if the left bank levee is set back on the floodplain surface east of the wetland: expected geomorphic evolution is depicted in Figure 7.
1. Minimal change – The left bank wetland is inundated regularly and serves to store floodwaters and fine sediment, but a new channel is not formed through the wetland. If flow is not concentrated enough to penetrate the thick band of vegetation on the east side of the existing left bank levee, this is a possible outcome. However, because the ground surface in the left bank wetland is much lower than the existing channel, there is a distinct possibility that a new channel will form in this area. Further, the river is able to erode into vegetated areas elsewhere in the vicinity (e.g., immediately upstream of the A Street Bridge on the left bank). Therefore, this possible outcome was deemed unlikely.

December 2013
Geomorphic Assessment — White River at Countyline Levee Setback Project 23
Must fall on odd-numbered page
Figure 7. Expected Fully Evolved White River Countyline Levee Conditions, 30 Years Following Construction.
11x17
Next page blank for back of 11x17 figure


December 2013
Geomorphic Assessment — White River at Countyline Levee Setback Project 25
2. Incremental active channel expansion – This possible mode of geomorphic evolution would entail the White River incrementally eroding through the densely forested riparian zone. This behavior was observed somewhat in historical maps of the project site (Figures 5A and 5B) and at the Orville Road analog site on the Puyallup River near Electron (Herrera 2011b). In historical times (i.e., immediately following the 1906 avulsion) at the project site, the channel rapidly expanded, consuming portions of the adjacent floodplain. At the Orville Road site, a levee was breached by the Puyallup River during the 1995 flood event. Since 1995, small portions of the vegetated floodplain have been consumed and converted to unvegetated active side-channels during each large flood event, but the current channel thalweg remains in the pre-levee-failure, unvegetated channel location. The eroded levee at this analog site and the associated area of reactivated floodplain there are much smaller than at the Countyline project site. Channel expansion in historical times was primarily due to a flow increase. With the project, total flow rates will not increase.
3. Complete avulsion – It is possible that a debris jam may form along the length of the channel downstream of the levee removal due to decreased flow in the main channel. This could initiate complete avulsion of flow into the left bank wetland. However, this outcome was deemed unlikely because the channel has not shown this behavior in the past (i.e., a debris dam spanning the entire channel width has not occurred, and would not be likely to because the active channel is much wider than a single intact piece of large woody debris).
4. Partial avulsion – As found at the Hansen Creek analog site (Mostrenko et al. 2011) in Skagit County, Washington, the White River in this case would partially avulse to the lowest portion of the wetland near the bank along its east edge (Figure 7). This open water wetland area is largely devoid of woody vegetation and would act to isolate the new avulsed channel formed in this area from the existing main channel with a band of mature vegetation in between the two channels.
These varying degrees of engagement of the wetland serve to identify the suite of possible outcomes. Based on available historical information, the project site physical setting, analog sites, and in coordination with County staff, it is assumed that a partial avulsion as graphically depicted in Figure 7 is the most likely mode of geomorphic evolution after project construction. Accordingly, a partial avulsion condition was modeled as Scenario S1 in the hydraulic model runs initially described in Herrera (2011a) and documented in detail in Herrera (2012c). Complete avulsions, which are deemed unlikely, but possible, were included in modeling for design scenarios S2 and S3, since they would stress engineered elements more than Scenario S1. Results of the initial hydraulic modeling runs of the partial avulsion scenario also were used to inform the description of likely evolution and future conditions presented herein. Following initial partial avulsion into the left bank wetland area of the project site, lateral channel migration within the project site would be the primary process shaping the evolution of the site, though forested islands may form in the middle portion of the partial avulsion pathway because of the low slope there.
Because channel migration is a stochastic process, particularly in a dynamic river system such as the White River, an exact future geomorphic configuration cannot be predicted with
Decenber 2013
26 Geomorphic Assessment — White River at Countyline Levee Setback Project
certainty. However, the most probable geomorphic evolution of the site is described below. This most probable future condition is depicted in Figure 7. The following statements can be made about the evolution of the project site and were used as assumptions in the hydraulic modeling of future conditions.
The most likely conditions following construction of the setback levee are a new channel complex separated from the existing main channel by a band of woody riparian vegetation.
Flows into the wetland will be sufficient beginning with the first floods following construction to completely remove existing mature riparian woody vegetation separating the wetland from the existing main channel, creating a new channel along the east edge of the wetland.
Flows into the wetland will be concentrated near the downstream end of the remaining left bank levee that is not removed.
The wetland is low enough and far enough away from the existing channel to isolate the newly formed main channel from the existing main channel for most of its length, sparing a band of riparian vegetation separating the new channel from the existing main channel.
All of the bedload of the White River that enters the left bank wetland will be deposited in the wetland during the first 3 years following a partial avulsion, and will be primarily confined to a splay deposit near the downstream end of the remaining left bank levee, similar to conditions found at Hansen Creek (Mostrenko et al. 2011).
The partial avulsion will follow a new path of greatest slope - first from the end of the remaining levee to the border of the wetland, then along the edge of the wetland to its southernmost point. This alignment also happens to roughly correspond to the channel alignment seen in maps of the site prior to the construction of the levees (Figures 5A and 5B).
The outlet of the new channel will be at the existing outlet of the wetland because it is the lowest point in the vicinity and the only drain point in the area.
It is likely that scour near the wetland outlet will be significant and concentrated (in a single channel) because most hydraulic simulations indicate high flow velocities in this area and the topographic gradient in this area is relatively steep.
At the new channel inlet at the end of the remaining levee a knickpoint (i.e., a place of concentrated bed erosion) will extend upstream towards the A Street Bridge, but it is not expected that it will extend beyond the A Street Bridge. The depth of scour is assumed to be a maximum of approximately 3 feet at the floodplain inlet.
Sand will be temporarily stored in overbank areas in the wetland similar to existing conditions in the constructed wetland on the right bank.
Flood fighting on the right bank will prevent migration of the active channel in that direction.
December 2013
Geomorphic Assessment — White River at Countyline Levee Setback Project 27
Future Conditions in the Absence of the Project It is important to place the ramifications of the proposed levee setback project in the context of what would occur if the project is not constructed. From the initial hydraulic model results (Herrera 2012c), it is clear that the recently observed trend of overbank flow into the left bank wetland will continue and increase with time. Flood fighting by private property owners occurred in the past to reduce the frequency of inundation of agricultural fields and the overtopping of 8th Street E in the form of earthen berms constructed along the wetland boundary near the north end of 142nd Avenue E. The hydraulic model runs for the without-project scenario indicate that the quantity and velocity of the flow and its water surface elevation will be significantly higher in the future than has been the case during floods in the recent past.
For example, by 3 years into the future (nominally 2014 because the hydraulic models of existing conditions are based on 2011 topographic information) the hydraulic model predicts that at a flow rate of approximately 5,000 cfs, which is half of the peak flow discharge during the 2-year (9,700 cfs) recurrence flood event, the left bank levee will be overtopped at the county boundary line, causing overbank flow through and out of the wetland area and on to the left bank floodplain (where the setback levee is proposed), and then flow across 8th Street E. Based upon existing, documented White River channel aggradation rates, it is estimated that the main channel elevation will have filled in with sediment to the level equivalent to the left bank levee top elevation at the county line in 13.8 years. Without the proposed project in place at that time, a flow of approximately 800 cfs (which is about half of the mean annual flow) would overtop the left bank at the county boundary line and follow the same route described above over 8th Street E.
Sediment Budget A sediment budget for the most likely conditions scenario (S1) was developed in collaboration with King County staff. The budget was constructed using the analysis from the topographic surface development process to support future conditions hydraulic modeling described initially in Herrera (2012a) and summarized in Herrera (2012c). Table 2 presents the results of this analysis. The sediment budget for the project site extends in the main channel between the A Street Bridge and the 8th Street E Bridge and corresponds to the same river reach evaluated in previous sediment budget calculations (Herrera 2010, King County 2010 and 2012b). The Sediment Input column in Table 2 reflects the annual sediment flux under the A Street Bridge in cubic yards. The Storage Volume column in Table 2 reflects the volume of sediment stored in between the A Street Bridge and the 8th Street E Bridge. The Sediment Export column in Table 2 reflects the sediment flux at 8th Street E. The total fine sediment input is derived from measurements made by the USGS at the R Street Bridge and deposition documented by King County (2012b). The coarse sediment input is derived exclusively from King County measurements of coarse sediment deposition from the project site to the White River’s confluence with the Puyallup River (King County 2012b).
As can be seen in Table 2, there is expected to be a net increase in sediment storage within the project area for a period of 10 years following project construction for both fine and coarse sediment. The totals in the table are largely consistent with the simulations of sediment transport by Czuba et al. (2010), which indicate about 1,000 cubic yards of

Decenber 2013
28 Geomorphic Assessment — White River at Countyline Levee Setback Project
deposition for each day of “high” sediment discharge (14,000 cfs in the case of Czuba et al. 2010). The estimated increases in storage of fine sediment are larger than for coarse sediment, both in terms of absolute quantities and by a percentage of existing storage. This is primarily because the fine sediment volumes capable of being stored within the project site are much larger (by approximately a factor of 10) than coarse sediment. Most of the coarse sediment supply is currently stored in the project reach, and though storage capacity will be increased by the project, it will not change the export of coarse material in a significant way once the site is fully evolved (i.e., once most of the splay deposits that comprise the natural levees along the new channel are fully formed).
Table 2. Sediment Budget Summary of Most Likely Conditions for the Project Site.
Years Following Construction
Fine Coarse Total
Sediment Input
Storage Volume
Sediment Export
Sediment Input
Storage Volume
Sediment Export
Sediment Input
Storage Volume
Sediment Export
Existing conditions 268.0 6.0 262.0 22.0 16.0 6.0 290.0 22.0 268.0
0-1 268.0 13.7 277.6 22.0 19.0 3.0 290.0 32.7 280.6
1-2 268.0 13.7 277.6 22.0 19.0 3.0 290.0 32.7 280.6
2-3 268.0 13.7 277.6 22.0 19.0 3.0 290.0 32.7 280.6
3-4 268.0 12.9 255.1 22.0 17.9 4.1 290.0 30.8 259.2
4-5 268.0 12.9 255.1 22.0 17.9 4.1 290.0 30.8 259.2
5-6 268.0 12.9 255.1 22.0 17.9 4.1 290.0 30.8 259.2
6-7 268.0 12.0 256.0 22.0 16.1 5.9 290.0 28.1 261.9
7-8 268.0 12.0 256.0 22.0 16.1 5.9 290.0 28.1 261.9
8-9 268.0 12.0 256.0 22.0 16.1 5.9 290.0 28.1 261.9
9-10 268.0 12.0 256.0 22.0 16.1 5.9 290.0 28.1 261.9
Total after 10 years 2,680.0 128.0 2,621.9 220.0 174.9 45.1 3,190.0 325.0 2,934.9
Notes: All volumes are in thousands of cubic yards. Figures are rounded to the nearest hundred cubic yards to reflect the limited level of accuracy inherent in the calculations and to minimize rounding errors. On the other hand, it is estimated that fine sediment storage within the project area will be increased permanently by more than a factor of two (beyond Year 6 in Table 2). Though the project will release fine sediment via erosion of the left bank wetland, the reengagement of off-channel areas will create a sink for sediment, noticeably outweighing the exported volume of fine sediment. Because it is expected that erosion of the left bank wetland will occur quickly following project completion, the annual storage volumes of fine sediment are suppressed by this erosion mostly at first (in the first 3 years). However, over a longer period of time (i.e., between 3 years and 6 years following project completion), the new channels through the left bank wetland will likely begin to develop their own natural levees, reducing the fine sediment flux to the floodplain with each successive splay deposit, ultimately reducing fine sediment storage.
In general, the progression of changes beyond 10 years following project completion will be marked by continued formation of splay deposits all along the new channel pathway (Figure 7). These splay deposits will be the basis for natural levees that will confine most of

December 2013
Geomorphic Assessment — White River at Countyline Levee Setback Project 29
the floodwaters in the newly formed channels. The frequency of splay formation will diminish over time, but will persist well beyond the 30-year time frame.
Coarse Sediment Budget From analogs elsewhere and the relative lack of coarse sediment in the left bank wetland to be reactivated by the project, it is expected that coarse sediment supply to the river downstream of the 8th Street E Bridge will be reduced by half initially as a result of the project (Years 1 through 3 in Table 2). The reduction in coarse sediment export is due to the complete storage of all bedload sediment entering the left bank wetland, which is expected to receive roughly half of the flow of the river. It is assumed that the existing channel will continue to export the same fraction of sediment as it does currently. From existing scientific literature describing the impacts of development and dredging on the sand-gravel transition (Frings et al. 2009) and the geotechnical borings completed in the left bank wetland and floodplain (King County 2012c), it is clear that prior to development (see the Predevelopment Conditions subsection above), most of the river substrate in the project reach was finer-grained than under existing conditions. Restoration of inundation in the wetland will initially return the system to something more like the conditions immediately following the 1906 avulsion. As a channel becomes established and woody debris is deposited through the left bank wetland, existing fine-grained sediments will be replaced with a coarse-bedded channel, as happened shortly following the 1906 avulsion (Figures 5A and 5B). The erosion of a new channel alone will trigger export of up to approximately 23,000 cubic yards of soil (fines and organics with minor amounts of coarse sediment and LWD), assuming a linear channel bed slope along the most-likely flow path and 3 feet of erosion depth, but a somewhat larger volume of sediment would be reworked as the new channel evolves. While this refers to fine sediment being eroded, the volume is useful in estimating the volume of coarse sediment that would deposit in the partial avulsion channel. Therefore a minimum conservative estimate of the volume to be reworked (i.e., the 23,000 cubic yards associated with a new main channel alignment) is slightly more than 1 year of bed material aggradation under existing conditions. Thus, it is plausible that the new channel could be formed completely in 3 years following project completion.
After a portion of the main channel avulses, splay deposits of coarse sediment are expected to form and will rebuild natural levees along both the existing channel and the new channel network. These splay deposits are the largest sink for coarse material. Natural levee formation will also extend the length of time during which coarse sediment is preferentially stored in the project site beyond the time in which new channels are fully formed. The channel formation and natural levee rebuilding processes and their time to completion will be highly dependent on the sequence of flood flows that occur in the first few years following project construction. However, once the new left bank channel through the wetland is established and transport of coarse material through the wetland is reengaged, it is expected that gravel passage will eventually become similar to existing conditions (Table 2). However, the formation of natural levees may take much longer. It is extremely difficult to predict the timing of their formation.
Decenber 2013
30 Geomorphic Assessment — White River at Countyline Levee Setback Project
Potential Downstream Impacts Resulting from Changes in Coarse Sediment Delivery The largest expected impact downstream of the project site due to changes in coarse sediment delivery will be local erosion in the vicinity of the 8th Street E Bridge, where in-channel flow will also be increased relative to 2011 conditions due to the elimination of flow over 8th Street E to the east as a result of a higher setback levee elevation. Sediment volumes observed at the project site in the past and at several analog sites were investigated to describe the evolution of the project site following construction (see list of analogs in the Methodology section).
The potential impacts related to erosion downstream of the project site would be due to decreased coarse sediment delivery from the project site coupled with increased coarse sediment transport capacity in the downstream channel during those events where flow would overtop 8th Street E if the project were not constructed. Existing information allows estimation of the magnitude, extent and duration of such effects.
The estimated 2011 existing conditions net export of coarse sediment from the project area into the White River downstream of 8th Street E is 6,000 cubic yards per year (Table 2). Coarse sediment export is expected to decrease to 3,000 cubic yards per year for the first 3 years after project completion and 4,100 cubic yards per year for the next 3 years. In year 7 and beyond, net coarse sediment export is estimated to be 5,900 cubic yards per year, which essentially is the same as the 2011 existing conditions level (Table 2). The resulting cumulative decrease in coarse sediment export from the project site relative to existing conditions in years 1 through 6 will be 14,700 cubic yards. If the affected area downstream is assumed to be the distance from the 8th Street E Bridge (RM 5.0) to the present-day gravel-sand transition (at approximately RM 3.5 according to Czuba et al. 2010), it is assumed that all coarse sediment exported from the site will deposit in that distance of 1.5 river miles, and with an average channel width of 180 feet, then a resulting net decrease of 14,700 cubic yards would translate to an average decrease in coarse sediment deposition of about 3.3 inches across the channel width relative to existing conditions. If that change in coarse sediment deposition occurs evenly through the first 6 years after project completion, then the average annual rate of coarse sediment deposition would be about a half an inch per year through those 6 years. The total net deposition (which includes both fine and coarse sediment) in this 1.5-mile length of the White River from 1984 to 2009 was about 2 feet (Czuba et al. 2010, Figure 6), which would translate to a 25-year average deposition rate of about an inch per year. Therefore, the project would effectively cut in half the long-term deposition rate in the channel for a distance of 1.5 miles downstream, for 6 years, but this river reach downstream of the project would continue to be depositional. Regardless of project effects, the downstream reach will continue to experience sediment transport and deposition fluctuations both in time and in space, as has occurred in the past.
The changes in the coarse sediment load initially following project completion may result in some modest armoring (an increase in the grain size of surficial materials from fine gravel to coarse gravel and cobble) of the downstream channel. These effects are expected to be small, because even at its lowest, the expected rate of net coarse sediment export from the project site will be half of that in existing conditions. These effects are expected to be temporary, with a return to essentially the same amount of coarse sediment export from the site after 6 years (Table 2) as described above.
December 2013
Geomorphic Assessment — White River at Countyline Levee Setback Project 31
Similarly, while the containment of all flow at all times under the 8th Street E Bridge may cause channel erosion at the bridge, this location in an aggradational reach is important. From examination of the original design plans of the 8th Street E Bridge (Pierce County Road Department 1952), it is estimated that at least 6 feet of aggradation has occurred since the construction of the bridge in 1952 (C. Brummer, personal communication). Based upon the analog at Hansen Creek, where generally less than 1 foot of erosion occurred over the last 3 years even at a constricted bridge similar to 8th Street E, degradation due to loss of sediment export alone is not expected to be greater than recent aggradation, particularly since the impact will be temporary (i.e., coarse sediment export is expected to return to existing conditions once splay and natural levee formation is complete). The geomorphic changes from loss of sediment supply and increased flow at the 8th Street E Bridge were not reflected explicitly in the hydraulic modeling originally performed (Herrera 2012c), but have been added to the final hydraulic modeling memorandum and shown to be negligible (Appendix E). Also at the Hansen Creek analog site, it was found that downstream erosion occurred in the first few years following levee setback and reconnection of that alluvial fan, but it did not significantly increase erosion risk to adjacent property owners (Mostrenko et al. 2011). This is partly because of persistent and recent sediment aggradation that preceded the project. Large-scale bank erosion has not been observed at the Hansen Creek site, even though the relative impacts of the floodplain restoration activities are larger than in the Countyline project. The alluvial fan area reconnected at Hansen Creek is larger relative to the size of the main channel at the Countyline project site (e.g., as measured by the distance in stream widths that were restored). This means that the amount of sediment stored in the floodplain at Hansen Creek following construction was also larger, again measured in a relative sense. Therefore, the increased tendency for the channel to erode from the loss of coarse material downstream of the Countyline project site is not expected to be significant based on the insignificant impacts at Hansen Creek, even though the relative changes at that site were larger. Further, any reduction in coarse sediment load downstream of the Countyline project site is likely to (temporarily) improve upon what is currently a sediment aggradation problem that adds to flooding concerns downstream (as was the case at Hansen Creek).
Fine Sediment Budget The amount of fine sediment stored or exchanged with the bed within the project site at any time is a small fraction of the total incoming suspended load (up to about 5 percent, from the percentage of the Storage Volume column to the Sediment Input column in Table 2). As a result, the volumes exchanged within the project site are expected to be negligible with respect to ambient conditions. However, the character of the sediment may change as more organic-rich sediment is eroded from the left bank wetland, as compared to inorganic (primarily glacially derived) sediment from further upstream. This change may be observed downstream, particularly in flood deposits in off-channel areas.
It is clear that the project, by halving coarse sediment export in the first 3 years following construction with a concurrent slight increase on the fine sediment export, will increase the relative amount of fine sediment (with respect to coarse sediment) in transport downstream of the project site. Further, nearly all of the erosion in the left bank wetland will occur in fine-grained materials. This means that even though there is expected to be a net storage of

Decenber 2013
32 Geomorphic Assessment — White River at Countyline Levee Setback Project
incoming fine sediment immediately following construction of the project, the total fine sediment exported from the project site will remain roughly the same until the new channel through the wetland becomes fully established.
After the first 3 years of channel formation, when it is assumed that most of the fine grained sediment that will be removed from the left bank wetland has been eroded, the river will begin to store more fine sediment at the project site than it does under existing conditions. From estimations made as documented in Appendix A and summarized in Table 2, approximately twice as much fine sediment will be deposited within the project site as compared to existing conditions. This is not unexpected, as both the area and the frequency with which it will be inundated regularly will increase significantly.
Potential Downstream Impacts Resulting from Changes in Fine Sediment Delivery The primary downstream impact will be a temporary impact of exporting more fine sediment than under existing conditions. This is entirely due to the erosion of the new left bank wetland channel, as the project will store more sediment in off-channel areas (i.e., outside the new left wetland channel) than under existing conditions.
It is important to recognize that these changes will be minor compared to the volume of fine sediment traversing the study area in the existing conditions White River fine sediment regime. The average annual fine sediment export from the project site is approximately 262,000 cubic yards per year based upon the sediment flux Czuba et al. (2011) measured at R Street minus the volume of fine sediment deposited in the area between R Street and 8th Street E as measured by King County (2012b). The estimated fine sediment export from the project site is expected to be as much as 15,600 cubic yards per year greater than existing conditions over the first 3 years following project completion (Table 2). Therefore, at its maximum, the increase in fine sediment export from the project site will be about 6 percent of the total transported in the river through the project area. This amount of change is much less than the temporal variability of fine sediment transport and deposition. Despite the small deviation in total fine sediment volumes, the character of the sediment in the first several hundred feet of river channel downstream of the project site may also change, particularly its organic content. This change will also be temporary (i.e., the time it takes for new channels to form in the left bank wetland, expected to be less than about 3 years following project completion). Over the longer term (i.e., once the new channels through the left bank wetland are formed, expected to be about 6 years following project completion), fine sediment export will decrease because of increased storage in off-channel areas in the left bank wetland. Like the temporary impact from erosion of wetland areas, the change will be negligible (about 2 percent), as calculated by the difference between the sediment export in years 9 and 10 in Table 2 compared to existing conditions. Therefore, no significant off-site impacts associated with fine sediment storage or export are expected due to the project, with the possible exception of the change in the character of sediment deposited downstream from inorganic material to organic-rich material for several years following construction.

December 2013
Geomorphic Assessment — White River at Countyline Levee Setback Project 33
SSUMMARY OF FINDINGS The following statements can be made based upon the results of the analysis discussed herein:
The most likely conditions following construction of the setback levee are a new channel complex separated from the existing main channel by a band of woody riparian vegetation.
Coarse sediment export from the project site is expected to be reduced by half in the first few years following construction. About 7 years after project completion, coarse sediment will be passed at rates close to existing conditions.
The initial changes in the coarse sediment load may result in some minor armoring (change in the grain size of surficial materials from fine gravel to coarse gravel and cobble) of the downstream channel, but these are expected to be small and temporary, as they have been at an analogous floodplain restoration site at Hansen Creek in Skagit County. Any reduction in coarse sediment load is likely to improve upon what is currently a sediment aggradation problem.
Fine sediment export will also initially be reduced slightly despite erosion of a new channel complex in the left bank wetland. Unlike the coarse sediment transport through the project site, which should become equivalent to existing conditions given enough time, fine sediment storage increases at the project site will persist over time.
The volumes of fine sediment added to the river by the project initially after construction and removed over time due to deposition within the project area are insignificant when compared to the total flux and annual variability of fine sediment in the lower White River. Therefore, fine sediment deposition rates downstream are not expected to be noticeably changed as a result of the project. However, the character of the eroded material (color, organic content, etc.) will be different from the existing sediment load, and qualitative character changes in deposited sediment may be noticeable downstream.
Based upon the model results and current observed trends, there is a high likelihood that the White River will avulse to the east of 142nd Avenue E and through 8th Street E just east of the existing bridge crossing if the project is not constructed.
Bedload aggradation within the project site will be significant with or without the project. In 13.8 years without the project, it is estimated that the thalweg will reach the elevation of the existing left bank levee at the county line, at which time (or sooner) avulsion into the left bank wetland will be extremely likely.
The hydraulic model results of future conditions without the project are based on the surrounding floodplain topography that existed in 2011. Flood fighting measures such

Decenber 2013
34 Geomorphic Assessment — White River at Countyline Levee Setback Project
as the emergency construction of additional earthen berms by individual property owners could occur, although such measures would likely have the effect of redirecting floodwaters and could produce flood and geomorphic hazards that are not those predicted by any of the analyses performed to date.

December 2013
Geomorphic Assessment — White River at Countyline Levee Setback Project 35
RREFERENCES Banks, M. 1907. The Duwamish-Puyallup Flood Problem. Report of an Investigation by a Board of Engineers of the Means of Controlling Floods in the Duwamish-Puyallup Valleys and Their Tributaries in the State of Washington. Lowman & Hanford S. and P. Company, Seattle, Washington.
Cardno-Entrix. 2010. Upper Puyallup Upper Puyallup River Geomorphic Assessment: RM 25.3 to RM 28.6. Prepared for Pierce County Public Works and Utilities Surface Water Management. December 30, 2010.
Collins, B.D. and A.J. Sheikh. 2004. Historical channel locations of the White River, RM 5 – RM 28, King County, Washington. Prepared for King County Department of Natural Resources and Parks.
Collins, B.D. and A.J. Sheikh. 2005. Historical aquatic habitats in the Green and Duwamish River Valleys and the Elliott Bay Nearshore, King County, Washington. Prepared for King County Department of Natural Resources and Parks.
Collins, B.D. and D.R. Montgomery. 2011. The legacy of Pleistocene glaciation and the organization of lowland alluvial process domains in the Puget Sound region. Geomorphology 126:174-185.
Czuba, J.A., C.R. Czuba, C.S. Magirl, and F.D. Voss. 2010. Channel-conveyance capacity, channel change, and sediment transport in the lower Puyallup, White, and Carbon Rivers, western Washington. USGS Scientific Investigations Report 2010-5240.
Czuba, J., C. Magirl, C. Czuba, C. Curran, K. Johnson, and T. Olsen. 2011. Geomorphic analysis of the fluvial response from sedimentation downstream from Mount Rainier, WA: Preliminary Phase II Study Results. Presentation to Pierce County Rivers Flood Hazard Management Plan Advisory Committee on March 10, 2011.
Frings, R.M., B.M. Berbee, G. Erkens, M.G. Kleinhans, and M.J.P. Gouw. 2009. Human-induced changes in bed shear stress and bed grain size in the River Waal (The Netherlands) during the past 900 years. Earth Surface Processes and Landforms 34:503-514.
Herrera. 2007. Assessment of Sediment Delivery and Geomorphic Evolution: Lower Tolt River Floodplain Reconnection Project. Prepared for Seattle Public Utilities by Herrera Environmental Consultants, Inc., Seattle, Washington. July 2007.
Herrera. 2010. Summary of Sediment Trends: Lower White River: RM 4.44 to RM 10.60. Prepared for King County Department of Natural Resources and Parks, Water and Land Resources Division, River and Floodplain Management Section by Herrera Environmental Consultants, Inc., Seattle, Washington. February 2010.
Decenber 2013
36 Geomorphic Assessment — White River at Countyline Levee Setback Project
Herrera. 2011a. RiverFLO-2D Calibration Report: Lower White River Levee Setback Hydraulic and Sediment Transport Modeling. Prepared for King County Department of Natural Resources and Parks, Water and Land Resources Division, River and Floodplain Management Section, by Herrera Environmental Consultants, Inc., Seattle, Washington. March 28, 2011.
Herrera. 2011b. Summary of Findings, Puyallup River Reference Site, Field Investigation. Prepared for King County Department of Natural Resources and Parks, Water and Land Resources Division, River and Floodplain Management Section, by Herrera Environmental Consultants, Inc., Seattle, Washington. September 7, 2011.
Herrera. 2012a. Floodplain Geomorphic Surface Development Approach Technical Memorandum: White River at Countyline Levee Setback Project. Prepared for King County Department of Natural Resources and Parks, Water and Land Resources Division, River and Floodplain Management Section, by Herrera Environmental Consultants, Inc., Seattle, Washington. May 22, 2012.
Herrera. 2012b. Hydraulic and Sediment Transport Modeling Technical Memorandum: White River at Countyline Levee Setback Project. Prepared for King County Department of Natural Resources and Parks, Water and Land Resources Division, River and Floodplain Management Section, by Herrera Environmental Consultants, Inc., Seattle, Washington. May 29, 2012.
Herrera. 2012c. Draft Hydraulic Modeling Technical Memorandum: White River at Countyline Levee Setback Project. Prepared for King County Department of Natural Resources and Parks, Water and Land Resources Division, River and Floodplain Management Section, by Herrera Environmental Consultants, Inc., Seattle, Washington. July 13, 2012.
ICRI. c. 1914. Untitled map of County Line Section of Stuck River.
King County. 2010. Email from Terry Butler to Jeanne Stypula, dated January 4, 2010, entitled: “Historical gravel removal on the Lower White River.” King County Department of Natural Resources and Parks, Water and Land Resources Division. January 4, 2010.
King County. 2012a. Photographs taken on February 23, 2012, during the February 2012 high flow event.
King County. 2012b. Memorandum from Terry Butler to Jeanne Stypula regarding draft White River channel monitoring data through 2011. April 4, 2012.
King County. 2012c. Countyline to A-Street Geotechnical Study. May 2012.
Lauer, J.W. and G. Parker. 2008a. Modeling framework for sediment deposition, storage, and evacuation in the floodplain of a meandering river, part I: theory. Water Resources Research 44(4), W04425.
Lauer, J.W. and G. Parker. 2008b. Modeling framework for sediment deposition, storage, and evacuation in the floodplain of a meandering river, part I: application to the Clark Fork River, Montana. Water Resources Research 44(8), W08404.

December 2013
Geomorphic Assessment — White River at Countyline Levee Setback Project 37
Lokas, E., P. Wachniew, D. Ciszewski, P. Owczarek, and N.D. Chau. 2010. Simultaneous use of trace metals, Pb-210 and Cs-137 in floodplain sediments of a lowland river as indicators of anthropogenic impacts. Water Air and Soil Pollution 207(1-4):57-71.
Mostrenko, I., C. Avolio, C. Brummer, K. Lepine, and L. Rich. 2011. Hansen Creek Alluvial Fan and Wetlands Restoration Project: Hydrogeomorphic Changes of a Re-activated Alluvial Fan. Poster presented at Salish Sea Conference. October 25-27, 2011.
Mullineaux, D.R. 1965. Geologic map of the Auburn Quadrangle, King and Pierce Counties, Washington. USGS Geologic Quadrangle Map GQ-406.
Ober. 1898. Personal account.
Paragon Research Associates. 2011. A Street-County Line Levee Modification Project Cultural Resources Assessment, King and Pierce Counties, Washington. July 2011. Prepared for King County Department of Natural Resources and Parks, Water and Land Resources Division, by Paragon Research Associates, Inc., Seattle, Washington.
Pierce County Road Department. 1952. Indian Ferry – Stuck Valley Road, Stuck River Bridge No. 1204-A Plans. April 9, 1952.
Roberts, W.J. 1920. Report of W.J. Roberts, Chief Engineer, In: Report on flood control of White-Stuck and Puyallup Rivers; Inter-County River Improvement, King and Pierce Counties, State of Washington.
Shannon & Wilson. 2009. Shallow boring soil characterization, Countyline to A-Street levee modification project, White River, King County, Washington. Letter to Chase Barton of Herrera Environmental Consultants, Inc., Seattle, Washington, dated June 18, 2009. Shannon & Wilson, Inc., Seattle, Washington.
Zehfuss, P.H., B.F. Atwater, J.W. Vallance, H. Brenniman, and T.A. Brown. 2003. Holocene Lahars and Their by-Products Along the Historical Path of the White River between Mount Rainier and Seattle. GSA Field Guide 4:209-223.


APPENDIX A
Sand Flux Calculations


December 2013
Geomorphic Assessment — White River at Countyline Levee Setback Project A-1
Introduction This appendix to the Task 300.3 Geomorphic Assessment memorandum describes the methods of analysis used to estimate the quantity and depth of fine sediment that might be deposited in the floodplain for two simulated flow events (the 2-year and 100-year recurrence flow events) and for floodplain conditions a few years after the construction of the Countyline Levee Setback project. The results of this analysis provide a relationship between peak discharge and rates of overbank sedimentation in floodplain areas that can be applied to floodplain areas for various flow events to simulate future conditions and geomorphic response to the project. The results of this analysis were also incorporated into the sediment budget for the project site and were used with other data to develop topographic surfaces for the hydraulic modeling of future conditions with and without the proposed project.
Calculating the volumes and depths of fine sediment deposition for the floodplain portions of the project site requires estimating the suspended sediment loads that are conveyed onto floodplain areas (sediment flux) and then estimating the quantity of fine sediment that will settle out of suspension and deposit on the floodplain during a particular flow event. Since the majority of the sand and silt load in the White River is transported in suspension, the overall flux of material onto the floodplain depends on the concentration of suspended sediment in the water column as well as on the flux of water leaving the channel and entering the floodplain. Because flow velocities and shear stresses across the floodplain are much lower than in the main channel, it is likely that a significant fraction of suspended sediment entering the floodplain will settle and will not be re-entrained by the flow passing back into the channel; however, water passing from the floodplain to the channel could contain some suspended sediment (primarily silt and fine sand), meaning that simply estimating the flux of suspended sediment passing through the floodplain is not sufficient for making an estimate of floodplain sediment deposition and associated storage. In other words, the floodplain is unlikely to be perfectly efficient in storing suspended material that passes across its surface. It is for this reason that a trap efficiency must be determined as part of the analysis to estimate fine sediment deposition on the floodplain.
The load of suspended sediment material within the White River is composed primarily of silt to medium sand. Sediment settling velocities within this range vary significantly. Turbulence in the main channel is sufficiently strong to keep the finer particles well mixed throughout the water column. However, for medium-sized sand particles, settling velocities are high enough that the majority of the sediment is transported relatively low in the water column. This tends to reduce the concentration of larger sediment particles in the upper portion of the water column, which is the portion of the flow that overtops the active channel banks and enters the adjacent floodplain.
Methodology This section explains the computations performed to estimate a long-term trap efficiency factor (F) for the floodplain and then apply this result to the future conditions hydraulic model to estimate the volume and depth of fine sediment deposited on the floodplain for the various flow events anticipated for the future conditions. First a trap efficiency factor was calculated by comparing the computed sediment flux across a selected portion of the
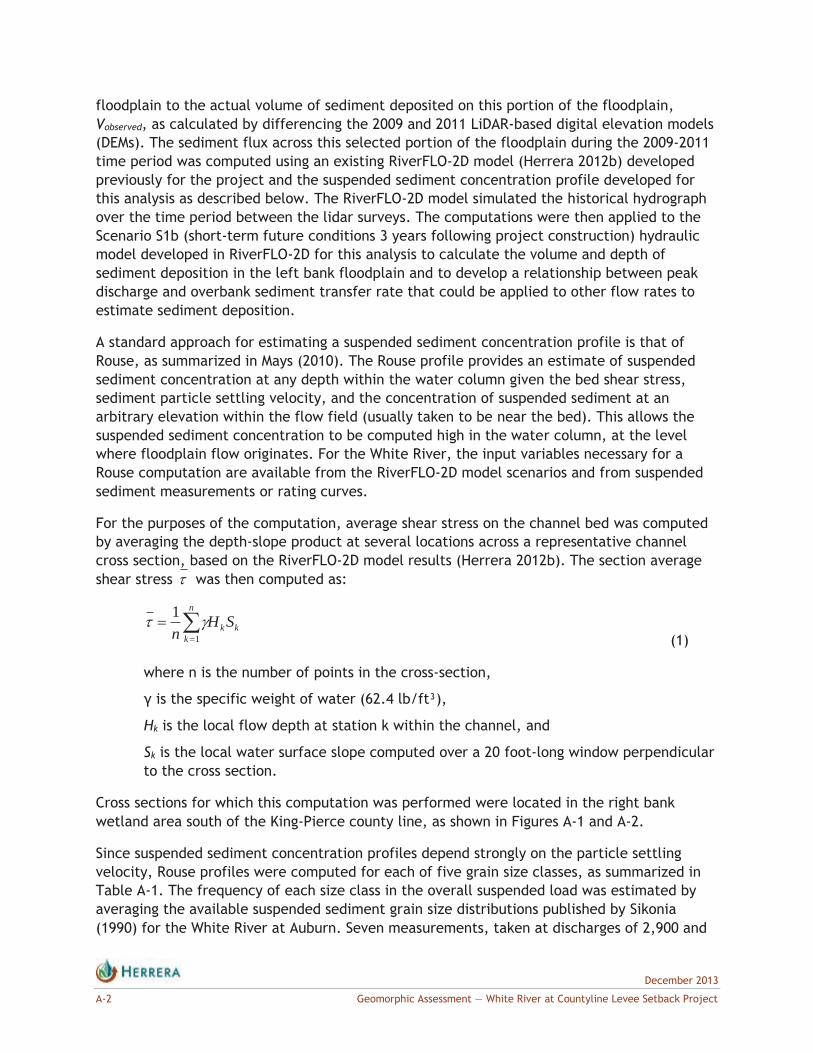
December 2013
A-2 Geomorphic Assessment — White River at Countyline Levee Setback Project
floodplain to the actual volume of sediment deposited on this portion of the floodplain, Vobserved, as calculated by differencing the 2009 and 2011 LiDAR-based digital elevation models (DEMs). The sediment flux across this selected portion of the floodplain during the 2009-2011 time period was computed using an existing RiverFLO-2D model (Herrera 2012b) developed previously for the project and the suspended sediment concentration profile developed for this analysis as described below. The RiverFLO-2D model simulated the historical hydrograph over the time period between the lidar surveys. The computations were then applied to the Scenario S1b (short-term future conditions 3 years following project construction) hydraulic model developed in RiverFLO-2D for this analysis to calculate the volume and depth of sediment deposition in the left bank floodplain and to develop a relationship between peak discharge and overbank sediment transfer rate that could be applied to other flow rates to estimate sediment deposition.
A standard approach for estimating a suspended sediment concentration profile is that of Rouse, as summarized in Mays (2010). The Rouse profile provides an estimate of suspended sediment concentration at any depth within the water column given the bed shear stress, sediment particle settling velocity, and the concentration of suspended sediment at an arbitrary elevation within the flow field (usually taken to be near the bed). This allows the suspended sediment concentration to be computed high in the water column, at the level where floodplain flow originates. For the White River, the input variables necessary for a Rouse computation are available from the RiverFLO-2D model scenarios and from suspended sediment measurements or rating curves.
For the purposes of the computation, average shear stress on the channel bed was computed by averaging the depth-slope product at several locations across a representative channel cross section, based on the RiverFLO-2D model results (Herrera 2012b). The section average shear stress was then computed as:
n
kkkSH
n 1
1
(1)
where n is the number of points in the cross-section,
is the specific weight of water (62.4 lb/ft³),
Hk is the local flow depth at station k within the channel, and
Sk is the local water surface slope computed over a 20 foot-long window perpendicular to the cross section.
Cross sections for which this computation was performed were located in the right bank wetland area south of the King-Pierce county line, as shown in Figures A-1 and A-2.
Since suspended sediment concentration profiles depend strongly on the particle settling velocity, Rouse profiles were computed for each of five grain size classes, as summarized in Table A-1. The frequency of each size class in the overall suspended load was estimated by averaging the available suspended sediment grain size distributions published by Sikonia (1990) for the White River at Auburn. Seven measurements, taken at discharges of 2,900 and

December 2013
Geomorphic Assessment — White River at Countyline Levee Setback Project A-3
Figure A-1. Locations of cross sections and density of points used in sediment flux analysis.
Figure A-2. Cross sections used in sediment flux analysis.
Section A
Section B
Section C

December 2013
A-4 Geomorphic Assessment — White River at Countyline Levee Setback Project
12,000 cubic feet per second (cfs), were available for this purpose. Representative settling velocities for each sand size class (particle diameter [D] > 0.0625 millimeters, mm) were computed based on Dietrich (1982). Because silt/clay particle settling velocity cannot be computed accurately without detailed knowledge of mineralogy and density, the settling velocity for the finest class was iteratively adjusted so that the resulting sediment deposit contained an appropriate fraction of silt, as described below. Sensitivity tests showed that using a settling velocity of 0.05 cm/s, which corresponds to a particle diameter of approximately 0.024 mm, resulted in a silt/clay fraction in the 10 to 20 percent range. This was judged to be typical for floodplain deposits at the project site, given the qualitative observation that sand content was high in many of the splay deposits deposited between 2009 and 2011. (Note that using a smaller settling velocity for this class would result in calculation of less overall silt/clay sedimentation). Table A-1 summarizes the overall suspended sediment size distribution in the load as well as settling velocities used in the analysis.
Table A-1. Grain size distribution and settling velocities for suspended sediment in the White River in the vicinity of the Countyline project site.
Size Class Representative Size Di
(mm) Settling Velocity Wi
(cm/s) Fraction fi
0.5 mm < D < 1 mm 0.71 11 0.03
0.25 mm < D < 0.5 mm 0.35 4.8 0.16
0.125 mm < D < 0.25 mm 0.177 1.9 0.30
0.0625 mm < D < 0.125 mm 0.088 0. 60 0.23
D < 0.0625 mm n/a 0.05* 0.29
D – diameter cm/s – centimeters per second * Settling velocity for silt/clay was computed by calibration to ensure that overall silt/clay content in resulting
deposit was in the 10-20% range. The Rouse computation also requires an estimate of the suspended sediment concentration at an arbitrary point within the flow field near the bed. Once the near-bed concentration is specified, suspended sediment concentration can then be computed at any depth. When multiplied by flow velocity and integrated in the vertical direction, this provides an estimate of the total suspended sediment load within the channel in each size class. Since total sediment load can also be estimated from a suspended sediment rating curve for the site, it is possible to back-calculate the necessary boundary condition concentration at the arbitrary elevation given the flow-averaged suspended sediment concentration for the fraction (fi) in each size class Ci computed from the rating curve:
Ci = fi(aQb) (2)
where a and b are, respectively, the coefficient and exponent in a power-function fit between overall suspended sediment concentration (C, mg/L) and discharge (Q, cfs).
The rating curve is shown in Figure A-3.
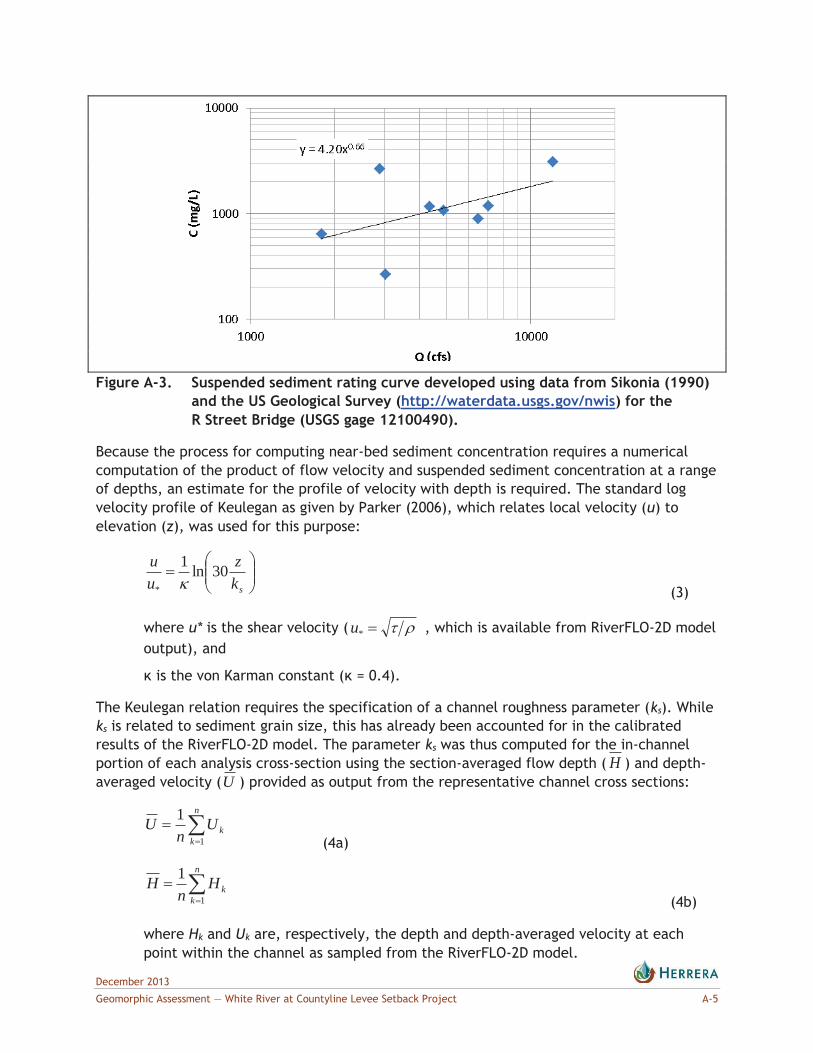
December 2013
Geomorphic Assessment — White River at Countyline Levee Setback Project A-5
Figure A-3. Suspended sediment rating curve developed using data from Sikonia (1990)
and the US Geological Survey (http://waterdata.usgs.gov/nwis) for the R Street Bridge (USGS gage 12100490).
Because the process for computing near-bed sediment concentration requires a numerical computation of the product of flow velocity and suspended sediment concentration at a range of depths, an estimate for the profile of velocity with depth is required. The standard log velocity profile of Keulegan as given by Parker (2006), which relates local velocity (u) to elevation (z), was used for this purpose:
skz
uu 30ln1
* (3)
where u* is the shear velocity ( *u , which is available from RiverFLO-2D model output), and
is the von Karman constant ( = 0.4).
The Keulegan relation requires the specification of a channel roughness parameter (ks). While ks is related to sediment grain size, this has already been accounted for in the calibrated results of the RiverFLO-2D model. The parameter ks was thus computed for the in-channel portion of each analysis cross-section using the section-averaged flow depth ( H ) and depth-averaged velocity (U ) provided as output from the representative channel cross sections:
n
kkU
nU
1
1
(4a)
n
kkH
nH
1
1
(4b)
where Hk and Uk are, respectively, the depth and depth-averaged velocity at each point within the channel as sampled from the RiverFLO-2D model.

December 2013
A-6 Geomorphic Assessment — White River at Countyline Levee Setback Project
With H and U known, it is possible to estimate ks and thus develop an average, in-channel velocity profile that is consistent with the RiverFLO-2D model for each time step. This also allows for the computation of a flow-weighted average suspended sediment concentration in each size class, iC :
j
m
jj
j
m
jjij
i
zu
zCuC
1
1,
(5)
where uj is the local velocity at elevation zj as computed from the log velocity profile,
Ci,j is the local suspended sediment concentration in class i for elevation zj, and
zj is the depth increment.
The near bed concentration was specified so that iC equals Cj from the rating curve (i.e., from equation 2), with the associated near-bed elevation computed as the larger of 5 percent of the flow depth or 5 percent of the computed roughness height ks.
The overall suspended sediment concentration in each size class in the flow spilling onto the floodplain, ifpC , was computed using equation 5, but with the bottom elevation (i.e., z for j=1) taken as the average elevation of the floodplain for a given cross section. Overall sediment flux to the floodplain for each size class, Qs,i, was then estimated for each flow as:
ifpfpis CQQ ,, (6)
where Qfp is the total discharge across all points in the floodplain as estimated from the RiverFLO-2D output:
n
kkfp QQ
1
(7)
where Qk represents the discharge across a given section ofthe floodplain.
Hydraulic Model Information Used to Calculate Suspended Sediment Concentration Profiles for Calibration Simulation
Figures A-4a, A-5a, and A-6a summarize the RiverFLO-2D model information for water surface elevation, total discharge, floodplain discharge, and channel bed elevation averaged across Sections A, B, and C, respectively, as a function of time (each time step in the figure represents 15 minutes). The hydraulic variables found here are described in detail in Herrera (2012). Note that in these figures, bed elevation is not constant because the RiverFLO-2D model was run in active bed mode in order to simulate the loss of main channel capacity that occurred over the simulation period (Herrera 2012b). Figures A-4b, A-5b, and A-6b summarize the results of the Rouse computations for suspended sediment concentration at floodplain level using the hydraulics and geometry of each respective section as input. Note in Figure A-6b that, after approximately 60 percent of the model run, flow velocities in the channel at this section become negative (and are not shown) because of an eddy that forms at this location in the channel.

December 2013
Geomorphic Assessment — White River at Countyline Levee Setback Project A-7
Figure A-4a. Modeled water surface elevation and discharge discharge versus time at
Section A.
Figure A-4b. Average main channel flow velocity from hydraulic model and computed
suspended sediment concentration at floodplain level for Section A.
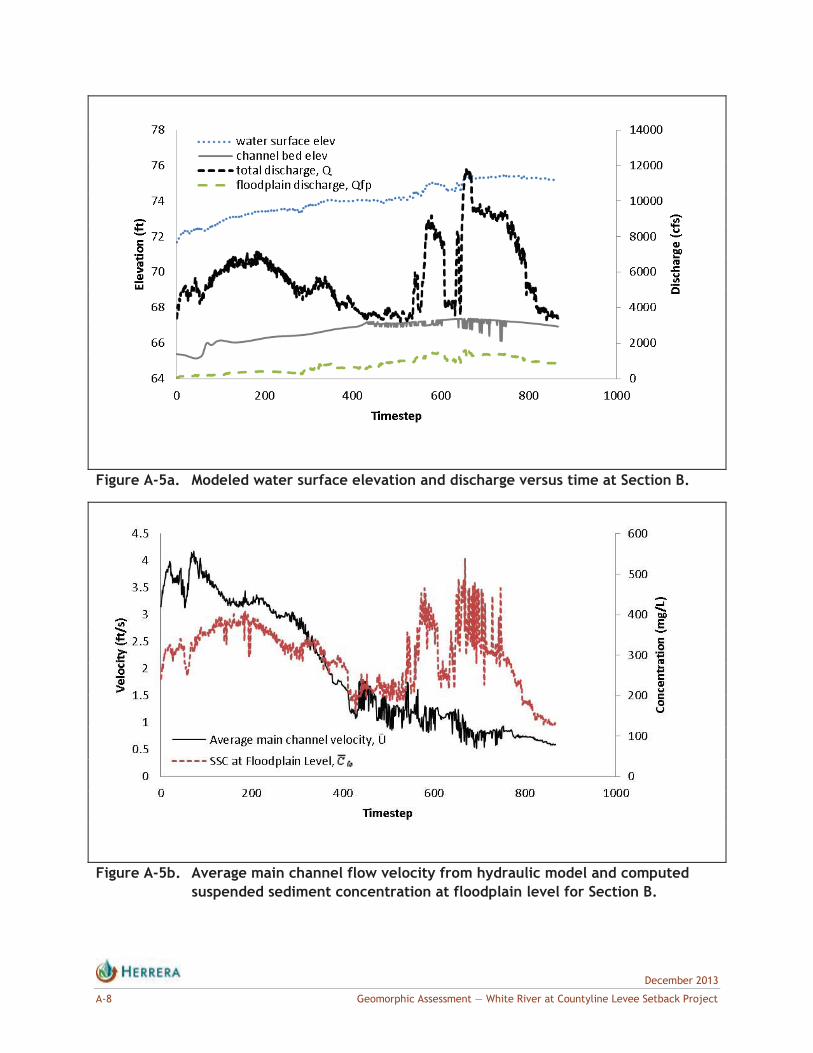
December 2013
A-8 Geomorphic Assessment — White River at Countyline Levee Setback Project
Figure A-5a. Modeled water surface elevation and discharge versus time at Section B.
Figure A-5b. Average main channel flow velocity from hydraulic model and computed
suspended sediment concentration at floodplain level for Section B.

December 2013
Geomorphic Assessment — White River at Countyline Levee Setback Project A-9
Figure A-6a. Modeled water surface elevation and discharge discharge versus time at
Section C.
Figure A-6b. Average main channel velocity from hydraulic model and computed
suspended sediment concentration at floodplain level for Section C.

December 2013
A-10 Geomorphic Assessment — White River at Countyline Levee Setback Project
Computation of Deposition and Trap Efficiency The overall sediment flux onto the floodplain is probably greater than the flux that is stored there because some of the sediment in the water column may not have time to settle before flow returns to the channel. This was accounted for using an equation for average floodplain deposition for a given floodplain flow discharge (Qfp) taken (with minor modifications to account for differences in variable definitions) from Lauer and Parker (2008a):
fp
is
b
fpifpi Q
AWA
QCFD ,, exp1
(8)
where Di is the average volumetric deposition rate on the floodplain for sediment in size class i,
Ws,i is the settling velocity for particle size class i,
A is the floodplain area for a typical floodplain flow path (product of typical length and width as given by Lauer and Parker [2008a]), and
b is the dry bulk density of floodplain sediment.
For high settling velocities, the term in parentheses is approximately equal to 1, and the trap efficiency factor (F) represents the ratio of sediment transferred across the floodplain to net sediment storage on the floodplain. For velocities and discharges in the range likely at the project site, the term in parenthesis is nearly equal to one except for the silt/clay particle size class. For low settling velocities or short flow path lengths, the term in the parenthesis accounts for the return of unsettled material to the main channel after flow crosses the floodplain. This sediment flux, Qs,return,i, can be computed as
fp
isisireturns Q
AWQQ ,
,,, exp1 (9)
The total deposition rate (D) is found by summing across all grain sizes:
n
iiDD
1
(10)
The total long-term sedimentation volume (V) can then be computed by weighting D using a flow duration curve or simply by computing D for each time step in the numerical model, multiplying by time step length ( t), and summing:
tADV (11)
The trap efficiency factor F was computed independently for each of the three different cross sections based on the observed sedimentation volume (Vobserved) computed by differencing two LiDAR-based DEMs.

December 2013
Geomorphic Assessment — White River at Countyline Levee Setback Project A-11
j
m
j
n
i fp
i
b
fpifp
observed
tQ
AWQCVF
1 1
, exp1
(12)
The term in the denominator of Equation 12 represents storage volume that would occur in the floodplain were F=1.
Hydraulic Model Information Used to Calculate Suspended Sediment Concentration Profiles for Future Conditions
Output from the River FLO-2D hydraulic model for the Scenario S1b (short-term future conditions three years following project construction) surface were sampled at three cross sections shown in Figure A-7. Cross-section S1b-A characterizes hydraulic conditions within a backwater area to the northeast of the splay in the S1b surface. Cross-section S1b-B characterizes conditions near the source of overbank flow for much of the central floodplain area located to the southwest of the splay. The conditions in the main channel at cross-section S1b-B are thus representative of suspended sediment concentration in the water that eventually flows onto the floodplain. Cross-section S1b-C encompasses the central floodplain area and thus characterizes velocity and discharge across the floodplain. Additionally, flow in the main channel at section S1b-C likely remains in the main channel, as indicated by the velocity vectors in Figure A-7. For these reasons, cross-section S1b-C was used to characterize the floodplain discharge for cross-section S1b-B, and suspended sediment concentration at section S1b-C was not computed.
The three cross-sections are plotted in Figure A-8 and were used to identify the elevation from which flow passing onto the floodplain would likely originate. For section S1b-A, flow was assumed to leave the channel at elevation 75.5 feet. For section S1b-B, this elevation was assumed to be 77.5 feet. Computations for suspended sediment concentration in the flow crossing the floodplain are based on the average from the Rouse profile above these respective elevations.
Hydraulic computations were performed for two flood events—a 2-year, 48-hour event with a peak discharge of 9,692 cfs, and a 100-year, 48-hour event with a peak discharge of 15,532 cfs. For these events, discharge and suspended sediment concentration (SSC) were computed for the floodplain, and flow velocities were computed in the main channel where flow enters the floodplain. For the central floodplain area, all in-channel estimates were based on section S1b-B, and all floodplain discharge estimates were based on section S1b-C. The computation requires a definition of the boundary between channel and floodplain. For Section S1b-A, the channel was defined as being between cross-channel coordinates 70 and 170, and the floodplain was defined as being between coordinates 175 and 765. For the central floodplain area, all in-channel estimates were based on section S1b-B between coordinates 535 and 625. Floodplain discharge estimates for the central floodplain area were based on the portion of section S1b-C between coordinates 780 and 1520.
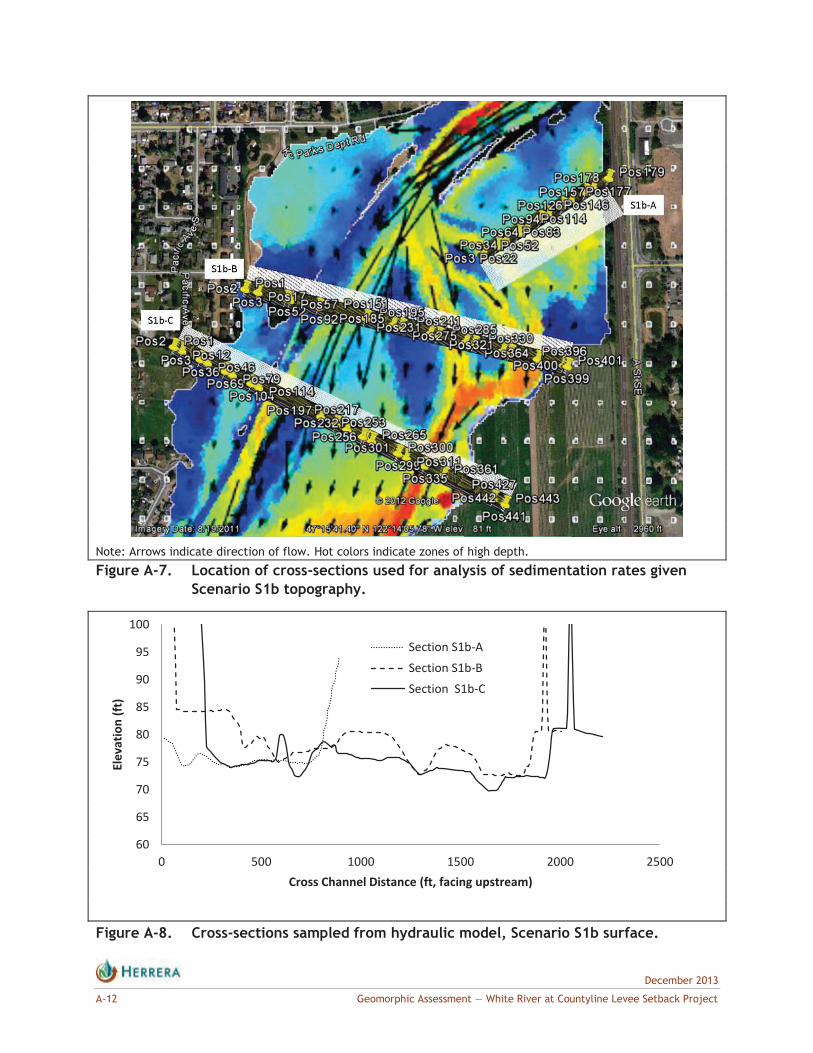
December 2013
A-12 Geomorphic Assessment — White River at Countyline Levee Setback Project
Note: Arrows indicate direction of flow. Hot colors indicate zones of high depth.
Figure A-7. Location of cross-sections used for analysis of sedimentation rates given Scenario S1b topography.
Figure A-8. Cross-sections sampled from hydraulic model, Scenario S1b surface.
60
65
70
75
80
85
90
95
100
0 500 1000 1500 2000 2500
Elev
atio
n (ft
)
Cross Channel Distance (ft, facing upstream)
Section S1b-ASection S1b-BSection S1b-C
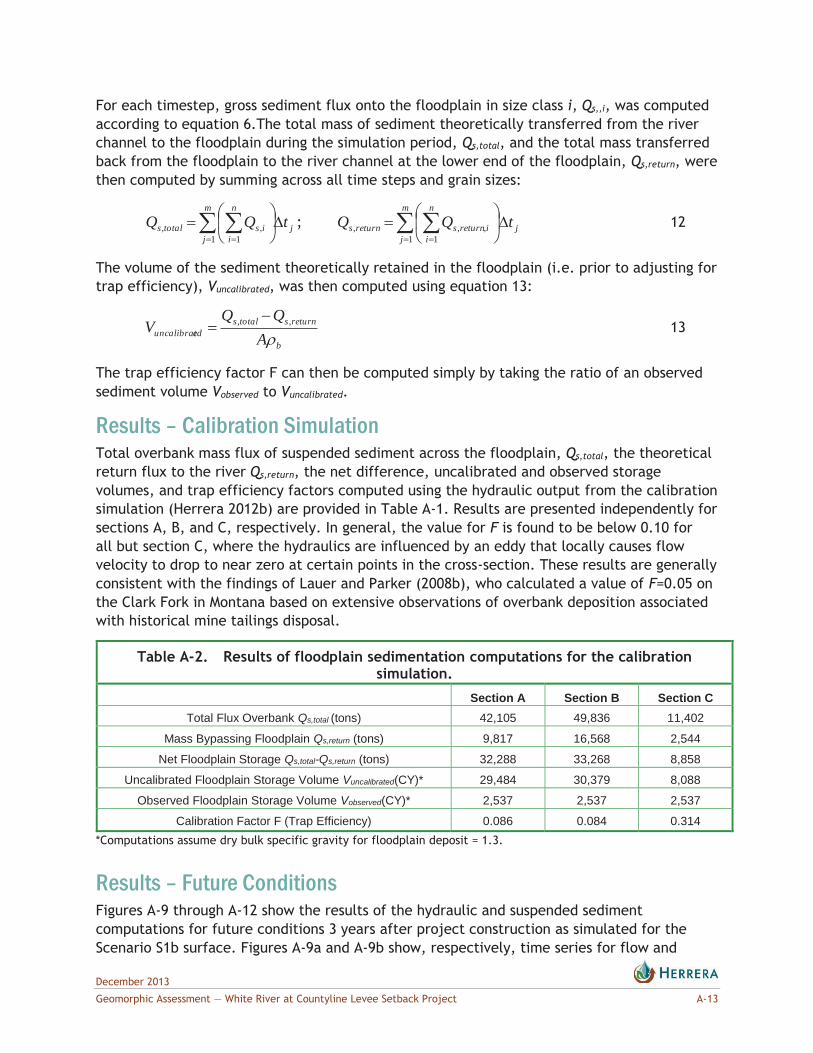
December 2013
Geomorphic Assessment — White River at Countyline Levee Setback Project A-13
For each timestep, gross sediment flux onto the floodplain in size class i, Qs,,i, was computed according to equation 6.The total mass of sediment theoretically transferred from the river channel to the floodplain during the simulation period, Qs,total, and the total mass transferred back from the floodplain to the river channel at the lower end of the floodplain, Qs,return, were then computed by summing across all time steps and grain sizes:
j
m
j
n
iistotals tQQ
1 1,, ;
m
jj
n
iireturnsreturns tQQ
1 1,,, 12
The volume of the sediment theoretically retained in the floodplain (i.e. prior to adjusting for trap efficiency), Vuncalibrated, was then computed using equation 13:
b
returnstotalseduncalibrat A
QQV ,, 13
The trap efficiency factor F can then be computed simply by taking the ratio of an observed sediment volume Vobserved to Vuncalibrated.
Results – Calibration Simulation Total overbank mass flux of suspended sediment across the floodplain, Qs,total, the theoretical return flux to the river Qs,return, the net difference, uncalibrated and observed storage volumes, and trap efficiency factors computed using the hydraulic output from the calibration simulation (Herrera 2012b) are provided in Table A-1. Results are presented independently for sections A, B, and C, respectively. In general, the value for F is found to be below 0.10 for all but section C, where the hydraulics are influenced by an eddy that locally causes flow velocity to drop to near zero at certain points in the cross-section. These results are generally consistent with the findings of Lauer and Parker (2008b), who calculated a value of F=0.05 on the Clark Fork in Montana based on extensive observations of overbank deposition associated with historical mine tailings disposal.
Table A-2. Results of floodplain sedimentation computations for the calibration simulation.
Section A Section B Section C Total Flux Overbank Qs,total (tons) 42,105 49,836 11,402
Mass Bypassing Floodplain Qs,return (tons) 9,817 16,568 2,544
Net Floodplain Storage Qs,total-Qs,return (tons) 32,288 33,268 8,858
Uncalibrated Floodplain Storage Volume Vuncalibrated(CY)* 29,484 30,379 8,088
Observed Floodplain Storage Volume Vobserved(CY)* 2,537 2,537 2,537
Calibration Factor F (Trap Efficiency) 0.086 0.084 0.314 *Computations assume dry bulk specific gravity for floodplain deposit = 1.3.
Results – Future Conditions Figures A-9 through A-12 show the results of the hydraulic and suspended sediment computations for future conditions 3 years after project construction as simulated for the Scenario S1b surface. Figures A-9a and A-9b show, respectively, time series for flow and

December 2013
A-14 Geomorphic Assessment — White River at Countyline Levee Setback Project
suspended sediment concentration in the portion of the water column above floodplain level for the 2-year event at section S1b-A. Figures A-10a and A-10b show the same respective results for the central floodplain area. In figures A-10a and A-10b, the main channel flow velocity, water surface elevation, and SSC data were computed from section S1b-B and floodplain discharge was computed from section S1b-C. Figures A-11a and A-11b show corresponding results for the 100-year flood event for Section S1b-A. Figures A-12a and A-12b show the 100-year results in the central floodplain area. Note that each time step in the figures represents 15 minutes.
The results of the total floodplain sediment flux calculations are summarized in Table A-4. The net floodplain storage was calculated by multiplying the gross flux by a trap efficiency factor F of 0.1 based on the existing conditions model results summarized in Table A-2 for sections A and B. As noted earlier, the results at Section C were not used because of the non-representative flow conditions. Approximate average deposition rates were then found by assuming the sediment will be distributed across a roughly rectangular area of the dimensions (length and width) shown in the table.
Table A-4. Summary of floodplain sediment deposition calculations for 2-year and 100-year flood events for Scenario S1b surface.
Section S1b-A
Central Floodplain (computed using results from
Sections S1b-B and S1b-C)
2-year 100-year 2-year 100-year Elevation from which water is drawn (ft) 75.5 75.5 77.5 77.5
Average floodplain water flux for event (cfs) 830 1,296 1,655 3,832
Average SSC for event for floodplain (mg/l) 495 270 1,007 1,543
Unadjusted overbank sediment flux for event (tons) 1 543 3,460 6,696 21,706
Net floodplain storage for F = 10% (tons) 54 346 670 2,171
Typical floodplain length (ft) 600 600 1,600 1,600
Typical floodplain width (ft) 600 600 700 700
Average depth of deposition (in) 2 0.04 0.28 0.18 0.57 1 Neglects some fine sand and silt that would not settle over assumed floodplain length 2 Assumes bulk specific gravity = 1.3 The computations also allow for the generation of rating curves for maximum potential net suspended sediment transfer rates (Qs,total – Qs,return), unadjusted by trap efficiency, into cross-section S1b-A or the central floodplain area.
These are summarized for the 2-year and 100-year events, respectively, in Figures A-13 and A-14. In both cases, sediment appears to begin entering floodplain areas for main channel discharges on the order of 4,000 to 5,000 cfs. These figures can be used to estimate long-term sediment storage for events much less than the 2-year flood peak and also greater than the 100-year flood peak, but are based on a 48-hour flood hydrograph. Gross sediment flux can be estimated by discretizing a hydrograph into a series of “bins” representing characteristic discharges and then by multiplying the gross sedimentation rate (y axis) for each discharge bin by the appropriate time interval. This gross flux should then be multiplied by an appropriate trap efficiency factor in order to estimate net sediment storage.
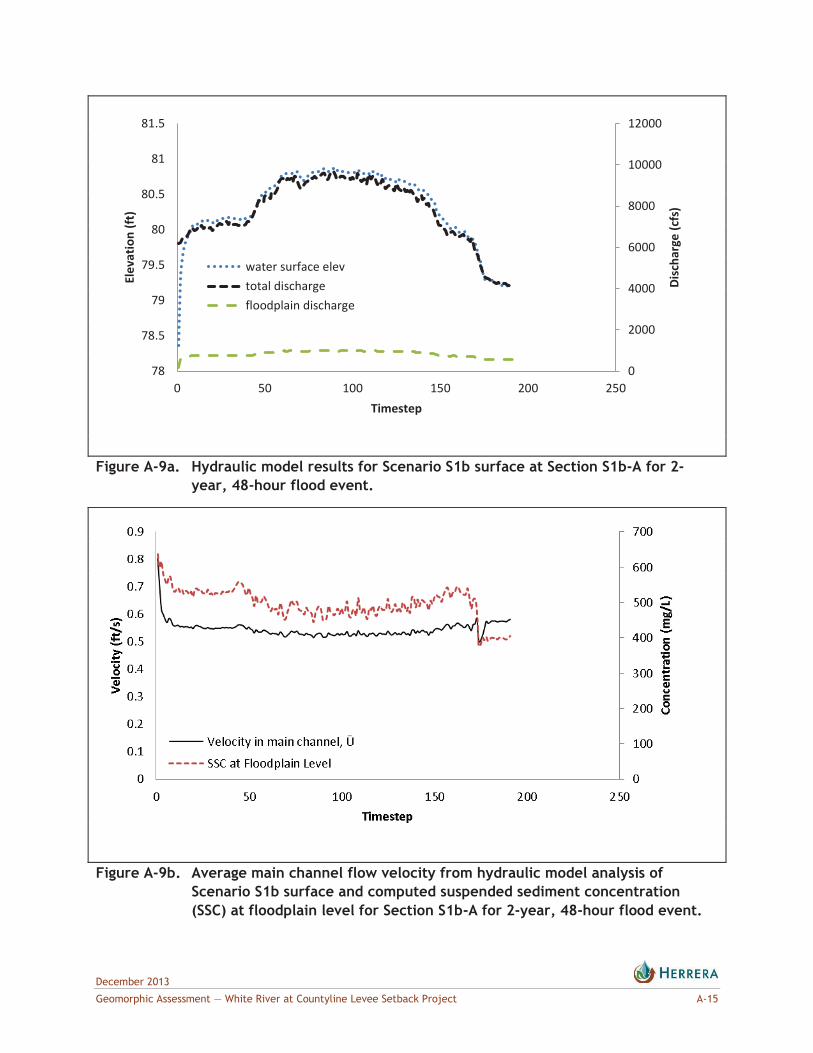
December 2013
Geomorphic Assessment — White River at Countyline Levee Setback Project A-15
Figure A-9a. Hydraulic model results for Scenario S1b surface at Section S1b-A for 2-
year, 48-hour flood event.
Figure A-9b. Average main channel flow velocity from hydraulic model analysis of
Scenario S1b surface and computed suspended sediment concentration (SSC) at floodplain level for Section S1b-A for 2-year, 48-hour flood event.
0
2000
4000
6000
8000
10000
12000
78
78.5
79
79.5
80
80.5
81
81.5
0 50 100 150 200 250
Disc
harg
e (c
fs)
Elev
atio
n (ft
)
Timestep
water surface elevtotal dischargefloodplain discharge

December 2013
A-16 Geomorphic Assessment — White River at Countyline Levee Setback Project
Figure A-10a. Hydraulic model results for Scenario S1b surface in central floodplain area
(characterized using Section S1b-B for water surface elevation and Section S1b-C for floodplain discharge) for 2-year, 48-hour flood event.
Figure A-10b. Average main channel flow velocity from hydraulic model analysis of
Scenario S1b surface and computed suspended sediment concentration (SSC) at floodplain level for Section S1b-B (used to characterize central floodplain area) for 100-year, 48-hour flood event.
0
2000
4000
6000
8000
10000
12000
78.6
78.8
79
79.2
79.4
79.6
79.8
80
80.2
80.4
80.6
0 50 100 150 200 250
Disc
harg
e (c
fs)
Elev
atio
n (ft
)
Timestep
water surface elevtotal dischargefloodplain discharge

December 2013
Geomorphic Assessment — White River at Countyline Levee Setback Project A-17
Figure A-11a. Hydraulic model results for Scenario S1b surface at Section S1b-A for 100-
year, 48-hour flood event.
Figure A-11b. Average main channel flow velocity from hydraulic model analysis of
Scenario S1b surface and computed suspended sediment concentration (SSC) at floodplain level for Section S1b-A for 100-year, 48-hour flood event.
0
2000
4000
6000
8000
10000
12000
14000
77
78
79
80
81
82
83
0 50 100 150 200 250
Disc
harg
e (c
fs)
Elev
atio
n (ft
)
Timestep
water surface elevtotal dischargefloodplain discharge

December 2013
A-18 Geomorphic Assessment — White River at Countyline Levee Setback Project
Figure A-12a. Hydraulic model results for Scenario S1b surface in central floodplain area
(characterized using Section S1b-B for water surface elevation and Section S1b-C for floodplain discharge) for 100-year, 48-hour flood event.
Figure A-12b. Average main channel flow velocity from hydraulic model analysis of
Scenario S1b surface and computed suspended sediment concentration (SSC) at floodplain level for Section S1b-B (used to characterize central floodplain area) for 100-year, 48-hour flood event.
0
2000
4000
6000
8000
10000
12000
14000
16000
18000
77.5
78
78.5
79
79.5
80
80.5
81
81.5
82
0 50 100 150 200 250
Disc
harg
e (c
fs)
Elev
atio
n (ft
)
Timestep
water surface elevtotal dischargefloodplain discharge

December 2013
Geomorphic Assessment — White River at Countyline Levee Setback Project A-19
Note: Unfilled circles (red) represent results at Section S1b-A, and filled diamonds (blue) represent results at Sections S1b-B and C.
Figure A-13. Relationship between overall rate of overbank sedimentation (unadjusted for trap efficiency) and main channel discharge for 2-year, 48-hour flood event.
Note: Unfilled circles (red) represent results at Section S1b-A, and filled diamonds (blue) represent results at Sections S1b-B and C.
Figure A-14. Relationship between overall rate of overbank sedimentation (unadjusted for trap efficiency) and main channel discharge for 100-year, 48-hour flood event.

December 2013
A-20 Geomorphic Assessment — White River at Countyline Levee Setback Project
Summary The analysis presented herein provides a mechanism for computing net overbank sediment storage volumes in floodplain areas subject to regular inundation by flood flow. In the analysis, floodplain sediment storage depends on sediment flux in the main channel as computed using a suspended sediment rating curve, the size distribution of the suspended sediment, the flux of water across the floodplain, floodplain elevation, cross-section averaged hydraulics within the main channel from which water is transferred to the floodplain, and the sediment trap efficiency of the floodplain. Trap efficiency for the project site was estimated by comparing sediment storage observed for the 2009-2011 period, computed by differencing LiDAR-based DEMs, with the volume of sediment that the theory would show is deposited for a trap efficiency of 1.
Floodplain flux and in-channel hydraulic parameters were computed using the output from a two-dimensional hydraulic model (Herrera 2012b). To account for variability within the model, floodplain trap efficiency was computed based on the hydraulics at three separate cross sections. Trap efficiency thus computed ranged from 0.084 to 0.341. Because the cross-section characterized by the highest trap efficiency was located within a hydraulically complex eddy that experienced very low velocities for part of the simulation, the average trap efficiency computed from the other two sections, rounded up to 0.1, was used for making projections regarding possible future sediment accumulation rates. Additional floodplain sedimentation observations could improve the estimate of floodplain trap efficiency.
Simulated sedimentation depths for storms representing the 2-year and 100-year recurrence floods ranged from 0.04 to 0.57 inches over a 48-hour simulation period. Within the central floodplain area at the site, the sedimentation simulated for the 2-year event, 48-hour event was over half the sedimentation associated with the 100-year, 48-hour event, indicating that overbank sedimentation will likely be dominated over the long term by inundation that occurs relatively frequently. The simulations also show that sedimentation would be possible for discharges that are significantly lower than the 2-year recurrence peak flow of 9,692 cfs. Rating curves were developed that can be used for estimating overbank sedimentation rates at discharges ranging from approximately 4,000 cfs up to the 100-year discharge of 15,532 cfs.
The simulations upon which this analysis was based assume that floodplain hydraulics are consistent with conditions likely to occur within approximately 3 years after project construction. Over extended periods of time, any aggradation within the main channel that reduces its capacity would be likely to increase overbank sedimentation rates. Because overbank deposition depends on the product of floodplain discharge and suspended sediment concentration, and because the suspended sediment concentration in the flow entering the floodplain depends on the depth of the main channel, aggradation in the main channel would likely increase overbank sedimentation at rates that are disproportionately larger than to the relative increase in floodplain inundation frequency, at least initially. However, long-term accumulation of material on the floodplain would tend to counter this effect by raising the elevation of the channel banks and thereby reducing floodplain discharge.