fish passage and geomorphic assessment - stoecker...
TRANSCRIPT

Gaviota Creek Fish Passage and Geomorphic Assessment
Prepared for California Department of Fish and Game
And Pacific States Marine Fisheries Commission
Prepared by
Michael Love and Associates PO Box 4477
Arcata CA 95518
And
Stoecker Ecological PO Box 2062
Santa Barbara CA 93120

The Gaviota Creek Fish Passage and Geomorphic Assessment was funded by the California Department of Fish and Game’s California Coastal Salmon Recovery Program and Pacific States Marine Fisheries Commission (Grantee Agreement No. AWI-SCR-2). The final report, including analysis and recommendations contained within, was prepared by:
Antonio Llanos P.E.
Project Engineer, License No. C65621 Michael Love & Associates
Michael Love
Hydrologic Engineer Michael Love & Associates
Matt Stoecker Aquatic Biologist
Stoecker Ecological
Gaviota Creek Fish Passage and Geomorphic Assessment Michael Love & Associates March 15, 2007
Table of Contents
1 Project Description .................................................................................... 1 1.1 Project Objective.................................................................................................1 1.2 Project Background .............................................................................................1 1.2.1 Gaviota Creek Watershed..............................................................................1 1.2.2 Steelhead Habitat ........................................................................................2 1.2.3 Steelhead Population Information...................................................................3 1.2.4 Steelhead Migration Barriers within the Watershed...........................................4 1.2.5 Location of Assessed Migration Barriers ..........................................................4
2 Field and Assessment Methodology ........................................................... 7 2.1 Field Methods .....................................................................................................7 2.2 Fish Passage Assessment Methods ........................................................................8 2.2.1 Passage Criteria for Grade Control Structures ..................................................8 2.2.2 HEC-RAS model development ........................................................................9 2.2.3 FishXing model development .........................................................................9
3 Hydrologic Conditions............................................................................ 10 3.1 Watershed Characteristics ..................................................................................10 3.2 Stream Gage ....................................................................................................10 3.3 Peak Flows .......................................................................................................11 3.4 Fish Migration Flows ..........................................................................................11
4 Analysis of Fish Migration Barriers........................................................... 14 4.1 Grade Controls GA2 and GA3..............................................................................14 4.1.1 Fish Passage Hydraulics for GA2 and GA3......................................................16 4.2 Grade Controls BLDR WEIR, GA4 through GA6......................................................20 4.2.1 Fish Passage Hydraulics for Boulder Weir through GA6....................................21 4.3 BR_Chute, BLDR_JAM and GA7...........................................................................26 4.3.1 Fish Passage Conditions for Bedrock Chute, Boulder Jam, and GA7...................26 4.4 Grade Controls GA8 through GA13 ......................................................................31 4.4.1 GA 8-13 Fish Passage Hydraulics..................................................................32 4.5 Fish Passage Summary ......................................................................................38
5 Geomorphic Assessment........................................................................ 39 5.1 History of the Highway and Resulting Changes to the Channel ................................39 5.1.1 Lower Gaviota Creek Channel Realignment....................................................39 5.2 Channel Morphology ..........................................................................................42 5.2.1 Lower Channel Reach .................................................................................42 5.2.2 Middle Channel Reach.................................................................................45 5.2.3 Upper Channel Reach .................................................................................47 5.3 General Observations ........................................................................................50 5.3.1 Rate of Colluvial Inputs within Canyon .........................................................50 5.3.2 Channel Realignment..................................................................................50
6 Recommendations ................................................................................ 51 6.1 Potential Solutions for Improving Fish Passage .....................................................51 6.1.1 GA2 and GA3.............................................................................................51 6.1.2 GA4 through GA6.......................................................................................52 6.1.3 Bedrock Chute and Boulder Jam...................................................................54 6.1.4 GA7..........................................................................................................55 6.1.5 GA8 through GA13 .....................................................................................55 6.2 Develop an Action Plan ......................................................................................56
Gaviota Creek Fish Passage and Geomorphic Assessment
7 References .......................................................................................... 57
Michael Love & Associates March 15, 2007

APPENDICES APPENDIX A – Fish passage assessment of two culverts on Highway 101: Upper
Gaviota Creek (GA_20) and Las Canovas Creek (CA_GA_1) APPENDIX B – Hydrologic Calculations APPENDIX C – Channel Cross Sections
List of Figures
Figure 1.1 – Project location map. .............................................................................. 2
Figure 1.2 – Location of assessed grade control structures. ............................................ 6
Figure 3.1 - Annual Flow Duration Curve for Gaviota Creek at Gaviota. ..........................12
Figure 4.1 – Longitudinal Profile of Gaviota Creek Study Reach......................................15
Figure 4.2 – Looking upstream at grade control GA2. T. ...............................................17
Figure 4.3 – Looking upstream to GA3.. .....................................................................17
Figure 4.4 – Plan map drawing of the channel reach containing GA2 and GA3. .................18
Figure 4.5 – Longitudinal profile showing location of grade controls GA2 and GA3. ...........19
Figure 4.6 – HEC-RAS results showing water surface profiles for GA2 and GA3.................19
Figure 4.7 – Looking upstream at GA4. ......................................................................22
Figure 4.8 – Grade control GA5 located 80 ft upstream of GA4. .....................................22
Figure 4.9 – Grade control GA6 located 90 ft upstream of GA5. .....................................23
Figure 4.10 – Plan map drawing of BOULDER WEIR, GA4, GA5, and GA6.........................24
Figure 4.11 – Longitudinal profile showing location of BLDR_WEIR, GA4, GA5 and GA6. ....25
Figure 4.12 – HEC-RAS water surface profiles for BLDR_WEIR, GA4, GA5, and GA6..........25
Figure 4.13 – Looking downstream at bedrock chute (BR_CHUTE)..................................27
Figure 4.14 – Looking upstream at boulder jam (BLDR_JAM).........................................28
Figure 4.15 – GA 7 is skewed at a 45-degree angle with the centerline of the channel. .....28
Figure 4.16 – Plan map drawing of the channel reach containing GA7.............................29
Figure 4.17 – Longitudinal profile of the BR_CHUTE, BLDR JAM, and GA7. .......................30
Figure 4.18 – Photo of GA8. .....................................................................................33
Figure 4.19 – Photo of GA9. .....................................................................................33
Figure 4.20 –GA10 is failing along the right bank from flanking. ....................................34
Figure 4.21 – GA11 and GA12 are keyed to sacrete and large boulders...........................34
Figure 4.22 - GA13 is keyed into the sacrete wall,large boulders and exposed bedrock.....35
Figure 4.23 – Plan map drawing of the channel reach containing GA 8-13 .......................36
Figure 4.24 – Longitudinal profile showing location of the GA 8 through GA 13.................37
Figure 4.25 – HEC-RAS water surface profiles for GA8 through GA13..............................37 Gaviota Creek Fish Passage and Geomorphic Assessment Michael Love & Associates March 15, 2007

Figure 5.1 – Looking upstream at the “pass” in Gaviota Canyon, (a) illustrated during an early expedition prior to the first road (from Chesnut, 1993) and (b) under present conditions, with the southbound 101 bridge crossing the creek. . .........40
Figure 5.2 – Aerial photograph from 1943 showing current and historic alignment............41
Figure 5.3 – Longitudinal Profile of Gaviota Creek Study Reach......................................43
Figure 5.4 – Size distribution of substrate within Gaviota Creek .....................................44
Figure 5.5 – Photos of the lower reach. ......................................................................44
Figure 5.6 – Photos of the middle reach. ....................................................................46
Figure 5.7 – Photos of the upper reach.......................................................................48
Figure 6.1 –Potential regrading the channel and constructing stable boulder step-pool morphology between 68+50 and 71+50. ......................................................52
Figure 6.2 – Potentail of removal of GA4 and GA5 combined with regrading the channel....53
Figure 6.3 –Potentail relocation of channelaway from the highway into the alluvial terrace to the west of GA4. .........................................................................54
List of Tables Table 1.1 – Identification code and location of potential migration barriers assessed
as part of this study.................................................................................... 5 Table 3.1 – Summary of stream gage information for Gaviota Creek. .............................10 Table 3.2 – Summary of two methods to determine peak flood frequency for the
Gaviota Creek study reach..........................................................................11 Table 3.3 - Fish passage design flow guidelines from NOAA Fisheries (2001) and
CDFG (2002). ...........................................................................................13 Table 3.4 - Fish passage design flows for Gaviota Creek based on agency guidelines
and estimated using the Gaviota Creek flow duration curve. ............................13 Table 4.1 - Water surface drops over GA2 and GA3 at no-flow and typical adult
steelhead passage flows. ............................................................................16 Table 4.2 - Water surface drop for fish passage flows at the BLDR WR, GA4, GA5,
and GA6 from HEC-REAS model results. .......................................................21 Table 4.3 - Water surface drop for fish passage flows at the GA7 from FishXing model
results. ....................................................................................................30 Table 4.4 - Water surface drop for fish passage flows at the GA8, GA9, GA10, GA11,
GA12 and GA13 from HEC-RAS model results. ...............................................32 Table 4.5 – Summary of drop height as applied to fish passage and ordered by
severity of barrier......................................................................................38 Table 5.1 – Frequency of substrate by class from Wolman pebble count..........................44
Gaviota Creek Fish Passage and Geomorphic Assessment Michael Love & Associates March 15, 2007
1 Project Description The following report describes a steelhead migration barrier assessment within lower Gaviota Creek, accompanied by a geomorphic channel assessment and development of preliminary recommendations for treatment of sites. The study stream reach runs through Gaviota Canyon adjacent to Highway 101, from stream mile 0.9 (from the ocean) to mile 2.4. This reach contains 12 concrete grade control structures and two free spanning bridges. As part of this project, fish passage conditions were also assessed at the Highway 101 culvert on Gaviota Creek (GA_20) and the Highway 101 culvert on Las Canovas Creek (GA_CA_1), a tributary to Gaviota Creek. Both of these culverts are located upstream of the Gaviota Canyon study reach and the results of the culvert assessments are provided in Appendix A. 1.1 Project Objective
This report focuses on guiding future actions aimed at improving steelhead passage on Gaviota Creek by providing a detailed description of existing conditions and development of preliminary recommendations. The report includes:
1. An assessment of existing fish passage conditions using the California Department of Fish and Game (CDFG) protocol (Part IX of California Salmonid Stream Habitat Restoration Manual, 2003),
2. An analysis and interpretation of existing channel geomorphology and channel response to realignment and modification associated with the Highway, and
3. Development of preliminary recommendations for improving fish passage and restoring proper channel function.
1.2 Project Background
1.2.1 Gaviota Creek Watershed Gaviota Creek, a tributary to the Pacific Ocean, is located along the southern coast of Santa Barbara County (Figure 1.1). The 12,877 acres watershed rises from sea level to 2,800 feet in elevation and is the third largest coastal watershed in southern Santa Barbara County, between Jalama Creek to the west and Rincon Creek to the east. Annual precipitation values range from 17 to 21 inches within the drainage. The lower reach of Gaviota Creek lies within Gaviota State Park, and flows through Gaviota Canyon and into a coastal lagoon. Upstream of the canyon the stream divides into four branches: main stem Gaviota Creek, West Fork Gaviota Creek, Las Canovas Creek, and Las Cruces Creek.
Gaviota Creek Fish Passage and Geomorphic Assessment Page 1 of 55 Michael Love & Associates December 15, 2006

The stream currently supports runs of Southern Steelhead (Stoecker, 2002), a Federally listed endangered species. A large-scale assessment of steelhead migration barriers and existing habitat conditions was conducted by Stoecker et al. in 2002, and included Gaviota Creek and some of its tributaries. Excellent spawning and summer rearing habitat was identified within Las Cruces Creek, which flows into Gaviota Creek approximately 4.4 miles upstream of the ocean. Additionally, habitat suitable for supporting populations of steelhead trout was identified in several other tributaries and one adult steelhead was observed in upper Gaviota Creek, immediately below the Highway 101 culvert (GA_20). Although the stream system has habitat suitable for sustaining endangered Southern Steelhead, several significant migration barriers located within the lower reach of Gaviota Creek block fish from reaching spawning and rearing habitats. Nearly all of these barriers are located within Gaviota State Park and associated with State Highway 101, which parallels and confines the stream as it flows through Gaviota Canyon to the ocean. A previous barrier assessment (Stoecker 2002) identified 54 potential barriers within the watershed; 18 of which are considered natural. This earlier assessment relied on qualitative measures to assess each fish passage obstruction and recommended further analysis to develop appropriate fish passage alternatives.
Figure 1.1 – Project location map.
1.2.2 Steelhead Habitat Of the southern Santa Barbara County coastal streams, Gaviota Creek watershed has the second highest total habitat quantity (23.0 miles of stream length) that was historically accessible to steelhead. In the previous assessment (Stoecker 2002) the watershed ranked 23rd out of 24 for Gaviota Creek Fish Passage and Geomorphic Assessment Page 2 of 55 Michael Love & Associates March 15, 2007

average habitat quality due to extremely poor habitat conditions in the upper Las Cruces and West Fork Creek tributaries, due to high levels of natural and human-influenced erosion and low summer stream flow. However, Gaviota Creek produces relatively high summer base flows and maintains cool water temperatures in the headwaters of the mainstem, Las Canovas Creek, and the lower mainstem. The watershed also contains one of the largest lagoon systems along the southern Santa Barbara County coast, which is ideal for steelhead rearing, food production, and acclimation between fresh and saltwater. Also, the estuary mouth is open to the ocean longer than most streams in the region, providing good access for steelhead adults and smolts. These characteristics make Gaviota Creek one of the highest ranking watersheds within the southern Santa Barbara County coast in terms of steelhead recovery potential and potential productivity. 1.2.3 Steelhead Population Information Adult steelhead and juvenile O. mykiss have consistently been documented in the Gaviota Creek watershed since at least the 1930’s and into the present. In the 1930’s California Department of Fish and Game (CDFG) personnel reported “steelhead entered the creek in winter”. Long-time resident and owner of the Circle Bar B Ranch, Jim Brown, reported catching “adult steelhead in lower Gaviota Creek in the 1940’s” (pers. comm Stoecker 2001). Former CDFG Biologist Ken Sasaki reported in 1986 that “steelhead have continued to run in Gaviota Creek”. Former State Park biologist Ronnie Glick reported that CDFG personnel “caught someone with a 6-pound steelhead in lower Gaviota Creek.” In 2001, Stoecker observed and photographed a 22-inch adult steelhead in Gaviota Creek. In addition to historic documentation of adult steelhead sightings in Gaviota, juvenile steelhead have also continually been observed from the early 1900’s until present both on the mainstem of Gaviota Creek as well as Las Canovas Creek and the uppermost reaches of Gaviota Creek and the South Fork. O. mykiss were observed inside the lower backwatered section of the Las Canovas Creek Highway 101 culvert in 2001 and 2006. No trout were observed upstream of this impassable culvert during 2001 surveys to the natural upstream limits of this tributary. The Las Cruces Creek was reportedly planted with wild southern steelhead rescued from the Santa Ynez River in 1939. Former CDFG Fisheries Biologist, John Radovich, reported catching a 12-13 inch trout in the lagoon “with a stomach full of gobies” during August 1960. See Stoecker 2002 for a table of additional historic O. mykiss occurrence. During geomorphic and fish barrier surveys for this project O. mykiss were observed in Gaviota Creek and Las Canovas Creek. Two O. mykiss measuring 7 inches were observed in Gaviota Creek within the reach downstream of Las Canovas Creek at stations G14 and G17. One O. mykiss measuring 5 inches was observed immediately downstream of the outlet of Las Canovas Creek and a large O. mykiss measuring 11 inches was observed 500 feet upstream of Las Canovas Creek. In upper Gaviota Creek, twelve O. mykiss ranging from 5 to 7 inches were observed in the outlet pool downstream of the Highway 101 culvert. In Las Canovas Creek, three O. mykiss measuring 5 to 7 inches were observed inside the backwatered lower part of the Highway 101 culvert. No fish were observed upstream of the impassable culvert on Las Canovas Creek. A total of 7 Southwestern Pond Turtles were observed on Gaviota Creek between the pass and 500 feet upstream of Las Canovas Creek.
Gaviota Creek Fish Passage and Geomorphic Assessment Page 3 of 55 Michael Love & Associates March 15, 2007
1.2.4 Steelhead Migration Barriers within the Watershed Anthropogenic migration barriers represent one of the most limiting factors to steelhead in Gaviota Creek. Gaviota Creek contains at least 37 anthropogenic fish passage barriers that limit steelhead and other fish in varying degrees (Stoecker 2002). The highest ranking barrier along the entire southern Santa Barbara County coast was identified as the Gaviota Creek box culvert on Highway 101, with 2.45 miles of high quality habitat upstream (31.3% of the historically accessible steelhead habitat within the watershed) and observation of an adult steelhead in the downstream pool during 2001 surveys. The 7th highest ranking barrier along the entire southern Santa Barbara County coast was identified as the Las Canovas box culvert on Highway 101, with 0.92 miles of high quality habitat upstream (11.7% of the historically accessible steelhead habitat within the watershed). During the survey steelhead were present downstream, but no fish present upstream. In addition to these two impassable culverts, there are at 14 grade control structures on Gaviota Creek below the Las Canovas Creek tributary that present varying degrees of severity for steelhead passage. Collectively these partial barriers can hinder upstream passage, depending on stream’s flow-rate and flow duration. In addition to physical barriers, a significant low-flow barrier was produced when Gaviota Creek was realigned into an artificial channel and diverted through lower Las Cruces Creek for construction of the Highway 101 and 1 interchange. This earthen channel section of Gaviota Creek does not retain surface flows for as long of a duration as natural reaches up and downstream This drying channel reach reduces the window of opportunity for upstream and downstream steelhead migration. 1.2.5 Location of Assessed Migration Barriers For this project we performed a detailed and quantitative fish passage assessment of 14 grade control structures and a confined bedrock reach located in lower Gaviota Creek adjacent to Highway 101. The 14 grade control structures consisted of 12 concrete drop-structures, a boulder weir constructed prior to the 2002 assessment to improve steelhead passage, and a large boulder jam that is partly held in-place by an adjacent retaining wall (Figure 1.2). Table 1.1 lists the identification code for each grade control structure addressed in this project. When applicable, the identification codes used in the previous assessment were used for this project. GA_1 is a County maintained bridge crossing located approximately 1,900 feet upstream of the ocean. This crossing is planned for replacement and was not included in this study.
Gaviota Creek Fish Passage and Geomorphic Assessment Page 4 of 55 Michael Love & Associates March 15, 2007

Table 1.1 – Identification code and location of potential migration barriers assessed as part of this study.
Barrier ID Code Barrier Type
Latitude Longitude
(NAD83) River Miles from Ocean
GA_2 Concrete Grade Control Weir N 340 29’ 7.89” W 1200 13’ 45.05” 1.32
GA_3 Concrete Grade Control Weir N 340 29’ 8.79” W 1200 13’ 43.92” 1.34
BLDR_WEIR Constructed Boulder Weir N 340 29’ 14.79” W 1200 13’ 38.32” 1.49
GA_4 Concrete Grade Control Weir N 340 29’ 15.34” W 1200 13’ 37.76” 1.51
GA_5 Concrete Grade Control Weir N 340 29’ 16.77” W 1200 13’ 36.53” 1.54
GA_6 Concrete Grade Control Weir N 340 29’ 17.66” W 1200 13’ 36.15” 1.56
BR_CHUTE Bedrock Chute N 340 29’ 27.49” W 1200 13’ 34.89” 1.78
BLDR_JAM Large Boulder Jam N 340 29’ 29.39” W 1200 13’ 34.54” 1.81
GA_7 Concrete Grade Control Weir N 340 29’ 31.77” W 1200 13’ 35.01” 1.86
GA_8 Concrete Grade Control Weir N 340 29’ 39.31” W 1200 13’ 46.71” 2.12
GA_9 Concrete Grade Control Weir N 340 29’ 39.64” W 1200 13’ 47.50” 2.13
GA_10 Concrete Grade Control Weir N 340 29’ 40.27” W 1200 13’ 48.56” 2.15
GA_11 Concrete Grade Control Weir N 340 29’ 40.86” W 1200 13’ 49.25” 2.17
GA_12 Concrete Grade Control Weir N 340 29’ 41.78” W 1200 13’ 50.05” 2.19
GA_13 Concrete Grade Control Weir N 340 29’ 43.19” W 1200 13’ 50.75” 2.22
Gaviota Creek Fish Passage and Geomorphic Assessment Page 5 of 55 Michael Love & Associates March 15, 2007

NortH
GA 2
GA 3
BLDR
WEIR
GA 4
GA 5
GA 6
GA 7
GA 10
GA 11
GA 12
GA 9
GA 13
GA 8
END SURVEY
RM 2.38
START SURVEY
RM 0.92
HWY 101 NB TUNNEL
& SB BRIDGE
GAVIO
TA C
K
HWY 101
SB BRIDGE
BR CHUTE
BLDR JAM
US101
Hydrologic Solutions
Michael Love & Associates Gaviota Creek Fish Passage
and Geomorphic Assessment
Figure 2
Location of Grade Control Structures

2 Field and Assessment Methodology Fieldwork was conducted during the days of October 9th to October 15th 2006 by Michael Love & Associates and Stoecker Ecological. Data collection consisted of surveying, mapping, and describing the channel substrate using Wolman pebble counts along the study reach. The site survey component of the project involved:
1. Plan mapping of pertinent channel features at identified barriers. Features included encroachment of road embankments, channel alignment, thalweg location, active channel margins, and grade controlling features such as exposed bedrock. Level of detail varied depending on distance from fish barrier, channel type and site conditions.
2. Characterizing streambed material using surface pebble counts in two locations.
3. Surveying a continuous longitudinal channel profile through the project reach (1.45 miles).
Detail varied depending on channel character, location of grade controlling features, and distance from identified barriers.
4. Surveying representative channel cross sections at various locations throughout the project
reach and across grade control structures.
5. Collecting detailed survey information at culverts and grade control structures following the CDFG assessment protocol.
2.1 Field Methods
Surveys were conducted using a Leica Total Station to collect coordinate and elevation data of the Gaviota Creek channel in the study reach. A traverse was conducted starting downstream of the southbound rest area and continuing upstream to the second bridge crossing for the southbound lanes of Highway 101 (1.45 miles). The horizontal datum for the survey was California State Plane Zone 5. The vertical datum was approximated to the NAVD88 datum. The survey data was used for mapping, developing longitudinal profile of the channel thalweg, plotting cross sections along the top of each grade control structure and at the downstream tailwater control (contained in Appendix C). Pebble counts were conducted following the Wolman method to randomly record the size of 100 particles. Two locations were selected for pebble counts, one downstream at the tailwater control for GA2 and a second upstream at GA7. Plan mapping was performed using field drawings, combined with survey points to assist with scale, to create diagrammatic plans of the grade control structures and adjacent channel.
Gaviota Creek Fish Passage and Geomorphic Assessment Page 7 of 55 Michael Love & Associates March 15, 2007

2.2 Fish Passage Assessment Methods
A fish passage analysis of each grade control and culvert structure was performed to determine the hydraulic environment encountered by adult steelhead, resident trout and juvenile salmonids at various migration flows. The primary hydraulic feature evaluated was the water surface drop over each grade control structure at varying fish passage flows. Since each structure is relatively short (generally 5 to 10 feet in length) and there are well-formed pools above and below each structure, water velocities and depths were not considered in the fish passage analysis. Hydraulic analysis was performed using the hydraulic models, HEC-RAS 3.1.2 and FishXing3.0. Predicted water surface drops over each structure at fish passage flows were compared to assessment and design criteria established by the California Department of Fish and Game’s (CDFG) and the National Marine Fisheries Service (NOAA Fisheries) for adult steelhead, resident rainbow trout, and juvenile salmonids. 2.2.1 Passage Criteria for Grade Control Structures The fish passage assessment methods used in this study followed the California Department of Fish and Game’s fish passage assessment protocol (Taylor and Love, 2003). Since the CDFG protocol was developed for “stream crossings”, some modifications to the assessment process were necessary to apply them to grade control structures. Additionally, the CDFG (2002) and NOAAFisheries (2001) fish passage design criteria were also considered when assessing fish passage conditions. Application First Phase Passage Filter to Grade Controls Once the necessary field survey data is collected, the fish passage assessment involves a two steps process. The first is to use the CDFG First Phase Filter. This is a flow chart that is used to determine if the assessed structures is GREEN, GRAY, or RED. These categories are defined as: GREEN - The structure provides suitable fish passage conditions for all life stages of salmonids at all migration flows. GRAY – Passage conditions at the structure are indeterminate and a full hydraulic analysis is required. The structure is likely a partial barrier (blocks certain life stages) and/or temporal barrier (blocks a life-stage at some flows). Further hydraulic analysis will quantify the passage conditions relative to life-stage and flow. RED – Structure fails to provide suitable passage conditions at all flows for all life-stages of salmonid. The stronger individual fish within the population may be able to pass through the structure at some flows. However, the crossing is considered by CDFG to provide inadequate passage. Although the first phase filter was originally developed for culverts, the drop height criteria can be applied to grade control structures. The filter defines a RED structure as having a residual (no-flow) drop height greater than 2 feet. Drop heights greater than 2 feet are considered sufficient to hinder or block upstream passage all salmonid life stages. Although a proportion of the adult steelhead
Gaviota Creek Fish Passage and Geomorphic Assessment Page 8 of 55 Michael Love & Associates March 15, 2007

population will likely be able to leap over a 2 feet drop at certain flow conditions, this drop height is considered to be excessive and cause undesired migration delay. Based on current CDFG and NOAA Fisheries design criteria, we chose to defined a residual drop height of 6 inches or less as being GREEN (suitable for passage of adult and juvenile trout) Hydraulic Analysis of Fish Passage We modeled hydraulics over each grade control structure to further quantify the water surface drop throughout the range of acceptable fish passage flows. Although the assessment protocol only requires modeling fish passage for the GRAY structures, we selected to model all of the inventoried structures, including those identified as GREEN or RED. Hydraulics were modeled with HEC-RAS 3.1.2 and FishXing 3.0. The fish passage flow range for each life-stage were determined using CDFG criteria. Fish passage flow development is outlined in Chapter 3. 2.2.2 HEC-RAS model development At fish passage flows the grade control structures function hydraulically as irregularly shaped broad-crested weirs. Most of the grade control structures in the study reach are clustered into distinct groups and the drop over many of the structures is directly influenced by the next downstream structure. HEC-RAS was chosen as the preferred hydraulic model for analyzing most of the structures, since it has the capability of modeling broad-crested weirs of irregular shape and can model an entire channel reach consisting of multiple weirs. The longitudinal profile and cross sections surveyed at each structure and within the channel were used to create the model geometry. Each drop structure was modeled as a broad crested weir. Default contraction and expansion coefficients of 0.1 and 0.3, respectively, were applied. A broad crested weir coefficient of 2.6 was used for modeling all structures. Estimates of downstream channel slope below the tailwater control were used to define the downstream boundary condition. Since, in most cases, the water depth and velocity within the channel below a grade control structure was completely controlled by the next downstream structure, the impacts of channel roughness on results was negligible at fish passage flows. Estimates of Manning’s roughness were most critical for the channel segment below the lowest grade control. Estimates ranged from between 0.040 and 0.050 for fish passage type flows. 2.2.3 FishXing model development Grade control structure GA7 is located by itself, rather than as part of a series of grade control structures. It was modeled using the FishXing 3.0 software, which is intended for the analysis of fish passage through stream crossings. The tailwater discharge rating curve was developed from the downstream cross section, channel slope, and estimate of Manning’s roughness. The grade control structure was treated as a short box culvert and the drop over the structure was analyzed at various fish migration flows.
Gaviota Creek Fish Passage and Geomorphic Assessment Page 9 of 55 Michael Love & Associates March 15, 2007

3 Hydrologic Conditions Hydrologic calculations involved the compilation of existing flow and precipitation records for estimation of fish migration flows, recurrence intervals of peak flows, and general characterization of seasonal hydrology. Estimates of peak flows associated with 2-year, 5-year, 10-year, 25-year, 50-year, and 100-year recurrence intervals where calculated using standard methods. Fish passage flows were calculated from flow duration curves following procedures outlined in the CDFG assessment protocol. 3.1 Watershed Characteristics
The Gaviota Creek watershed comprises over 12,877 acres and rises from sea level to 2,801 feet in elevation. It is the third largest coastal watershed in southern Santa Barbara County, between Jalama Creek to the west and Rincon Creek to the east. Within a short stream reach four primary tributaries flow together to form the mainstem of Gaviota Creek, which runs south through a narrow canyon before emptying into a relatively large coastal lagoon at the edge of the Pacific Ocean. The tributaries include Las Canovas Creek flowing from the east, upper Gaviota Creek from the northeast, Las Cruces Creek from the north, and West Fork Gaviota Creek from the northwest. Annual precipitation values range from 17 to 21 inches within the drainage. The watershed contains an estimated 50 miles of roads and only 105 acres, or 0.8% of the watershed is classified as urban and impervious. The watershed is primarily privately owned (73%) with the public lands divided between California State Parks (15%) and the Los Padres National Forest (12%). 3.2 Stream Gage
A historic streamflow gage operated by the USGS and located on Gaviota Creek near grade control GA_ 5 provides twenty years of annual peak flow and daily average flow records (Table 3.1). This flow data was used to characterize hydrologic conditions throughout the project reach. Table 3.1 – Summary of stream gage information for Gaviota Creek.
USGS Flow Gage Summary Station Number 11120550 Stream Name Gaviota Creek at Gaviota Latitude 34°29'16"
Longitude 120°13'34" Record Length 20 years Years in Operation 1967 – 1986 Drainage Area 18.8 mi2
Gaviota Creek Fish Passage and Geomorphic Assessment Page 10 of 55 Michael Love & Associates March 15, 2007

3.3 Peak Flows
Two methods were used to estimate peak flows for the Gaviota Creek study reach.:
1. Flow estimates using regional regression equations developed for the South Coast Region of California by the USGS (Waananen and Crippen, 1977) were used to predict the 2, 5, 10, 25, 50, and 100-year return period flows. Mean annual precipitation was obtained from Parameter-elevation Regressions on Independent Slopes Model (PRISM).
2. Peak flows associated with the 2, 5, 10, 25, 50, and 100 year recurrence intervals were
estimated using the 20 year peak flow record from USGS gaging station on Gaviota Creek. Peak flow estimates were made using a Log-Pearson Type III (LP3) distribution as described in USGS Bulletin 17B - Guidelines for Determining Flood Flow Frequency (1982).
Appendix B contains the peak flow calculations. Table 3.2 – Summary of two methods to determine peak flood frequency for the Gaviota Creek study reach.
Return Period of Peak Flow
Method of Estimation 2 year(cfs)
5 year(cfs)
10 year(cfs)
25 year(cfs)
50 year (cfs)
100 year(cfs)
Regional Regression Equations Waananen & Crippen, 1977 148 605 1,210 2,681 4,244 6,033
Log Pearson Type 3 using Gaviota Creek Annual Peak Flow Record
1,048 2,843 4,632 7,291 9,684 12,348
3.4 Fish Migration Flows
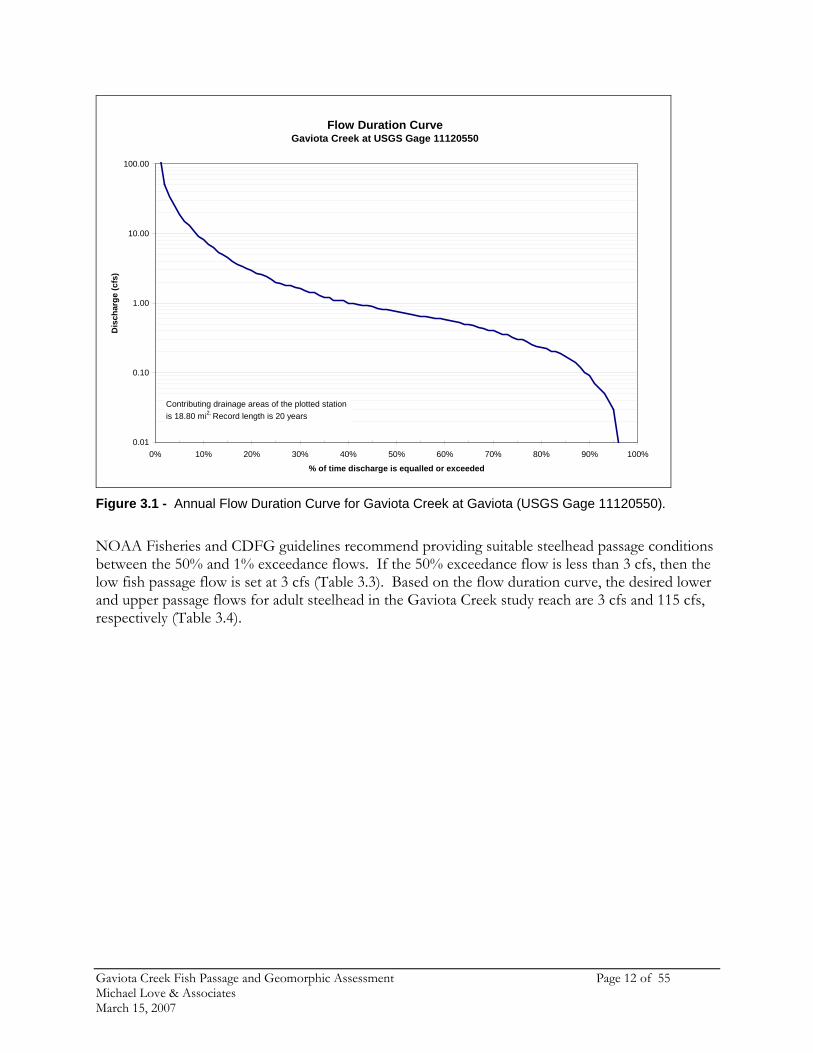
Both the National Marine Fisheries Service (NOAA Fisheries) and the California Department of Fish and Game (CDFG) have design guidelines for fish passage at road-stream crossings (CDFG, 2002; NOAA Fisheries, 2001). The two sets of guidelines were developed together and are functionally equivalent. The guidelines contain recommended fish passage design flows for juvenile salmonids, resident rainbow trout, and adult anadromous steelhead trout. They consist of a lower and upper design flow that encompasses the range of flows for which upstream passage should be provided. Beyond this flow range it is not required to provide suitable passage conditions. Fish passage design flows are defined in terms of exceedance flows obtained from flow duration curves constructed using daily average flow. Annual exceedance defines the average duration that a flow is equaled or exceeded in a year. For example, flows within a stream are greater than the 33% exceedance flow for one-third of the year, on average. To determine suitable fish passage flows for use in assessing existing fish passage conditions, a flow duration curve was constructed from the daily average flows measured at the USGS streamflow gate (Figure 3.1). Gaviota Creek Fish Passage and Geomorphic Assessment Page 11 of 55 Michael Love & Associates March 15, 2007
Flow Duration CurveGaviota Creek at USGS Gage 11120550
0.01
0.10
1.00
10.00
100.00
0% 10% 20% 30% 40% 50% 60% 70% 80% 90% 100%
% of time discharge is equalled or exceeded
Dis
char
ge (c
fs)
Contributing drainage areas of the plotted station is 18.80 mi2. Record length is 20 years
Figure 3.1 - Annual Flow Duration Curve for Gaviota Creek at Gaviota (USGS Gage 11120550).
NOAA Fisheries and CDFG guidelines recommend providing suitable steelhead passage conditions between the 50% and 1% exceedance flows. If the 50% exceedance flow is less than 3 cfs, then the low fish passage flow is set at 3 cfs (Table 3.3). Based on the flow duration curve, the desired lower and upper passage flows for adult steelhead in the Gaviota Creek study reach are 3 cfs and 115 cfs, respectively (Table 3.4).
Gaviota Creek Fish Passage and Geomorphic Assessment Page 12 of 55 Michael Love & Associates March 15, 2007

Table 3.3 - Fish passage design flow guidelines from NOAA Fisheries (2001) and CDFG (2002).
Species and Lifestage Low Passage Flow High Passage Flow
Juvenile Salmonids 95% exceedance flow or
1 cfs (whichever is greater) 10% exceedance flow
Adult Resident Rainbow Trout 90% exceedance flow or
2 cfs (whichever is greater) 5% exceedance flow
Adult Anadromous Steelhead 50% exceedance flow or
3 cfs (whichever is greater) 1% exceedance flow
Table 3.4 - Fish passage design flows for Gaviota Creek based on agency guidelines and estimated using the Gaviota Creek flow duration curve.
Species and Lifestage Low Passage
Flows High Passage
Flows Juveniles Salmonids 1.0 cfs 8.1 cfs
Resident Rainbow Trout 2.0 cfs 19.0 cfs Adult Anadromous Steelhead 3.0 cfs 115.0 cfs
Gaviota Creek Fish Passage and Geomorphic Assessment Page 13 of 55 Michael Love & Associates March 15, 2007

GaviotaMichaelMarch
Creek Fish Passage and Geomorphic Assessment Page 14 of 55 Love & Associates
15, 2007
4 Analysis of Fish Migration Barriers Fish passage conditions for 12 concrete grade control structures, one constructed boulder weir, one boulder jam, and a bedrock chute were analyzed for this study. Table 1.1 lists the identification codes and location for each analyzed structure. As shown in the longitudinal profile (Figure 4.1), the grade control structures are located in four distinct clusters, or groups:
1. GA_2 and GA_3 2. BLDR_WEIR, GA_4 to GA_6 3. BR_CHUTE, BLDR_JAM and GA 7 4. GA_8 to GA_13
Within each group there is substantial hydraulic and geomorphic interaction between structures. Therefore, analysis of hydraulic and fish passage conditions was conducted for each group. 4.1 Grade Controls GA2 and GA3
Grade controls GA2 and GA3 are located approximately 500 ft upstream of the southbound Highway 101 rest area. They are constructed of concrete and anchored into sandstone bedrock on the right bank and into sacrete and rip rap along the left bank, which forms the embankment for the highway. GA 2 (Sta 69+50) has a length across the channel of 29 feet, and a width in the streamwise direction of 10 feet (Figure 4.2). The slab thickness is approximately 2 feet and undercut 4.4 feet. The tailwater scour pool created by GA2 is the third largest in the study reach. It is over 100 feet in length and has a residual pool depth of 9.5 feet. A snorkel survey of the pool revealed two southwestern pond turtles. GA 3 (Sta 70+74) is located 125 feet upstream of GA2. GA 3 is 5 feet wide and anchored to the left bank sacrete revetment. (Figure 4.3). The spillway is located on the left bank along the apron of the sacrete wall. The tailwater below GA3 is hydraulically controlled by GA2, forming a 124 feet long pool (Figure 4.5). The pool width is confined by exposed bedrock along the right bank and the road embankment lined with sacrete along the left bank. The pool has a residual depth of 3.8 feet and contains boulders and bedrock is visible in the bottom. The water is slow moving in the pool and fosters a dense growth of cattails and algae during summer months. The upstream channel is characterized by steep drops over well-defined boulder step pools. These step pools are likely created by the channel constriction formed by the highway revetment along the left bank and bedrock outcroppings along the right bank.

Creek Fish Passage and Geomorphic Assessment Page 15 of 55 Love & Associates
2006
Figure 4.1 – Longitudinal Profile of Gaviota Creek Study Reach. 1.45 miles were surveyed from river mile 0.92 (from the ocean) to river mile 2.37.
GaviotaMichaelDecember 15,

4.1.1 Fish Passage Hydraulics for GA2 and GA3 Assessing fish passage conditions over GA2 and GA3 involve determining the water surface drops over each structure at various fish passage flows. To accomplish this, a HEC-RAS model was developed that included grade control structures GA2 and GA3. Model input included surveyed cross sections, the channel slope below the tailwater control (0.017 ft/ft) and an estimate of hydraulic roughness. Mannings roughness (n) of 0.045 was assumed for the reach since the channel is characterized by boulder clusters with dense willow mats and cattail clusters. Model results predict the water surface drop over each grade control weir at typical adult steelhead passage flows and at the no-flow condition (Table 4.1). From 8.1 cfs to 115 cfs GA2 creates a drop of 4.7 ft. At these same flows the drop over GA3 ranges between 2.9 and 3.3 feet. Since the drop height over GA3 is directly influenced by GA2 (Figure 4.6), rising flows reduce the drop height. CDFG and NOAA requirements for water surface drops over grade control structures is 1 foot maximum for adult steelhead and 0.5 feet for resident trout and juvenile salmonids. Under all flow conditions, GA2 and GA3 have substantially greater drop heights. These structures are categorized as RED (impeding passage for all fish) under the CDFG assessment protocol and present a substantial impediment to migrating adult steelhead. Table 4.1 - Water surface drops over GA2 and GA3 at no-flow and typical adult steelhead passage flows.
Water Surface Drop Flow (Exceedance)
Station Feature 0 cfs 8.1 cfs (10%)
19 cfs (5%)
50 cfs (2%)
115 cfs (1%)
69+50 GA 2 4.2 ft 4.6 ft 4.6 ft 4.7 ft 4.7 ft 70+74 GA 3 2.9 ft 3.3 ft 3.2 ft 3.0 ft 2.9 ft
Gaviota Creek Fish Passage and Geomorphic Assessment Page 16 of 55 Michael Love & Associates December 15, 2006

Gaviota Creek Fish Passage and Geomorphic Assessment Page 17 of 55 Michael Love & Associates March 15, 2007
Figure 4.2 – Looking upstream at grade control GA2. The structure is anchored to the sacrete revetment wall (right side of photo) and to exposed bedrock on the other side. The tailwater pool was one of four large pools found in the study reach.
Figure 4.3 – Looking upstream to GA3. Long shallow pool controlled by GA2 gives rise to dense growth of cattails.
GA3

Creek Fish Passage and Geomorphic Assessment Page 18 of 55 Love & Associates
2006
Figure 4.4 – Plan map drawing of the channel reach containing GA2 and GA3.
GaviotaMichaelDecember 15,

Figure 4.5 – Longitudinal profile showing location of grade controls GA2 and GA3 and the tailwater control (TWC) for GA2. (Note: elevations shown are based on arbitrary datum)
4850 4900 4950 5000 5050 5100 5150 5200116
118
120
122
124
126
128
130
132
Gaviota Creek Geom: GA 2,3
Channel Distance from Ocean (ft)
Ele
vatio
n (f
t)
Legend
WS 115 cf s (1%)
WS 3 cf s
Ground
GA 2
GA 3
Boulder clusters and steps with dense willow mats. Sacrete and riprap on banks. n= .045
Figure 4.6 – HEC-RAS results showing water surface profiles for GA2 and GA3 at 3 cfs and 115cfs (note: elevations used in model were based on an arbitrary datum).
Gaviota Creek Fish Passage and Geomorphic Assessment Page 19 of 55 Michael Love & Associates December 15, 2006
4.2 Grade Controls BLDR WEIR, GA4 through GA6
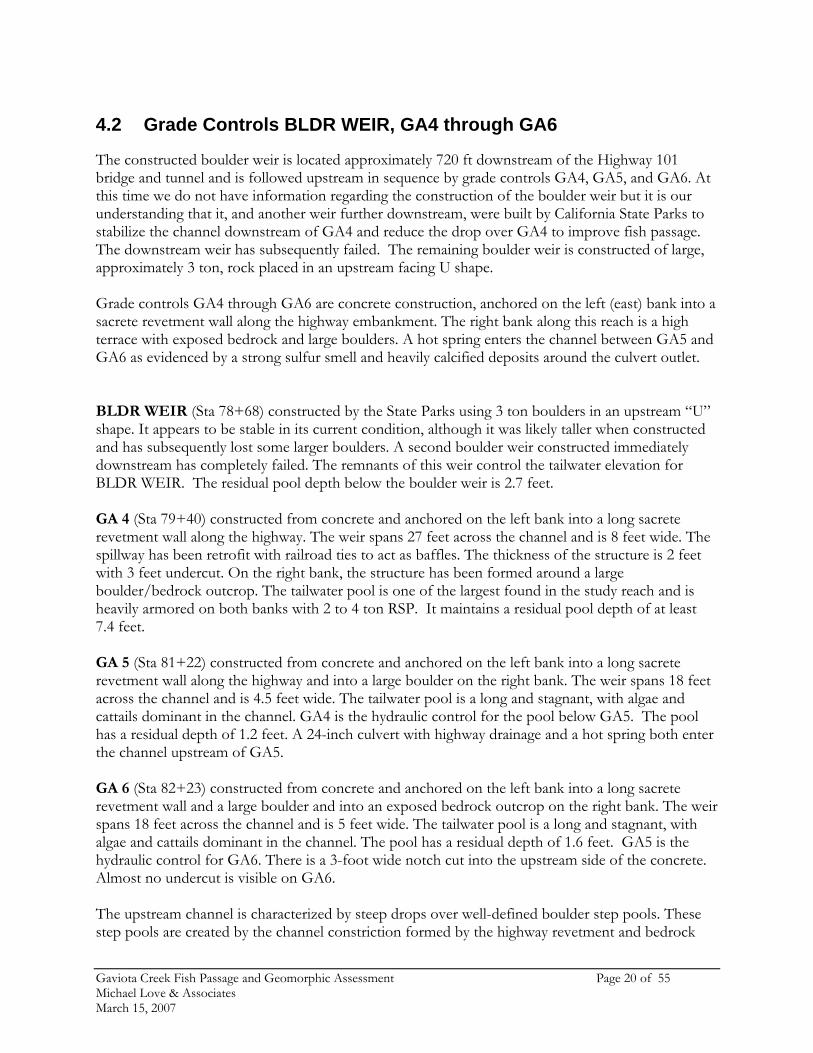
The constructed boulder weir is located approximately 720 ft downstream of the Highway 101 bridge and tunnel and is followed upstream in sequence by grade controls GA4, GA5, and GA6. At this time we do not have information regarding the construction of the boulder weir but it is our understanding that it, and another weir further downstream, were built by California State Parks to stabilize the channel downstream of GA4 and reduce the drop over GA4 to improve fish passage. The downstream weir has subsequently failed. The remaining boulder weir is constructed of large, approximately 3 ton, rock placed in an upstream facing U shape. Grade controls GA4 through GA6 are concrete construction, anchored on the left (east) bank into a sacrete revetment wall along the highway embankment. The right bank along this reach is a high terrace with exposed bedrock and large boulders. A hot spring enters the channel between GA5 and GA6 as evidenced by a strong sulfur smell and heavily calcified deposits around the culvert outlet. BLDR WEIR (Sta 78+68) constructed by the State Parks using 3 ton boulders in an upstream “U” shape. It appears to be stable in its current condition, although it was likely taller when constructed and has subsequently lost some larger boulders. A second boulder weir constructed immediately downstream has completely failed. The remnants of this weir control the tailwater elevation for BLDR WEIR. The residual pool depth below the boulder weir is 2.7 feet. GA 4 (Sta 79+40) constructed from concrete and anchored on the left bank into a long sacrete revetment wall along the highway. The weir spans 27 feet across the channel and is 8 feet wide. The spillway has been retrofit with railroad ties to act as baffles. The thickness of the structure is 2 feet with 3 feet undercut. On the right bank, the structure has been formed around a large boulder/bedrock outcrop. The tailwater pool is one of the largest found in the study reach and is heavily armored on both banks with 2 to 4 ton RSP. It maintains a residual pool depth of at least 7.4 feet. GA 5 (Sta 81+22) constructed from concrete and anchored on the left bank into a long sacrete revetment wall along the highway and into a large boulder on the right bank. The weir spans 18 feet across the channel and is 4.5 feet wide. The tailwater pool is a long and stagnant, with algae and cattails dominant in the channel. GA4 is the hydraulic control for the pool below GA5. The pool has a residual depth of 1.2 feet. A 24-inch culvert with highway drainage and a hot spring both enter the channel upstream of GA5. GA 6 (Sta 82+23) constructed from concrete and anchored on the left bank into a long sacrete revetment wall and a large boulder and into an exposed bedrock outcrop on the right bank. The weir spans 18 feet across the channel and is 5 feet wide. The tailwater pool is a long and stagnant, with algae and cattails dominant in the channel. The pool has a residual depth of 1.6 feet. GA5 is the hydraulic control for GA6. There is a 3-foot wide notch cut into the upstream side of the concrete. Almost no undercut is visible on GA6. The upstream channel is characterized by steep drops over well-defined boulder step pools. These step pools are created by the channel constriction formed by the highway revetment and bedrock
Gaviota Creek Fish Passage and Geomorphic Assessment Page 20 of 55 Michael Love & Associates March 15, 2007

wall at the top of this reach, near the narrow Gaviota Pass. Many of the extremely large boulders appear to be colluvium from the hill slope, and not transported by the stream. The constrictions create small marshy areas upstream of each boulder step. 4.2.1 Fish Passage Hydraulics for Boulder Weir through GA6 Assessing fish passage conditions over the boulder weir and GA4, GA5 and GA3 involve determining the water surface drops over each structure at various fish passage flows. A HEC-RAS model was developed for this reach and model input included surveyed cross sections, the channel slope below the tailwater control (0.004 ft/ft) and an estimate of hydraulic roughness. Mannings roughness (n) of 0.05 was assumed for the reach since the channel is characterized by boulder clusters with dense willow mats and cattail clusters. Model results predict the water surface drop over each grade control weir at typical adult steelhead passage flows and at the no-flow condition (Table 4.2). With the exception of the boulder weir, the drop heights over each of the grade control structures is controlled by the next downstream structure (Figure 4.12). From 8.1 cfs to 115 cfs the boulder weir maintains a drop of 1.3 ft, and GA4, GA5 and GA6 have average drop heights of 5.0 ft, 3.3 ft and 2.2 ft, respectively. CDFG and NOAA requirements for water surface drops over grade control structures is 1 foot maximum for adult steelhead and 0.5 feet for resident trout and juvenile salmonids. Under all flow conditions, these four grade controls have substantially greater drop heights. These structures are categorized as RED (impeding passage for all fish) under the CDFG assessment protocol and present a substantial impediment to migrating adult steelhead. Table 4.2 - Water surface drop for fish passage flows at the BLDR WR, GA4, GA5, and GA6 from HEC-RAS model results.
Water Surface Drop Flow (Exceedance)
Station Feature 0 cfs 8.1 cfs (10%)
19 cfs (5%)
50 cfs (2%)
115 cfs (1%)
78+68 BLDR WR 1.7 1.3 1.3 1.3 1.3 79+40 GA 4 5.2 5.1 5.0 4.9 4.8 81+22 GA 5 3.5 3.4 3.3 3.2 3.0 82+23 GA 6 2.3 2.3 2.2 2.1 2.0
Gaviota Creek Fish Passage and Geomorphic Assessment Page 21 of 55 Michael Love & Associates March 15, 2007

Figure 4.7 – Looking upstream at GA4, which is controlled by a boulder weir constructed by CA State parks. GA4 is undercut approximately 3 ft and the banks and pool are scoured and have been reinforced by large rock placed along the highway revetment.
Hot Spring
Figure 4.8 – Grade control GA5 located 80 ft upstream of GA4. Note the 36-inch highway drainage culvert and hot spring outlet located at the top of sacrete revetment wall.
Gaviota Creek Fish Passage and Geomorphic Assessment Page 22 of 55 Michael Love & Associates March 15, 2007
GaviotaMichaelMarch
Creek Fish Passage and Geomorphic Assessment Page 23 of 55 Love & Associates
15, 2007
Figure 4.9 – Grade control GA6 located 90 ft upstream of GA5.

Creek Fish Passage and Geomorphic Assessment Page 24 of 55 Love & Associates
2006
Figure 4.10 – Plan map drawing of the channel reach containing BOULDER WEIR, GA4, GA5, and GA6.
GaviotaMichaelDecember 15,

Figure 4.11 – Longitudinal profile showing location of the constructed boulder weir (BLDR_WR), grade controls GA4, GA5 and GA6, and the tailwater control (TWC) below the boulder weir. (Note: elevations shown are based on arbitrary datum)
7800 7900 8000 8100 8200 8300 8400135
140
145
150
155
160
Gaviota Creek Geom: GA 4,5,6
Channel Distance from Ocean (ft)
Ele
vatio
n (f
t)
Legend
WS 115 cf s (1%)
WS 3 cf s
Ground
Constructed boulder weir at end of reach. Boulder constrictions and steps with dense cattails. Bedrock and Sacrete on banks. n= 0.050
BLDR WEIR
GA 6
GA 5
GA 4
Figure 4.12 – HEC-RAS results showing water surface profiles for the constructed boulder weir, GA4, GA5, and GA6 at 3 cfs and 115cfs. Note the drop over each grade control is influenced by the next one downstream. (Note: elevations in model are based on arbitrary datum)
Gaviota Creek Fish Passage and Geomorphic Assessment Page 25 of 55 Michael Love & Associates December 15, 2006

4.3 BR_Chute, BLDR_JAM and GA7
Bedrock chute (BR_CHUTE) between Sta. 91+16 and Sta. 95+38 was identified in the previous steelhead passage inventory and assessment (Stoecker, 2002) as a potential impediment to migrating steelhead. It is a 360 feet long section of channel that consist of a bedrock channel bed and left (east) bank (Figure 4.13). The right bank consists of a vertical concrete retaining wall. The bedrock channel through this section maintains an average slope of 3.7%. Within this section there are numerous bedrock steps and at the time of the survey in early October there were 6 pools that had water depths exceeding 1.5 feet. Boulder Jam (BLDR_JAM) at Sta. 95+55, is formed by a cluster of about six large boulders that range in size between 5 and 10 feet in diameter, mixed with a number of smaller boulders (Figure 4.14). The boulder jam retains upstream alluvial bed material, forming the transition from a bedrock to alluvial bed channel. The streambed on the upstream side of the boulder jam is roughly 8 feet higher than the downstream bedrock channel bed. The left (east) most boulder is the largest and is partially held in place by the upstream end of a concrete retaining wall. Additionally, there is rebar doweled into the boulder that is connected to the retaining wall. Immediately upstream of the boulder is a 90 inch diameter corrugated metal culvert outlet for a tributary the drains a 0.7 mi2
watershed. Flow has scoured the right bank creating a low-flow side channel with several steps and a pool. GA7 at Sta. 98+02 is a 4 feet wide by 2 feet thick concrete beam that spans the channel (Figure 4.15). It is 48 feet long and is skewed at roughly a 45-degree angle to the channel centerline. GA7 has an 80 ft long shallow pool and a 4 ft drop. The residual pool depth below GA7 is 2.0 feet. The grade control is undercut by more than 7 feet. It appears that this structure was originally constructed to protect a now-abandoned pipeline crossing (observed embedded in the concrete) from scour, which explains the skew to the channel alignment. 4.3.1 Fish Passage Conditions for Bedrock Chute, Boulder Jam, and GA7 Bedrock chute (BR_CHUTE) contains numerous hydraulic roughness elements, pools spaced an average of 60 feet apart, and the slope of the bedrock chute is no steeper than the downstream channel. The complexity of the channel bed makes it extremely difficult to model the fish passage hydraulics. However, because of its similarity to the adjacent channel, the bedrock chute appears to be no more of a impediment to upstream migration than the natural step pool and boulder cascade channel reaches downstream. Boulder Jam (BLDR_JAM) contains a low-flow channel along the right bank. These types of side channels are frequently present in large boulder and log jams and can provide sufficient conditions to allow upstream steelhead passage under certain flow conditions. Because of the hydraulic complexity associated with these types of structures, passage assessment is typically based on professional judgment and monitoring.
Gaviota Creek Fish Passage and Geomorphic Assessment Page 26 of 55 Michael Love & Associates March 15, 2007

The bottom end of the channel along the right side of the boulder jam contains a 2 ft to 3 ft drop onto sloping bedrock which does not contain a pool for steelhead to leap from. It is our professional judgment that steelhead are only capable of swimming through the passageway along the right (west) bank at moderate to high flows and that the jam is a barrier at both low flows (due to lack of a jump pool) and extremely high flows (due to velocity and turbulence in the side channel). Boulder jams are transitory, and will typically break-apart and reform during large flood events. Additionally, side channels typically evolve and become larger over time, improving passage conditions. However, since it was assessed in 2001, there has been little change to the shape and condition of the boulder jam. GA7 was modeled using FishXing 3.0, software intended for the analysis of fish passage through stream crossings. The grade control structure was treated as a short box culvert and the drop over the structure was analyzed at various fish migration flows. The water surface drop over GA7 ranged from 4.1 feet at zero flow to 3.2 at the adult steelhead high passage flow of 115 cfs. (Table 4.3).
Tunnel
Figure 4.13 – Looking downstream at bedrock chute (BR_CHUTE), with tunnel of northbound Highway 101 in background. Note the bedrock banks on left and vertical concrete retaining wall forming right bank.
Gaviota Creek Fish Passage and Geomorphic Assessment Page 27 of 55 Michael Love & Associates March 15, 2007

Figure 4.14 – Looking upstream at boulder jam (BLDR_JAM), located at upstream end of bedrock chute. The right boulder is secured to concrete retaining wall with rebar. There is a small channel around the jam on the left side of photo that adult steelhead can likely ascend during moderate to high flows. Lack of a leap pool at the base of the side channel makes it a barrier at low flows.
Figure 4.15 – GA 7 is skewed at a 45-degree angle with the centerline of the channel. It is likely that this structure was built to protect a now- abandoned pipe that is visible in parts of the structure.
Gaviota Creek Fish Passage and Geomorphic Assessment Page 28 of 55 Michael Love & Associates March 15, 2007

Figure 4.16 – Plan map drawing of the channel reach containing GA7
Gaviota Creek Fish Passage and Geomorphic Assessment Page 29 of 55 Michael Love & Associates December 15, 2006

Figure 4.17 – Longitudinal profile showing location of the bedrock chute, boulder jam (BLDR JAM), and grade control GA7.
Table 4.3 - Water surface drop for fish passage flows at the GA7 from FishXing model results.
Water Surface Drop Flow (Exceedance)
Station Feature 0 cfs 8.1 cfs (10%)
19 cfs (5%)
50 cfs (2%)
115 cfs (1%)
98+02 GA 7 4.1 3.9 3.7 3.5 3.2
Gaviota Creek Fish Passage and Geomorphic Assessment Page 30 of 55 Michael Love & Associates December 15, 2006

4.4 Grade Controls GA8 through GA13
The most upstream group of grade control structures in the study reach is GA8 through GA13. Located approximately 2,500 feet upstream of the Highway 101 bridge and tunnel, they are grouped in series along a 700 feet reach of channel. Grade controls GA 8-13 are concrete construction and located in series anchored on the right bank into a sacrete revetment wall that runs along the southbound highway embankment. The left bank along this reach is an incised high terrace of native material with occasional large boulder exposures. The channel immediately downstream of GA8 is characterized by a boulder field with cascades stepping up to the grade control. The boulder cascades appear to be a depositional feature caused by a channel constriction created by a 25ft high concrete wall on the left bank and exposed bedrock and large boulders on the right bank. Exposed bedrock is visible in the channel and along both banks. GA 8 (Sta 111+76) constructed from concrete and anchored into large mid channel boulder. GA8 appears to be a concrete apron poured over an existing boulder cluster. It is less than 1 ft thick, is undercut approximately 4 ft and appears to be failing. The downstream pool is controlled by boulders and has a residual depth of 1.4 feet. Fines and small gravels are stored behind GA8 and cattails are abundant in the long shallow pool between GA8 and GA9. GA 9 (Sta 112+50) and GA 10 (Sta 113+71) are concrete weirs that span the channel. GA 9 is 10 feet wide and GA10 is 3 feet wide. They are both 30 feet long across the channel. A 4 ft x 4 ft concrete box culvert stamped 1931 enters the channel on the right bank between GA9 and GA10. Both of these structures do not appear to have much undercut on the downstream side. Both are anchored on the right bank to the sacrete revetment and on the left bank to native material. GA10 is failing along the left bank by flanking around the concrete structure and eroding the bank. The channel upstream is a low gradient depositional section with sand and small gravels, and abundant cattails. The residual pool depth below GA9 and GA10 are 3.8 feet and 2.5 feet, respectively. GA 11 (Sta 114+56) Constructed of concrete and anchored into the sacrete revetment on the right bank and a boulder cluster that is keyed into exposed bedrock on the left bank. GA11 spans 21 feet across the channel and is 3 feet wide. The pool below GA11 is relatively deep, with a residual pool depth of 4.2 feet. GA 12 (Sta 115+76) is anchored to the sacrete revetment on the right bank and to a large exposed boulder on the left bank. There is a well-defined tailwater pool created by the drop over GA12. The pool has a residual depth of 3.9 feet. The downstream channel between GA11 and GA12 is low gradient and populated by large boulders. The channel upstream of GA12 is a bedrock chute that completely spans the channel. It is roughly 60 feet long, and forms the tailwater control for GA13. GA 13 (Sta 117+46) located at the upper most end of the study reach. GA 13 is a concrete slab that is 1-2 ft thick and undercut approximately 5 ft. It is anchored to the sacrete wall and a large exposed boulder. There is ample evidence of scour from high flows. The residual drop is approximately 3
Gaviota Creek Fish Passage and Geomorphic Assessment Page 31 of 55 Michael Love & Associates March 15, 2007

feet and plunges into a large tailwater pool that has a residual depth of 3.7 feet. The pool elevation is controlled by the bedrock chute immediately downstream. 4.4.1 GA 8-13 Fish Passage Hydraulics Assessing fish passage conditions over GA8, GA9, GA10, GA11, GA12, and GA13 involve determining the water surface drops over each structure at various fish passage flows. A HEC-RAS model was developed for this reach and model input included surveyed cross sections, the channel slope below the tailwater control (0.047 ft/ft) and an estimate of hydraulic roughness. Mannings roughness (n) of 0.045 was assumed for the reach since the channel is characterized by boulders, willow mats and cattail clusters. Model results predict the water surface drop over each grade control weir at typical adult steelhead passage flows and at the no-flow condition (Table 4.4). With the exception of the GA8 and GA13, the drop heights over each of the grade control structures are controlled by the next downstream structure (Figure 4.24 and Figure 4.25). During fish passage flows (8.1 cfs to 115 cfs) GA8, GA10, GA12 and GA13 create a drop ranging from of 2.0 ft to 4.7 ft. The notable exception is GA9, which is completely backwatered at all fish passage flows, and GA 11, which has a drop of less than 1 ft. CDFG and NOAA requirements for water surface drops over grade control structures is 1 foot maximum for adult steelhead and 0.5 feet for resident trout and juvenile salmonids. GA8, GA10, GA12, and GA13 have drop heights greater than 1 foot at all flows. GA8 and GA13 have the largest drops and are categorized as RED (impeding passage for all fish) under the CDFG assessment protocol. Table 4.4 - Water surface drop for fish passage flows at the GA8, GA9, GA10, GA11, GA12 and GA13 from HEC-RAS model results.
Water Surface Drop Flow (Exceedance)
Station Feature 0 cfs 8.1 cfs (10%)
19 cfs (5%)
50 cfs (2%)
115 cfs (1%)
111+76 GA 8 3.9 4.3 4.1 3.9 3.6 112+50 GA 9 0.3 0.0 0.0 0.0 0.0 113+71 GA 10 1.5 2.1 2.2 2.2 2.1 114+56 GA 11 1.3 0.8 0.7 0.6 0.5 115+76 GA 12 2.1 2.1 2.1 2.2 2.2 117+46 GA 13 5.0 4.7 4.7 4.2 3.7
Gaviota Creek Fish Passage and Geomorphic Assessment Page 32 of 55 Michael Love & Associates March 15, 2007
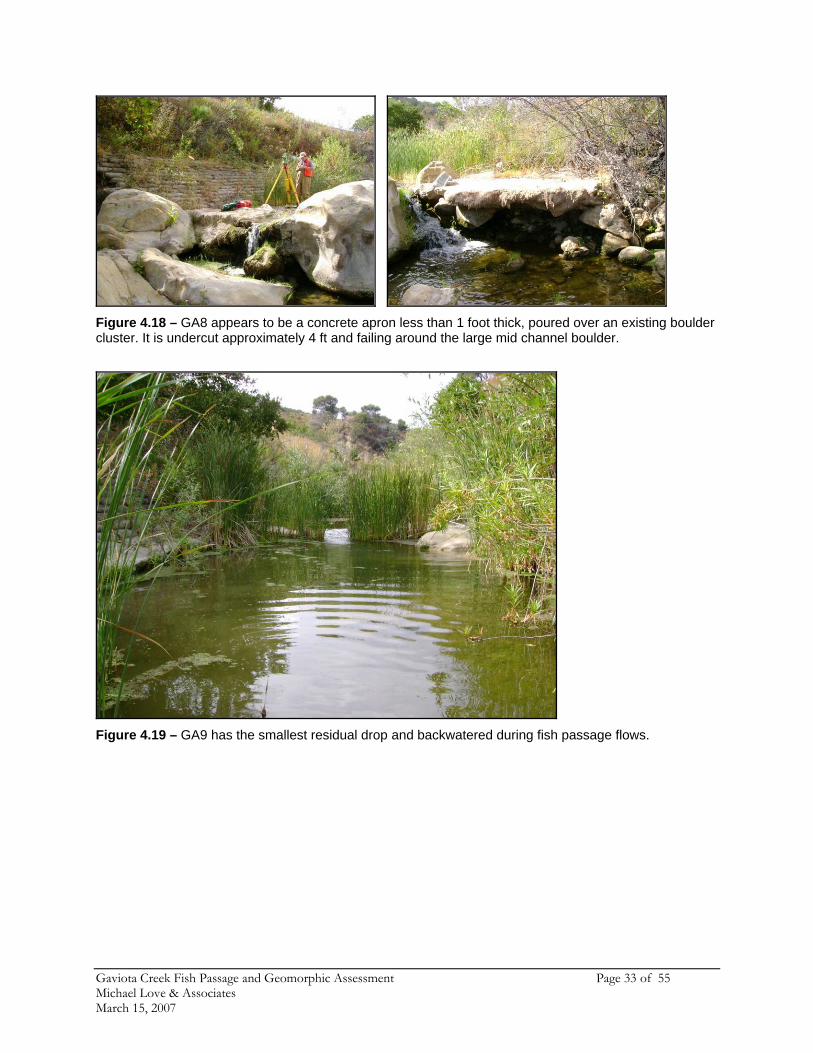
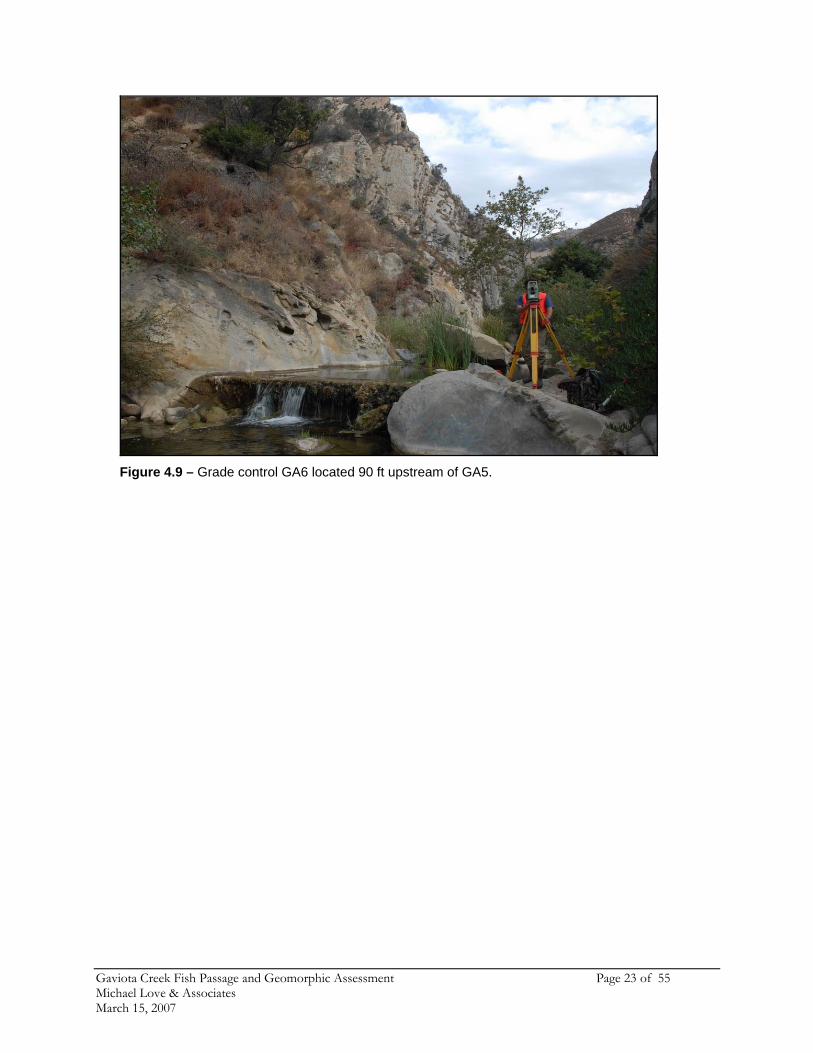
Figure 4.18 – GA8 appears to be a concrete apron less than 1 foot thick, poured over an existing boulder cluster. It is undercut approximately 4 ft and failing around the large mid channel boulder.
Figure 4.19 – GA9 has the smallest residual drop and backwatered during fish passage flows.
Gaviota Creek Fish Passage and Geomorphic Assessment Page 33 of 55 Michael Love & Associates March 15, 2007

Figure 4.20 –GA10 is failing along the river-lealong the steep right bank.
Figure 4.21 – GA11 and GA12 are keyed to s
Gaviota Creek Fish Passage and Geomorphic AsseMichael Love & Associates March 15, 2007
Flows around erodedside of structure
ft bank from flanking that has eroded the native material
acrete and large boulders.
ssment Page 34 of 55

Figure 4.22 - GA13 is keyed into the sacrete wall and large boulders and exposed bedrock. There is ample evidence of scour along the undercut wall and GA13 is undercut approximately 5 ft. The pool elevation is controlled by a bedrock chute the spans the entire width of the downstream channel.
Gaviota Creek Fish Passage and Geomorphic Assessment Page 35 of 55 Michael Love & Associates March 15, 2007

Figure 4.23 – Plan map drawing of the channel reach containing GA 8-13
Gaviota Creek Fish Passage and Geomorphic Assessment Page 36 of 55 Michael Love & Associates December 15, 2006

Figure 4.24 – Longitudinal profile showing location of the GA 8 through GA 13. (Note: elevations shown are based on arbitrary datum)
11000 11200 11400 11600 11800 12000250
255
260
265
270
275
280
Gaviota Creek Geom: GA 8-13
Channel Distance from Ocean (ft)
Ele
vatio
n (f
t)
Legend
WS 115 cf s (1%)
WS 3 cf s
Ground
Boulder field cascades up to grade control. Exposed bedrock chutes in portions of channel. Incised native material and sacrete banks. n= 0.045
GA 13
GA 12
GA 10
GA 11 GA 9 GA 8
Figure 4.25 – HEC-RAS results showing water surface profiles for the constructed GA8, GA9, GA10, GA11, GA12 and GA13 at 3 cfs and 115cfs. (Note: elevations in model are based on arbitrary datum)
Gaviota Creek Fish Passage and Geomorphic Assessment Page 37 of 55 Michael Love & Associates December 15, 2006
4.5 Fish Passage Summary
As discussed in Chapter 3, CDFG first phase filter categorizes a structure as RED if the drop is greater than 2 feet and GRAY if less than 2 feet. CDFG and NOAA design criteria define a drop of 6 inches or less as being suitable for both adult and juvenile salmonids. Therefore, we defined a drop of 6 inches or less as GREEN. The residual drop is the difference between the weir crest and the tailwater control elevations, also referred to as the no-flow drop height. The residual drop over each grade control structure is presented in Table 4.5 in order of severity. Note that the largest drop is generally associated with the most downstream grade control structure within each group.
Table 4.5 – Summary of drop height as applied to fish passage and ordered by severity of barrier.
Grade Control No-Flow
Drop Height CDFG Filter
Category GA4 5.2 feet RED GA13 5.0 feet RED GA2 4.2 feet RED GA7 4.1 feet RED GA8 3.9 feet RED GA5 3.5 feet RED GA3 2.9 feet RED GA6 2.3 feet RED GA12 2.1 feet RED
BLDR WEIR 1.7 feet GRAY GA10 1.5 feet GRAY GA11 1.3 feet GRAY GA9 0.3 feet GREEN
Gaviota Creek Fish Passage and Geomorphic Assessment Page 38 of 55 Michael Love & Associates March 15, 2007

5 Geomorphic Assessment Gaviota Creek flows from north to south, cutting through the Traverse Range of the Santa Ynez Mountains in southwestern Santa Barbara County. Gaviota Creek is unique, since none of the other streams draining the Santa Ynez Mountains from Point Conception to the Ventura River cuts through the Traverse Range. As the creek flows towards the ocean it enters Gaviota Canyon, which becomes increasingly narrow until reaching the “pass”; a location where the canyon is less than 30 feet wide, confined by nearly vertical bedrock cliffs (Figure 5.1). The exposed bedrock throughout the canyon is predominately sedimentary and the horizontal strata have been tilted nearly vertical. The bedrock and large colluvium within the channel is mostly composed sandstone and mudstone. There are also numerous sulfur hot springs surfacing along the canyon walls The channel is geologically incising, apparently accelerated by alterations made to the channel’s alignment, length, and streambank composition as a result of the highway. This incision process and the presence of constructed grade control structures to prevent further incision and bank erosion has lead to numerous steelhead migration barriers through Gaviota Canyon. Therefore, the focus of this geomorphic assessment is on the causes of channel incision and role of the grade control structures in maintaining the existing channel grade. 5.1 History of the Highway and Resulting Changes to the Channel
Even prior to the first road being constructed, bedrock and large colluvium along the stream’s bed and banks constricted the channel. As described by Chesnut (1993), wagons could not go through the pass until 1854, when the cliffs were chiseled to make a wide enough roadway. The first County road through Gaviota Canyon was constructed in 1861. Construction involved the use of dynamite to widen the road at the pass and placing a wooden bridge over the creek near the location of the current bridge. The road was too narrow for wagons to pass one another in numerous locations. The Division of State Highways took ownership of the road in 1915. In 1931 the section of highway through the canyon was reconstructed to accommodate increased traffic. Initially, it was estimated that the highway would need to cross Gaviota Creek nineteen times within the three-mile section running through the canyon. To avoid this, the channel was straightened in places and numerous concrete retaining walls were constructed. 5.1.1 Lower Gaviota Creek Channel Realignment In 1934 a road straightening project between Gaviota and La Honda involved removal of a large meander in lower Gaviota Creek and rerouted the channel along the road embankment, as evident in the 1943 air photo (Figure 5.2). Subsequently, the channel alignment was further altered. In total, changes in channel alignment shortened the channel length by as much as 1,600 feet.
Gaviota Creek Fish Passage and Geomorphic Assessment Page 39 of 55 Michael Love & Associates March 15, 2007

(a)
(b) Figure 5.1 – Looking upstream at the “pass” in Gaviota Canyon, (a) illustrated during an early expedition prior to the first road (from Chesnut, 1993) and (b) under present conditions, with the southbound 101 bridge crossing the creek. Note the overhanging bedrock formation in the upper left in both images.
Gaviota Creek Fish Passage and Geomorphic Assessment Page 40 of 55 Michael Love & Associates March 15, 2007
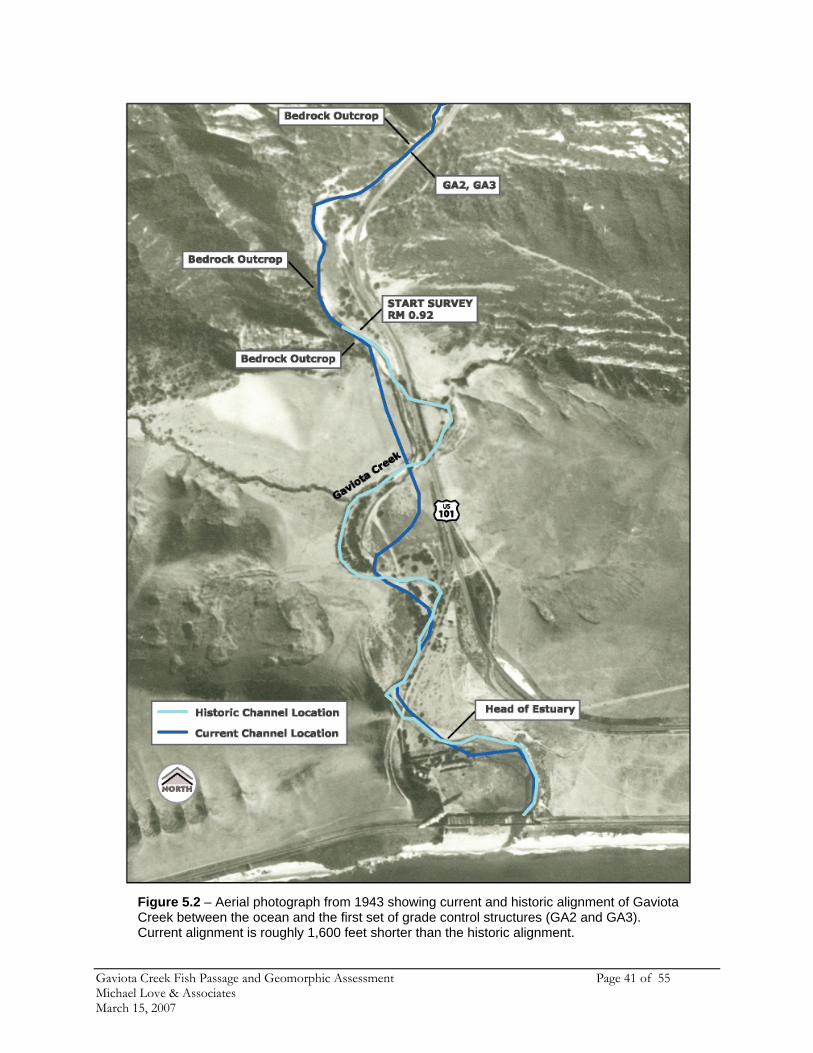
Figure 5.2 – Aerial photograph from 1943 showing current and historic alignment of Gaviota Creek between the ocean and the first set of grade control structures (GA2 and GA3). Current alignment is roughly 1,600 feet shorter than the historic alignment.
Gaviota Creek Fish Passage and Geomorphic Assessment Page 41 of 55 Michael Love & Associates March 15, 2007

GaviotaMichaelMarch
Creek Fish Passage and Geomorphic Assessment Page 42 of 55 Love & Associates
15, 2007
Shortening the channel length would initially result in a steepening of the overall grade. An expected channel response within this previously unconfined reach would be headward incision of the channel bed, decreasing the slope back to its historic grade within the realigned reach. Although the realigned reach was not surveyed as part of this project, we estimate it has an average channel slope of roughly 0.5%. This was based on:
1. Current channel length from the upstream end of the realignment to the estuary,
2. The surveyed elevation at the upstream end of the realigned channel (where this projects survey began), and
3. Assuming the channel bed is near mean sea level at the upstream end of the estuary. Based on a loss of 1,600 feet of channel length and a channel slope of 0.5%, the upstream channel may have experienced up to 8 feet of incision. Incision of the upstream channel bed appears to be partially controlled by exposed bedrock in two distinct locations (Figure 5.5) and possibly by the lower two grade control structures (GA2 and GA3). 5.2 Channel Morphology
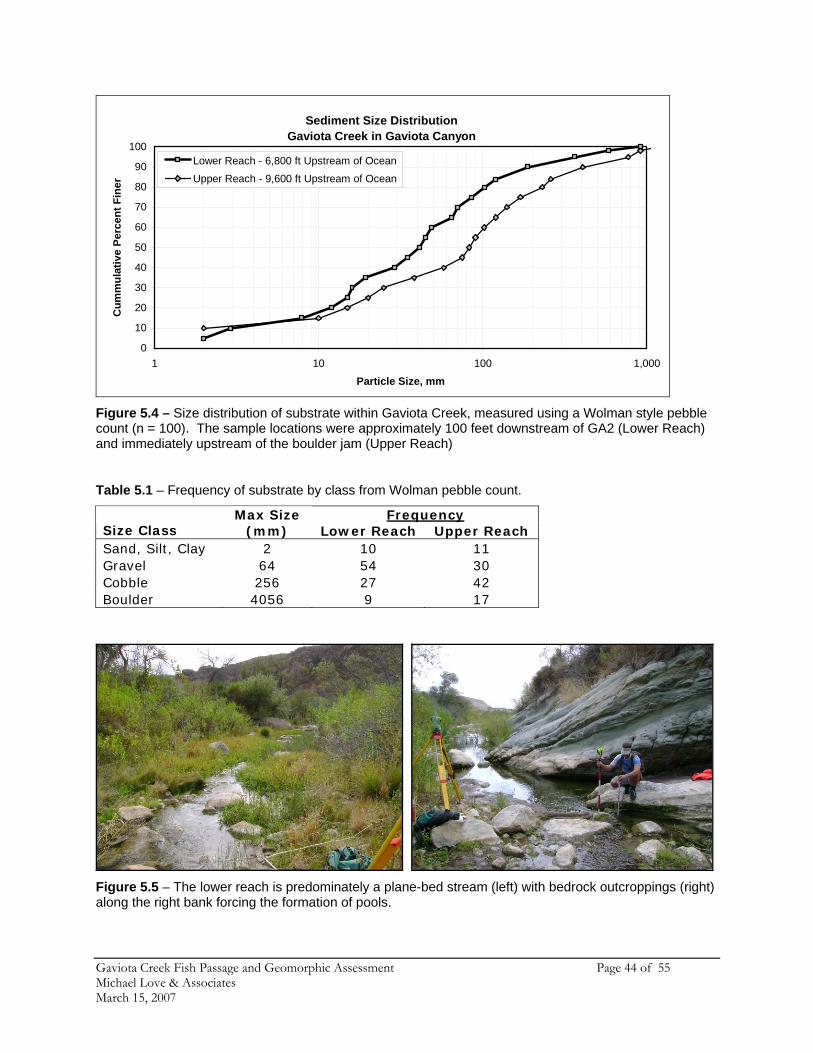
The surveyed channel reach begins 2,200 feet downstream of the first grade control structure (GA2) and extends through the confined sections of Gaviota Canyon to the second southbound 101 bridge crossing, for a total distance of 7,700 feet (Figure 5.3). From GA2 to the second bridge, the channel maintains a steep grade and the channel bed and banks are controlled by a combination of large colluvium, boulder jams, bedrock outcroppings, concrete grade control structures, hardened road embankments, and concrete retaining walls. To assist in defining the existing geomorphic channel characteristics and describing the channel interactions associated with the existing grade control structures, we have categorized the surveyed channel into three reaches: Lower, Middle, and Upper. 5.2.1 Lower Channel Reach The lower surveyed channel reach begins at the upstream end of the realigned channel (Sta. 48+50) and continues to the base of the boulder weir (BLDR_WEIR) just downstream of grade control structure GA_4 (Sta. 78+00). The reach is 2,950 feet in length and has an average channel slope of 1.3%. A Wolman pebble count was conducted within the reach, just downstream of GA_2, to help classify the surface substrate (Figure 5.4). The substrate is alluvial and the predominate material is gravel (54%), followed by cobble (27%). The reach also contains some large boulders (>3 feet diameter) and sand (Table 5.1). This lower channel reach lacks rhythmic bedforms and is characterized by long stretches of relatively featureless bed. Using the Montgomery and Buffington classification system (1997), the morphology of the lower reach can best be described as a plane-bed alluvial channel. Throughout the entire reach the right bank of the stream is confined by the hill slope to the west. In several distinct locations bedrock outcroppings protrude into the channel, controlling the grade and forcing pools to form immediately downstream.

Creek Fish Passage and Geomorphic Assessment Page 43 of 55 Love & Associates
2006
Figure 5.3 – Longitudinal Profile of Gaviota Creek Study Reach. 1.45 miles were surveyed from river mile 0.92 (from the ocean) to river mile 2.37.
GaviotaMichaelDecember 15,
Sediment Size DistributionGaviota Creek in Gaviota Canyon
0
10
20
30
40
50
60
70
80
90
100
1 10 100 1,000
Particle Size, mm
Cum
mul
ativ
e Pe
rcen
t Fin
er
Lower Reach - 6,800 ft Upstream of Ocean
Upper Reach - 9,600 ft Upstream of Ocean
Figure 5.4 – Size distribution of substrate within Gaviota Creek, measured using a Wolman style pebble count (n = 100). The sample locations were approximately 100 feet downstream of GA2 (Lower Reach) and immediately upstream of the boulder jam (Upper Reach)
Table 5.1 – Frequency of substrate by class from Wolman pebble count.
Frequency Size Class
Max Size (mm) Lower Reach Upper Reach
Sand, Silt, Clay 2 10 11 Gravel 64 54 30 Cobble 256 27 42 Boulder 4056 9 17
Figure 5.5 – The lower reach is predominately a plane-bed stream (left) with bedrock outcroppings (right) along the right bank forcing the formation of pools.
Gaviota Creek Fish Passage and Geomorphic Assessment Page 44 of 55 Michael Love & Associates March 15, 2007

Within the lower 2,000 feet of the reach the left (east) bank is relatively unconfined with a large active point bar separating the channel from the highway. The bar consists of large cobbles and contains a high-flow scour channel. Beginning at the first grade control the channel becomes highly confined by the valley wall along the right bank and hardened highway embankment along the left bank. Likely the historic stream alignment was to the east, where the highway is currently located. Influence of Grade Control Structures within Reach The downstream end of the lower channel reach was undoubtedly affected by the channel realignment that occurred in the 1930’s. The shortening of the downstream channel by as much as 1,600 feet may have resulted in up to 8 feet of channel incision. Bedrock outcrops within the reach likely help to control the grade and reduced the upstream extend of incision. However, it is likely that the drop over the first two grade control structures (GA2 and GA3) is partially a result of channel incision occurring due to the downstream realignment combined with constriction of the channel from the road embankment. The residual drop over GA2 is 4.2 feet, created by a combination of headward incision and localized scour from plunging flow over the weir. The scour pool is more than 100 feet long and is over 10 feet deep. The length of the scour pool, which consists of a flat rather than sloping water surface, is responsible for as much as 1.3 feet of the drop height over GA2. 5.2.2 Middle Channel Reach The middle reach begins below the constructed boulder weir (BLD_WEIR) at Sta. 78+00 and ends immediately downstream of the boulder jam (BLDR_JAM) at Sta. 95+25. The average channel slope through this reach is 4.0% and the channel is highly constricted by both the canyon walls and the highway embankments. The channel reach includes boulder cascades, boulder step-pools, and a bedrock chute (Figure 5.6). Lower Section (from Boulder Weir to GA6) At the beginning of the middle reach there is a series of four grade controls: the boulder weir, GA4, GA5 and GA6. Throughout this section of channel the left bank is composed of sacrete along the sloping road embankment. From the boulder weir upstream to GA5 the right bank is composed of a nearly vertical 10 to 15 feet tall bank along a large alluvial that appears to be highly erosive. From GA5 to upstream of GA6 the right bank is composed of bedrock. The active channel width through this section is relatively consistent, at 35 feet. Within this roughly 550 feet section of channel the bed is completely controlled by the grade control structures, with long pools formed between each one. The bed composition within the pools range from sand and silt to boulder size substrate. Mid Section (from GA6 to 101 bridge at Gaviota Pass) Upstream of GA6, from Sta. 82+60 to Sta. 85+60, the channel morphology becomes dominated by large colluvial boulders (up to 18 feet diameter) within the channel. The right bank is vertical bedrock and the left bank is a combination of colluvial large boulders and sacrete armoring the road embankment. The stream consists of boulder steps and two large pools. This 300 feet long section maintains an average slope of 3.0% and an active channel width of 35 feet. From historic photographs of the Gaviota Pass, it appears this reach has not changed significantly since the construction of the highway. Gaviota Creek Fish Passage and Geomorphic Assessment Page 45 of 55 Michael Love & Associates March 15, 2007

(a) (b)
(c) (d)
Figure 5.6 – Middle reach, from downstream to upstream, consists of (a) four grade controls with long pools in-between, followed by sections of large boulder step-pools and cascades (b and c), and a constricted bedrock channel (d).
Upper Section (101 bridge at Gaviota Pass to Bedrock Chute) Immediately downstream of the southbound Highway 101 bridge at the Gaviota Pass the channel morphology is a steep boulder cascade with an average active channel width of about 40 feet. Throughout this 535 feet long section (Sta. 85+60 to 90+95) the average channel slope is 4.6%. The bridge does not appear to further constrict the channel width, which is naturally constricted by the bedrock and boulders. Once upstream of the bridge the left and right banks are constricted by vertical concrete retaining walls that rest on bedrock. Channel width average 40 feet and the bed morphology is a combination of cascades and boulder forced step pools.
Gaviota Creek Fish Passage and Geomorphic Assessment Page 46 of 55 Michael Love & Associates March 15, 2007
Bedrock Chute to Boulder Jam From Sta. 90+95 to Sta. 95+40 the bed of the channel consists of relatively flat bedrock. Although the right bank continues to be defined by a vertical concrete retaining wall, the left bank becomes bedrock and the channel width narrows slightly. The average slope through this bedrock section is 3.8%. The end of this section is distinguished by a large boulder jam and change in the morphology of the channel bed and banks. Influence of Grade Control Structures within Middle Reach As evidenced by the thickness and undercutting of the grade controls, GA4 through GA6 were likely originally constructed at, or slightly above the grade of the streambed. As with the other groups of grade control structures, all of the drop in grade through this channel section occurs at the grade controls. Although grade is controlled by boulder cascades and steps within the channel immediately upstream of GA4 through GA6, the grade control structures have scoured the channel below each drop, preventing the formation of boulder steps or cascades between the grade controls. Within the shallow pools between each grade control there are numerous boulders that could help maintain the channel grade if the grade control structures were removed. However, removal of these grade controls may result in localized failure of the sacrete armored highway embankment if action was not taken to stabilize them. 5.2.3 Upper Channel Reach The upper reach begins at the boulder jam (BLDR_JAM) at Sta. 95+25 and ends at the bridge crossing on southbound Highway 101, at Sta. 122+85 near the end of the surveyed longitudinal profile. The reach length is 2,760 feet and the average channel slope is 2.4%. Northbound Highway 101 lane is adjacent to the left (east) bank and southbound traffic travels adjacent to the right bank. In addition to the boulder jam, there are 7 concrete grade control structures within the reach. The reach has two distinct sections: from the boulder jam to GA8 and from GA8 to the Highway 101 bridge. Throughout the entire reach the channel is highly incised and constricted by bedrock outcrops, hardened highway embankments, and vertical retaining walls. The channel includes boulder cascades, bedrock dominated step-pools, and long glides. (Figure 5.7). Lower Section (from Boulder Jam to GA8) The transition from the middle to upper reach is distinguished by a change from a bedrock to an alluvial channel bed, which occurs at a large boulder jam at Sta. 95+25. The boulder jam retains alluvial material, creating a 6 feet rise in the channel bed. From the boulder jam to GA8 at Sta. 111+60 the channel morphology consists of an alluvial bed with a repeating sequence of boulder steps and cascades followed by long glides, or shallow pools. This 1,635 feet section of channel maintains an average slope of 2.7% and an average active channel width of 30 feet. This section of channel is straight and the banks are confined by the highway embankments. For roughly 800 feet, from the boulder jam to Sta. 103+30, the left (east) bank consists of the highway embankment. The embankment slopes at approximately 1H:1V and is armored with sacrete and rip rap. Between Sta. 104+50 and 110+00 the right (west) bank consist of a 540 feet long by 25 feet tall vertical concrete retaining wall. The remaining 160 feet of the channel section has rip rap armoring the right bank. Gaviota Creek Fish Passage and Geomorphic Assessment Page 47 of 55 Michael Love & Associates March 15, 2007

(a) (b)
(d) (c)
Figure 5.7 - Upper reach, from downstream to upstream, consists of (a) boulder steps and boulder cascades followed by long glides, highly confined banks due to the proximity of the highway (b and c), followed by a section of channel bed controlled by bedrock (d) and concrete grade control structures.
To help characterize substrate within this lower section of the Upper Reach, a Wolman pebble count was conducted upstream of the bolder jam. Sampled substrate was 42% cobble, followed by gravel and then boulders (Table 5.1). Upper Section (from GA8 to Highway 101 Bridge) The upper section begins at grade control GA8 at Sta. 111+60 and continues to the Highway 101 bridge crossing at Sta. 122+85. This 1,125 feet section of channel maintains an average slope of 1.9% and is distinguished by six concrete grade control structures and several bedrock exposures. With the exception of one short section a bedrock, the right (west) bank consists completely of a
Gaviota Creek Fish Passage and Geomorphic Assessment Page 48 of 55 Michael Love & Associates March 15, 2007

1H:1V sloping sacrete armored road embankment. The left bank is primarily exposed bedrock from GA8 through GA13. At Sta. 118+60 to the Highway 101 bridge the left bank consist of a straight 400 feet long section of sloping sacrete embankment. For GA9 through GA12 the drop height is controlled by the next downstream grade control. The result is long pools between each grade control. Within the pools are some large boulders mixed with smaller substrate. Influence of Grade Control Structures within Reach
Boulder Jam The boulder jam, which is partially held in place by the concrete retaining wall along the left bank and rebar dowelled into the left boulder, is the most substantial grade control feature surveyed as part of this study. It may possibly prevent the upstream channel from scouring to bedrock, as is the case downstream of the boulder jam. If the jam breaks apart, there is potential for substantial incision of the upstream channel bed. There is a well-defined channel around the side of the jam that appears suitable for adult steelhead passage at moderate to high flows. Modification should be considered to improve low-flow passage conditions by creating a pool at the base of the side channel. Grade Control GA7 GA7 has an 80 ft long pool and a 4 ft drop. When accounting for the overall slope within this section of channel, the length of the pool accounts for roughly 2 feet of the total drop height. If this grade control was removed there appears to be ample boulders within the channel immediately upstream that would prevent upstream channel incision. Furthermore, it appears that this structure was originally constructed to protect a now abandoned pipeline crossing, and was not intended as a grade control structure. Grade Control GA8 GA8 consists of concrete poured around an existing boulder step, and bedrock was found to be spanning the channel 40 feet upstream. Although some localized problems with the stability of the sacrete embankment may occur if GA8 was returned to a natural boulder step, headward erosion and incision does not appear to be a concern. Grade Controls GA9 through GA12 At the bottom of the pool below GA12 there is bedrock spanning the channel bed, as well as being just downstream of GA9. There is also a bedrock chute between GA12 and GA13. Due to the presence of bedrock throughout much of the reach, removal of GA9 through GA12 would likely only result in relatively minor changes in the channel bed elevation. Removal of GA12 would result in the channel incising down to bedrock between Sta. 115+67 and 116+35. This would likely increase the length of the bedrock reach from about 50 feet to 120 feet and cause some localized stability problems with the sacrete along the right bank. Grade Control GA13 GA13 is located at a bedrock constriction in the channel and appears to be maintaining the upstream channel grade, which is less steep than downstream. Removal of this grade control would
Gaviota Creek Fish Passage and Geomorphic Assessment Page 49 of 55 Michael Love & Associates March 15, 2007

likely cause substantial upstream incision and threaten the stability of the sacrete embankments located along both sides of the creek. 5.3 General Observations
This section gives a larger scale perspective of the entire 6,700 feet of surveyed channel and the geomorphic processes that are occurring. 5.3.1 Rate of Colluvial Inputs within Canyon From the first grade control GA2 to the end of the survey the vast majority of the channel banks are hardened with retaining walls, sacrete, or rip rap. As a result of this bank hardening, there is no signs of bank erosion or recent inputs of colluvial material from the adjacent canyon walls, terraces, or tributaries. Additionally, one of the only sizable tributary to Gaviota Canyon, upstream of the pass, enters the channel through a 90 inch culvert just upstream of the boulder jam. Recently a large “trash rack” above the culvert inlet was added that now traps all large alluvial material. The other large tributary is at the Northbound rest area. It plugged with sediment and debris during recent floods, preventing the larger bedload from routing into Gaviota Creek. Additionally large colluvium that comes down the hillsides from landslides is frequently removed and transported offsite by CalTrans, preventing it from entering the main channel. Upstream of the survey, as the channel leaves the canyon, the hill slopes become more gentle sloping and there is little in the way of large colluvium in the channel. Since recent colluvial inputs are minimal, it is likely that the vast majority of colluvium within the channel entered the channel prior to the construction of the highway and the rate of colluvial input has declines substantially (although upstream sediment supply of fine grain material is high). The possible decrease in rate of colluvial inputs combined with factors, such as channel constriction and realignment, has likely accelerated the incision rate within the canyon and may be partially responsible for the bedrock chute below the boulder jam. Over time the loss of colluvial inputs may cause more of the channel to incise to bedrock, potentially threatening the stability of the existing highway embankments and retaining walls and further impact upstream steelhead passage. 5.3.2 Channel Realignment Channel degradation within the lower reach, from just upstream of GA3 to GA6 appears to be the result of relocating and straightening of the channel. Given the width of the canyon it is possible that the channel was historically located further to the east and was not as straight. Maps and documents showing the historic location of the channel prior to the construction of the highway would be useful in determining the channel reaches that have been relocated and the length of channel that has been lost due to channel straightening and relocation.
Gaviota Creek Fish Passage and Geomorphic Assessment Page 50 of 55 Michael Love & Associates March 15, 2007

6 Recommendations 6.1 Potential Solutions for Improving Fish Passage
The six most challenging grade control structures for upstream passage of adult steelhead are:
Grade Control Structure
No-Flow Drop Height
GA4 5.2 feet GA13 5.0 feet GA2 4.2 feet GA7 4.1 feet GA8 3.9 feet GA5 3.5 feet
The remaining six concrete grade control structures have drops ranging between 2.9 feet and less than 0.5 feet. Improving passage conditions at these six structures is key to improving fish passage through Gaviota Canyon. However, since the structures are located in groups (except for GA7) it is most practical to develop recommendations that address passage for each group. Development of preliminary recommendations for improving passage was approached by considering each of the grade control groups. 6.1.1 GA2 and GA3 As described in Chapter 5, a large proportion of the drop over each of these grade controls is related to the length of the downstream scour pool. The length of the pools below GA2 and GA3 are 100 feet and 124 feet, respectively. The remaining grade maintained by these structures is likely attributed to the channel incision as a result of large scale channel realignment that shortened the channel length by as much as 1,600 feet. Site Scale Approach (1) Leaving Grade Controls In-Place A series of boulder grade control weirs could be used to buildup the downstream channel below GA2 and from GA2 to GA3. To ensure the structural integrity of the boulder weirs, a roughened channel approach (Bates 2003) should be used that armors the bed and banks in between each weir with a mix of imported rock. Drops between weirs should be kept to roughly 6 inches to provide passage for juvenile and resident trout and to effectively dissipate energy. Since the upstream channel maintains an average slope of 4%, it would be reasonable that the weirs be spaced such that the constructed slope is approximately 4%. This would make the reach similar geomorphically and hydraulically to the upstream natural channel. The length of the roughened channels would not need to be any longer than the existing downstream scour pools.
Gaviota Creek Fish Passage and Geomorphic Assessment Page 51 of 55 Michael Love & Associates March 15, 2007

(2) Replace Existing Grade Controls with Constructed Boulder Step-Pool Reach An alternative approach would be to remove the existing grade controls, GA2 and GA3, and construct new grade control in the form of boulder step-pools. The regraded channel section could begin at the existing downstream end of GA2’s scour pool and end near Sta. 71+50 (Figure 6.1), where the channel beings to move away from the highway embankment. Similar to the previous option, the boulder steps should have drops of 6 inches or less and the design should follow typical roughened channel construction techniques. This reach would have an average channel slope of only 2.2%, which would provide an average spacing of 22 feet between boulder steps. Since the slope would only be 2.2%, the stability and fish passage through the regrade channel could be better than the previous option that would require a 4% slope. The stability of the sacrete revetment along the highway embankment could likely be maintained since the channel thalweg (flow-line) would be close to its current elevation.
20
30
40
50
60
70
80
90
67+00 67+50 68+00 68+50 69+00 69+50 70+00 70+50 71+00 71+50 72+00 72+50
Station (ft)
Ele
vati
on
(ft
)
GA2 GA3
Regrade Channel Sta. 68+50 to Sta. 71+50
Ave. Slope = 2.2% for 300 ft
Figure 6.1 – A potential fish passage solution is removal of GA2 and GA3 combined with regrading the channel and constructing stable boulder step-pool morphology between 68+50 and 71+50.
Large Scale Approach Adding length to the downstream channel, where the historic meander was eliminated is a large scale alternative (Figure 5.2). This lower reach of channel has been placed in a ditch along the toe of the highway embankment. To increase the channel length, habitat complexity and riparian canopy, Gaviota Creek could be moved to the west, where a large low alluvial terrace exists. This location would allow for increasing the channel sinuosity and length and would move the channel away from the highway embankment. 6.1.2 GA4 through GA6 Improving steelhead passage at this group of grade control structures may be the most challenging of all. The two boulder weirs that were constructed downstream of GA4 to improve fish passage (one weir failed shortly after construction) appear to have decreased the drop by roughly 2 feet. However, GA4 still maintains the largest drop (5.2 feet) of all 13 grade control structures. The nearly 15 feet tall vertical alluvial right (west) bank appears highly erosive, making it difficult to add additional grade control downstream of GA4 without pulling back the bank to a more gradual slope.
Gaviota Creek Fish Passage and Geomorphic Assessment Page 52 of 55 Michael Love & Associates March 15, 2007

The channel was undoubtedly straightened to some degree between GA3 and GA6. This loss of channel length, and possibly moving the channel into smaller and less consolidated material, may explain the large grade difference from below GA4 to GA6. Site Scale Approach ReplaceGA4 and GA5 with boulder step-pools and Modify GA6 Given the difficulty in attempting to steepen the channel grade downstream of GA4, as evident by the previous attempt to install two boulder weirs, an alternative approach would be to remove GA4 and GA5 and regrade the 250 feet long section at roughly a 3.6% slope. For grade control, a roughened rock channel shaped as a step-pool morphology could be constructed. Although this type of grade control requires a large volume of rock of varying sizes, it tends to be much more stable than individual boulder weirs. Since regrading the channel would lower the thalweg (flow-line) in some locations (Figure 6.2), the structural integrity of the existing sacrete revetment along the highway embankment would need to be evaluated and structural modifications would likely be required. GA6 appears to be a natural constriction point in the channel, with bedrock along the right bank and either bedrock or a very large boulder along the left bank (Figure 4.9). Fish passage could be improved by removing and reshaping the concrete in GA6 to make for a more natural type of step. Making the drop more complex would help eliminate the sheeting flow over the weir and make it hydraulically resemble the numerous boulder and bedrock steps that are immediately upstream.
50
55
60
65
70
75
80
85
90
95
100
76+00 77+00 78+00 79+00 80+00 81+00 82+00 83+00 84+00 85+00
Station (ft)
Ele
vati
on
(ft
)
GA5GA6
Boulder Weir
GA4
Regrade Channel Sta. 79+00 to Sta. 81+50
Ave. Slope = 3.6% for 250 ft
Figure 6.2 - A potential fish passage solution is removal of GA4 and GA5 combined with regrading the channel and constructing stable boulder step-pool morphology between 79+00 and 81+50. This would also require modification of GA6 along with possible structural reinforcement and scour protection for highway embankment.
Gaviota Creek Fish Passage and Geomorphic Assessment Page 53 of 55 Michael Love & Associates March 15, 2007

Large Scale Approach The channel was undoubtedly straightened through this reach. Increasing the length of the channel through this reach would provide more distance to make-up grade. Between about Sta. 76+00 and 81+00, just downstream of GA5, there is a relatively flat alluvial terrace to the west of the existing channel (Figure 6.3). One alternative to explore is moving the channel to the west and away from the highway. This option could add over 100 feet of length to the channel and provide effective fish passage while eliminating problems associated with the stability of the sacrete revetment and confinement of the channel. Within the constructed channel more natural-type grade controlling features could be included. It would also provide an opportunity to enhance the aquatic and riparian habitat of the stream. The new channel would need to reconnect to the existing channel downstream of GA5 due to a bedrock outcropping and end of the terrace. The grade of the new channel could be sufficiently raised to eliminate the barrier at GA5, and possibly at GA6.
Figure 6.3 – The channel could be relocated away from the highway into the alluvial terrace to the west of GA4.
6.1.3 Bedrock Chute and Boulder Jam As described in the fish passage section of Chapter 4, no modification to the bedrock chute is recommended at this time. However, modification to the boulder jam should be explored to improve passage through the side channel along the right (west) bank. This modification should focus on creating pools of sufficient depth for steelhead to be able to leap over the drops that occur in the side channel at low and moderate flows. Additionally, annual monitoring of the boulder jam should occur to track its conditions. If the boulder jam becomes mobile, the upstream channel may
Gaviota Creek Fish Passage and Geomorphic Assessment Page 54 of 55 Michael Love & Associates March 15, 2007
become unstable, threatening the highway embankment, and possibly fish passage. If this occurs, any repair projects should consider fish passage. 6.1.4 GA7 GA7 appears originally constructed as scour protection for a pipeline crossing that is now abandoned. Based on the longitudinal profile, GA7 appears to be influencing the upstream channel grade for only 100 feet or less. In this 100 feet section the road embankment along the left (east) bank is armored with rip rap (RSP). It is our recommendation that GA7 be removed and the upstream channel allowed to regrade itself. Prior to removal, an engineering investigation should be conducted to see what modifications, if any, to the RSP would be required to ensure protection of the highway embankment. 6.1.5 GA8 through GA13 Between GA8 and GA13 the highway embankment for the southbound lanes forms the streams right bank. Throughout this section the right bank, sloping at 1H:1V or steeper, consists of sacrete revetment. The left bank is mostly bedrock. GA8 consists of concrete poured around an existing boulder step, and bedrock was found to be spanning the channel 40 feet upstream. At the bottom of the pool below GA12 there is bedrock spanning the channel bed. Also, a 40 feet long bedrock chute spans the channel between GA12 and GA13. Site Scale Approaches Construct Concrete Fishway through Bedrock Section Given the confinement of this reach by numerous bedrock exposures and outcropping along the left bank and channel bottom and the highway embankment along the right bank, one potential approach is to remove the existing grade controls and construct a pool-and-weir type fishway. This would be a series of concrete weirs strategically placed to utilize the bedrock where possible. They would span the channel, similar to the existing grade control structures, and be keyed into the bedrock bank on left and the sacrete revetment on right. Following typical fishway design standards, the weir shape would be designed for fish passage and would be sufficient in height to form pools that are at least two feet deep. Drop from weir to weir should not exceed 6 inches and pools would be sized sufficiently large to avoid a turbulence barrier. Removal of GA8 through GA13 An alternative approach would be to remove the existing grade controls GA8 through GA13, which would provide the best fish passage conditions. Due to the presence of bedrock throughout much of the reach, the resulting channel incision would likely be relatively minor in most locations. This approach would require extensive field mapping of bedrock and a structural assessment of the existing sacrete revetment along the highway embankment. It may also include strengthening or reconstructing some of the existing revetments.
Gaviota Creek Fish Passage and Geomorphic Assessment Page 55 of 55 Michael Love & Associates March 15, 2007
6.2 Develop an Action Plan
We recommend that an action plan be developed to address each group of barriers. Barriers should be addressed from downstream to upstream, where feasible. Generally, groups of grade controls should be addressed together rather than one grade control at a time. Developing any of the recommended options will require CalTrans to conduct an investigation of the structural integrity of the sacrete revetments adjacent to each grade control structure. Therefore, the appropriate next step in addressing these barriers may be to conduct a structural investigation of these sacrete revetments throughout the entire Gaviota Canyon. If there is a maintenance plan already in existence for performing repairs on any of these sections, this may also serve as an opportunity to include features that improve fish passage. Many of the potential solutions for improving fish passage can also serve as an opportunity to improve the condition and safety of the highway and its drainage features.
Gaviota Creek Fish Passage and Geomorphic Assessment Page 56 of 55 Michael Love & Associates March 15, 2007

7 References California Dept. of Fish and Game (CDFG). 2002. Culvert criteria for fish passage. Chesnut, Merlyn. 1993.The Gaviota Land, A Glimpse into California History from a Bend on El Camino Real. Fithian Press Santa Barbara CA. 253 pages. Montgomery, D. R., and Buffington, J. M. (1997). Channel-reach morphology in mountain drainage basins. Geological Society of America Bulletin, 109(5), 596-611. NOAA Fisheries. 2001. Guidelines for salmonid passage at stream crossings. NMFS SW Region. 14 pages Taylor, Ross and Michael Love. 2003. Part IX – Fish passage evaluation at stream crossings. In California Salmonid Stream Habitat Restoration Manual. CA Dept of Fish and Game. 64 pages. USGS. 1982. Guidelines for determining flood flow frequency. Bulletin #17B of the Hydrology Subcommittee. Interagency Advisory Committee on Water Data, US Dept. of Interior, Geological Survey, Virginia. Stoecker, Matt. 2002. Steelhead Assessment and Recovery Opportunities in Southern Santa Barbara County. Conception Coast Project. Santa Barbara, CA. 439 pages. Wannanan A. O. and J. R. Crippen, 1977. Magnitude and frequency of floods in California. U. S. Geological Survey, Water resources Investigation 77-21, Menlo Park, CA .96 p.
Gaviota Creek Fish Passage and Geomorphic Assessment Page 57 of 55 Michael Love & Associates March 15, 2007

APPENDIX A
Fish passage assessment of two Highway 101 Culverts
Upper Gaviota Creek (GA_20) Las Canovas Creek (GA_CA_1)
Steelhead Passage Assessment
of Highway 101 Stream Crossings on Upper Gaviota and Las Canovas Creek
Prepared by: Michael Love & Associates
and
Stoecker Ecological
March 15, 2007

March 15, 2007
Fish Passage Assessment of Highway 101 Culverts on Upper Gaviota Creek and Las Canovas Creek
Table of Contents:
1) Overview........................................................................................................ 1 2) Activities ....................................................................................................... 2 4) Hydrology and Fish Passage Flows ..................................................... 3 5) Fish Passage Assessment Criteria......................................................... 5 6) Findings ........................................................................................................ 6 7) Summary ..................................................................................................... 11 8) Recommendations ................................................................................... 11 9) Conclusions................................................................................................ 12 9) References .................................................................................................. 12
1) Overview This report summarizes the assessment of existing fish passage conditions for two CalTrans maintained stream crossing on Highway 101 within the Gaviota Creek watershed of Southern Santa Barbara County. The crossings are Highway 101 at Upper Gaviota Creek (Barrier ID: GA_20) and Highway 101 at Las Canovas Creek (Barrier ID GA_CA_1). Figure 1 shows the location of the two stream crossings. These road-stream crossings were identified as impassable in a recent steelhead habitat and passage assessment report (Stoecker, 2002). The earlier assessment was for the entire southern Santa Barbara County and passage was assessed based primarily on professional judgment. The intent of the current assessment is to quantify the passage conditions at the two culverts by following the Assessment Protocol (Taylor and Love, 2003). This work was funded through California Department of Fish and Game’s California Coastal Salmon Recovery Program. It was performed in conjunction with a fish passage and geomorphic assessment for 12 grade control structures in Lower Gaviota Creek, in Santa Barbara County along Highway 101. In the previous assessment by Stoecker, these two crossings were identified as complete barriers (Severity = 1). The Highway 101 culvert on Upper Gaviota Creek was given the highest priority within the watershed, and if passage was reestablished at this crossing steelhead would regain access to over 1.9 miles of “high” quality salmonid habitat. The Highway 101 culvert on Las Canovas Creek was given the second highest priority within the watershed, and if passage was reestablished at this crossing steelhead would regain access to as much as 0.46 miles of “high” to “moderate-high” quality salmonid habitat.

Highway 101 Crossing on Las Canovas Creek (GA_CA_1)
Highway 101 Crossing on Upper Gaviota Creek (GA_20)
Figure 1 – Location of the two assessed Highway 101 stream crossings (GA_20 and GA_CA_1) shown on the USGS 7.5 minute Solvang quadrangle.
2) Activities The Upper Gaviota Stream Crossing and the Las Canovas Creek stream crossing was surveyed on October 15th 2006. Both are owned and maintained by CalTrans, however the land owner upstream and downstream of the Upper Gaviota Creek crossing was not contacted for access, preventing a quantitative assessment of the adjacent stream channel. However, from survey data collected within the CalTrans Right-of-Way we were able to assess the hydraulic conditions in the culvert as relating to fish passage. The survey followed the California Department of Fish and Game (CDFG) fish passage assessment protocol (Taylor and Love, 2003). Tasks included taking standard measurements of the culvert, surveying a longitudinal profile through each culvert, surveying a channel cross section at the tailwater control below each crossing, and measuring active channel widths upstream of each crossing within accessible areas. Since the tailwater control for the outlet pool at the Upper Gaviota crossing was beyond the CalTrans right-of-way, the tailwater cross section was surveyed using the prismless feature of the survey equipment. The data from the field survey of the two sites was entered into spreadsheets for analysis. Culvert slopes and outlet drops were calculated and plots were made of the longitudinal profiles. Using the CDFG protocol for analyzing passage conditions, we calculated the fish migration flow range for adult steelhead, adult rainbow trout, and juvenile trout. Then, using
March 15, 2007 Page 2

CDFG prescribed swimming and leaping abilities and minimum water depth requirements, we analyzed fish passage conditions through each culvert using FishXing 3.0.
4) Hydrology and Fish Passage Flows Peak Flow Estimates As part of the CDFG fish passage inventory protocol, the capacity of the crossing is assessed to determine its ability to accommodate peak flood flows. Magnitudes of peak flows associated with varying recurrence intervals were estimated using a probabilistic analysis of 20 years of annual peak flow records from Gaviota Creek at Gaviota (USGS Gage No. 11120550). The peak flows were then scaled by contributing drainage area for each of the stream crossings. Table 1 shows the estimated flows associated with the 2 to 100 year recurrence intervals.
Table 1 - Peak flow estimates for stream crossings on Gaviota and Las Canovas Creek at Highway 101 for various recurrence intervals.
Highway 101 at
Las Canovas Creek Highway 101 at
Upper Gaviota Creek Drainage Area = 1.39 mi2 3.32 mi2
2-year Flow = 77 cfs 185 cfs 5-year Flow = 210 cfs 502 cfs
10-year Flow = 342 cfs 818 cfs 25-year Flow = 539 cfs 1,288 cfs 50-year Flow = 716 cfs 1,710 cfs
100-year Flow = 913 cfs 2,181 cfs Calculated using probabilistic analysis of peak flow record from USGS Gaviota Creek at Gaviota, adjusted by drainage area. Analysis followed USGS Bulletin 17B procedures (USGS 1982).
Fish Passage Flows Analyzing fish passage conditions requires defining a range of flows for which passage should be provided. Generally, passage is not required at extremely low or high flows, when fish are not expected to be moving. Methods for determining the lower and upper passage flows are defined by NOAA Fisheries (2001) and CDFG (2002) for adult steelhead, adult resident rainbow trout, and juvenile trout. Between the lower and upper passage flows hydraulic conditions at the stream crossing should be adequate for the target species and lifestage. A stream crossing that provides adequate passage conditions at all flows between the lower and upper fish passage flow is considered to be “100% passable” for that species and lifestage. The majority of culverts are not 100% passable, but fall into the partial or complete barrier categories. Many block adult steelhead at some flows and juvenile salmonids at all flows.
March 15, 2007 Page 3

Flow Duration Curve Highway 101 Culvertsat Upper Gaviota Creek (GA_20) and Las Canovas Creek (GA_CA_1)
0.01
0.1
1
10
100
0% 10% 20% 30% 40% 50% 60% 70% 80% 90% 100%
Exceedance
Dis
char
ge (c
fs)
Upper Gaviota Creek at Highway 101 Crossing (3.3 sq. mi.)
Las Canovas Creek at confluence with Gaviota Creek (1.39 sq. mi.)
Figure 2 - Flow duration curve for the assessed stream crossings on Upper Gaviota and Las Canovas Creek, constructed from Gaviota Creek at Gaviota daily average streamflow records. Table 2 - Fish Passage Flow Criteria as defined by NOAA Fisheries and CDFG.
Species and Lifestage Lower Passage Flow Upper Passage Flow
Adult Steelhead 50% exceedance flow or 3 cfs (whichever is greater) 1% exceedance flow
Adult Rainbow Trout 90% exceedance flow or 2 cfs (whichever is greater) 5% exceedance flow
Juvenile Trout 95% exceedance flow or 1 cfs (whichever is greater) 10% exceedance flow
Table 3 - Fish passage flows for Highway 101 culverts on Upper Gaviota and Las Canovas Creeks.
Fish Passage Flows
Adult Steelhead
Adult Resident Rainbow Trout
Juvenile Salmonids
Location Lower Upper Lower Upper Lower Upper
Highway 101 at Las Canovas Creek(GA_CA_1)
3 cfs 8.5 cfs 2 cfs 2 cfs 1 cfs 1 cfs
Highway 101 at Upper Gaviota Creek(GA_20)
3 cfs 20.3 cfs 2 3.4 cfs 1 cfs 1.4 cfs
March 15, 2007 Page 4
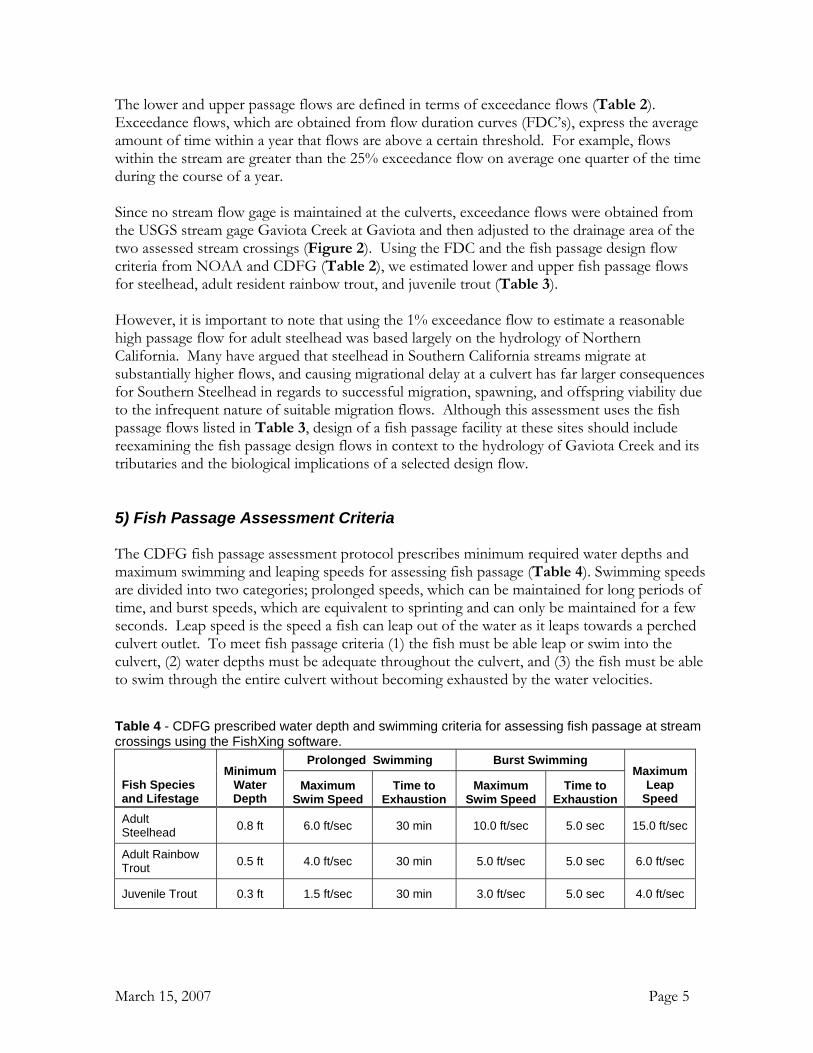
The lower and upper passage flows are defined in terms of exceedance flows (Table 2). Exceedance flows, which are obtained from flow duration curves (FDC’s), express the average amount of time within a year that flows are above a certain threshold. For example, flows within the stream are greater than the 25% exceedance flow on average one quarter of the time during the course of a year. Since no stream flow gage is maintained at the culverts, exceedance flows were obtained from the USGS stream gage Gaviota Creek at Gaviota and then adjusted to the drainage area of the two assessed stream crossings (Figure 2). Using the FDC and the fish passage design flow criteria from NOAA and CDFG (Table 2), we estimated lower and upper fish passage flows for steelhead, adult resident rainbow trout, and juvenile trout (Table 3). However, it is important to note that using the 1% exceedance flow to estimate a reasonable high passage flow for adult steelhead was based largely on the hydrology of Northern California. Many have argued that steelhead in Southern California streams migrate at substantially higher flows, and causing migrational delay at a culvert has far larger consequences for Southern Steelhead in regards to successful migration, spawning, and offspring viability due to the infrequent nature of suitable migration flows. Although this assessment uses the fish passage flows listed in Table 3, design of a fish passage facility at these sites should include reexamining the fish passage design flows in context to the hydrology of Gaviota Creek and its tributaries and the biological implications of a selected design flow. 5) Fish Passage Assessment Criteria The CDFG fish passage assessment protocol prescribes minimum required water depths and maximum swimming and leaping speeds for assessing fish passage (Table 4). Swimming speeds are divided into two categories; prolonged speeds, which can be maintained for long periods of time, and burst speeds, which are equivalent to sprinting and can only be maintained for a few seconds. Leap speed is the speed a fish can leap out of the water as it leaps towards a perched culvert outlet. To meet fish passage criteria (1) the fish must be able leap or swim into the culvert, (2) water depths must be adequate throughout the culvert, and (3) the fish must be able to swim through the entire culvert without becoming exhausted by the water velocities. Table 4 - CDFG prescribed water depth and swimming criteria for assessing fish passage at stream crossings using the FishXing software.
Prolonged Swimming Burst Swimming
Fish Species and Lifestage
Minimum Water Depth
Maximum Swim Speed
Time to Exhaustion
Maximum Swim Speed
Time to Exhaustion
Maximum Leap
Speed Adult Steelhead 0.8 ft 6.0 ft/sec 30 min 10.0 ft/sec 5.0 sec 15.0 ft/sec
Adult Rainbow Trout 0.5 ft 4.0 ft/sec 30 min 5.0 ft/sec 5.0 sec 6.0 ft/sec
Juvenile Trout 0.3 ft 1.5 ft/sec 30 min 3.0 ft/sec 5.0 sec 4.0 ft/sec
March 15, 2007 Page 5

The swim speeds and minimum water depths prescribed by CDFG are relatively conservative, and meant to represent the needs and abilities of the weaker swimming individual fish. Many individual fish are able to swim faster and swim through shallower flows than indicated in Table 4. Therefore, it is not uncommon for some fish to pass through stream crossings that fail to meet these passage criteria. For the two crossings, fish passage for all three life stages of steelhead/rainbow trout were assessed between the lower and upper fish passage flows using the CDFG criteria. 6) Findings Las Canovas Creek at Highway 101 (GA_CA_1) The Las Canovas crossing is a 325 foot long, 10 feet wide x 10 feet tall reinforced concrete box (RCB) culvert with multiple slopes and 3 horizontal turns. The slope and lengths starting from the culvert outlet to the inlet are:
Culvert Section Length Slope
1 158 ft 2.3% 2 44 ft 9.8% 3 62 ft 6.0% 4 61 ft 2.1%
Outlet and Tailwater Conditions The outlet is located at the confluence of Las Canovas Creek with Gaviota Creek (Figure 3). The outlet is perched 2.2 ft above the channel bed control in Gaviota Creek, forcing fish to leap into the culvert outlet at lower flows.. There is an accumulation of boulders and gravels inside the lower 75 feet of the culvert, suggesting significant backwatering from Gaviota Creek during high flows. A living alter tree and associated root mass on the culvert apron appears to help retain the deposited sediment in the culvert. The tailwater control below the culvert outlet is a riffle crest located in Gaviota Creek approximately 60 ft downstream of the outlet. To predict backwater conditions in the culvert a tailwater cross section and channel profile was surveyed in Gaviota Creek below the outlet. For assessment purposes, the flow in Gaviota Creek was assumed to correspond proportionally (by drainage area) to the flow in Las Canovas Creek. For example, we assumed that Gaviota Creek at the culvert outlet would flow at the 1% exceedance flow at the same time as Las Canovas Creek. During the survey one 11 inch rainbow trout and four pond turtles were observed in Gaviota Creek about 300 feet upstream of the culvert outlet. Three rainbow trout, 5 to 7 inches in length, were observed in the lower portion of the culvert
March 15, 2007 Page 6

Inlet Conditions During the field visit, we found a large diameter Sycamore tree had fallen across the inlet of the culvert (Figure 4). There was a substantial amount of large bedload aggraded at the culvert inlet, which is often associated with backwater effects resulting from undersized or debris plugged culverts. The upstream channel is steep and characterized by boulder steps. The average actively scoured channel width is 21.8 feet while the width of the culvert opening is 10 feet, constricting the active channel by 45%.
Assessment Results Using the CDFG coarse screen, the culvert is categorized as RED, because its slope is much greater than 2% and the residual outlet drop is greater than 2 feet. Further hydraulic assessment of the crossing using FishXing 3.0 found that it did not satisfy passage criteria for all species and lifestages at any flow (Table 5). While acceptable velocities were found for adult steelhead below 7 cfs, the water depth in the culvert is insufficient, at less than 0.1 feet. Detailed results of the fish passage analysis and a water surface profile through the culvert are provided at the end of this report. Using standard Federal Highways Chart 8, the capacity of the crossing is estimated to be 930 cfs when the headwater (water at the inlet) is at the top of the culvert, this corresponds to the estimated 100-year peak flow. Table 5 – Fish passage conditions at Las Canovas stream crossing. Results are for Section 2 of the culvert, which has the steepest slope and is most limiting to passage conditions.
Fish Species and Age Class
Fish Passage Design Flows
Insufficient Depth below
Excessive Velocity above
Percent Passable between lower and upper
passage design flows Adult Steelhead 3 cfs – 8.5 cfs 78.4 cfs 7.07 cfs 0%
Adult Rainbow Trout 2 cfs – 2 cfs 37.11 cfs 2.42 cfs 0%
Juvenile Trout 1 cfs – 1 cfs 16.23 cfs 0.54 cfs 0%
March 15, 2007 Page 7

Figure 3 – Outlet of Las Canovas Creek culvert, at the confluence with Gaviota Creek. Looking downstream towards tailwater control in Gaviota Creek.
Figure 4 - Looking upstream through the inlet of the Highway 101 Las Canovas Creek culvert. The crossing is a 10 ft x 10 ft box culvert, with 3 turns and four distinct breaks in slope. There is substantial aggradation of boulders and cobbles at the inlet.
March 15, 2007 Page 8
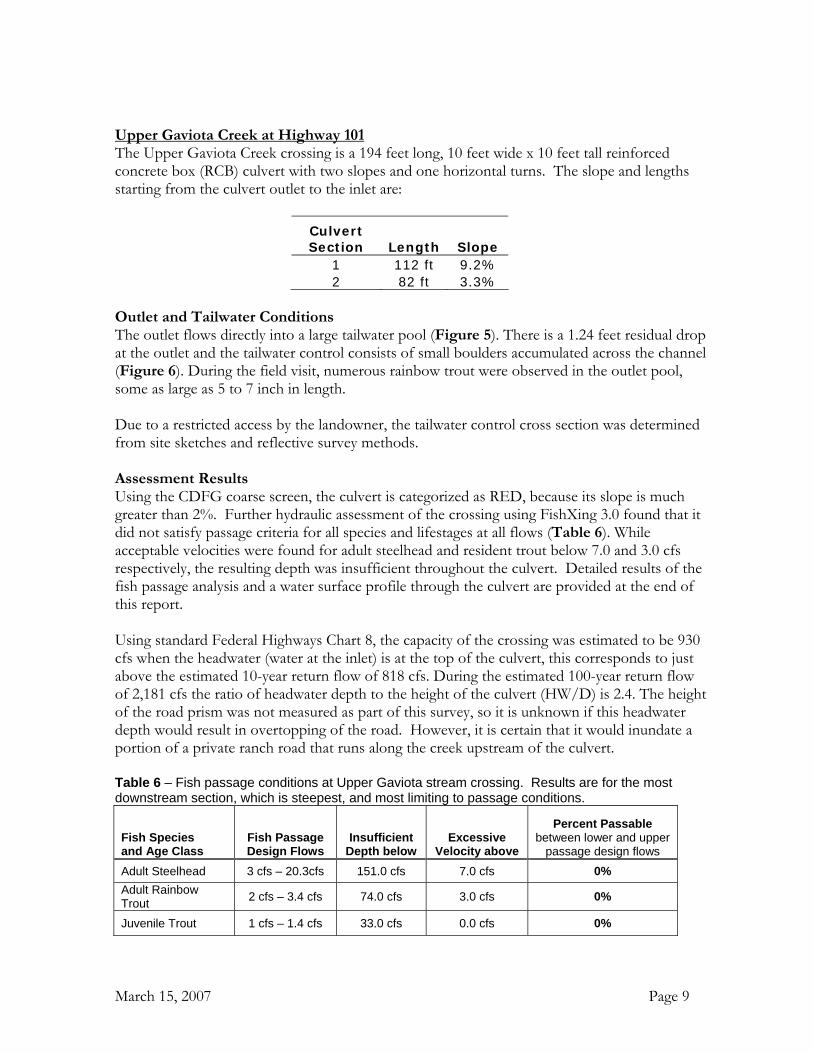
Upper Gaviota Creek at Highway 101 The Upper Gaviota Creek crossing is a 194 feet long, 10 feet wide x 10 feet tall reinforced concrete box (RCB) culvert with two slopes and one horizontal turns. The slope and lengths starting from the culvert outlet to the inlet are:
Culvert Section Length Slope
1 112 ft 9.2% 2 82 ft 3.3%
Outlet and Tailwater Conditions The outlet flows directly into a large tailwater pool (Figure 5). There is a 1.24 feet residual drop at the outlet and the tailwater control consists of small boulders accumulated across the channel (Figure 6). During the field visit, numerous rainbow trout were observed in the outlet pool, some as large as 5 to 7 inch in length. Due to a restricted access by the landowner, the tailwater control cross section was determined from site sketches and reflective survey methods. Assessment Results Using the CDFG coarse screen, the culvert is categorized as RED, because its slope is much greater than 2%. Further hydraulic assessment of the crossing using FishXing 3.0 found that it did not satisfy passage criteria for all species and lifestages at all flows (Table 6). While acceptable velocities were found for adult steelhead and resident trout below 7.0 and 3.0 cfs respectively, the resulting depth was insufficient throughout the culvert. Detailed results of the fish passage analysis and a water surface profile through the culvert are provided at the end of this report. Using standard Federal Highways Chart 8, the capacity of the crossing was estimated to be 930 cfs when the headwater (water at the inlet) is at the top of the culvert, this corresponds to just above the estimated 10-year return flow of 818 cfs. During the estimated 100-year return flow of 2,181 cfs the ratio of headwater depth to the height of the culvert (HW/D) is 2.4. The height of the road prism was not measured as part of this survey, so it is unknown if this headwater depth would result in overtopping of the road. However, it is certain that it would inundate a portion of a private ranch road that runs along the creek upstream of the culvert. Table 6 – Fish passage conditions at Upper Gaviota stream crossing. Results are for the most downstream section, which is steepest, and most limiting to passage conditions.
Fish Species and Age Class
Fish Passage Design Flows
Insufficient Depth below
Excessive Velocity above
Percent Passable between lower and upper
passage design flows Adult Steelhead 3 cfs – 20.3cfs 151.0 cfs 7.0 cfs 0% Adult Rainbow Trout 2 cfs – 3.4 cfs 74.0 cfs 3.0 cfs 0%
Juvenile Trout 1 cfs – 1.4 cfs 33.0 cfs 0.0 cfs 0%
March 15, 2007 Page 9

Figure 5 – Outlet of Upper Gaviota Creek culvert.
Figure 6 – Site sketches for Upper Gaviota Creek showing tailwater control cross section and plan map of crossing. Survey data was limited to the highway right-of-way.
March 15, 2007 Page 10

7) Summary Both Upper Gaviota Creek at Highway 101 and Las Canovas Creek at Highway 101 are placed into the RED category according the CDFG assessment protocols. Additional fish passage analysis using the FishXing Version 3 software and CDFG recommended fish swimming and leaping speeds identified the crossing as failing to provide adequate passage conditions for all life stages of salmonids, including adult steelhead, at all flows. Passage conditions are poor due to excessive water velocities and insufficient depth caused by steep slopes and a flat smooth bottom. Based on experience with previous fish passage assessments, it is unlikely that any fish are able to pass through either of these culverts under any conditions. 8) Recommendations Both culverts have a large amount of fill material and multiple lanes of traffic over them. Replacement of either crossing would be a multi-million dollar investment and require many years of planning, making replacement not a viable short-term alternative. Any future large-scale modifications to the culverts or adjacent highway should consider removal of these culvers and installation of a “stream simulation” type crossing. The extremely steep slopes within both of these culverts makes retrofitting them to provide steelhead passage difficult. Baffles are frequently added to culverts to slow water velocities, increase water depths and improve fish passage. However, baffles fail to work effectively at slopes greater than 3.5% (Bates 2003). The slopes in these two culverts are far too steep for baffles, with each having a culvert section that has a slope exceeding 9%. Pool-and-Weir Fishway Alternative The most viable alternative is to construct a pool-and-weir type fishway within the culvert barrel. This could consist of a series of weirs, with 6-inch drops between weirs to provide passage for all age classes of trout. The pools formed by the weirs would require a minimum depth of 2 feet and would need to be sufficient in size to dissipate the energy associated with each drop. Otherwise, excessive turbulence may become a barrier. Both of these culverts are currently inlet controlled due to their slope, meaning that the inlet shape and size controls its capacity rather than the hydraulics within the culvert barrel. As with other culvert retrofit projects, it may be possible to maintain inlet control conditions during peak flows at both of these culverts while providing a pool-and-weir fishway within them. To avoid further reduction in culvert capacity, the floor of the culvert near the inlet may need to be cut and reformed at a lower elevation. Additionally, the upper most weir can be placed well downstream of the culvert inlet, to avoid reducing the cross-sectional area of the inlet. CalTrans District 1 recently completed a similar type culvert retrofit on Luffenholz Creek on Highway 101 in Humboldt County. This retrofit involved constructing concrete weirs within an existing concrete box culvert to improve salmon and steelhead passage (Sebastian Cohen, Per. Communication).
March 15, 2007 Page 11

9) Conclusions There are currently various age classes of rainbow trout at the outlets of both of these culverts. Additionally Stoecker observed an adult steelhead within the pool below the Upper Gaviota Creek culvert. Eliminating the migration barrier at the Highway 101 culvert at Upper Gaviota Creek and Las Canovas Creek would immediately provide anadromous steelhead and resident rainbow trout thousands of feet of high quality habitat and should be considered a high priority within the efforts to restore and maintain a viable steelhead population within the Gaviota Creek Watershed. 10) References Bates. 2003. Design of Road Culverts for Fish Passage.
(http://wdfw.wa.gov/hab/engineer/habeng.htm#upstrm). California Dept. of Fish and Game (CDFG). 2002. Culvert criteria for fish passage... Cohen, Sebastian. 2005. Personal Communication. Engineering, CalTrans District 1, Eureka
CA. NOAA Fisheries. 2001. Guidelines for salmonid passage at stream crossings. NMFS SW Region. 14
pages Taylor, Ross and Michael Love. 2003. Part IX – Fish passage evaluation at stream crossings. In
California Salmonid Stream Habitat Restoration Manual. CA Dept of Fish and Game. 64 pages.
USGS. 1982. Guidelines for determining flood flow frequency. Bulletin #17B of the
Hydrology Subcommittee. Interagency Advisory Committee on Water Data, US Dept. of Interior, Geological Survey, Virginia.
Stoecker, Matt. 2002. Steelhead Assessment and Recovery Opportunities in Southern Santa
Barbara County. Conception Coast Project. Santa Barbara, CA. 439 pages.
March 15, 2007 Page 12

Thalweg Profile - Las Canovas Culvert
70
75
80
85
90
95
100
105
110
115
0 50 100 150 200 250 300 350 400 450 500 550 600 650 700 750 800
Station (ft)
Ele
vati
on
(ft
)
Water Surface in Las Canovas Culvert at 8.5 cfs (Upper Adult Steelhead Passage Flow):
Min Depth in Culvert= 0.13 ftMax Velocity in Culvert= 6.53 fpsWater Surface Drop at Outlet = None
Deposited substarte in culvert due to backwater effects from Gaviota Creek
Water surface in Gaviota Creek

Site: Las Canovas CreekRoad: State Highway 101
General InformationSurvey Date: 10/14/06 7.5 Minute Quad Name: SolvangSurvey Team: Love, Llanos, Stoecker Latitude: 34o 30' 16.81"NStream Name: Las Canovas Creek Longitude: 120o 13' 36.15"WLand Ownership: State of California Tributary to: Gaviota Creek
Culvert Information HydrologyShape: Box Drainage Area: 1.39 mi2
Material: Concrete Estimated 100-yr Flow*: 913 cfsRoughness (n): 0.018Inlet Type: Wingwall 30-70o Culvert Capacity based on FHWA Chart 8Outlet Type: Projecting concrete apron ENTRANCE TYPE: Wingwall 30-70o
Diameter: 10 ftBankfull Width: Crossing Peak Flow CapacityCulvert Section 1 of 4 Top of Inlet (HW/D = 1.0) = 930 cfsLength: 158 ftConstant Slope: 2.3%Residual Outlet Depth: -1.8 ftRetrofit: No Mean Reach Slope: 4.53%Culvert Section 2 of 4Length: 44 ft Culvert Section 4 of 4Constant Slope: 9.8% Length: 61 ftRetrofit: No Constant Slope: 2.1%Culvert Section 3 of 4 Retrofit: NoLength: 62 ft Residual Inlet Depth: -15.3 ftConstant Slope: 6.0%Retrofit: No*Value derived from average of Log-Pearson Type III using local stream gage records, normalized by Drainage area
Fish Passage Criteria From CA Salmonid Stream Habitat Restoration Manual Chapter IX- DFG
Maximum Swim Speed
Time to Exhaustion Maximum Swim Speed
Time to Exhaustion
Maximum Leap Speed
Adult Anadromous Salmonids 0.8 feet 6.0 ft/sec 30 minutes 10.0 ft/sec 5.0 sec 15.0 ft/sec
Resident Trout and Juvenile Steelhead >6" 0.5 feet 4.0 ft/sec 30 minutes 5.0 ft/sec 5.0 sec 6.0 ft/sec
Juvenile Salmonids <6" 0.3 feet 1.5 ft/sec 30 minutes 3.0 ft/sec 5.0 sec 4.0 ft/sec
Fish Passage Design FlowsDesign Flow Window
Limits
Adult Anadromous Salmonids
Resident Trout and Juvenile
Steelhead >6"Juvenile
Salmonids <6"Lower Passage Flow (Qlp) 3.0 cfs 2.0 cfs 1.0 cfs
Upper Passage Flow (Qhp) 8.5 cfs 2.0 cfs 1.0 cfs
STREAM CROSSING SUMMARY SHEET
Fish Passage Conditions
Species or Lifestages Minimum Water Depth
Prolonged Swimming Mode Burst Swimming Mode

Site: Las Canovas CreekRoad: State Highway 101
STREAM CROSSING SUMMARY SHEET
Existing Conditions at Fish Passage Design Flows
Existing Conditions for Culvert
Fish Passage Flow Window Qlp(cfs)
Mid Barrel Water Depth
(ft)
Mid Barrel Velocity
(ft/s)
Outlet Drop(ft)
Adult Steelhead 3.0 0.07 4.53 0.68Adult Rainbow Trout 2.0 0.05 3.68 0.84Juvenile Salmonids 1.0 0.04 2.79 1.08
Fish Speciesand Age Class
Qhp(cfs)
Mid Barrel Water Depth
(ft)
Mid Barrel Velocity
(ft/s)
Outlet Drop(ft)
Adult Steelhead 8.5 0.13 6.53 0.00Adult Rainbow Trout 2.0 0.08 4.46 0.84Juvenile Salmonids 1.0 0.04 2.79 1.08
Flows Meeting Fish Passage Criteria
Fishxing Results for Culvert
Fish Speciesand Age Class
Insufficient Depth below
Excessive Velocity above
Excessive Outlet Drop
below
Flows Passable between Lower and Upper Fish Passage
FlowsAdult Steelhead 78.4 cfs 7.1 cfs - 0%Adult Rainbow Trout 37.1 cfs 2.4 cfs 2.0 cfs 0%Juvenile Salmonids 16.2 cfs 0.5 cfs 5.6 cfs 0%
The Las Canovas culvert is a barrier to Adult Steelhead, Adult Resident Trout and Juvenile Salmonids at all flows. While there is a small window of acceptable velocity for Adult Steelhead and Trout, the depth is insufficient for an excessive length.

Longitudinal Profile - Upper Gaviota Culvert
75
80
85
90
95
100
105
110
115
120
0 50 100 150 200 250 300 350
Station (ft)
Ele
vati
on
(ft
)
Water Surface at 20.3 cfs (Upper Fish Passage Flow Adult Steelhead):Min Depth in Culvert= 0.23 ftMax Velocity in Culvert= 9.07 fpsWater Surface Drop at Outlet = 0.18 ft

Site: Upper Gaviota CreekRoad: State Highway 101
General InformationSurvey Date: 10/14/06 7.5 Minute Quad Name: SolvangSurvey Team: Love, Llanos, Stoecker Latitude: 34o 31' 3.06"NStream Name: Upper Gaviota Creek Longitude: 120o 13' 3.24"WLand Ownership: State of California Tributary to: Gaviota Creek
Culvert Information HydrologyShape: Box Drainage Area: 3.32 mi2
Material: Concrete Estimated 100-yr Flow*: 2,181 cfsRoughness (n): 0.018Inlet Type: Wingwall 30-70o Culvert Capacity based on FHWA Chart 8Outlet Type: Wingwall 30-70o ENTRANCE TYPE: Wingwall 30-70o
Diameter: 10 ftBankfull Width: Crossing Peak Flow CapacityCulvert Section 1 of 2 Top of Inlet (HW/D = 1.0) = 913 cfsLength: 112 ft Top of Road (HW/D = 1.1) = cfsConstant Slope: 9.2%Residual Inlet Depth: N/A ftResidual Outlet Depth: -0.9 ft Mean Reach Slope: 6.11%Retrofit: NoCulvert Section 2 of 2Length: 82 ftConstant Slope: 3.3%Residual Inlet Depth: -13.8 ftResidual Outlet Depth: N/A ftRetrofit: No
*Value derived from average of Log-Pearson Type III using local stream gage records, normalized by Drainage area
Fish Passage Criteria From CA Salmonid Stream Habitat Restoration Manual Chapter IX- DFG
Maximum Swim Speed
Time to Exhaustion Maximum Swim Speed
Time to Exhaustion
Maximum Leap Speed
Adult Anadromous Salmonids 0.8 feet 6.0 ft/sec 30 minutes 10.0 ft/sec 5.0 sec 15.0 ft/sec
Resident Trout and Juvenile Steelhead >6" 0.5 feet 4.0 ft/sec 30 minutes 5.0 ft/sec 5.0 sec 6.0 ft/sec
Juvenile Salmonids <6" 0.3 feet 1.5 ft/sec 30 minutes 3.0 ft/sec 5.0 sec 4.0 ft/sec
Fish Passage Design FlowsDesign Flow Window
Limits
Adult Anadromous Salmonids
Resident Trout and Juvenile Steelhead >6"
Juvenile Salmonids <6"
Lower Passage Flow (Qlp) 3.0 cfs 2.0 cfs 1.0 cfsUpper Passage Flow (Qhp) 20.3 cfs 3.4 cfs 1.4 cfs
STREAM CROSSING SUMMARY SHEET
Fish Passage Conditions
Species or Lifestages Minimum Water Depth
Prolonged Swimming Mode Burst Swimming Mode

Site: Upper Gaviota CreekRoad: State Highway 101
STREAM CROSSING SUMMARY SHEET
Existing Conditions at Fish Passage Design Flows
Existing Conditions for Culvert Section 1 of 2Fish Passage Flow
WindowQlp(cfs)
Mid Barrel Water Depth
(ft)
Mid Barrel Velocity
(ft/s)
Outlet Drop(ft)
Adult Steelhead 3.0 0.07 4.23 0.51Adult Rainbow Trout 2.0 0.06 3.61 0.55Juvenile Salmonids 1.0 0.04 2.74 0.60
Fish Speciesand Age Class
Qhp(cfs)
Mid Barrel Water Depth
(ft)
Mid Barrel Velocity
(ft/s)
Outlet Drop(ft)
Adult Steelhead 20.3 0.23 9.07 0.18Adult Rainbow Trout 3.4 0.08 4.46 0.50Juvenile Salmonids 1.4 0.04 3.13 0.58
Flows Meeting Fish Passage Criteria
Fishxing Results for Culvert Section 1 of 2
Fish Speciesand Age Class
Insufficient Depth below
Excessive Velocity above
Excessive Outlet Drop
below
Flows Passable between Lower and Upper Fish Passage
FlowsAdult Steelhead 151.0 cfs 7.0 cfs 0.0 cfs 0%Adult Rainbow Trout 74.0 cfs 3.0 cfs 0.0 cfs 0%Juvenile Salmonids 33.0 cfs 0.0 cfs 15.0 cfs 0%
The Upper Gaviota culvert is a barrier to Adult Steelhead, Adult Resident Trout and Juvenile Salmonids at all flows. While there is a small window of acceptable velocity for Adult Steelhead and Trout, the depth is insufficient for an excessive length.


Site: Las Canovas CreekRoad: State Highway 101
STREAM CROSSING SUMMARY SHEET
Existing Conditions at Fish Passage Design Flows
Existing Conditions for Culvert
Fish Passage Flow Window Qlp(cfs)
Mid Barrel Water Depth
(ft)
Mid Barrel Velocity
(ft/s)
Outlet Drop(ft)
Adult Steelhead 3.0 0.07 4.53 0.68Adult Rainbow Trout 2.0 0.05 3.68 0.84Juvenile Salmonids 1.0 0.04 2.79 1.08
Fish Speciesand Age Class
Qhp(cfs)
Mid Barrel Water Depth
(ft)
Mid Barrel Velocity
(ft/s)
Outlet Drop(ft)
Adult Steelhead 8.5 0.13 6.53 0.00Adult Rainbow Trout 2.0 0.08 4.46 0.84Juvenile Salmonids 1.0 0.04 2.79 1.08
Flows Meeting Fish Passage Criteria
Fishxing Results for Culvert
Fish Speciesand Age Class
Insufficient Depth below
Excessive Velocity above
Excessive Outlet Drop
below
Flows Passable between Lower and Upper Fish Passage
FlowsAdult Steelhead 78.4 cfs 7.1 cfs - 0%Adult Rainbow Trout 37.1 cfs 2.4 cfs 2.0 cfs 0%Juvenile Salmonids 16.2 cfs 0.5 cfs 5.6 cfs 0%
The Las Canovas culvert is a barrier to Adult Steelhead, Adult Resident Trout and Juvenile Salmonids at all flows. While there is a small window of acceptable velocity for Adult Steelhead and Trout, the depth is insufficient for an excessive length.
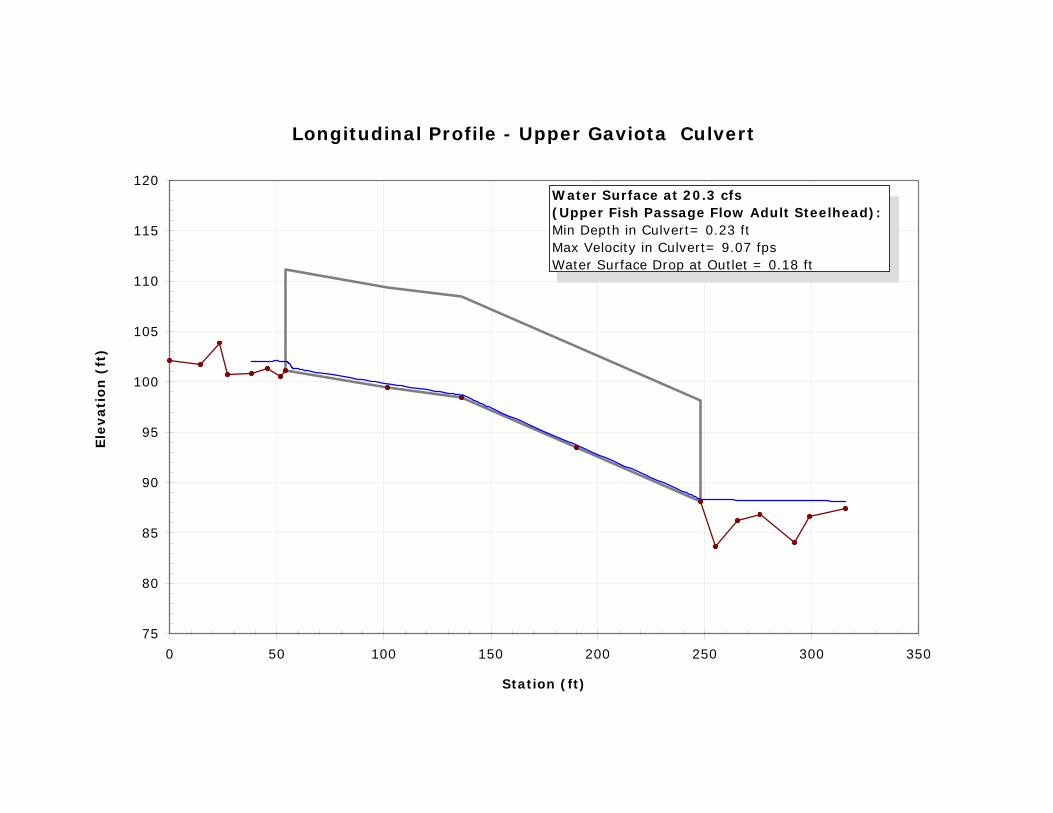
Longitudinal Profile - Upper Gaviota Culvert
75
80
85
90
95
100
105
110
115
120
0 50 100 150 200 250 300 350
Station (ft)
Ele
vati
on
(ft
)
Water Surface at 20.3 cfs (Upper Fish Passage Flow Adult Steelhead):Min Depth in Culvert= 0.23 ftMax Velocity in Culvert= 9.07 fpsWater Surface Drop at Outlet = 0.18 ft
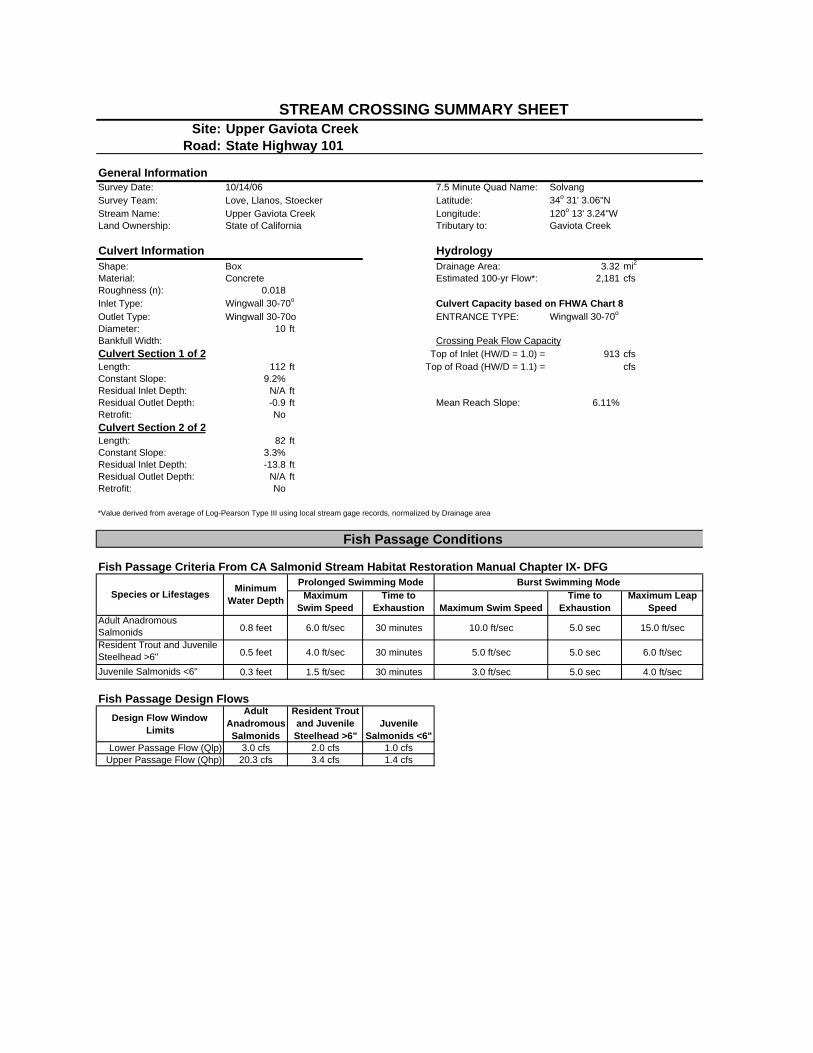
Site: Upper Gaviota CreekRoad: State Highway 101
General InformationSurvey Date: 10/14/06 7.5 Minute Quad Name: SolvangSurvey Team: Love, Llanos, Stoecker Latitude: 34o 31' 3.06"NStream Name: Upper Gaviota Creek Longitude: 120o 13' 3.24"WLand Ownership: State of California Tributary to: Gaviota Creek
Culvert Information HydrologyShape: Box Drainage Area: 3.32 mi2
Material: Concrete Estimated 100-yr Flow*: 2,181 cfsRoughness (n): 0.018Inlet Type: Wingwall 30-70o Culvert Capacity based on FHWA Chart 8Outlet Type: Wingwall 30-70o ENTRANCE TYPE: Wingwall 30-70o
Diameter: 10 ftBankfull Width: Crossing Peak Flow CapacityCulvert Section 1 of 2 Top of Inlet (HW/D = 1.0) = 913 cfsLength: 112 ft Top of Road (HW/D = 1.1) = cfsConstant Slope: 9.2%Residual Inlet Depth: N/A ftResidual Outlet Depth: -0.9 ft Mean Reach Slope: 6.11%Retrofit: NoCulvert Section 2 of 2Length: 82 ftConstant Slope: 3.3%Residual Inlet Depth: -13.8 ftResidual Outlet Depth: N/A ftRetrofit: No
*Value derived from average of Log-Pearson Type III using local stream gage records, normalized by Drainage area
Fish Passage Criteria From CA Salmonid Stream Habitat Restoration Manual Chapter IX- DFG
Maximum Swim Speed
Time to Exhaustion Maximum Swim Speed
Time to Exhaustion
Maximum Leap Speed
Adult Anadromous Salmonids 0.8 feet 6.0 ft/sec 30 minutes 10.0 ft/sec 5.0 sec 15.0 ft/sec
Resident Trout and Juvenile Steelhead >6" 0.5 feet 4.0 ft/sec 30 minutes 5.0 ft/sec 5.0 sec 6.0 ft/sec
Juvenile Salmonids <6" 0.3 feet 1.5 ft/sec 30 minutes 3.0 ft/sec 5.0 sec 4.0 ft/sec
Fish Passage Design FlowsDesign Flow Window
Limits
Adult Anadromous Salmonids
Resident Trout and Juvenile Steelhead >6"
Juvenile Salmonids <6"
Lower Passage Flow (Qlp) 3.0 cfs 2.0 cfs 1.0 cfsUpper Passage Flow (Qhp) 20.3 cfs 3.4 cfs 1.4 cfs
STREAM CROSSING SUMMARY SHEET
Fish Passage Conditions
Species or Lifestages Minimum Water Depth
Prolonged Swimming Mode Burst Swimming Mode

Site: Upper Gaviota CreekRoad: State Highway 101
STREAM CROSSING SUMMARY SHEET
Existing Conditions at Fish Passage Design Flows
Existing Conditions for Culvert Section 1 of 2Fish Passage Flow
WindowQlp(cfs)
Mid Barrel Water Depth
(ft)
Mid Barrel Velocity
(ft/s)
Outlet Drop(ft)
Adult Steelhead 3.0 0.07 4.23 0.51Adult Rainbow Trout 2.0 0.06 3.61 0.55Juvenile Salmonids 1.0 0.04 2.74 0.60
Fish Speciesand Age Class
Qhp(cfs)
Mid Barrel Water Depth
(ft)
Mid Barrel Velocity
(ft/s)
Outlet Drop(ft)
Adult Steelhead 20.3 0.23 9.07 0.18Adult Rainbow Trout 3.4 0.08 4.46 0.50Juvenile Salmonids 1.4 0.04 3.13 0.58
Flows Meeting Fish Passage Criteria
Fishxing Results for Culvert Section 1 of 2
Fish Speciesand Age Class
Insufficient Depth below
Excessive Velocity above
Excessive Outlet Drop
below
Flows Passable between Lower and Upper Fish Passage
FlowsAdult Steelhead 151.0 cfs 7.0 cfs 0.0 cfs 0%Adult Rainbow Trout 74.0 cfs 3.0 cfs 0.0 cfs 0%Juvenile Salmonids 33.0 cfs 0.0 cfs 15.0 cfs 0%
The Upper Gaviota culvert is a barrier to Adult Steelhead, Adult Resident Trout and Juvenile Salmonids at all flows. While there is a small window of acceptable velocity for Adult Steelhead and Trout, the depth is insufficient for an excessive length.
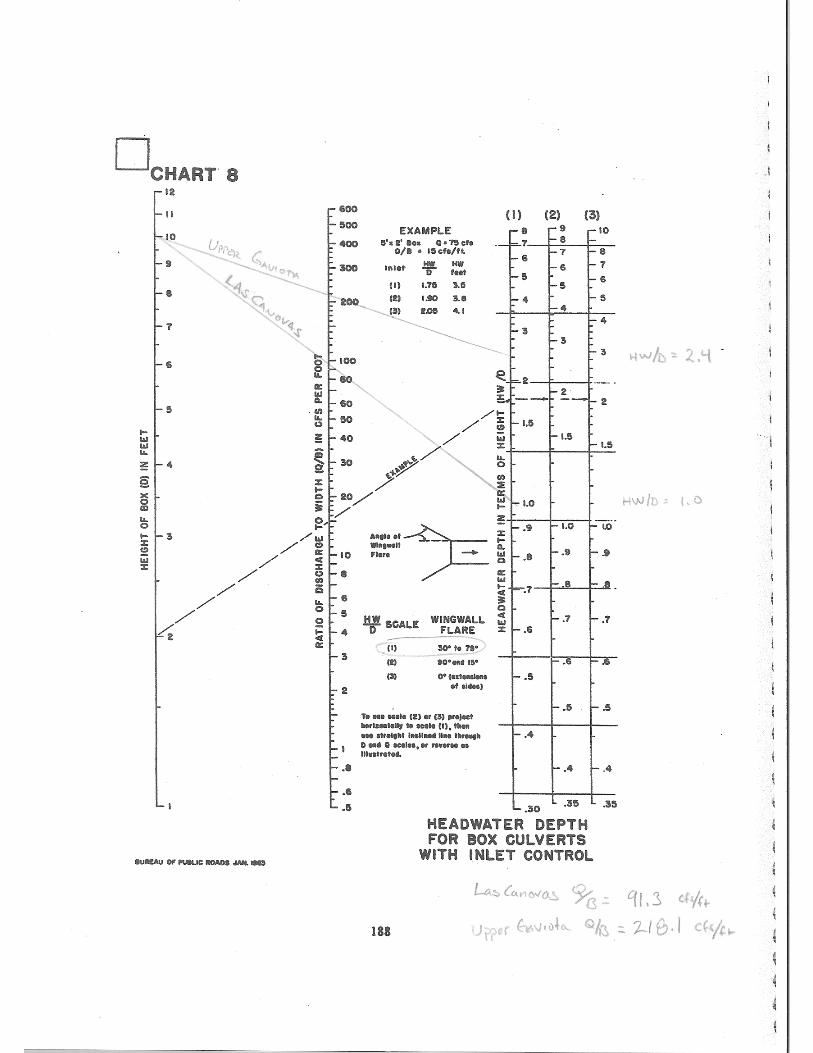

APPENDIX B
Hydrologic Calculations

Gaviota CreekSummary of Peak Flow Calculations
USGS Gage at Gaviota CreekDrainage Area (mi2) = 18.8
Mean Annual Precip. (in/yr) = 20.0
MethodQ-2yr(cfs)
Q-5yr(cfs)
Q-10yr(cfs)
Q-25yr(cfs)
Q-50yr(cfs)
Q-100yr(cfs)
Waananen & Crippen, 1977 * 148 605 1,210 2,681 4,244 6,033Local Streamflow Records 1,048 2,843 4,632 7,291 9,684 12,348
* Estimates using regional regression equations developed for the South Coast Region of California by the USGS (Waananen and Crippen, 1977):
A = drainage area (mi2),p = mean annual precipitation (in/yr), Mean annual precipitation was obtained from Parameter-elevation Regressions on Independent SlopesModel (PRISM). Data set provided by Oregon Climate Service (OCS) mapping program.
South Coast Region (SC)
Q2 = 0.14 * A0.72 * p1.62
Q5 = 0.40 * A0.77 * p1.69
Q10 = 0.63 * A0.79 * p1.75
Q25 = 1.10 * A0.81 * p1.81
Q50 = 1.50 * A0.82 * p1.85
Q100 = 1.95 * A0.83 * p1.87
Gaviota CreekFlood Frequency Estimates Using Two Methods
0
2,000
4,000
6,000
8,000
10,000
12,000
14,000
1 10 100Return Period, years
Flow
, cfs
Waananen & Crippen, 1977 * Local Streamflow Records
Gaviota Creek Fish Passage and Geomorphic Assessment Michael Love Associates
December 15, 2006

Gaviota Creek at Gaviota, Santa Barbara County, CAFlood Frequency Analysis Based on Local Streamflow Records
Drainage Record
Site NameArea(mi2)
Length(yrs) 2-yr (cfs) 5-yr (cfs)
10-yr (cfs/mi2)
25-yr (cfs/mi2)
50-yr (cfs/mi2)
100-yr (cfs/mi2)
GAVIOTA C NR GAVIOTA CA 34°29'16" 120°13'34" 18.8 20 1,048 2,843 4,632 7,291 9,684 12,348
Peak flows associated with the 2-yr, 25-yr, 50-yr, and 100-yr recurrence intervals were estimated using a Log-Pearson type III distribution as described in Bulletin 17B (Guidelines for Determining Flood Flow Frequency, USGS, 1982).
Location
Recurrence Interval of Peak Flows
Gaviota Creek at Gaviota, Santa Barbara County, CAFlood Frequency Analysis Based on Local Streamflow Records
0
2,000
4,000
6,000
8,000
10,000
12,000
14,000
1 10 100Return Period (Years)
Flow
per
Squ
are
Mile
(cfs
)
GAVIOTA C NR GAVIOTA CA
Gaviota Creek Fish Passage and Geomorphic Assessment Michael Love Associates
December 15, 2006

Flood Frequency based on Annual Maximum SeriesGAVIOTA C NR GAVIOTA CAStation # 11120550Drainage Area sq. mi 18.80Location: 34°29'16" 120°13'34" NAD27 Recurrence
Interval Dischage Discharge log-dischargeWY Date of Peak Discharge (cfs) RANK (years) (cfs) (cms) (cfs)1967 1/24/1967 4000 1 21.00 5270 149 3.721968 3/13/1968 94 2 10.50 4000 113 3.601969 2/24/1969 2340 3 7.00 3940 112 3.601970 3/4/1970 161 4 5.25 3470 98 3.541971 12/21/1970 318 5 4.20 2560 72 3.411972 12/27/1971 458 6 3.50 2560 72 3.411973 1/18/1973 3940 7 3.00 2340 66 3.371974 1/7/1974 1110 8 2.63 2050 58 3.311975 12/3/1974 2050 9 2.33 1730 49 3.241976 2/10/1976 1730 10 2.10 1290 37 3.111977 1/6/1977 96 11 1.91 1140 32 3.061978 3/4/1978 3470 12 1.75 1110 31 3.051979 3/27/1979 1290 13 1.62 776 22 2.891980 2/19/1980 2560 14 1.50 458 13 2.661981 3/1/1981 1140 15 1.40 439 12 2.641982 4/1/1982 227 16 1.31 318 9 2.501983 1/28/1983 5270 17 1.24 227 6 2.361984 12/25/1983 439 18 1.17 161 5 2.211985 12/19/1984 776 19 1.11 96 3 1.981986 2/14/1986 2560 20 1.05 94 3 1.97
Number of Years, n = 20Skewness = 0.86 0.86 -0.55
Mean= 1701 48 2.98Std Dev= 1532 43 0.55
GAVIOTA CREEK NEAR GAVOTA CA
0
2000
4000
6000
8000
10000
12000
14000
1 10 100
Recurrence Interval (years)
Dis
char
ge (c
fs)
Observed
Predicted (LPIII)
Gaviota Creek Fish Passage and Geomorphic Assessment Michael Love Associates
December 15, 2006

Peaks Flow FrequencyFrom USGS Data
Station # 11120550
Generalized Skew= -0.30 A= -0.28596Station Skewness (log Q)= -0.55 B= 0.79686
Station Mean (log Q)= 2.98 MSE (station skew) = 0.29797Station Std Dev (log Q)= 0.55
Weighted Skewness (Gw)= -0.43
Log Pearson Type III DistributionReturn Period Exceedence Log-Pearson Predicicted Discharge
(years) Probability K (cfs)1.2 0.833 -0.98230 2741.5 0.667 -0.37400 5952.0 0.500 0.07082 1,0482.33 0.429 0.24434 1,3065.0 0.200 0.85546 2,84310 0.100 1.23915 4,63225 0.040 1.59573 7,29150 0.020 1.81887 9,684100 0.010 2.00984 12,348
Values From K-Table for Linear interpolationWeighted Skewness -0.50 -0.40 -0.43
P K K K0.9 -1.32309 -1.31671 -1.318380.8 -0.80829 -0.81638 -0.814270.7 -0.45812 -0.47228 -0.468580.6 -0.17261 -0.18916 -0.18484
0.500 0.08302 0.06651 0.070820.429 0.25558 0.24037 0.244340.200 0.85653 0.85508 0.855460.100 1.26180 1.23114 1.239150.040 1.56740 1.60574 1.595730.020 1.77716 1.83361 1.818870.010 1.95472 2.02933 2.00984
Gaviota Creek Fish Passage and Geomorphic Assessment Michael Love Associates
December 15, 2006

Gaviota CreekFlow Duration Table and Curve
USGS Flow Gage Summary Exceedance* Q (cfs)Station Number 11120550 1% 114.96Stream Name Gaviota Creek 5% 19.00Latitude (ddmmss) 34°29'16" 10% 8.10Longitude (ddmmss) 120°13'34" 50% 0.76Record Length (years) 20 90% 0.09Coverage (WY) 1966-86 95% 0.03Drainage Area (sq. mi) 18.80 * % of time discharge is equaled or exceededMAP (in/yr) 19Ave Annual Runoff (in) 9.9Qave (cfs) 13.7
Flow Duration CurveGaviota Creek at USGS Gage
0.01
0.10
1.00
10.00
100.00
0% 10% 20% 30% 40% 50% 60% 70% 80% 90% 100%
% of time discharge is equalled or exceeded
Dis
char
ge (c
fs)
Q (cfs)
Drainage area = 18.80 mi2
Period of Record 1966-1986 (20-yr)
Gaviota Creek Fish Passage and Geomorphic Assessment Michael Love Associates
December 15, 2006

APPENDIX C
Channel Cross Sections

Cross Sections for Grade Controls Gaviota CreekLB > RB Looking upstream
TWC GA 2Pt Sta Elev Desc
286 0.00 70.19 TOP TR 285 5.29 57.49 ?283 12.62 57.08 HIGH TR282 19.06 54.39 TOP TR IN THICK WILLOW281 20.36 53.93 LAC280 24.45 51.89 LEW279 30.71 51.39 0278 35.02 51.17 0277 39.87 51.58 0276 44.20 51.81 REW GRAVEL COBBLE, SOME BLDRS275 57.14 52.47 0274 65.15 54.01 0273 73.89 56.93 TOE SAC272 78.15 58.35 TOP SAC271 78.73 61.52 0270 82.42 61.30 0269 89.04 63.90 TOE RB CONC WALL
Pool at GA2Pt Sta Elev Desc
359 0.00 52.92 LAC BDRX 343 8.07 51.89 LEW344 10.87 50.55 POOL LB TO RB345 11.08 47.28 0346 19.10 43.08 0347 27.79 42.88 0348 35.97 43.84 0349 42.57 48.33 BLDR DROP OFF350 42.66 51.88 REW351 52.95 66.91 RB RSP
GA2Pt Sta Elev Desc
297 0.00 70.23 CONC WEIR296 3.69 66.17 TOP RB295 7.97 59.81 GS RB294 8.99 56.16 GS RB298 15.40 55.82 CONC WEIR299 15.79 55.45 CONC WEIR300 15.84 55.44 CONC WEIR301 19.27 55.41 CONC WEIR302 22.01 54.47 CONC WEIR303 25.17 55.16 CONC WEIR304 33.31 56.05 CONC WEIR305 40.93 61.04 GS SAC306 41.67 62.85 GS SAC307 46.16 65.94 GS
324 8.99 54.40 BEDROCK323 11.78 52.10 TOE BEDRX322 15.29 51.85 COBBLE ON BDRX321 19.00 51.97 BDRX320 21.42 47.22 POOL319 23.35 47.36 SPILLWAY318 27.31 49.20 POOL317 27.98 51.74 CONC RUBBLE316 31.77 52.91 CONC RUBBLE315 34.39 52.97 TOE BELOW WEIR314 35.17 55.84 DS WEIR IN POOL LB
TWC GA2
45505560657075
0 20 40 60 80 100Station (ft) Left to Right Bank
Elev
atio
n (ft
)POOL GA2
40
50
60
70
0 20 40 60Station (ft) Left to Right Bank
Elev
atio
n (ft
)
GA2
40
50
60
70
80
0 10 20 30 40 50Station (ft) Left to Right Bank
Elev
atio
n (ft
)
Gaviota Creek Fish Passage and Geomorphic Assessment Michael Love Associates
December 15, 2006

GA3Pt Sta Elev Desc
394 0.00 71.16 BDRX393 5.90 58.43 TOE AT BDRX392 12.39 58.48 CONC390 25.29 58.24 SPILLWAY389 27.06 58.47 LEW388 32.51 58.89 TOE RSP391 37.14 57.31 REW386 44.61 71.57 GC2 RB TO LB TOE RSP
396 12.39 52.70 GS D/S OF GC2397 15.13 54.64 GS D/S OF GC2398 24.55 52.49 GS D/S OF GC2399 32.51 53.93 GS D/S OF GC2
TWC BLDR WRPt Sta Elev Desc0 0.00 87.80 RD0 2.00 75.00 BLDR0 22.00 71.96 Conc0 44.00 73.40 Conc0 46.00 87.00 TR
TWC for GA4 (BLDR WR)Pt Sta Elev Desc0 0.00 87.00 TR0 2.00 80.00 RB BLDR
453 5.00 75.26 TOP RB BOULDER WEIR452 13.47 73.27 TH TOP BOULDER WEIR W/4-5 TON BLDR456 22.66 74.51 LEFT0 27.66 77.00 LEFT0 29.66 87.00 RD
GA3
45
55
65
75
0 10 20 30 40 50Station (ft) Left to Right Bank
Elev
atio
n (ft
)TWC BLDR WR
65
75
85
95
0 10 20 30 40 50Station (ft) Left to Right Bank
Elev
atio
n (ft
)
TWC for GA4 (BLDR WR)
65
75
85
95
0 10 20 30 40Station (ft) Left to Right Bank
Elev
atio
n (ft
)
Gaviota Creek Fish Passage and Geomorphic Assessment Michael Love Associates
December 15, 2006

GA4Pt Sta Elev Desc
479 0.00 88.30 DS SIDE GA 4 TOP LB480 7.80 80.91 LB CONC481 16.68 79.91 CONC482 21.35 78.56 BLDR483 25.27 78.05 CONC DAM TOP 484 25.45 78.04 CONC485 30.03 77.58 SPILLWAY486 35.74 78.24 CONC487 43.26 79.90 CONC488 48.91 80.32 END CONC, TOE SAC489 49.55 80.99 SAC490 54.27 84.13 SAC491 59.36 90.21 TOP SAC492 70.37 93.60 EOP
494 22.00 69.22 POOL495 26.14 69.23 POOL496 32.21 71.40 POOL497 37.83 71.32 POOL
GA5Pt Sta Elev Desc
536 0.00 90.52 TOP BLDR RB LR, TOP IS 4' OVER 1' TO RIGHT, COULD REROUTE HERE535 3.50 84.58 BLDR LB533 8.44 84.04 BLDR532 15.74 83.45 CONC AT BLDR KEY531 19.69 82.87 CONC530 25.40 82.54 CONC529 28.36 82.64 CONC528 35.83 82.86 DS GC4 LB TOE SAC, USE PREVIOUS FOR TOP
47 100 EOP Faked541 8.44 81.52 RB TOE 540 15.78 79.66 0539 22.94 78.06538 27.30 78.10537 35.05 82.83 DS TOE XS GC4 IN POOL LB TO RB BOOT SHOULD BE 11.18 NOT 7.18
GA6Pt Sta Elev Desc
590 0.00 102.30 DS LIP GC5 LB ON SLOPE591 5.93 94.97 TOP XPOSED BDRX592 12.88 85.11 RB GC6593 22.50 84.92 TH594 30.80 85.08 BLDR EDGE CONC596 36.07 85.29 TOP BLDR IN CONC597 40.58 85.34 TOE GC5598 46.34 94.00 TOP SAC599 56.19 103.56 TOP EOP
600 14.88 82.93 LB TOE IN POOL601 22.44 81.67 TH TOE602 29.82 80.95 TOE DS GC5 POOL603 37.00 82.19 TOE INTERSECTION WITH SAC
BLDR JAMPt Sta Elev Desc
729 0.00 153.51 BLDR TOP LB728 5.17 147.53 BLDR727 6.66 142.27 BLDR726 12.98 143.23 NOTCH LOW POINT IN JAM725 19.36 146.80 TOP BLDR724 25.43 141.63 ?723 33.80 145.38 ?722 41.16 142.91 0721 43.53 147.26 0720 44.61 147.45 TOP BLDR719 49.26 147.85 TOP HIGHEST BLDR (8')718 53.05 146.88 CONC HITS BLDR717 59.40 149.23 TOE WALL715 59.64 155.47 TOP VERT RB CONC WALL
GA4
65
75
85
95
0 20 40 60 80Station (ft) Left to Right Bank
Elev
atio
n (ft
)GA5
707580859095
100105
0 10 20 30 40 50Station (ft) Left to Right Bank
Elev
atio
n (ft
)
GA6
7580859095
100105110
0 20 40 60Station (ft) Left to Right Bank
Elev
atio
n (ft
)
BOULDER JAM
130
140
150
160
0 20 40 60 80Station (ft) Left to Right Bank
Elev
atio
n (ft
)
Gaviota Creek Fish Passage and Geomorphic Assessment Michael Love Associates
December 15, 2006

TWC GA7Pt Sta Elev Desc
769 0.00 161.63 ALMOST TOB768 3.76 152.27 BLDR TOE BANK767 7.49 151.97 BLDR766 9.66 148.98 LAC WILLOW765 18.51 148.66 WILLOW764 24.02 148.32 BLDR763 26.41 147.90 LEW BLDR762 28.13 147.37 BLDR761 31.51 146.58 GRAVEL TH760 33.18 146.94 GRAVEL759 36.15 147.24 GRAVEL758 37.97 147.88 REW757 39.90 148.61 GRAVEL756 43.41 148.51 RAC SAND755 66.29 162.21 TW GC6 LB RSP 8' OVER AND UP TO RD
GA7Pt Sta Elev Desc
778 0.00 153.31 CONC LT WR777 2.05 151.91776 16.84 152.19 CONC775 30.68 151.94 DS EDGE GC6774 49.92 152.40 CONC PK NAIL773 62.18 152.56 CORNER CONC772 72.76 154.50771 79.28 160.71 RB GC6
782 7.50 146.60 DS GC 6783 18.33 146.63 DS GC 6784 24.99 146.21 SPILLWAY TH D=1.5'785 32.24 147.13786 37.50 147.64 1' TO LEFT TO TWO 9" IRON PIPES787 44.47 148.36 GS GC788 52.80 151.88 GS GC
XS CHPt Sta Elev Desc
0 182.67 to EOP830 30.00 182.67 TOP FILL SLOPE GOES LEVEL FOR 30' TO EOP829 40.10 173.73 TOE FILL SLOPE828 50.61 168.79 LAC827 64.16 165.32 TOP ROOT826 66.37 161.18 TOE LARGE ALDER825 73.34 163.17 GRAVEL BAR824 86.86 161.79 TH823 89.41 161.55 TOE SAC822 107.51 178.74 TOP SAC FILL SLOPE RD 5' AT 1:1 SLOPE
TWC for GA8Pt Sta Elev Desc
902 0.00 202.93 LB BDRX 6' UP TO ROAD901 3.47 193.44 US END RSP900 3.58 189.24 LAC899 17.65 189.94 TOP BLDR898 21.50 186.77 BLDR TOE897 24.91 186.27 TH D=0.5896 34.32 187.43 CH894 44.42 188.66 RAC893 47.91 195.10 RB BLDR892 69.78 206.79 TWC FOR GC7 RB NID SLOPE BLDR
TWC GA7
140145150155160165170175
0 20 40 60 80Station (ft) Left to Right Bank
Elev
atio
n (ft
)
GA7
140145150155160165170175
0 20 40 60 80 100Station (ft) Left to Right Bank
Elev
atio
n (ft
)
XS CH
155160165170175180185190
0 50 100 150Station (ft) Left to Right Bank
Elev
atio
n (ft
)
TWC GA8
180
185
190
195
200
205
210
215
0 10 20 30 40 50 60 70 80
Station (ft) Left to Right Bank
Elev
atio
n (ft
)
Gaviota Creek Fish Passage and Geomorphic Assessment Michael Love Associates
December 15, 2006

GA8Pt Sta Elev Desc
903 0.00 210.09 US SIDE OF GC7 TOP ROAD FILL EOP904 17.50 194.66 TOP SAC 905 20.48 190.27 TOE SAC US EDGE GC906 31.20 190.41 RT SIDE BLDR IN WR907 33.20 190.51 CNTR BLDR STICKS UP 2.5 '908 36.10 189.55909 44.27 190.31 TH D=2.5910 52.38 190.70 LT GC911 59.02 194.43 LAC912 59.03 199.61 LB UP TO RD 30' AT 1:1 SLOPE
920 23.50 185.94 DS GC7 IN POOL RB921 28.55 186.54 DS GC7 IN POOL922 36.23 185.53 DS GC7 IN POOL923 43.28 184.76 DS GC7 IN POOL924 55.43 187.11 RAC DS OF GC7 IN POOL
GA9Pt Sta Elev Desc
940 0.00 200.00 LB TOP SAC RD 10' UP 1:1 SLOPE941 10.06 191.31 LT EDGE GC8 US942 17.31 190.76 TH943 29.59 191.58 RT GC8944 38.36 193.14 RAC946 42.34 199.44 LB SLOPING HILL
950 10.00 190.24 TOE SAC RT SIDE949 16.83 187.41 DS EDGE GC8948 23.71 188.03 DS EDGE GC8947 26.87 190.42 DS LT EDGE GC8
GA10Pt Sta Elev Desc
964 0.00 202.16 LB TOP SAC 965 10.43 192.92 TOE SAC EDGE GC966 17.59 192.05 CL FL GC967 28.13 192.90 EDGE CONC GC LB968 29.01 190.79 DROP EGDE CONC969 35.59 192.88 RAC970 36.56 199.67 ROCK WALL RB971 42.65 208.09 ROCK WALL LB 12' TO TOP
974 12.43 190.28 GS TOE SAC973 19.30 190.39 GS DS GC CL TH972 26.37 189.48 GS DS GC LB TO RB
GA11Pt Sta Elev Desc
1012 0.00 200.52 DS END GC SAC LB1014 6.50 194.75 TOE SAC LAC1015 15.18 193.49 CL GC1016 16.78 194.36 GC1017 27.41 194.72 RT EDGE CONC
1021 6.50 190.08 TOE DS GC 1020 9.94 189.73 2.5 DS GC1019 15.77 189.96 TH
GA8
180
185
190
195
200
205
210
215
0 10 20 30 40 50 60 70
Station (ft) Left to Right Bank
Elev
atio
n (ft
)
GA9
180185190195200205210215
0 10 20 30 40 50
Station (ft) Left to Right Bank
Elev
atio
n (ft
)
GA10
180
185
190
195
200
205
210
215
0 10 20 30 40 50
Station (ft) Left to Right Bank
Elev
atio
n (ft
)
GA11
180
185
190
195
200
205
210
215
0 5 10 15 20 25 30
Station (ft) Left to Right Bank
Elev
atio
n (ft
)
Gaviota Creek Fish Passage and Geomorphic Assessment Michael Love Associates
December 15, 2006

TWC GA12Pt Sta Elev Desc
1022 0.00 205.66 LB TOP SAC1024 10.76 196.62 TOE SAC1025 13.23 196.39 TOP FOOTING1026 13.51 193.55 TOE RAC1027 17.92 192.95 TH D=1' 1028 26.54 191.90 CH1029 33.39 193.45 CH 1030 40.90 197.74 RAC1031 43.32 208.58 RB VERT CLIFF
GA12Pt Sta Elev Desc
1032 0.00 205.55 TOP SAC LB1034 10.26 198.40 TOE SAC1035 11.46 196.09 LT EDGE WR1036 18.09 195.94 GC1037 20.36 195.11 SPILLWAY TH 1038 22.94 195.56 GC RIGHT EDGE1039 26.79 197.65 TOP BLDR1040 31.11 203.48 ON SLOPE
1043 16.00 192.18 DS GC LT1042 19.51 191.89 DS GC CENTER1041 22.61 193.18 DS GC RT
TWC GA13Pt Sta Elev Desc
1083 0.00 205.69 BDRX GOES UP 12' AT 1:1 SLOPE TO HWY1084 4.24 200.89 BDRX1085 11.45 199.18 BDRX1086 14.82 201.28 BDRX1087 18.02 197.83 BDRX1088 21.06 197.21 TWC 1089 26.92 201.43 BDRX1090 29.45 200.57 GRAVEL BAR1091 49.03 203.07 TOE LB1092 59.63 214.59 ON SLOPE
GA13Pt Sta Elev Desc
1068 0.00 216.32 LB BDRX SLOPE 1069 5.34 210.43 BDRX 1070 15.34 206.15 BDRX1071 20.96 202.57 LT WR1074 42.02 202.56 RT DS EDGE, TOE SAC1075 50.09 200.77 TOP SAC
60.00 210.00 fake
1080 21.00 194.18 DS RT EDGE OF GC AND TOE SAC1079 25.23 194.38 DS GC1078 29.69 194.00 DS GC1077 34.72 195.69 DS GC1076 39.28 196.72 LT DS GC
TWC GA12
180
185
190
195
200
205
210
215
0 10 20 30 40 50
Station (ft) Left to Right Bank
Elev
atio
n (ft
)
GA12
180
185190
195
200
205210
215
0 5 10 15 20 25 30 35
Station (ft) Left to Right Bank
Elev
atio
n (ft
)
TWC GA13
190
195200
205
210
215220
225
0 10 20 30 40 50 60 70
Station (ft) Left to Right Bank
Elev
atio
n (ft
)
GA13
190195200205210215220225
0 10 20 30 40 50 60 70
Station (ft) Left to Right Bank
Elev
atio
n (ft
)
Gaviota Creek Fish Passage and Geomorphic Assessment Michael Love Associates
December 15, 2006