clear creek dam fish passage assessment - u.s. … creek dam fish passage assessment final report...
TRANSCRIPT

Clear Creek Dam Fish Passage Assessment FINAL REPORT
Jeff A. Thomas and Patrick Monk
U.S. Fish and Wildlife Service
Mid-Columbia River Fishery Resource Office
Yakima Sub-Office

Clear Creek Dam Fish Passage Assessment Final Report
ii
On the cover: Aerial photograph of Clear Creek Dam and spillway on the North Fork Tieton River, Yakima County, WA (courtesy of Google Earth).
The correct citation for this report is:
Thomas, J.A. and P. Monk. 2016. Final Report for the Clear Creek Dam Fish Passage Assessment. United
States Fish and Wildlife Service, Mid-Columbia River Fishery Resource Office, Yakima Sub-Office. Yakima,
WA.

Clear Creek Dam Fish Passage Assessment Final Report
iii
Clear Creek Dam Fish Passage Assessment
Study funded by
U.S. Bureau of Reclamation
Yakima River Basin Water Enhancement Project Columbia Cascades Area Office
Interagency Agreement #R13-PG-13-416
conducted under
Section 10 of the Endangered Species Act of 1973 Permit TE-702631 Sub-permit MCFRO-13
and authored by
Jeff A. Thomas (USFWS) Patrick Monk (USFWS)
U.S. Fish and Wildlife Service
Mid-Columbia River Fishery Resource Office Yakima Sub-Office Yakima, WA 98901
Final April 1, 2016

Clear Creek Dam Fish Passage Assessment Final Report
iv
Disclaimers Any findings and conclusions presented in this report are those of the authors and may not necessarily represent the views of the U.S. Fish and Wildlife Service. The mention of trade names or commercial products in this report does not constitute endorsement or recommendation for use by the federal government.
Clear Creek Dam Fish Passage Assessment Final Report
v
Clear Creek Dam Fish Passage Assessment
Jeff A. Thomas and Patrick Monk
U.S. Fish and Wildlife Service Mid-Columbia River Fishery Resource Office
Yakima Sub-Office 1917 Marsh Road
Yakima, WA 98901
Abstract- Clear Creek Dam, owned and operated by the U.S. Bureau of Reclamation, impounds a small reservoir on the North Fork Tieton River in Yakima County, Washington. The dam, originally built in 1914 without fish passage, was reconstructed in 1992. At that time two fish ladders were also constructed in the adjacent spillway channel, the only migration route past the dam. Because these ladders were not designed to fish passage criteria, uncertainty remained over the ability of fish to migrate past the dam, especially adult Bull Trout (Salvelinus confluentus) which were listed as threatened under the Endangered Species Act in 1998. Forty-four adult Bull Trout and seven hybrids (Bull Trout x Brook Trout) were captured and implanted with HDX PIT tags from September, 2012 through early July, 2015. Twenty-nine of these fish were captured in a picket-weir box trap located on the North Fork Tieton River 6.75 miles upstream of Clear Lake and 22 were caught while angling in the stilling basin directly below Clear Creek Dam. Genetic samples were obtained from all captured fish. The movement of tagged Bull Trout was monitored for four years utilizing four PIT tag interrogation sites established in the spillway channel and upper fish ladder and one site located in the North Fork Tieton River above the lake. Only four of the 29 Bull Trout tagged at the trap were confirmed to have migrated downstream of Clear Lake after spawning, the rest appeared to reside in the lake. Only one of 26 fish, which included the 22 tagged below the dam and the four confirmed to have left Clear Lake after spawning, was able to successfully migrate up the spillway channel and it was a hybrid. Seven, all pure Bull Trout, were confirmed to have attempted the ascent but failed. A combination of factors affects the ability of Bull Trout to successfully migrate up the spillway channel. Extreme hydraulic conditions occur in the channel over a wide range of spillway flows and high water temperatures, well in excess of those considered to limit Bull Trout distribution (>15°C), likely deter adult Bull Trout from entering the spillway channel from late-spring through early September. These fish instead follow the much colder water released from Clear Creek Dam to the large stilling basin below it. The number of North Fork Tieton Bull Trout currently isolated below Clear Creek Dam is significant, perhaps equaling or exceeding the number which currently spawn above it.

Clear Creek Dam Fish Passage Assessment Final Report
vi
Page intentionally left blank for 2-sided printing

Clear Creek Dam Fish Passage Assessment Final Report
vii
Contents
Foreword ................................................................................................................................................... 1
Introduction .............................................................................................................................................. 1
Study Area ................................................................................................................................................. 2
North Fork Tieton Bull Trout ..................................................................................................................... 3
Population Monitoring History ............................................................................................................. 3
Population Distribution and Life History ............................................................................................... 4
Population Trend ................................................................................................................................... 5
Population Status .................................................................................................................................. 5
Study History and Funding ........................................................................................................................ 5
Study Goals and Objectives ....................................................................................................................... 6
Methods .................................................................................................................................................... 6
General Description ............................................................................................................................... 6
Trap Location ........................................................................................................................................ 7
Trap Construction and Installation...................................................................................................... 10
Antenna Construction and Installation ............................................................................................... 11
Antenna Performance ......................................................................................................................... 13
Trapping .............................................................................................................................................. 17
PIT tagging and Genetic Sampling ...................................................................................................... 17
Hook-and-Line Sampling ..................................................................................................................... 18
Water Temperature Monitoring ......................................................................................................... 18
Results ..................................................................................................................................................... 18
Trapping Operation ............................................................................................................................. 18
PIT Tagging (trap) ............................................................................................................................... 22
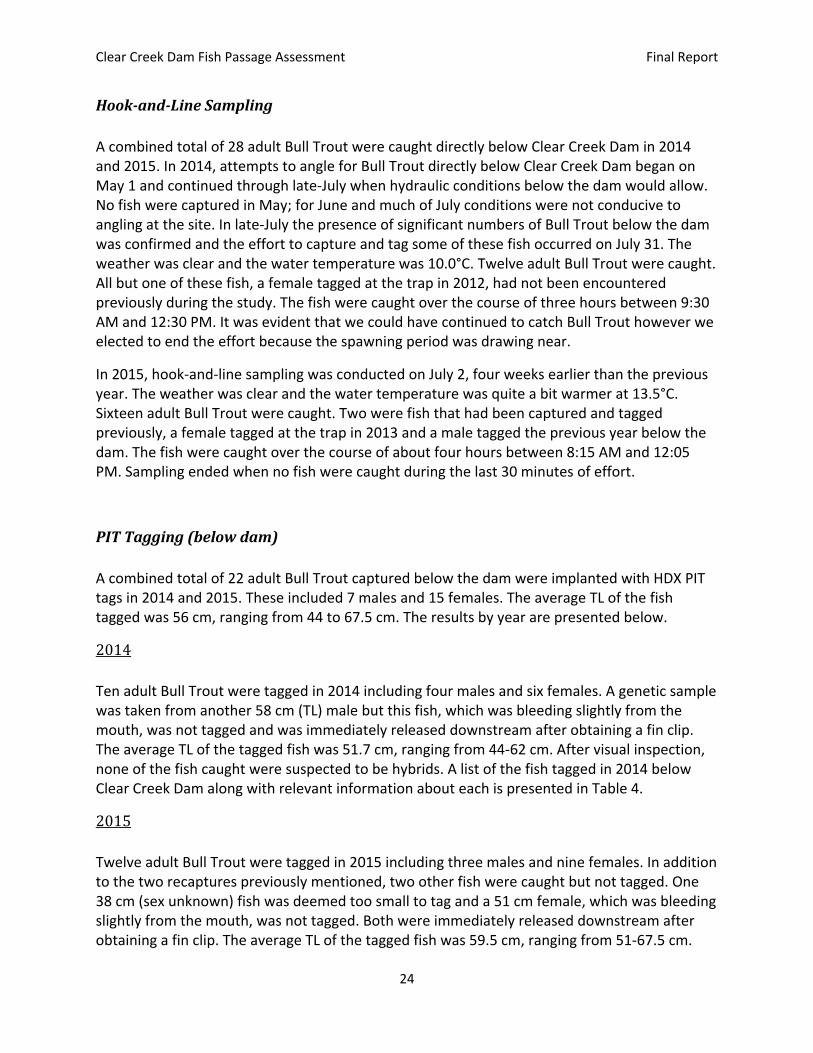
Hook-and-Line Sampling ..................................................................................................................... 24
PIT Tagging (below dam) .................................................................................................................... 24
Genetic Analyses ................................................................................................................................. 26
Water Temperatures ........................................................................................................................... 27
PIT Tag Detections .............................................................................................................................. 30

Clear Creek Dam Fish Passage Assessment Final Report
viii
Effective Population Size ..................................................................................................................... 34
Estimated Population Size ................................................................................................................... 35
Discussion................................................................................................................................................ 35
Acknowledgements ................................................................................................................................. 38
Literature Cited ....................................................................................................................................... 39
Appendix A .................................................................................................................................................. 42
Appendix B .................................................................................................................................................. 46
Appendix C .................................................................................................................................................. 49
Appendix D .................................................................................................................................................. 52

Clear Creek Dam Fish Passage Assessment Final Report
ix
List of Figures
Figure 1. Locations of four of the PIT tag detection arrays (antennas) utilized in the Clear Creek Dam Fish
Passage Assessment. These arrays were established at the upper and lower end of the spillway channel
and in the pool-and-weir fish ladder. ........................................................................................................... 8
Figure 2. Location of the PIT tag detection array (antenna) established in the North Fork Tieton River 0.8
mile upstream of Clear Lake and the trap used to capture bull trout which was 6.75 miles upstream of
the lake. ........................................................................................................................................................ 9
Figure 3. NF Tieton River fish trap after the high flow event on September 22, 2013. The photo was
taken the next day after the river had receded. ......................................................................................... 21
Figure 4. NF Tieton River fish trap during the high flow event which occurred at the end of September,
2013. This photo was taken the morning of September 29. ...................................................................... 21
Figure 5. Dorsal fin of an adult Bull Trout suspected of being a hybrid (Bull Trout x brook trout) which
was caught below Clear Creek Dam on July 2, 2015. Note the spots on the fin. The dorsal ..................... 25
Figure 6. Average daily water temperatures (°C) from late-July through the end of October, 2013 in the
spillway and outlet channels of Clear Creek Dam on the lower NF Tieton River ....................................... 28
Figure 7. Average daily water temperatures (°C) from August 1 through the end of October, 2014 in the
spillway and outlet channels of Clear Creek Dam on the lower NF Tieton River ....................................... 29
Figure 8. Average daily water temperatures (°C) from April 23 through the end of October, 2015 in the
spillway and outlet channels of Clear Creek Dam on the lower NF Tieton River ....................................... 30

Clear Creek Dam Fish Passage Assessment Final Report
x
List of Tables Table 1. Adult Bull Trout captured and PIT tagged in the
NF Tieton River in September, 2012………………………………………………………………………………….23 Table 2. Adult Bull Trout captured and PIT tagged in the
NF Tieton River in September, 2013………………………………………………………………………………….23 Table 3. Adult Bull Trout captured and PIT tagged in the
NF Tieton River in September, 2014………………………………………………………………………………….23 Table 4. Adult Bull Trout captured and PIT tagged below
Clear Creek Dam on July 31, 2014………………………………………………………………………………………25 Table 5. Adult Bull Trout captured and PIT tagged below Clear Creek Dam on July 2, 2015…………………………………………………………………………………………26 Table 6. Hybrids (Bull Trout x brook trout) which were captured during the course of this study…………………………………………………………………………….26
Clear Creek Dam Fish Passage Assessment Final Report
1
Foreword
The Clear Creek Dam Fish Passage Assessment is a cooperative investigation conducted by staff from the U.S. Fish and Wildlife Service’s Mid-Columbia River Fishery Resource Office (Yakima Sub-Office), the U.S. Bureau of Reclamation’s Columbia-Cascades Area Office, and the Washington Department of Fish and Wildlife (Region 3). The USFWS is the lead agency for the investigation which began in early 2012 and continued through the end of 2015. Three annual progress reports have been prepared during the course of this study. These reports provide greater detail on certain aspects of this investigation then will be presented in this report. This is the final report for the assessment although efforts will continue to monitor the North Fork (NF) Tieton River Bull Trout (Salvelinus confluentus) population.
Introduction
The population of Bull Trout which spawns in the NF Tieton River in Yakima County, Washington was not officially recognized until 2004 when biologists observed adult, sub-adult, and juvenile Bull Trout and documented spawning activity for the first time during a comprehensive fish census (USFWS 2005). This census occurred above Clear Lake, a relatively small (4,400 acre-feet) impoundment formed when Clear Creek Dam was constructed on the NF Tieton River in 1914. Clear Creek Dam is located slightly less than one kilometer above Rimrock Lake, a much larger (198,000 acre-feet) reservoir impounded by Tieton Dam in 1925. Both of these dams were constructed by the U.S. Bureau of Reclamation (Reclamation) and are operated by the agency’s Yakima Field Office (YFO). There are two additional Bull Trout populations found above Tieton Dam which spawn in separate tributaries of Rimrock Lake, one in the South Fork Tieton River and the other in Indian Creek. To date it has been assumed that adults from the NF Tieton population also reside in Rimrock Lake when not spawning or migrating. All three of these Bull Trout populations display an adfluvial life history type. However, they undoubtedly had fluvial/ resident origins since neither Clear or Rimrock lakes were natural water bodies prior to impoundment. Clear Creek and Tieton dams were constructed without fish passage facilities. Consequently, upon their completion anadromous salmonids were excluded from habitat upstream and resident fish populations above the dams were isolated. While Tieton Dam remains impassable, two fish ladders were constructed in the bedrock spillway channel of Clear Creek Dam in 1992. The lower “ladder” is actually a series of four denil ladders interspaced with resting pools located on the right bank of the spillway. The slopes of the four ladder sections range from 12.5 to 45 percent. The upper ladder is a pool-and-weir design and located on the left side of the spillway channel consisting of 11 weirs with a two-foot hydraulic drop from weir to weir. The pool-and-weir ladder, while not built to current criteria, is functional but this is not the case for the denil ladder. It is considered too steep and does not meet accepted criteria (USBR 2004) so it may have never passed fish with much success. It most certainly does not now as it has not

Clear Creek Dam Fish Passage Assessment Final Report
2
been maintained in years and is completely clogged with gravel. Photographs of the spillway channel and both ladders are presented in Appendix A. Without the benefit of a functioning ladder in the lower spillway channel, passage up the channel for migrating fish was considered difficult at best. This channel, blasted out of bedrock, is approximately 540 feet long with three distinct segments based on gradient. The lower segment is approximately 240 feet long with an average gradient of 15 percent. The upper segment, at 140 feet, is shorter and steeper with an average gradient of 21 percent but this is somewhat deceiving because the gradient in the lower 70 feet of the segment is 35 percent. In between these two segments is a lower gradient section (~8%) approximately 160 feet long which extends from the exit of the denil ladder to just below the entrance to the first pool of the upper ladder. The extent to which it is possible for Bull Trout to swim up the lower section of the spillway channel is unknown. Hydraulic conditions vary drastically depending on the volume of discharge coming down the spillway. Therefore, so does one’s judgment as to whether fish could successfully swim up the channel. It was strongly suspected that fish could not ascend the lower segment at high flows. In July, 2011 two Bull Trout were observed trying repeatedly without success. Photographs of hydraulic conditions in the spillway channel over a range of flows are presented in Appendix A. In addition to the physical challenges of swimming up the spillway it has been hypothesized that migrating NF Tieton adults are not inclined to enter the spillway channel during summer months because water temperatures are too warm. According to this hypothesis these fish instead swim up the adjacent channel to the base of Clear Creek Dam where colder water is released and there they hold (Figure 1). Prior to this assessment this hypothesis has not been validated. Interest in modifying the existing fish ladders at Clear Creek Dam began in 1999 when the YFO contracted with an engineering firm to conduct an evaluation. The firm’s report (Harza 2000) described the ladder’s deficiencies but resulted in no immediate action to correct them. Interest was rekindled in 2003 and Reclamation’s Pacific Northwest Region Design Group produced three pre-design planning documents between June 2004 and August 2005 detailing several fish passage design alternatives at the dam (USBR 2004, USBR 2005, and USBR 2005a). All of these alternatives were expensive and funding has not been pursued, in part because uncertainty remained over passage conditions on the spillway. In March 2004 a panel convened to review the fish ladder designs suggested the lower spillway channel might allow for adult Bull Trout passage under certain flow conditions (K. Bates, personal communication, 2004). Improved passage at the dam is included as an action in the recently completed Yakima River Basin Integrated Water Resource Management Plan (July 2011). However, actions contained in this plan still must go through a lengthy process to receive authorization and funding.
Study Area
The NF Tieton River flows into Rimrock Reservoir at its western end. The river originates in the Goat Rocks Wilderness Area and flows for 13.4 miles before entering Clear Lake. A waterfall
Clear Creek Dam Fish Passage Assessment Final Report
3
exists 10.5 miles upstream of Clear Lake which is an impassable barrier to migratory fish. The wilderness boundary is approximately 4.25 miles below this waterfall with the remaining 6.25 miles of the river located in the Okanogan-Wenatchee National Forest. Several small tributary streams enter the NF Tieton River above Clear Lake, the largest being Scatter Creek. Clear Creek, which was once the most significant tributary of the river, now flows into Clear Lake from the west. The NF Tieton River is designated Critical Habitat for Bull Trout (69 Fed. Reg. 60070; October 6, 2004). The NF Tieton is one of the higher elevation streams inhabited by Bull Trout in the Yakima Basin. Elevations range from 3,000 feet (mean sea level) where it enters Clear Lake to about 3,700 feet at the barrier waterfall. Forest Service road 1207 parallels the river for most of its length below the wilderness boundary but is rarely close to it and thick forest separates the two. The main human activity in the watershed is recreation—primarily hiking and horseback riding on trails that are not near the river’s banks. There are no established campgrounds; dispersed campsites are limited and not in close proximity to the riverbanks. Timber harvest occurred in the past but well upslope of the stream. The area is now designated as Late Successional Reserve and will receive very little, if any, future harvest. Road density in the drainage is low and livestock grazing does not occur. In short, the NF Tieton River is undisturbed above the wilderness boundary and for the most part, below it as well.
North Fork Tieton Bull Trout
Population Monitoring History
WDFW catch records from the 1950’s documented the presence of Bull Trout (then referred to as Dolly Varden) in Clear Lake but the first organized investigation of Bull Trout in the NF Tieton River appears to have occurred much later. While not an investigation of this population per se, a fish salvage was conducted in August, 1992 behind a coffer dam constructed directly below Clear Creek Dam during reconstruction work. The capture of “well over one hundred” Bull Trout was reported. These fish ranged in size from 10 – 29.5 inches (fork length) with the majority from 15-20 inches (WDFW 1992). In 1994 Central Washington University coordinated with WDFW to monitor the effectiveness of the fish ladders constructed in the spillway channel of Clear Creek Dam two years previous. No Bull Trout were observed in the ladders but nine adult Bull Trout were captured and floy-tagged below the base of the dam. It was assumed that these fish were attempting to find a migration route upstream and would have thus belonged to the NF Tieton population, however there was no record of them being observed or captured again to confirm that. Two years later an adult Bull Trout was observed in the NF Tieton River about six miles above Clear Lake during a snorkel survey (Craig 1996).
The fish census that led to official recognition of the NF Tieton population was conducted cooperatively by the USFWS and USFS in September, 2004. The night-snorkeling effort documented the presence of 14 Bull Trout including seven juveniles (<199 mm TL), five that
Clear Creek Dam Fish Passage Assessment Final Report
4
were considered sub-adults (200-299 mm TL), and two large (>500 mm TL) adults (USFWS 2005). Genetic samples (fin clips) were obtained from 11 fish, six of which proved to be Bull Trout. Five fish which were suspected hybrids turned out to be pure Brook Trout (Salvelinus fontinalis) which are abundant in the watershed. In addition, spawning activity was confirmed with the discovery of a single redd and two adults observed about a half-mile below the waterfall.
WDFW radio-tracked five adult Bull Trout tagged in the NF Tieton River below Clear Creek Dam in July 2005. These fish all migrated downstream to Rimrock Lake by late fall to overwinter and returned to the area near the mouth of the river by early June the following year. Only one of these fish eventually entered the river but it did not attempt to ascend the spillway channel (Mizell and Anderson 2008). Just one of the Bull Trout tagged below Clear Creek Dam in 2005 genetically assigned to the NF Tieton population (Small and Martinez 2011). The others assigned to either the Indian Creek or South Fork Tieton River populations.
Bull Trout residing in Rimrock Lake are subject to entrainment through the unscreened outlet works of Tieton Dam. Entrainment was documented during three years of studies conducted in the early 2000’s. In 2005, 37 Bull Trout were collected from the stilling basin directly below Tieton Dam in a fish salvage operation conducted during the construction of the Tieton hydroelectric project. An analysis of genetic samples taken from those fish revealed that two assigned to the NF Tieton population (Small and Hawkins 2009). In 2010, snorkel surveys coordinated by the USFWS were successful in collecting enough genetic samples from juvenile Bull Trout to supplement those obtained previously and enable an analysis of the genetic uniqueness of the NF Tieton Bull Trout population. Results indicated that this population is genetically distinct from all other populations in the Yakima Basin including the other adfluvial populations residing in Rimrock Lake (Small and Martinez 2011). Three of the genetic samples analyzed were identified as Brook Trout/Bull Trout hybrids. In 2011, the Bull Trout Task Force conducted creel surveys at Clear Lake during the summer. Fifty five anglers were interviewed and no Bull Trout were reportedly caught by any of them (WDFW 2011). Previous creel surveys and observations by WDFW biologists during annual fishing derbies also indicate that Bull Trout are not commonly caught in Clear Lake despite heavy fishing pressure throughout the summer season (E. Anderson, WDFW, pers. comm.).
Population Distribution and Life History
From data collected to date it appears that all spawning activity occurs above the wilderness boundary with most occurring in the reach extending from the waterfall downstream for approximately two miles. Over the last seven years Bull Trout have also been observed spawning in a very small unnamed tributary which enters the river from the west in this two-mile reach. Spawning occurs during the month of September. The migration timing for adult Bull Trout entering the NF Tieton River prior to spawning and that for post-spawn fish leaving the river was unknown prior to this investigation.

Clear Creek Dam Fish Passage Assessment Final Report
5
Juvenile rearing likely occurs throughout the NF Tieton River above Clear Lake but most juvenile observations thus far have been above the wilderness boundary. It was assumed that the primary FMO (foraging, migrating and overwinter) habitat for adults and sub-adults was Rimrock Lake prior to this investigation.
Population Trend
As is the case for all Bull Trout populations in the Yakima basin, annual redd counts are relied upon to ascertain a population trend. Beside the fact that the database for the NF Tieton population is relatively recent there have been other difficulties which have limited the ability to determine a trend for this population. The river is fed by glaciers and is usually turbid with glacial flour until late in the summer. Its hydrology is “flashy” and river discharge quickly changes from stable and clear to high and turbid after fall rains or high daytime temperatures. Both of are common during the Bull Trout spawning period. This results not only in difficult survey conditions but also in situations where redds become undetectable if an event occurs before or between surveys. Although the first redd was observed in the NF Tieton in 2004 a complete survey was not accomplished until 2007. The surveys conducted in 2009, 2010, 2013 and 2014 were incomplete. During the five years that complete surveys were conducted the number of redds counted was 37, 28, 11, 17 and 27 (in 2007, 2008, 2011, 2012 and 2015, respectively). A distinct population trend is not discernable from these data.
Population Status
Due to its relatively recent recognition, the status of this population has not been rated by either the WDFW or the USFWS. Based on limited redd count data it appears to be depressed but this determination should not be considered final.
Study History and Funding
The USFWS Mid-Columbia River Fishery Resource Office (Yakima Sub-office) began submitting study proposals to investigate fish passage conditions at Clear Creek Dam in 2008. These proposals were submitted annually and sought funding through various sources for money that was limited and for which competition was heavy. The proposal did not receive funding for four consecutive years. Concurrently, Reclamation’s Yakima Field Office (YFO) was seeking agency funding targeted for various ESA-related activities. In late 2011, they learned that funding was available to initiate this study and approached the USFWS about collaborating on the effort. Biologists with Region 3 of WDFW had been supportive of the proposed study through the years that funding was not approved. When informed that funding had been acquired to initiate the assessment, the Regional Office offered staff time and materials. The Washington Department of Ecology provided supplemental funding to WDFW to modify the fish trap used in the study. In addition to the initial funding secured in 2011, Reclamation’s Yakima River Basin Water Enhancement Project (YRBWEP) has contributed significantly towards the assessment. The study is being managed by the USFWS.
Clear Creek Dam Fish Passage Assessment Final Report
6
Study Goals and Objectives
The ultimate goal of this study is to ensure that the population of Bull Trout which spawns in the NF Tieton River can successfully reach spawning habitat above Clear Creek Dam. It is not believed this population currently has such access on a consistent basis. Not only is this a current problem but the severity of it may increase in the future. Climate change models developed for the Pacific Northwest are consistent in predicting warmer winters and decreased snowpack. It is essential that cold-water species such as Bull Trout have access to habitat at higher elevations if their populations are to persist
The three primary objectives of this investigation are: 1) to determine when NF Tieton River Bull Trout attempt to migrate upstream past Clear Creek Dam; 2) to assess their success at doing so under various hydrologic conditions; and 3) determining post-spawn migration timing and the extent to which the population uses Clear Lake. There are also several ancillary objectives which will add to the limited body of knowledge available for this population. The accomplishment of these should help fish managers proscribe appropriate actions to ensure the population’s long-term health and persistence. The ancillary objectives include determining spawning frequency, collecting genetic samples for analysis, and estimating the population size.
Methods
General Description
In order to track the movements of adult Bull Trout, fish were captured in a picket-weir box trap as they migrated downstream after spawning and surgically implanted with half-duplex (HDX) passive integrated transponder (PIT) tags. The fish were trapped and tagged on the NF Tieton 6.75 miles above Clear Lake. In 2014 and 2015, adult Bull Trout were also captured by hook-and-line and PIT tagged directly below Clear Creek Dam. After release tagged fish can be detected wherever a PIT tag detection antenna array (antenna) is installed (Figures 1 and 2). Two antennas were in operation during the fall and early winter of 2012. One was located at the top of the spillway spanning the channel directly above the concrete weir on the spillway crest and the other was located at the exit/entry portal of the pool-and-weir ladder. The spillway crest antenna was installed to detect downstream migrants, the one in the ladder to detect both emigrants and importantly, fish that had successfully ascended the spillway channel. In 2013, two additional antennas were installed. One was located just upstream of the lower terminus of the spillway channel to determine when tagged fish first attempted to ascend the channel. Detections at this antenna could also provide confirmation that post-spawn Bull Trout detected at the top of the spillway actually left Clear Lake. The second antenna was located in the river 0.75 mile upstream of Clear Lake. This channel-spanning array was installed to collect data to determine spawning frequency, pre- and post-spawn migration timing (and residence time in the river) and to provide insight into our trapping efficiency upstream.

Clear Creek Dam Fish Passage Assessment Final Report
7
In 2014, a fifth and final permanent antenna was installed in the pool-and-weir fish ladder seven weirs down from the top of the ladder (three up from the bottom). The objectives for this site were to provide confirmation that any Bull Trout detected at the top of the ladder potentially leaving Clear Lake actually continued downstream, to provide the ability to cross-check the detection efficiency of the lower spillway antenna, and to provide information on travel time for fish ascending the ladder. A temporary PIT tag interrogation site was installed about 30 yards upstream of the trap in mid-September, 2014. The purpose of this antenna was primarily to ascertain if previously tagged Bull Trout approaching the trap would display avoidance behavior.
Trap Location
Relying on our previous knowledge of the river, and after several reconnaissance trips, the location to install the trap was selected 6.75 miles upstream of Clear Lake, about a half-mile above the Goat Rocks Wilderness boundary (Figure 2). This site was selected based on habitat considerations, access, and hydraulic characteristics. With excellent Bull Trout holding habitat (e.g. deep pools and sizeable LWD complexes) existing downstream of the site it was prudent to trap fish before they might choose to hold temporarily prior to continuing their downstream migration. For logistical reasons it would only be possible to operate the trap for a limited period of time and excessive delays in migration would diminish the opportunity to collect adult Bull Trout during this operational window. While there was also holding habitat upstream, the site was only two-to-three miles below the primary spawning grounds. Access to the site was as good as one can expect along the upper NF Tieton River. The NF Tieton road (FS 1207) runs adjacent to the river for about six miles ending at a turnaround at Scatter Creek on the wilderness boundary. However, for almost all of this distance the road is rarely close to the river and thick forest separates the two. Direct access to the river is not any easier adjacent to the turnaround but a cleared trail enters the wilderness there and essentially ends at the trap site. While it was still necessary to pack the trap components to the trap site, doing so on an established trail was considerably easier than bushwhacking to an alternative site along the road. There was also a spacious primitive campsite at the turnaround which served as the base camp for the crew manning the trap. There was one complication with access that required coordination with the Forest Service and some fairly complex logistical planning in order to change crews and resupply the camp. The bridge over Miriam Creek on FS 1207 was damaged during a flood event in 2011. This bridge is about 2.2 miles short of the turnaround and the Forest Service had closed and blockaded the road approximately 1.4 miles before that. We received administrative access to the site from the Forest Service but had to use ATVs which could squeeze past the barriers to reach the camp (the bridge was still passable).
Clear Creek Dam Fish Passage Assessment Final Report
8
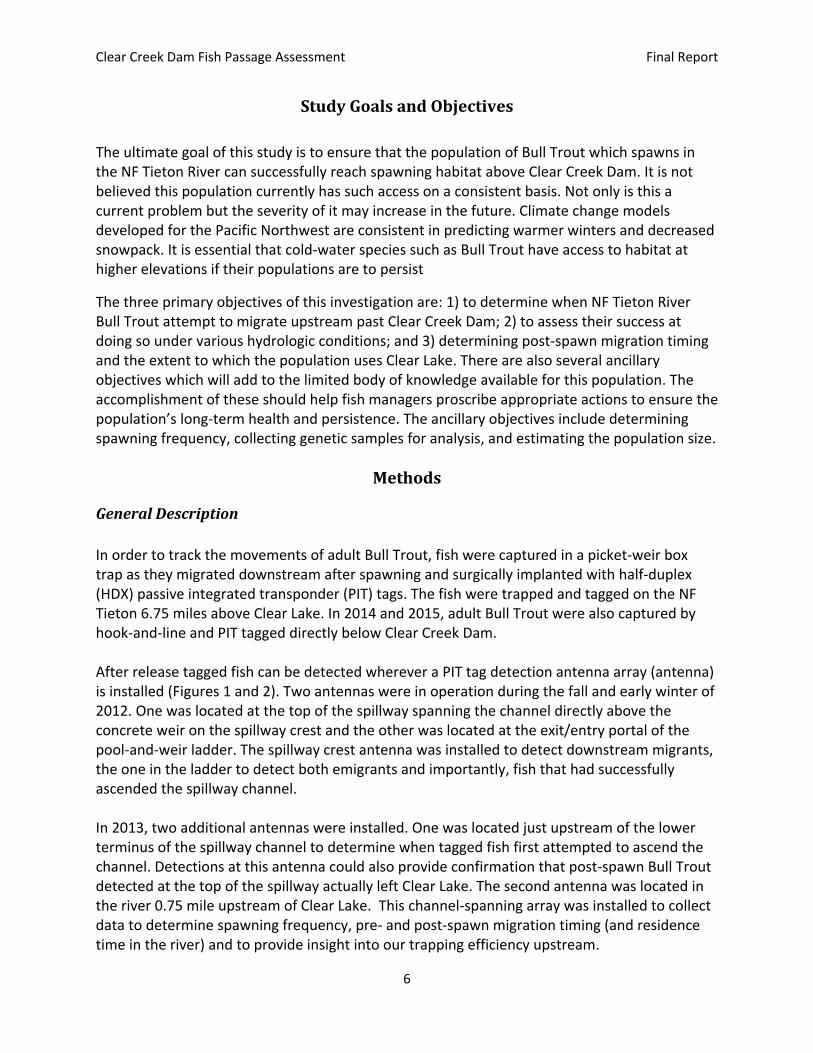
Figure 1. Locations of four of the PIT tag detection arrays (antennas) utilized in the Clear Creek Dam Fish Passage Assessment. These arrays were established at the upper and lower end of the spillway channel and in the pool-and-weir fish ladder.
Clear Creek Dam Fish Passage Assessment Final Report
9
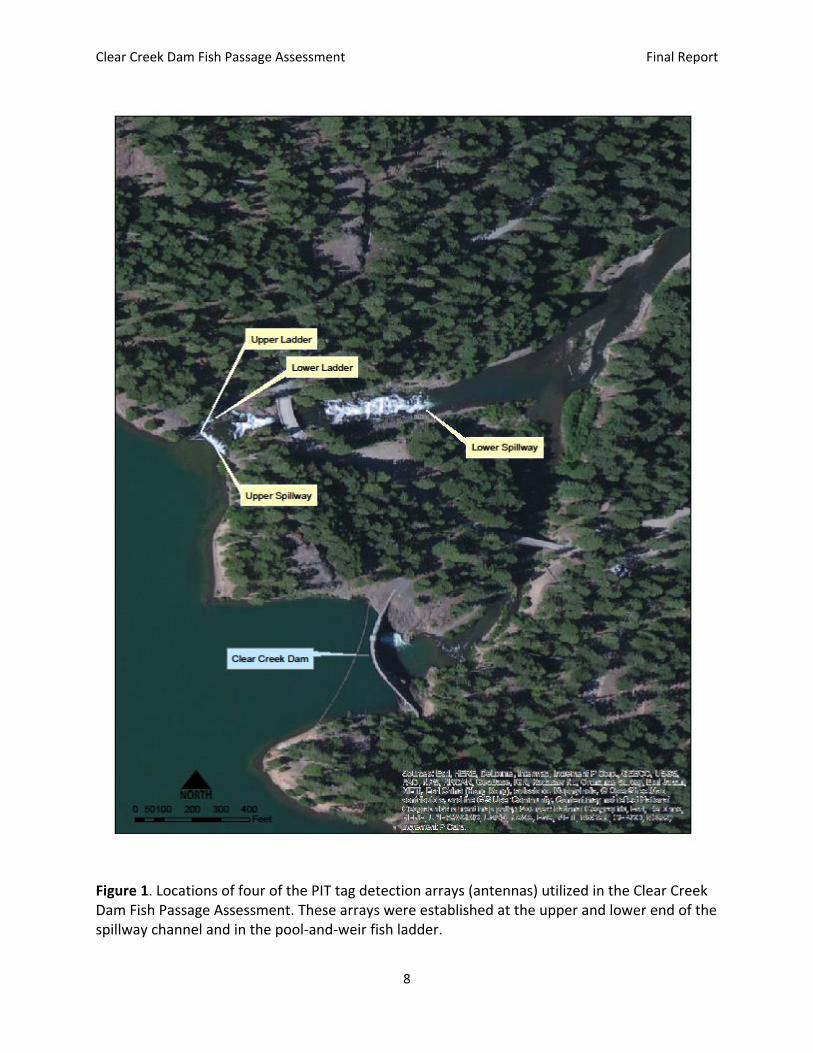
Figure 2. Location of the PIT tag detection array (antenna) established in the North Fork Tieton River 0.75 mile upstream of Clear Lake and the trap used to capture bull trout which was 6.75 miles upstream of the lake.
Clear Creek Dam Fish Passage Assessment Final Report
10
The hydraulic characteristics of the river at the trap site were nearly perfect at normal base flows. The channel was approximately 32 feet wide, gently sloping horizontally from the stream margins and nearly flat for a distance of about seven feet near the middle of the channel. Substrate materials consisting primarily of small cobbles (2-3 inch diameter) and gravels. The maximum water depth in the thalweg was 18-24 inches and maximum water velocities, although not measured, appeared to be between 1.0 and 1.5 feet per second.
Trap Construction and Installation
The trap was constructed by WDFW’s Region 3 screen shop. The component parts of the weirs and the capture box were made out of aluminum which was both durable and lightweight. The weir panel frames were eight-feet long by four-feet tall. Approximately seventy spiked pickets (60” x 0.75”) slipped through holes drilled in each frame and were pounded into the stream bed (spacing between pickets was about 0.6”). Adjacent panels were coupled together and all panels were braced from downstream. The capture box measured four x four x four feet. It was assembled from four panels, used the same type of pickets as the weirs and had a funnel opening. There was no aluminum top or bottom to the capture box. Three eight-foot weir panels were coupled together and extended from the left bank downstream at about a 40 degree angle where they connected with the capture box; two panels were used on the right bank, placed at a slightly smaller angle. The capture box was situated in the thalweg of the channel at the location where the stream bed was relatively flat. With the braces, numerous sandbags strategically placed, and all pickets driven into the stream bed as much as possible, the weir and the trap box were solid. To prevent potential avian predation a tarp was draped over the top of the box and secured. Burlap was wired to the top of the funnel opening to prevent captured fish from jumping out and half-inch wide zip ties were affixed to the back of the vertical opening to dissuade captured fish from swimming back out. Having noted the escape of two Bull Trout from the capture box during the first year the trap was deployed (2012) and avoidance behavior (trap shyness) displayed by a few Bull Trout approaching the trap entrance, the trap was modified for use in 2013. The original trap box was directly connected to adjacent weir panels. The entrance to the trap was flat and perpendicular to the current with two wings extending into the trap where fish would pass through a vertical opening 4-5 inches wide. It was thought that trapped fish would be disinclined to go back through this opening but that turned out to be false on at least a couple of occasions. The entrance was modified so that a caged cone extended about three feet back from the entrance. This cone led to a 10-inch diameter opening to which a four-foot section of PVC pipe was attached. This pipe extended about two feet into the trap and was approximately six inches above the stream bed inside it. A burlap sleeve was then affixed to the end of the pipe to further dissuade captured fish from finding the opening. The entrance to the trap was painted flat black to minimize avoidance behavior (all modifications were done WDFW’s Region 3 screen shop). Also, in response to higher streamflows observed after the first year of the study,
Clear Creek Dam Fish Passage Assessment Final Report
11
two sandbags were placed on each side of the trap box directly in front of the trap to provide velocity relief for trapped fish. Photographs of the trap under construction and completed are presented in Appendix B. Antenna Construction and Installation HDX PIT tag readers and data loggers, manufactured by Texas Instruments, were procured from Oregon RFID® and used for all of the PIT tag interrogation sites described below. Antenna performance was evaluated periodically during the study using test tags and timer tags set to send a tag code every 31 minutes. Data was downloaded manually with a laptop computer and subsequently stored on Reclamation’s Upper-Columbia Area Office network. Photographs of the PIT tag detections arrays installed for this investigation are provided in Appendix C.
Upper Ladder
The antenna installed on the upstream exit of the pool-and-weir fish ladder in early September 2012 employed a swim-through configuration covering an approximate three-by-five foot opening. It was constructed from three wraps of 12 gage THHN wire housed in a PVC pipe frame and mounted to the wall of the fish ladder. The antenna originally operated on 12 volt DC current supplied by rechargeable deep-cycle batteries which were exchanged weekly. Three solar panels were installed at the site in March, 2013 to charge the batteries and eliminate the need for exchange. These batteries also powered the upper spillway antenna and were stored in the same job box.
Upper Spillway
This antenna was first constructed in early September, 2012. Using a swim-through configuration (Zydlewski et al. 2006), a single loop antenna was installed spanning the entire width (85 feet) of the spillway weir. The antenna was built out of 1/0 gage welding cable for the bottom of the loop and 8 gage THHN wire for the top. The top loop was affixed to 1.5 cm climbing rope which was stretched tight approximately two feet above the water surface. The antenna operated on 18 volt DC current supplied by rechargeable deep-cycle batteries exchanged weekly until the solar panels mentioned above were installed. The antenna was submerged and broken during a severe high water event in October. After it was repaired it operated until the third week of December when weather conditions precluded access to the site and the batteries froze. In March 2013, a new high-tension nylon rope with less stretch was installed and a turnbuckle was included at the right side anchor. This provided much greater tightening capability to prevent the loss of the antenna to high flows. Although the tuning boxes for both the spillway and ladder antennas were never submerged in 2012, elevated mounting platforms were installed for both as a precaution. Addressing performance concerns, the antenna was dismantled and rebuilt twice in 2013 with little or no improvement in performance.
Clear Creek Dam Fish Passage Assessment Final Report
12
On September 3, 2014 the swim-through configuration was abandoned and another antenna was installed at this site employing a flat-plate design identical to that used for the lower spillway and NF Tieton River antennas (see below). A final modification was made in 2015 when the antenna wire was moved a few feet upstream of the concrete sill of the weir. This was done to address concerns that steel rebar in the concrete might be causing interference in the electrical field.
Lower Spillway
The lower spillway antenna utilized a flat-plate, or pass-over, design and was first installed on July 9, 2013. The antenna was constructed using a continuous length of General Cable Carol Super-VU Tron Supreme power cable (12 gage with 4 strands) strung across the channel and doubled back. After the lake level was lowered and the ladder was boarded up the antenna was attached to the dewatered bedrock channel using stainless steel anchor bolts with eye nuts attached. The antenna wire was run through the eyes and secured with zip ties for stability. This antenna measured 54 feet long by about 2 feet wide. It operated on 12 volt DC current supplied by two deep-cycle batteries recharged by two solar panels installed at the site. This PIT tag interrogation site presented many challenges. The antenna had to endure extreme hydraulic stress and there were numerous problems encountered. The antenna wire broke in late-September 2013 which we believed was the result of friction where it contacted the eye nuts. A new antenna was installed late-April, 2014. Fourteen new stainless steel anchor bolts with eye nuts were installed in the bedrock to augment those installed previously. A 3/8-inch diameter non-stretch marine rope was strung through the eyelets, looped back on the right bank, and stretched tightly with turnbuckles installed on the left bank. Rather than stringing the antenna wire through the eyelets the wire was affixed to the rope using over 100 heavy duty cable ties. Unfortunately, about two weeks later the antenna was broken again. It was subsequently discovered that an animal, probably a beaver, had gnawed through both the rope and the wire. A new design was developed that would not only be durable enough to withstand extreme hydraulic conditions but gnawing animals as well. After waiting out the spring runoff, the antenna was reinstalled on July 9, stringing the rope and antenna wire through semi-flexible 1.5-inch HDPE pipe that was custom cut and fit between the anchors. The successful reinstallation lasted until late October when the antenna broke again under the force of high flows. Utilizing the same “beaver resistant” design employed previously, the antenna was once again reconstructed on April 21, 2015 and operated without incident until it was decommissioned for the season on October 27. A few days later the antenna was destroyed again by extreme flows. After losing four antennas in just over two years it is very doubtful that this PIT tag interrogation site will be utilized in any future monitoring activities.
North Fork Tieton
Also utilizing the flat-plate design, the antenna at the NF Tieton PIT tag interrogation site was first installed on August 1, 2013. It was constructed using a continuous length of General Cable Carol Super-VU Tron Supreme power cable (12 gage with 4 strands) strung across the channel

Clear Creek Dam Fish Passage Assessment Final Report
13
and doubled back. The antenna was attached to the stream bed using rebar anchors. It measured 66 feet long by 3 feet wide and operated on 12 volt DC current supplied by rechargeable deep-cycle batteries exchanged weekly. High flows during the winter of 2014 significantly buried the antenna wire and removed a huge dead tree located in the channel on the right bank. It was necessary to dig the wire out and lengthen the array about eight feet. This work was done in early May, 2015. Originally thought to lack the necessary exposure for a solar power configuration, a single solar panel was installed in mid-June 2015 which was able to recharge the batteries until late October.
Lower Ladder
In late-April, 2014 an antenna was installed in the pool-and-weir fish ladder seven weirs down from the top of the ladder (three up from the bottom). Using the same materials as those used at the lower spillway and NF Tieton sites, the antenna wire in the lower ladder was affixed to the weir using conduit anchors and run up the ten-foot face of the left bank cliff. The configuration of the antenna was an elongated oval loop running across the weir just under the weir opening. This antenna was powered by 12 volt DC current supplied by rechargeable deep-cycle batteries exchanged weekly. A single solar panel was installed at the site to recharge the batteries in early January, 2015. Shortly thereafter it was observed that the antenna wire had broken. A new antenna wire was installed and additional conduit anchors were added on April 22.
Upstream Of Trap
This temporary antenna, installed upstream of the trap on September 11, 2014, employed a flat-plate design which spanned the channel (about 24 feet). It was constructed from the same materials as the other flat-plate antennas described herein but was not semi-permanently affixed to the stream bed, instead rocks were used to hold it down. The antenna was powered by 12 volt DC current supplied by a single rechargeable deep-cycle battery. The battery was exchanged when necessary and replaced with a fresh one recharged near the trap base camp with a solar panel.
Antenna Performance
Upper Ladder
This PIT tag interrogation site was crucial to determine if adult Bull Trout had successfully ascended the spillway channel. Because of the gradient and extreme hydraulics present in the upper portion of the channel, the ladder was the only viable route to complete the migration. The antenna was first activated a week before the first Bull Trout was tagged in mid-September, 2012. The antenna had an excellent detection range of 36-40 inches which persisted throughout the course of the study. It continued to operate until near the end of December (88 days) when several sequential snowstorms prevented access to the site. At that time the site was decommissioned (i.e., the antenna was turned off and the electronics were removed but

Clear Creek Dam Fish Passage Assessment Final Report
14
the antenna wire was left in place). The first year there were occasional bugs related to the power supply that had to be worked out. Despite these short-term interruptions the antenna functioned 93 percent of the time in 2012.
The site was reactivated on March 29, 2013 with solar panels now charging the batteries. It operated continuously for the remainder of 2013 and continued operating until October 13, 2014 (565 days) with only minor interruptions. After dealing with some battery issues, detection capability was restored until mid-December when intermittent power outages occurred as the result of short days and persistent cloud cover. The upper ladder PIT tag interrogation site operated for just over 355 days in 2014, 97.3 percent of the time.
Intermittent power outages continued in January 2015, amounting to about two days of down time, and a burned out solar controller cost about 10 days of operation in late-September. After detection capability was restored at the site it operated continuously until it was decommissioned on December 4. Overall, the antenna was operational 96 percent of the time in 2015.
Upper Spillway
This PIT tag interrogation site was installed specifically to detect Bull Trout leaving Clear Lake after the spawning period. Adjacent to the upper ladder site, it was first activated a week before the first Bull Trout was tagged in mid-September, 2012. The detection range was approximately 12 inches upstream and downstream throughout the entire loop. Maintaining continuous detection capability at the site was a problem throughout the study which was discussed in detail in the three annual reports. Despite the problems encountered in 2012, the antenna operated for 78 days, 82 percent of the time, from mid-September through the end of December. While this antenna was reactivated at the beginning of April in 2013, it operated erratically. Despite rebuilding the antenna twice, problems persisted and unfortunately it was never well-tuned and operating efficiently during the fall of 2013.
In 2014, the new flat-plate antenna Installed at this PIT tag interrogation site operated without interruption from September 3 until October 14 (41 days). The detection range was approximately 15 inches. Beginning on October 14 power outages occurred regularly indicating the joint power source for the upper ladder and spillway antennas was insufficient to power both. The upper spillway antenna wire runs 85 feet across the spillway crest, loops and comes back. The power required to run an antenna of this length (in combination with the upper ladder antenna) appeared to be in excess of what can be reasonably supplied late in the fall when days shorten and cloud cover increases. The site was decommissioned on October 16.
An attempt was made to maintain the detection capability of the upper spillway antenna later into the fall in 2015. Speculating that steel rebar present in the concrete of the weir’s sill was affecting performance, the antenna wire was moved onto the lake bed a few feet upstream on August 13. This improved the detection range of the antenna to about 20 inches and also extended its operational period through early November. Except for a 10-day period in late-

Clear Creek Dam Fish Passage Assessment Final Report
15
September when the solar controller burned out and was replaced (see above), detection capability was maintained from August 13 through November 3 (82 days). The antenna was turned off on November 3 when persistent power outages began to occur.
Lower Spillway
This PIT tag interrogation site was installed to detect Bull Trout when they began an attempt to migrate up the spillway channel and to provide confirmation that they left Clear Lake after the spawning period. The latter purpose was particularly important for any that were detected earlier at the upper ladder antenna because a detection there did not necessarily indicate that they continued downstream. The lower spillway antenna first became operational on July 9, 2013 with a detection range of approximately 18-20 inches on either side of (and above) the antenna wires. Detection capability was maintained until the night of September 27 except for a four-day period when a faulty voltage controller interrupted the power supply. In all the antenna operated for 77 days until the wire broke during a high flow event. Interestingly, a Bull Trout that was tagged four days earlier had been detected by the antenna just six hours prior to it breaking. Persistent high flows precluded repair of the antenna in 2013. The antenna was rebuilt in late-April 2014 with a detection range of 16-18 inches. However it was broken again just 16 days later when a beaver gnawed through it. With an extended spring runoff, repairs were not possible until July 9. This was unfortunate since the time period missed (54 days) was potentially a key period for upstream migration. After reinstallation the site had full detection capability until October 26 (108 days) when once again it broke during high flows. A new antenna, the fourth, was installed at the site and became operational on April 22, 2015. This one operated without interruption until October 27 (188 days) when low-light conditions prevented adequate solar charging of the batteries. The site was decommissioned just days before the antenna was taken out again during another high flow event.
North Fork Tieton
The purpose of this PIT tag interrogation site was to track fish migrating up the river prior to spawning and downstream afterwards. It first became operational on August 1, 2013 with a detection range of 18-20 inches. The antenna operated without interruption until November 12 (93 days). The site was decommissioned when the first snowstorm of the season occurred and access to the site became questionable. In 2014 the site was activated on April 30. Power was interrupted for four days due to a bad battery two days after activation and again for seven days the third week of June for the same reason. For 136 days from June 28 through November 13 (when the site was decommissioned) the antenna operated uninterrupted. Between April 30 and November 13 the site was operating 93 percent of the time.

Clear Creek Dam Fish Passage Assessment Final Report
16
The site was activated on April 22, 2015 but at reduced efficiency. After the work performed on May 7 (described previously) the detection range of the antenna had been reduced about four inches which was likely the result of the antenna wire having been lengthened 16 feet. It operated continuously until September 6, after which intermittent short-term power outages occurred, usually in the pre-dawn hours. Despite these outages, between September 6 and October 27 the antenna was fully functional 90 percent of the time. The site was decommissioned on October 27 when no PIT tags had been read for 25 days.
Lower Ladder
The purpose of the lower ladder PIT tag interrogation site was primarily to provide confirmation that Bull Trout detected at the top of the ladder potentially leaving Clear Lake actually did so. The upper ladder antenna had an exceptional detection range and could read a tag if a fish was just in the vicinity of the opening. Given the problems encountered with the lower spillway antenna and the fact that a fish moving downstream on the spillway at high velocity might go undetected, we believed it was important to install a redundant antenna down the fish ladder. This antenna would also enable analysis of travel time in the ladder for fish migrating upstream. The lower ladder antenna was first installed May 14, 2014. It had a detection range of 20-24 inches. It operated almost uninterrupted for 90 days until August 14. After this date there were some intermittent power outages began to occur with some of the older batteries. However, during the 88 days between August 15 and November 10 (when the site was decommissioned) the antenna was operating 86 percent of the time. In 2015, solar power was supplied at the site to charge the batteries. The antenna was activated on January 8 but a week later it was discovered that the antenna wire was broken and reinstallation was not possible until April 22. Following reinstallation the antenna operated continuously for 179 days until October 18. Between this date and October 27 intermittent power outages occurred totaling 80 hours. It was apparent that the light conditions were insufficient to continue to charge the batteries and the site was decommissioned on October 27.
Upstream Of Trap
This temporary PIT tag interrogation site was installed about 30 yards upstream of the trap to investigate the behavior of adult Bull Trout approaching the trap. Having observed a few fish the two previous years that appeared to shy away from the structure, we sought to document this behavior for the benefit of others who might attempt a similar effort. The antenna operated continuously for 19 days from September 11-29 with a detection range of approximately 24-30 inches. The site was dismantled when trapping ended.
Clear Creek Dam Fish Passage Assessment Final Report
17
Trapping
Our plan was to run the trap for three weeks during the spawning period for NF Tieton Bull Trout which was not precisely defined. In 2012, trapping began on September 17. Based on the results from the first season the start date was shifted eight days earlier (September 9) for the following two years trapping was conducted. The trapping operation was discontinued early in two of three years for reasons described in the Results section of this report. In 2012, trapping extended 18.5 days, for 19 days in 2013, and for 20.5 days in 2014. From previous studies it was expected that most Bull Trout would be captured at night but we monitored the trap periodically during the day as well. Daytime monitoring also allowed crew members to clean the weir panels of organic debris which accumulated on the weir panels, potentially exerting pressure which could damage them. At night the trap was checked at dusk, between 9:00 and 10:00 PM, and between 2:00 and 3:00 AM. The first check after sunrise occurred between 6:00 and 7:00 AM. One person was always present at the camp to monitor the trap during daylight hours and two were present at night.
PIT tagging and Genetic Sampling
Initially we intended to PIT tag fish only during daylight hours. However, after the first few days of tagging in 2012 we decided to avoid leaving fish in the trap any longer than necessary and found that there was no disadvantage in tagging at night under artificial lighting (i.e., lanterns and headlamps). Thereafter, all Bull Trout were worked immediately after being removed from the trap. Captured fish were netted out of the trap using long-handled dip nets and placed in an 80-quart cooler where they were anesthetized. The anesthesia used was tricaine-s (i.e., MS-222) mixed at a 50mg/L concentration with river water. Since MS-222 is acidic, buffer (NaHCO3, i.e., baking soda) was added to the solution to raise the pH back to the baseline level of the river. The pH was measured using a Eutech Instruments pHTestr20®. To ensure the consistency and safety of the solution the cooler was pre-marked to hold 25 liters of water and the amounts of MS-222 (1.25 grams) was premeasured and kept in individual bottles. Solutions were discarded away from the stream after each tagging session or three fish, whichever came first. The fish were measured, sexed, and a small tissue sample was taken from the anal fin which was preserved in 70% isopropyl alcohol for genetic analysis. A scalpel was used to make a one-half inch vertical incision just posterior and ventral to the pectoral musculature near the end of the pectoral fin. This incision penetrated only the epidermal layer under which an HDX PIT tag was horizontally inserted. We used 23 mm x 3.65 mm tags (manufactured by Texas Instruments, Inc.) operating on the 134.2 kHz radio frequency identification standard for animal tagging. The tag was gently pushed in between muscle and skin towards the tail of the fish until barely visible, at which point a cocktail straw was used to implant it about one inch further. This surgical procedure was fairly simple and did not require any sutures. After being placed in the anesthetic solution, full anesthetization usually occurred within 7-10 minutes. The time required to work each fish was between 5-7 minutes.
Clear Creek Dam Fish Passage Assessment Final Report
18
After completing the tag implantation an Oregon RFID® portable reader was used to scan the tag number and fish were placed in 6-inch diameter PVC flow-thru recovery tubes. These were secured in the channel where a light current existed with the head of the fish oriented upstream. Once placed in the holding tubes all of the Bull Trout were fully recovered within 15-20 minutes and released downstream if the fish was a female, back upstream if a male. Not all of the Bull Trout captured were trapped. Some were dip-netted directly below the weir (see Results section). The disposition of these fish was the same as for those that were trapped.
No complications were encountered during or after HDX PIT tag implantation. Photographs related to the tagging operation are presented in Appendix D.
Hook-and-Line Sampling
It was confirmed in late-July 2013 that significant numbers of adult Bull Trout were present in the stilling basin directly below Clear Creek Dam. The decision was made to sample this concentration of adults to obtain genetic samples and implant HDX PIT tags. Our objectives were to determine the genetic origin of these Bull Trout and to see if any would attempt to migrate up the spillway channel. Bull Trout were caught using large lures or flies with single barbless hooks. Heavy fishing line was used to ensure that fish were landed quickly without a protracted struggle. The data collection and PIT tagging procedures were identical to those employed at the trap. The effort was repeated in 2015.
Water Temperature Monitoring Water temperature monitoring was initiated in 2013, getting off to a late start due to our concentrated efforts to build two new antennas and tune those installed in 2012. Data loggers were deployed at the locations of the upper ladder and lower spillway antennas on July 25. Another was deployed in the NF Tieton River when the detection antenna was installed on August 1 and a fourth data logger was deployed on August 6 in the outlet channel of Clear Creek Dam. The data loggers used were Onset Hobo© Water Temp Pro v2 (#U22-001). Data were uploaded periodically using a Hobo waterproof shuttle. The loggers were retrieved at the end of October. In 2014 and 2015, data loggers were deployed in late-April at all sites mentioned above. However, the logger at the lower spillway site was removed in June because the water temperature recorded there was essentially identical to that at the upper ladder. As was the case in 2013, the loggers were removed at the end of October both years.
Results
Trapping Operation Environmental conditions, particularly hydrologic events, played a significant role in the trapping operation on occasion. In all years ambient air temperatures were normal for September with generally comfortable days and nighttime temperatures infrequently dipping to the freezing level. Average daily water temperatures in 2012, 2013, and 2014 were 7.2°C, 8.7°C, and 7.8°C, respectively. Daily maximum temperatures exceeding 10°C were rare except
Clear Creek Dam Fish Passage Assessment Final Report
19
for the first six days of the 2013 trapping period when a maximum of 13.5°C was reached on one occasion. Uncharacteristically, no precipitation occurred in 2012. This was not the case in 2013 when rain was persistent, heavy at times, after the first week of the operation. More stable conditions occurred in 2014 with no significant rainfall except for a three-day period at the beginning of the third week. Hydrologic conditions in 2012 were stable. River stage changed little, fluctuating just 2-3 inches above or below the baseline (when the trap was installed) and there was little turbidity. The conditions in 2013 were significantly different. Stream flow was higher from the start and the river was at least moderately turbid throughout the trapping period. Over the first two weeks river stage fluctuated within reasonable limits (3-5 inches) but this relative stability ended on September 22 when the stage rose close to two feet after heavy rains. The stage declined to its previous level over the next 36 hours but on September 27 a second, much more significant, high flow event began which resulted in the river rising over four feet. In 2014, except for a 2.5-day period during the last week of trapping, hydrologic conditions were consistent with no significant fluctuation in river stage. Turbidity was persistent but generally moderate. The yearly trapping results are summarized below.
2012
The trap was assembled on September 17 and was operated through October 5 (18.5 days). Initially the trap was last checked around 9:00 PM before returning around 7:00 AM the next morning. We anticipated capturing most Bull Trout at night and assumed we would not need to work them immediately because of the relatively large size of the trap and the benign hydrologic conditions occurring at the time. This assumption was invalidated just three days into the operation when two Bull Trout observed in the trap had escaped less than two hours later. Thereafter the trap was checked every few hours over the course of the night in addition to daytime monitoring. This escape episode led to the trap modifications described previously. A total of 10 adult Bull Trout were captured in 2012. This figure does not include the two that escaped which, since they escaped upstream, may have been recaptured later. Eight of the fish captured were found in the trap but the other two required a more active capture approach. Three fish were observed immediately upstream of the weir. One was eventually herded into the trap using dip nets, a second was netted, the third fled upstream. All of these fish appeared to display “trap shyness”. This behavior has been observed in at least one other study that we know of (J. McCubbins, Avista Corp., pers. comm.). Adult Bull Trout were also observed directly downstream of the weir on three nights (one to three individuals each night, seven total). This contributed to the decision to begin trapping earlier the next year. All Bull Trout encountered in 2012 were either captured or observed at night. No other fish species were captured and the only other animal caught in the trap was a toad. Trapping was discontinued when no fish were captured or observed for five consecutive days.
Clear Creek Dam Fish Passage Assessment Final Report
20
2013
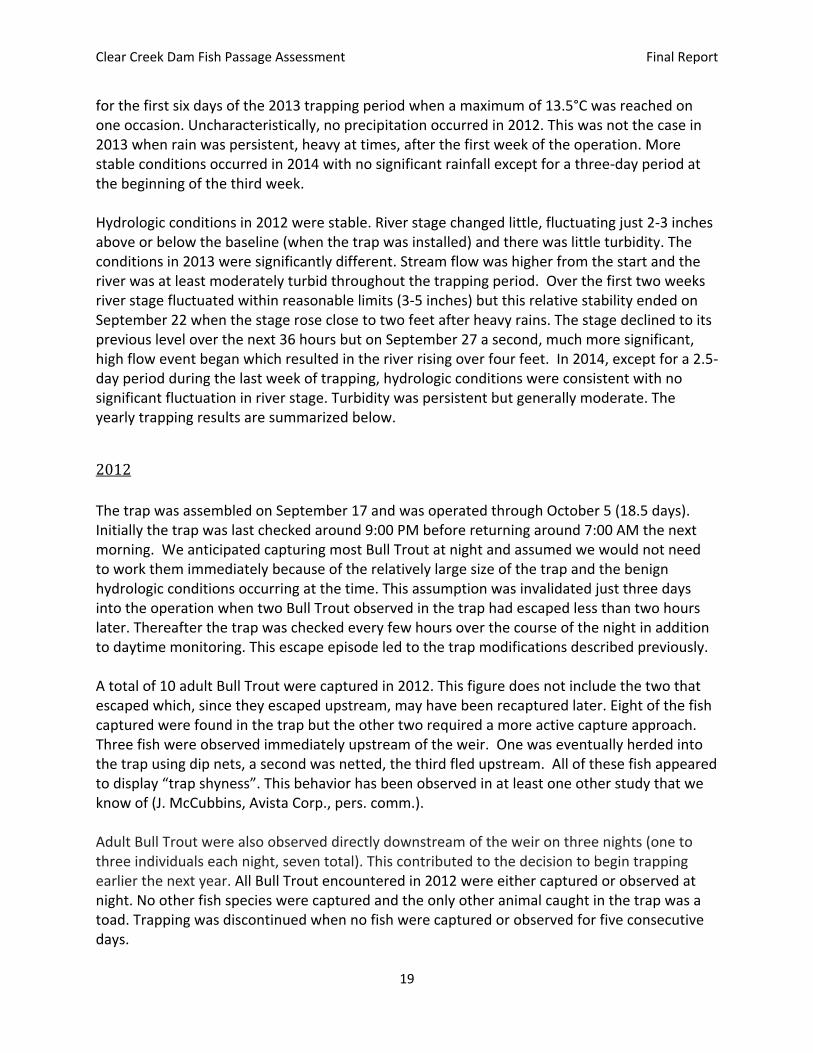
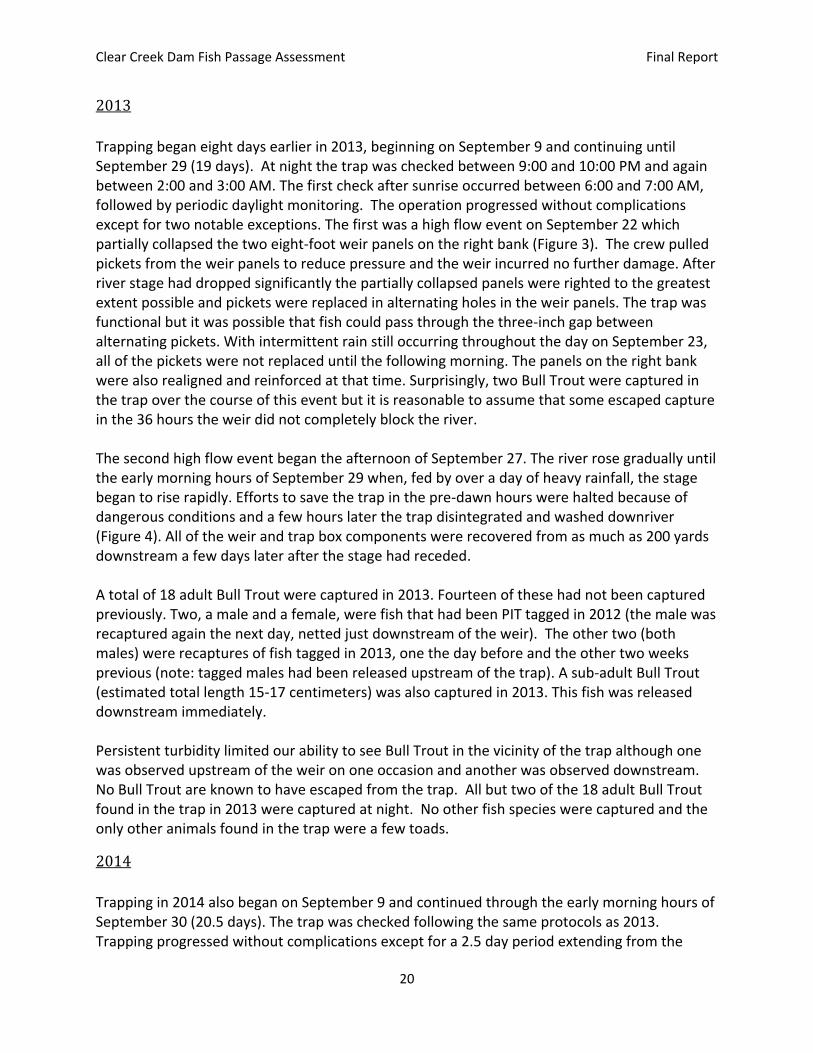
Trapping began eight days earlier in 2013, beginning on September 9 and continuing until September 29 (19 days). At night the trap was checked between 9:00 and 10:00 PM and again between 2:00 and 3:00 AM. The first check after sunrise occurred between 6:00 and 7:00 AM, followed by periodic daylight monitoring. The operation progressed without complications except for two notable exceptions. The first was a high flow event on September 22 which partially collapsed the two eight-foot weir panels on the right bank (Figure 3). The crew pulled pickets from the weir panels to reduce pressure and the weir incurred no further damage. After river stage had dropped significantly the partially collapsed panels were righted to the greatest extent possible and pickets were replaced in alternating holes in the weir panels. The trap was functional but it was possible that fish could pass through the three-inch gap between alternating pickets. With intermittent rain still occurring throughout the day on September 23, all of the pickets were not replaced until the following morning. The panels on the right bank were also realigned and reinforced at that time. Surprisingly, two Bull Trout were captured in the trap over the course of this event but it is reasonable to assume that some escaped capture in the 36 hours the weir did not completely block the river. The second high flow event began the afternoon of September 27. The river rose gradually until the early morning hours of September 29 when, fed by over a day of heavy rainfall, the stage began to rise rapidly. Efforts to save the trap in the pre-dawn hours were halted because of dangerous conditions and a few hours later the trap disintegrated and washed downriver (Figure 4). All of the weir and trap box components were recovered from as much as 200 yards downstream a few days later after the stage had receded. A total of 18 adult Bull Trout were captured in 2013. Fourteen of these had not been captured previously. Two, a male and a female, were fish that had been PIT tagged in 2012 (the male was recaptured again the next day, netted just downstream of the weir). The other two (both males) were recaptures of fish tagged in 2013, one the day before and the other two weeks previous (note: tagged males had been released upstream of the trap). A sub-adult Bull Trout (estimated total length 15-17 centimeters) was also captured in 2013. This fish was released downstream immediately. Persistent turbidity limited our ability to see Bull Trout in the vicinity of the trap although one was observed upstream of the weir on one occasion and another was observed downstream. No Bull Trout are known to have escaped from the trap. All but two of the 18 adult Bull Trout found in the trap in 2013 were captured at night. No other fish species were captured and the only other animals found in the trap were a few toads.
2014
Trapping in 2014 also began on September 9 and continued through the early morning hours of September 30 (20.5 days). The trap was checked following the same protocols as 2013. Trapping progressed without complications except for a 2.5 day period extending from the
Clear Creek Dam Fish Passage Assessment Final Report
21
early morning hours of September 24 through about noon on September 26. As was the case the previous year, high flows forced the crew to remove pickets which saved the weir and trap but rendered it useless for trapping fish. The trap was reassembled when river stage receded to a safe level for in-river work.
Figure 3. NF Tieton River fish trap after the high flow event on September 22, 2013. The photo was taken the next day after the river had receded.
Figure 4. NF Tieton River fish trap during the high flow event which occurred at the end of September, 2013. This photo was taken the morning of September 29.

Clear Creek Dam Fish Passage Assessment Final Report
22
A total of 13 adult Bull Trout were captured in 2014. Only five of these had not been previously tagged; three were trapped and two were netted directly downstream of the weir. Of the eight recaptures, one (netted downstream) had been tagged two days previous. Two, both netted downstream, had been tagged in 2012 with one of these (a male released upstream of the trap) recaptured a second time six days later. Four of the recaptured Bull Trout had been tagged in 2013, three captured in the trap and one netted downstream. All of the Bull Trout captured in 2014 were captured at night. The only other fish trapped were two Mountain Whitefish (Prosopium williamsoni) and the only other animals found in the trap were a few toads. Overall, fewer Bull Trout were captured in 2014 than we expected. The number of redds found in the NF Tieton River system was greater than it had been since 2009. While the weir was not fully functional for the aforementioned 2.5 day period, overall trapping conditions were good. Given the high ratio of recaptures to new captures it was decided that operating the trap again in 2015 would not be worth the considerable effort.
PIT Tagging (trap)
A total of 29 adult Bull Trout were implanted with HDX PIT tags at the trap from 2012 through 2014. These included 14 males and 15 females. The average total length (TL) of the fish tagged was 57.2 centimeters (cm), ranging from 43.5 to 82 cm. Based on visual inspection none of the fish tagged appeared to be a hybrid (i.e., Brook Trout x Bull Trout). However, subsequent genetic analysis revealed that six were which will be discussed later in this report. The year-by-year results are presented below. 2012 Ten adult Bull Trout were tagged in 2012, all within an eleven-day period. Four of these were tagged the morning after the second night the trap was operated and none were tagged during the last five days. The average TL of the fish tagged in 2012 was 59.1 cm, ranging from 46.5 to 82 cm. Six were males, four were females; three of the females were hybrids. A list of the fish tagged in 2013 along with relevant information about each is presented in Table 1. 2013 Fourteen adult Bull Trout were tagged in 2013, all within a thirteen-day period. The first two of these were tagged on September 13 and the last two on September 26. The average TL of the Bull Trout tagged in 2013 was 55.8 cm, ranging from 43.5 to 75.5 cm. Five were males and nine were females; two of the females were hybrids. A list of the fish tagged in 2013 along with relevant information about each is presented in Table 2. 2014 Five adult Bull Trout were tagged in 2014. One was tagged the first full day the trap was operating and the other four on separate days from September 22-28. The average TL of the
Clear Creek Dam Fish Passage Assessment Final Report
23
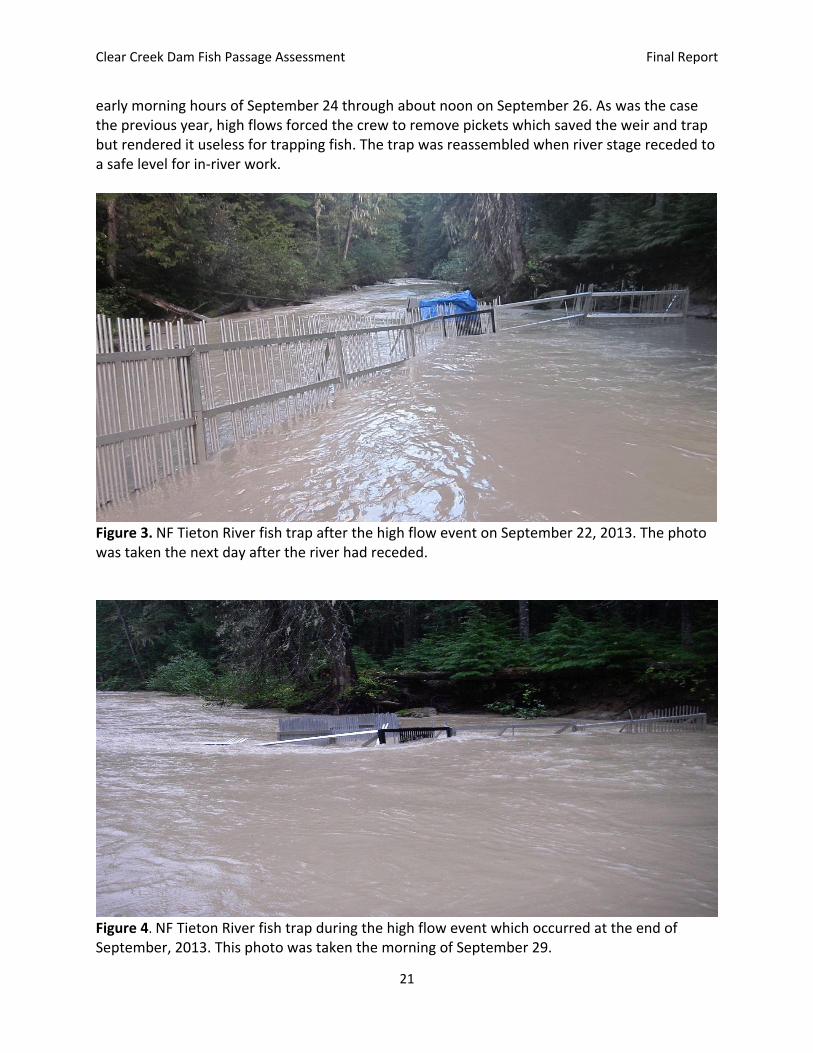
Bull Trout tagged in 2014 was 57.5 cm, ranging from 49.5 to 68.5 cm. Three were males, two were females; one of the males was a hybrid. A list of the fish tagged in 2014 along with relevant information about each is presented in Table 3. Table 1. Adult Bull Trout captured and PIT tagged in the NF Tieton River in September, 2012. Shaded cells denote fish that were later genetically identified as hybrids.
Date captured Time Sex TL (cm) DNA code PIT tag code Tagger
19-Sep 7:00 AM Female 60 12AG30 180597181 J. Thomas
19-Sep 7:00 AM Male 49 12AG25 180597290 P. Monk
19-Sep 7:00 AM Female 70 12AG43 180597236 J. Thomas
19-Sep 7:00 AM Male 48 12AG56 180597199 P. Monk
24-Sep 12:15 AM Female 46.5 12AG10 180597363 P. Monk
24-Sep 4:00 AM Male 70.5 12AG12 180597327 P. Monk
26-Sep 4:00 AM Male 82 12AG23 180597369 P. Monk
29-Sep 10:00 PM Male 52.5 12AG59 180597295 J. Thomas
29-Sep 10:00 PM Female 57 12AG26 180597398 J. Thomas
30-Sep 3:15 AM Male 55 12AG22 180597382 J. Thomas
Table 2. Adult Bull Trout captured and PIT tagged in the NF Tieton River in September, 2013. Shaded cells denote fish that were later genetically identified as hybrids.
Date captured Time Sex TL (cm) DNA code PIT tag code Tagger
13-Sep 7:00 AM Female 43.5 13HJ1 180597354 P. Monk
13-Sep 7:00 AM Male 47.5 13HJ2 180597450 P. Monk
17-Sep 9:00 PM Female 59 13HJ3 180597244 J. Thomas
18-Sep 9:30 PM Male 59 13HJ4 180597467 J. Thomas
18-Sep 9:30 PM Female 68 13HJ5 180597446 J. Thomas
18-Sep 9:30 PM Female 55 13HJ6 180597185 J. Thomas
19-Sep 3:00 AM Female 68 13HJ7 180597211 J. Thomas
22-Sep 4:00 PM Female 59 13HJ8 180597348 P. Monk
23-Sep 6:00 AM Female 49 13HJ9 180597311 P. Monk
24-Sep 9:30 PM Female 75.5 13HJ10 180597257 J. Thomas
24-Sep 9:30 PM Male 49.5 13HJ11 180597493 J. Thomas
25-Sep 7:00 AM Male 45 13HJ12 180597426 J. Thomas
26-Sep 2:45 AM Female 54 13HJ13 180597333 J. Thomas
26-Sep 10:00 PM Male 49 13HJ14 180597420 J. Thomas
Table 3. Adult Bull Trout captured and PIT tagged in the NF Tieton River in September, 2014. The shaded cell denotes the fish that were later genetically identified as hybrids.
Date captured Time Sex TL (cm) DNA code PIT tag code Tagger
10-Sep 10:30 PM Male 60 14FF12 180597192 J. Thomas
22-Sep 9:15 PM Male 68.5 14FF13 180597448 J. Thomas
23-Sep 9:15 PM Female 49.5 14FF14 180597198 J. Thomas
26-Sep 9:00 PM Female 53 14FF15 180597277 P. Monk
28-Sep 9:00 PM Male 56.5 14FF16 180597232 P. Monk
Clear Creek Dam Fish Passage Assessment Final Report
24
Hook-and-Line Sampling
A combined total of 28 adult Bull Trout were caught directly below Clear Creek Dam in 2014 and 2015. In 2014, attempts to angle for Bull Trout directly below Clear Creek Dam began on May 1 and continued through late-July when hydraulic conditions below the dam would allow. No fish were captured in May; for June and much of July conditions were not conducive to angling at the site. In late-July the presence of significant numbers of Bull Trout below the dam was confirmed and the effort to capture and tag some of these fish occurred on July 31. The weather was clear and the water temperature was 10.0°C. Twelve adult Bull Trout were caught. All but one of these fish, a female tagged at the trap in 2012, had not been encountered previously during the study. The fish were caught over the course of three hours between 9:30 AM and 12:30 PM. It was evident that we could have continued to catch Bull Trout however we elected to end the effort because the spawning period was drawing near.
In 2015, hook-and-line sampling was conducted on July 2, four weeks earlier than the previous year. The weather was clear and the water temperature was quite a bit warmer at 13.5°C. Sixteen adult Bull Trout were caught. Two were fish that had been captured and tagged previously, a female tagged at the trap in 2013 and a male tagged the previous year below the dam. The fish were caught over the course of about four hours between 8:15 AM and 12:05 PM. Sampling ended when no fish were caught during the last 30 minutes of effort.
PIT Tagging (below dam)
A combined total of 22 adult Bull Trout captured below the dam were implanted with HDX PIT tags in 2014 and 2015. These included 7 males and 15 females. The average TL of the fish tagged was 56 cm, ranging from 44 to 67.5 cm. The results by year are presented below.
2014
Ten adult Bull Trout were tagged in 2014 including four males and six females. A genetic sample was taken from another 58 cm (TL) male but this fish, which was bleeding slightly from the mouth, was not tagged and was immediately released downstream after obtaining a fin clip. The average TL of the tagged fish was 51.7 cm, ranging from 44-62 cm. After visual inspection, none of the fish caught were suspected to be hybrids. A list of the fish tagged in 2014 below Clear Creek Dam along with relevant information about each is presented in Table 4.
2015
Twelve adult Bull Trout were tagged in 2015 including three males and nine females. In addition to the two recaptures previously mentioned, two other fish were caught but not tagged. One 38 cm (sex unknown) fish was deemed too small to tag and a 51 cm female, which was bleeding slightly from the mouth, was not tagged. Both were immediately released downstream after obtaining a fin clip. The average TL of the tagged fish was 59.5 cm, ranging from 51-67.5 cm.
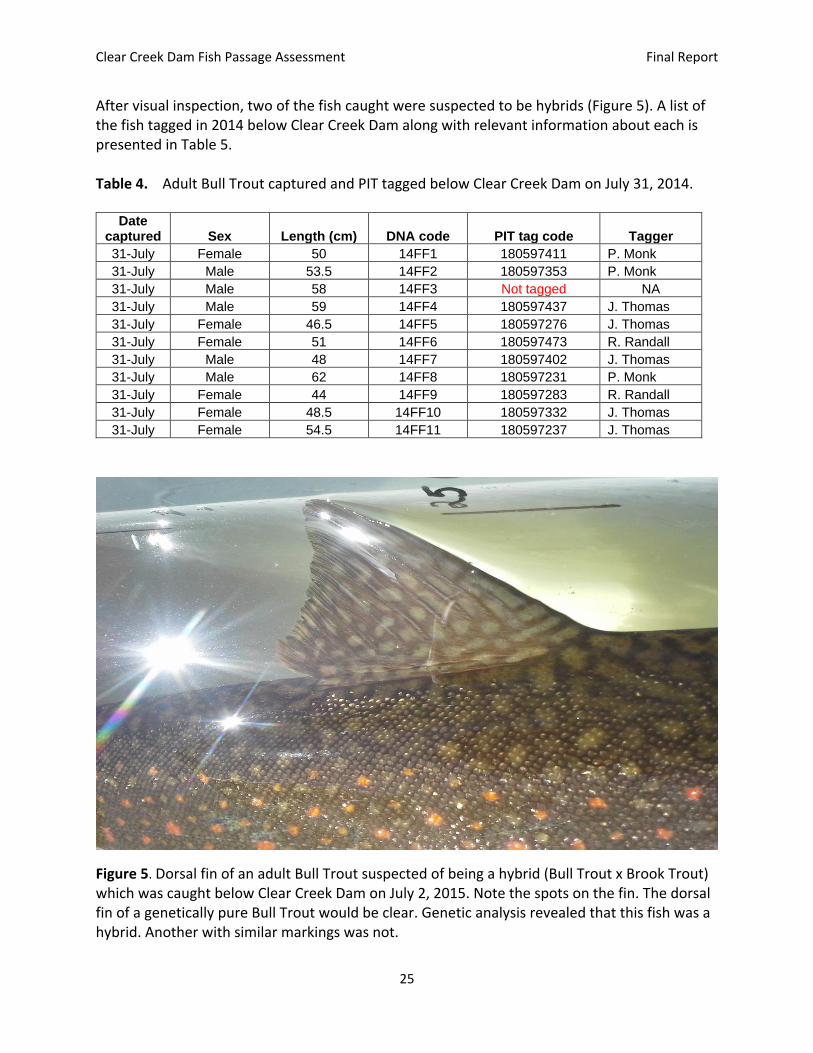
Clear Creek Dam Fish Passage Assessment Final Report
25
After visual inspection, two of the fish caught were suspected to be hybrids (Figure 5). A list of the fish tagged in 2014 below Clear Creek Dam along with relevant information about each is presented in Table 5. Table 4. Adult Bull Trout captured and PIT tagged below Clear Creek Dam on July 31, 2014.
Date captured Sex Length (cm) DNA code PIT tag code Tagger
31-July Female 50 14FF1 180597411 P. Monk
31-July Male 53.5 14FF2 180597353 P. Monk
31-July Male 58 14FF3 Not tagged NA
31-July Male 59 14FF4 180597437 J. Thomas
31-July Female 46.5 14FF5 180597276 J. Thomas
31-July Female 51 14FF6 180597473 R. Randall
31-July Male 48 14FF7 180597402 J. Thomas
31-July Male 62 14FF8 180597231 P. Monk
31-July Female 44 14FF9 180597283 R. Randall
31-July Female 48.5 14FF10 180597332 J. Thomas
31-July Female 54.5 14FF11 180597237 J. Thomas
Figure 5. Dorsal fin of an adult Bull Trout suspected of being a hybrid (Bull Trout x Brook Trout) which was caught below Clear Creek Dam on July 2, 2015. Note the spots on the fin. The dorsal fin of a genetically pure Bull Trout would be clear. Genetic analysis revealed that this fish was a hybrid. Another with similar markings was not.
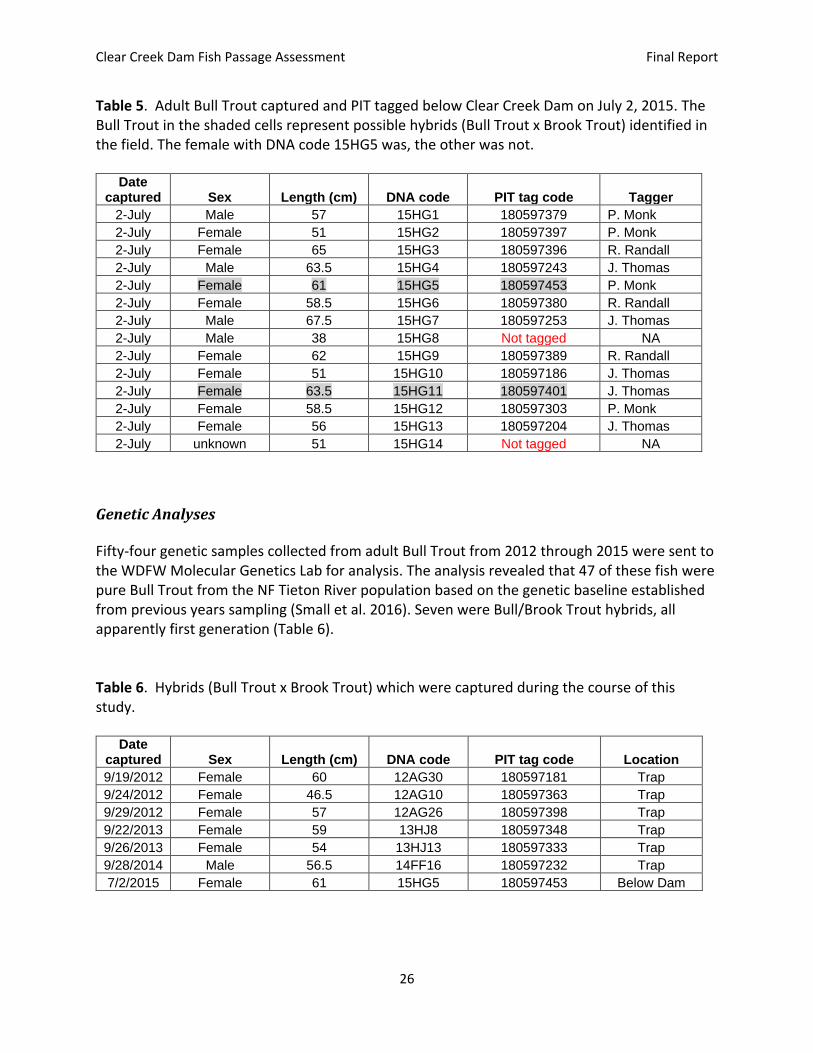
Clear Creek Dam Fish Passage Assessment Final Report
26
Table 5. Adult Bull Trout captured and PIT tagged below Clear Creek Dam on July 2, 2015. The Bull Trout in the shaded cells represent possible hybrids (Bull Trout x Brook Trout) identified in the field. The female with DNA code 15HG5 was, the other was not.
Date captured Sex Length (cm) DNA code PIT tag code Tagger
2-July Male 57 15HG1 180597379 P. Monk
2-July Female 51 15HG2 180597397 P. Monk
2-July Female 65 15HG3 180597396 R. Randall
2-July Male 63.5 15HG4 180597243 J. Thomas
2-July Female 61 15HG5 180597453 P. Monk
2-July Female 58.5 15HG6 180597380 R. Randall
2-July Male 67.5 15HG7 180597253 J. Thomas
2-July Male 38 15HG8 Not tagged NA
2-July Female 62 15HG9 180597389 R. Randall
2-July Female 51 15HG10 180597186 J. Thomas
2-July Female 63.5 15HG11 180597401 J. Thomas
2-July Female 58.5 15HG12 180597303 P. Monk
2-July Female 56 15HG13 180597204 J. Thomas
2-July unknown 51 15HG14 Not tagged NA
Genetic Analyses
Fifty-four genetic samples collected from adult Bull Trout from 2012 through 2015 were sent to the WDFW Molecular Genetics Lab for analysis. The analysis revealed that 47 of these fish were pure Bull Trout from the NF Tieton River population based on the genetic baseline established from previous years sampling (Small et al. 2016). Seven were Bull/Brook Trout hybrids, all apparently first generation (Table 6). Table 6. Hybrids (Bull Trout x Brook Trout) which were captured during the course of this study.
Date captured Sex Length (cm) DNA code PIT tag code Location
9/19/2012 Female 60 12AG30 180597181 Trap
9/24/2012 Female 46.5 12AG10 180597363 Trap
9/29/2012 Female 57 12AG26 180597398 Trap
9/22/2013 Female 59 13HJ8 180597348 Trap
9/26/2013 Female 54 13HJ13 180597333 Trap
9/28/2014 Male 56.5 14FF16 180597232 Trap
7/2/2015 Female 61 15HG5 180597453 Below Dam
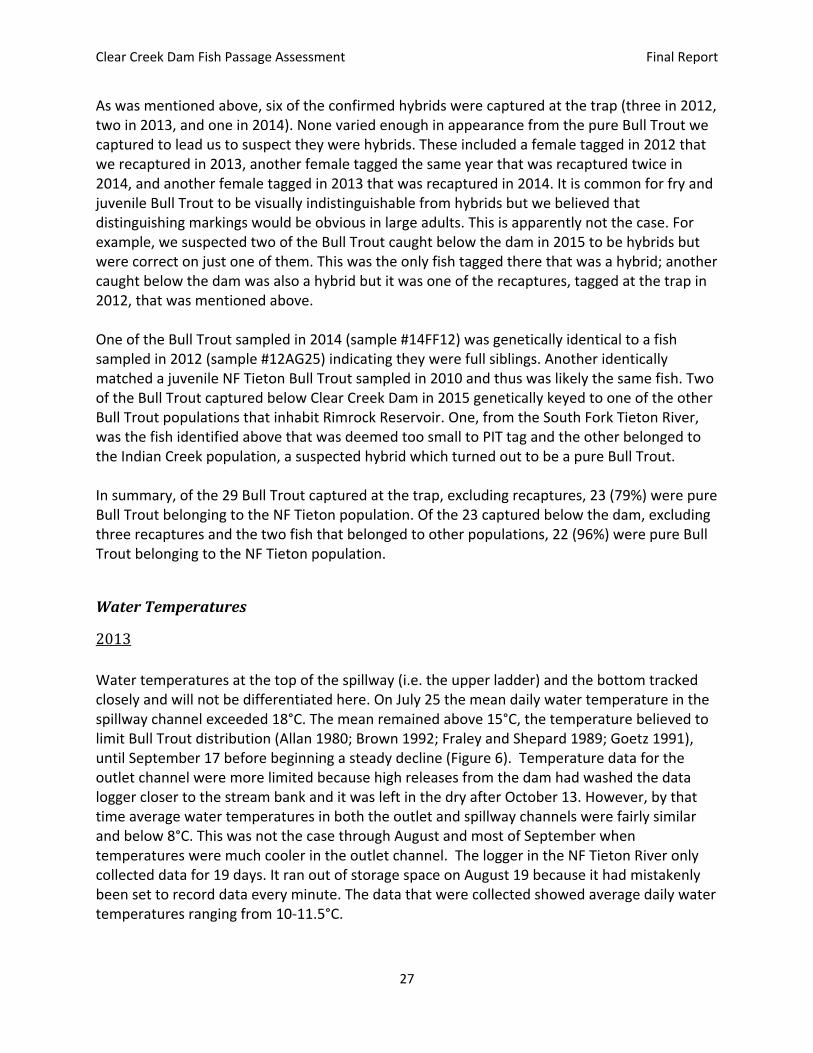
Clear Creek Dam Fish Passage Assessment Final Report
27
As was mentioned above, six of the confirmed hybrids were captured at the trap (three in 2012, two in 2013, and one in 2014). None varied enough in appearance from the pure Bull Trout we captured to lead us to suspect they were hybrids. These included a female tagged in 2012 that we recaptured in 2013, another female tagged the same year that was recaptured twice in 2014, and another female tagged in 2013 that was recaptured in 2014. It is common for fry and juvenile Bull Trout to be visually indistinguishable from hybrids but we believed that distinguishing markings would be obvious in large adults. This is apparently not the case. For example, we suspected two of the Bull Trout caught below the dam in 2015 to be hybrids but were correct on just one of them. This was the only fish tagged there that was a hybrid; another caught below the dam was also a hybrid but it was one of the recaptures, tagged at the trap in 2012, that was mentioned above. One of the Bull Trout sampled in 2014 (sample #14FF12) was genetically identical to a fish sampled in 2012 (sample #12AG25) indicating they were full siblings. Another identically matched a juvenile NF Tieton Bull Trout sampled in 2010 and thus was likely the same fish. Two of the Bull Trout captured below Clear Creek Dam in 2015 genetically keyed to one of the other Bull Trout populations that inhabit Rimrock Reservoir. One, from the South Fork Tieton River, was the fish identified above that was deemed too small to PIT tag and the other belonged to the Indian Creek population, a suspected hybrid which turned out to be a pure Bull Trout. In summary, of the 29 Bull Trout captured at the trap, excluding recaptures, 23 (79%) were pure Bull Trout belonging to the NF Tieton population. Of the 23 captured below the dam, excluding three recaptures and the two fish that belonged to other populations, 22 (96%) were pure Bull Trout belonging to the NF Tieton population.
Water Temperatures
2013
Water temperatures at the top of the spillway (i.e. the upper ladder) and the bottom tracked closely and will not be differentiated here. On July 25 the mean daily water temperature in the spillway channel exceeded 18°C. The mean remained above 15°C, the temperature believed to limit Bull Trout distribution (Allan 1980; Brown 1992; Fraley and Shepard 1989; Goetz 1991), until September 17 before beginning a steady decline (Figure 6). Temperature data for the outlet channel were more limited because high releases from the dam had washed the data logger closer to the stream bank and it was left in the dry after October 13. However, by that time average water temperatures in both the outlet and spillway channels were fairly similar and below 8°C. This was not the case through August and most of September when temperatures were much cooler in the outlet channel. The logger in the NF Tieton River only collected data for 19 days. It ran out of storage space on August 19 because it had mistakenly been set to record data every minute. The data that were collected showed average daily water temperatures ranging from 10-11.5°C.
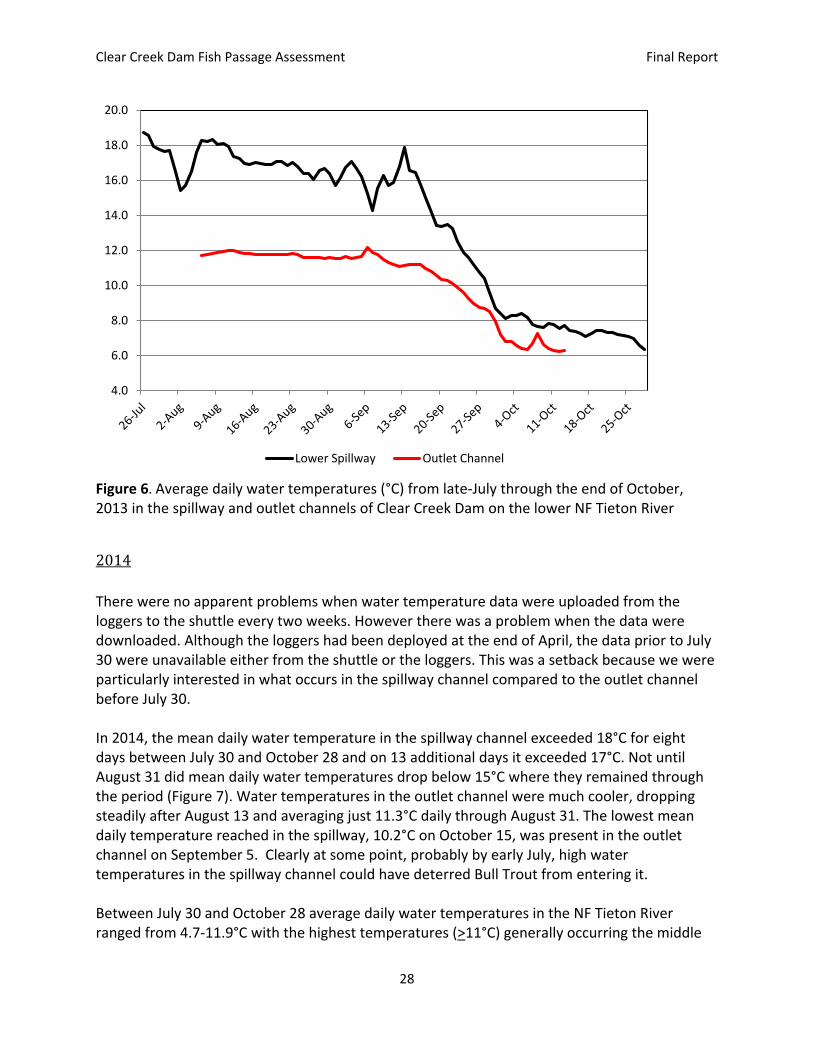
Clear Creek Dam Fish Passage Assessment Final Report
28
Figure 6. Average daily water temperatures (°C) from late-July through the end of October, 2013 in the spillway and outlet channels of Clear Creek Dam on the lower NF Tieton River
2014
There were no apparent problems when water temperature data were uploaded from the loggers to the shuttle every two weeks. However there was a problem when the data were downloaded. Although the loggers had been deployed at the end of April, the data prior to July 30 were unavailable either from the shuttle or the loggers. This was a setback because we were particularly interested in what occurs in the spillway channel compared to the outlet channel before July 30. In 2014, the mean daily water temperature in the spillway channel exceeded 18°C for eight days between July 30 and October 28 and on 13 additional days it exceeded 17°C. Not until August 31 did mean daily water temperatures drop below 15°C where they remained through the period (Figure 7). Water temperatures in the outlet channel were much cooler, dropping steadily after August 13 and averaging just 11.3°C daily through August 31. The lowest mean daily temperature reached in the spillway, 10.2°C on October 15, was present in the outlet channel on September 5. Clearly at some point, probably by early July, high water temperatures in the spillway channel could have deterred Bull Trout from entering it. Between July 30 and October 28 average daily water temperatures in the NF Tieton River ranged from 4.7-11.9°C with the highest temperatures (>11°C) generally occurring the middle
4.0
6.0
8.0
10.0
12.0
14.0
16.0
18.0
20.0
Lower Spillway Outlet Channel
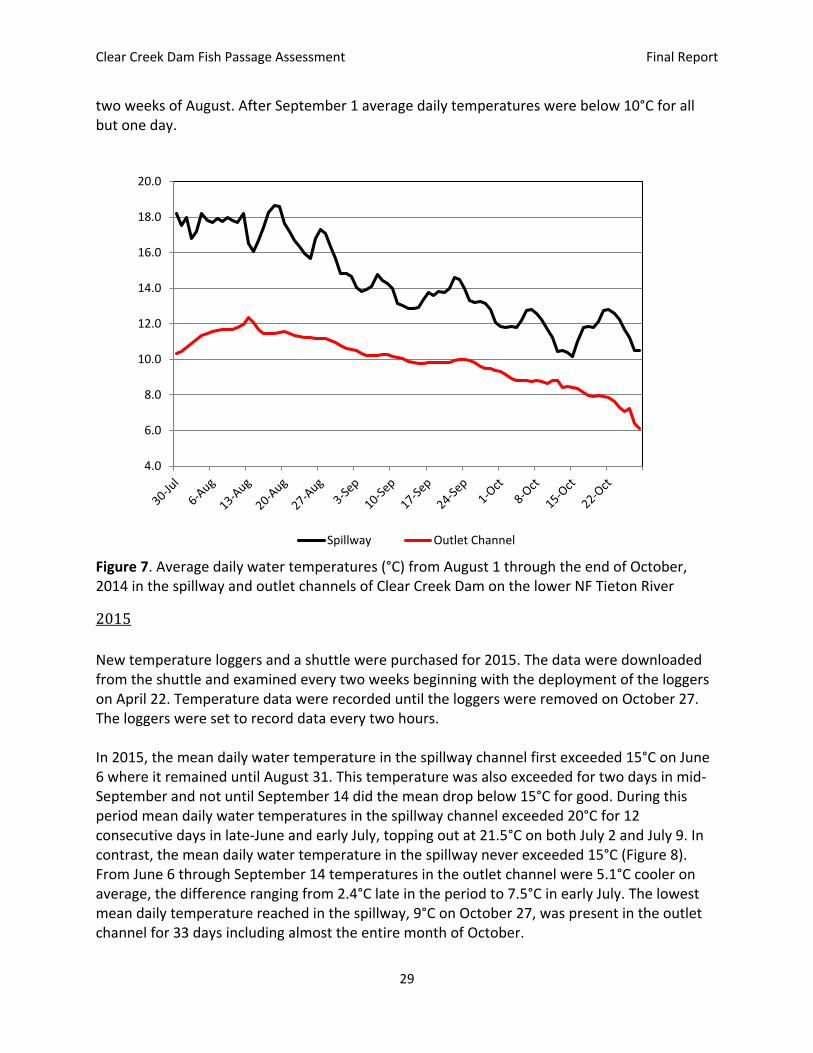
Clear Creek Dam Fish Passage Assessment Final Report
29
two weeks of August. After September 1 average daily temperatures were below 10°C for all but one day.
Figure 7. Average daily water temperatures (°C) from August 1 through the end of October, 2014 in the spillway and outlet channels of Clear Creek Dam on the lower NF Tieton River
2015
New temperature loggers and a shuttle were purchased for 2015. The data were downloaded from the shuttle and examined every two weeks beginning with the deployment of the loggers on April 22. Temperature data were recorded until the loggers were removed on October 27. The loggers were set to record data every two hours. In 2015, the mean daily water temperature in the spillway channel first exceeded 15°C on June 6 where it remained until August 31. This temperature was also exceeded for two days in mid-September and not until September 14 did the mean drop below 15°C for good. During this period mean daily water temperatures in the spillway channel exceeded 20°C for 12 consecutive days in late-June and early July, topping out at 21.5°C on both July 2 and July 9. In contrast, the mean daily water temperature in the spillway never exceeded 15°C (Figure 8). From June 6 through September 14 temperatures in the outlet channel were 5.1°C cooler on average, the difference ranging from 2.4°C late in the period to 7.5°C in early July. The lowest mean daily temperature reached in the spillway, 9°C on October 27, was present in the outlet channel for 33 days including almost the entire month of October.
4.0
6.0
8.0
10.0
12.0
14.0
16.0
18.0
20.0
Spillway Outlet Channel
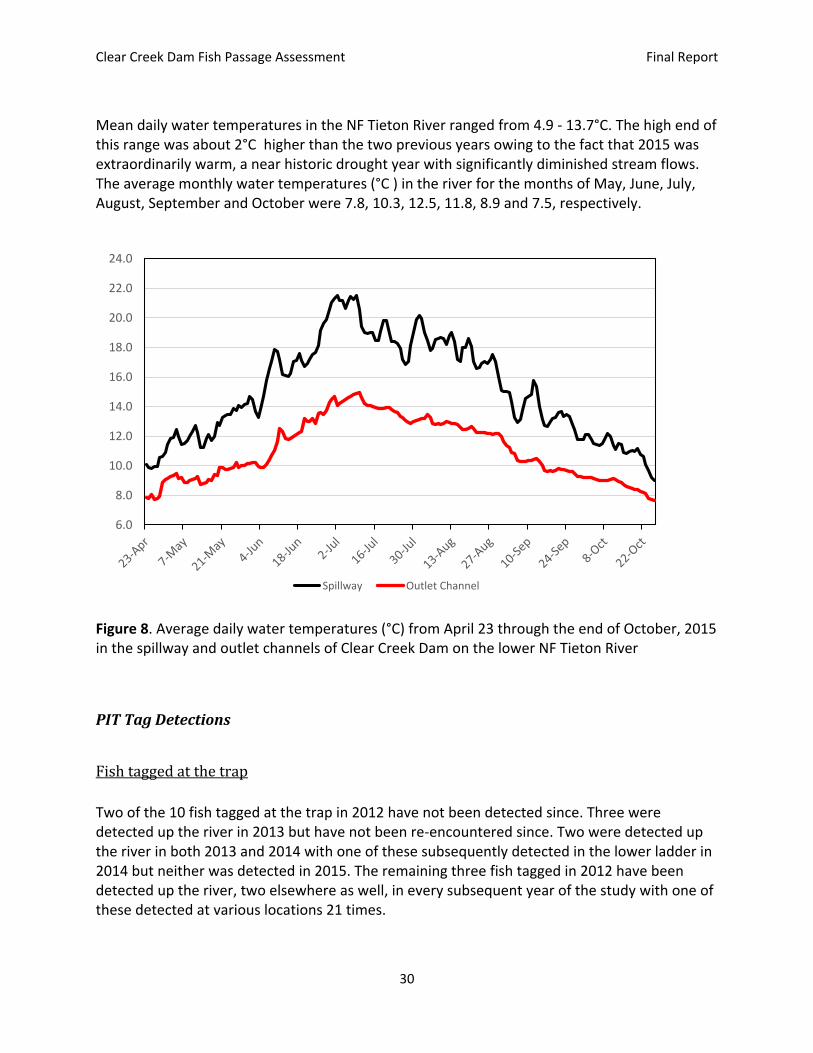
Clear Creek Dam Fish Passage Assessment Final Report
30
Mean daily water temperatures in the NF Tieton River ranged from 4.9 - 13.7°C. The high end of this range was about 2°C higher than the two previous years owing to the fact that 2015 was extraordinarily warm, a near historic drought year with significantly diminished stream flows. The average monthly water temperatures (°C ) in the river for the months of May, June, July, August, September and October were 7.8, 10.3, 12.5, 11.8, 8.9 and 7.5, respectively.
Figure 8. Average daily water temperatures (°C) from April 23 through the end of October, 2015 in the spillway and outlet channels of Clear Creek Dam on the lower NF Tieton River
PIT Tag Detections
Fish tagged at the trap
Two of the 10 fish tagged at the trap in 2012 have not been detected since. Three were detected up the river in 2013 but have not been re-encountered since. Two were detected up the river in both 2013 and 2014 with one of these subsequently detected in the lower ladder in 2014 but neither was detected in 2015. The remaining three fish tagged in 2012 have been detected up the river, two elsewhere as well, in every subsequent year of the study with one of these detected at various locations 21 times.
6.0
8.0
10.0
12.0
14.0
16.0
18.0
20.0
22.0
24.0
Spillway Outlet Channel

Clear Creek Dam Fish Passage Assessment Final Report
31
One of the 14 fish tagged in 2013 was detected leaving the NF Tieton five days later but has not been detected since. Three were confirmed both entering and leaving the river in 2014 but were not detected in 2015. Nine of the 10 remaining fish tagged in 2013 were detected up the NF Tieton in both 2014 and 2015. The last fish in this group was confirmed to have left Clear Lake, one of only four during the course of the study, which will be discussed further below. Three of the five fish tagged in 2014 were detected leaving the NF Tieton River afterward with one of these subsequently detected in the lower ladder but none were detected in 2015. The other two fish tagged in 2014 were detected up the river in 2015. The data presented above provides two important pieces of information. First, it appears that we were able to capture and tag fish with very little, if any, associated mortality or tag loss. Only two of the Bull Trout tagged, both in 2012, were not subsequently detected. This does not necessarily indicate that they did not survive the tagging procedure as the NF Tieton PIT tag interrogation site was not set up in 2012 so there was no opportunity to detect them downstream. Second, the incidence of repeat spawning for this iteroparous species was somewhat surprising. Eight of the fish tagged in 2012 migrated up the river, presumably to spawn, in successive years. Three of these showed up four successive years and two did so three times. Twelve of the 14 tagged in 2013 migrated up the river in successive years, nine of these three times. Two of the Bull Trout tagged in 2014 were detected up the river the next year. The timing of the pre-spawn migration was variable for the two years for which data were collected. In 2015, a severe drought year in the Yakima Basin, adult Bull Trout were first detected up the NF Tieton River on May 28 with the last detected on July 8. In 2014, an average water year with a cooler spring and summer, the first fish was detected up the river on June 19 and the last on August 5. In 2014, almost all immigrants (88%) were detected in July. In 2015, nearly 81 percent were detected in June. Outmigration timing was similar in all years (2013-2015), generally beginning the second week of September and ending during the first week of October. The majority of the fish (67%) left shortly after spawning in September. The data obtained from PIT tag detections which occurred in locations other than the NF Tieton River, as well as that obtained from the Bull Trout tagged below the dam, are critical in addressing the objectives of the Clear Creek Dam Fish Passage Assessment. These data will be discussed in the subsections which follow.
Clear Lake Emigration
At the inception of this investigation it was assumed that this Bull Trout population primarily resided in Rimrock Lake downstream of Clear Creek Dam. It appears that this assumption was false. Only two of the 29 adult Bull Trout PIT tagged up the NF Tieton River were definitely confirmed to have migrated downstream of Clear Lake and two others likely did. A female tagged in 2012, while never positively detected leaving the lake in any year, was detected

Clear Creek Dam Fish Passage Assessment Final Report
32
successfully ascending the spillway channel in all three years subsequent to her tagging and was also captured below Clear Creek Dam in 2014 (the genetic analysis for this fish revealed she is a hybrid). Another female tagged in 2013 was confirmed to have left Clear Lake that year and was subsequently detected attempting to return in late-summer of 2014 and 2015 (in 2015, she was also captured below the dam). Two males, one tagged in 2012 and the other in 2014, most likely left the lake in early November 2014. Both were detected in the lower ladder indicating they were progressing downstream but the lower spillway antenna had broken the week before and it was not possible to confirm any further movement. However, neither fish was detected again further up the ladder. Interestingly, these two males were genetically identical, indicating that they were full siblings.
Twenty of the 29 Bull Trout tagged up the NF Tieton River apparently never left Clear Lake as they have not been detected either leaving or coming back, yet all of these fish were detected up the river in a subsequent year or years. It might seem reasonable to conclude that a strong majority of this adfluvial population resides in Clear Lake but this conclusion is confounded by the fact that 25 of 27 adult Bull Trout sampled below Clear Creek Dam in 2014 and 2015 genetically keyed to the NF Tieton population.
Spillway Passage
Just one of the fish known to have left Clear Lake was able to successfully return. This female, the hybrid identified above, did so three times. In late-July 2013, the migration up the spillway channel took 11 days. In late-August the next year she made it in just two days; in 2015 she was not detected at the lower spillway site but emerged from the upper ladder on July 10. The other known emigrant (identified above) left Clear Lake in 2013 and unsuccessfully tried to return the two following years. From September 12-25, 2014 this female was detected repeatedly at the lower spillway site but never emerged at the top. In 2015 she made repeated attempts on six days between August 5 and September 7 with the same result. The two other Bull Trout believed to have left Clear Lake in 2014 were not re-encountered in 2015. A total of 22 fish were PIT tagged below Clear Creek Dam. Fifteen of these (six from 2014 and nine from 2015) have not been detected since. One of the fish tagged in 2014 was recaptured below the dam in 2015. The remaining six fish, all pure Bull Trout, tried and failed at least once to ascend the spillway channel. A male tagged in 2014 made repeated attempts on three days in mid-October 2014; two females tagged the same year were unsuccessful in multiple attempts in late-August 2015. Three others, all tagged in 2015, also failed to migrate up the channel that year. A female made multiple attempts on three days between July 11 and August 6; a female and a male were unsuccessful on two days in mid-September.
Clear Creek Dam Fish Passage Assessment Final Report
33
Trap Avoidance
Although potential trap avoidance behavior was only investigated the last year of the study some insight was gained specific to Bull Trout which had encountered the trap previously; it remains unknown to what degree this behavior is demonstrated for first time encounters. The PIT tag interrogation site was located about 30 yards upstream of the trap and operated for 19 days from September 11-29, 2014. It should be noted that the trap was disabled during a high flow event for a 2.5-day period near the end of the trapping operation. During this period fish could have migrated downstream past the trap. However, most of the fish were detected on multiple days with minimal holding habitat in the immediate area. These Bull Trout had traveled two to three miles from their primary spawning area. It seems unlikely that they would halt their migration for days at this location unless some trap avoidance was occurring.
Fifteen different Bull Trout (two were hybrids) were detected during the monitoring period. The data reveal that seven of these fish were probably avoiding the trap and four others may have been. Of the seven which were likely avoiding the trap, one was a male tagged in 2012; the other six, all tagged in 2013, included three males and three females with one of the females a hybrid. All seven of these fish were never recaptured after tagging although all were documented up the river in all successive years. This provides an indication that they may have been avoiding the trap after their only encounter with it although without a detection array present upstream of the trap until the last year of the study this is not certain. But with the array operating in 2014 the data show a pattern for these seven fish. The male tagged in 2012 was detected upstream of the trap on four successive days in late-September. The other six fish were detected a total of 15 days between September 15-27; three of these were detected multiple times over the course of a week. Of the four Bull Trout which may have been avoiding the trap, a male and female tagged in 2014 were detected at the site within days of their tagging. The male had been released upstream, the female likely moved back upstream when pickets had been removed from the weir panels during the high flow event described above. Both of these fish were detected on three separate days. The other two Bull which may have been avoiding the trap had been recaptured previously introducing some doubt as to whether they actually were. A male tagged in 2013 was recaptured two weeks later but this fish, detected twice upstream of the trap in 2014, was not subsequently recaptured. Another male, tagged in 2014, was recaptured two days later but it was subsequently detected upstream for eleven days and was not recaptured again. Four of the Bull Trout detected definitely did not display trap avoidance behavior. A female hybrid tagged in 2012, while not recaptured in 2013 when she was confirmed up the river, was recaptured the same day she was detected in 2014. A male tagged in 2012 was recaptured twice in both 2013 and 2014 and two females tagged in 2013, one of which had been recaptured the day after it was tagged, were recaptured in 2014 within a day of their detection upstream of the trap.

Clear Creek Dam Fish Passage Assessment Final Report
34
Effective Population Size
Because of the inherent unpredictability of nature, the conservation of species depends on protecting genetic diversity. When diversity is lost, genetic combinations that ensure survival in variable environments may be lost as well (Rieman and McIntyre 1993; Rieman and Allendorf 2001). Genetic variation will be lost through time in isolated populations and this loss occurs more quickly in small populations than in large ones. Loss of genetic variation can influence the dynamics and persistence of populations through at least three mechanisms: inbreeding depression, loss of phenotypic variation and plasticity, and loss of evolutionary potential (Allendorf and Ryman 2002). Both theory and empirical evidence clearly indicate the populations that are small and isolated will eventually lose genetic variation and have an increased probability of extirpation (Frankham 1996; Wofford et al. 2005; Whiteley et al. 2010) The implication is that some minimum number of organisms and effective interactions are necessary to maintain genetic diversity and ensure the persistence of a population. Soulé (1987) asserted that the scientific community should provide guidance for the public so conservation programs could proceed. In 1980, he proposed the “50/500” rule (Soulé 1980). That is, in a completely closed population an effective population size (Ne) of 50 is needed to prevent excessive rates of inbreeding and 500 are needed to maintain genetic variation. Following the “50/500” rule, Rieman and Allendorf (2001) used VORTEX (Miller and Lacy 1999), a generalized, age-structured, simulations model, to relate Ne to adult numbers under a range of life histories and other conditions characteristic of Bull Trout populations. Their most realistic estimates of Ne were between 0.5 and 1.0 times the mean number of adults spawning annually. Therefore, a cautious interpretation of their results would be that an average of 100 (i.e., 100 x 0.5 = 50) adults spawning each year would be required to minimize risks of inbreeding depression in a population and 1,000 (i.e., 1,000 x 0.5 = 500) would be necessary to maintain genetic variation indefinitely. Effective population size was calculated by the WDFW Genetics Lab. The statistic was calculated for each of the collection years using the pairwise sibship method implemented in the program COLONY (Wang 2004). In the pairwise sibship method, the program uses maximum likelihood to estimate whether a pair of samples are full-sibs, half-sibs, or unrelated. Then it calculates the effective number of parents that gave rise to the collection. The program assumes that the collection is a single age class and the Bull Trout collected in a single year might include multiple age classes. Therefore the estimate should be treated cautiously. The effective population sizes calculated for the three collection years were fairly consistent: 2012 (Ne = 18, 95% CI 8-58), 2013 (Ne = 23, 95% CI 12-56), and 2014 (Ne = 21, 95% CI = 10-49). Because only a subset of fish may spawn in a given year and reproductive success is unequal, the effective population size is generally smaller than the census size.

Clear Creek Dam Fish Passage Assessment Final Report
35
Estimated Population Size An estimate of the size of the populations, which was based upon mark-recapture methods, was derived for the spawning population (i.e., fish tagged at the trap) and the segment of the population found below Clear Creek Dam. Using three years of capture data (2012-2014), the maximum likelihood estimate for the size of the spawning population was 59 individuals with a 95% confidence interval of 37-135 (Schnabel, 1938). Using the Chapman method and tagging data from 2014 and 2015, the size of the population found in the stilling basin below the dam was estimated at 71 individuals with a 95% confidence interval of 41-95.
Discussion
When this investigation began in 2012 the demographics of the NF Tieton River Bull Trout population were largely unknown. Confirmed as a viable population just eight years previous, sporadic redd surveys had done little to shed light on the size of the population. The foraging, overwintering, and migration (FMO) habitat this population utilized was a matter of speculation while the ability of fish to migrate up the spillway channel of Clear Creek Dam was totally unknown. The Clear Creek Dam Fish Passage Assessment has provided answers to these questions. The population is split between two segments which are genetically identical. One segment currently spawns in the river above Clear Creek Dam and the other appears to be trapped below it. Annual effective population size (Ne) values for the segment above the dam ranged from 18-23 individuals with 95% confidence intervals ranging from 8-58 for the three years combined. Effective population size is a theoretical construct and does not represent the actual size of a population. However, it is valid indicator of a population’s status with respect to genetic diversity. This population segment appears to be relatively small and is likely at risk of losing genetic variation over time. Trapping data also indicate this population is of limited size. In 2013, over 25 percent of the fish trapped up the river were recaptures. This percentage increased in 2014 when eight of 13 Bull Trout trapped (>60%) fell into this category. This was the primary reason the trapping operation was ended after three years. The estimated size of this population segment was between 37-135 individuals. It is obvious that this population primarily utilizes Clear Lake for FMO habitat as only four of the 29 fish tagged in three years migrated downstream of the lake.
The abundance of the population that resides downstream of Clear Creek Dam is roughly equivalent to the one above the dam. In just two days (about seven hours) of sampling, 23 of 28 Bull Trout captured (82%) belonged to the NF Tieton population. This number excludes three NF Tieton fish tagged previously and the only two Bull Trout captured below the dam that genetically keyed to another population. The size of this population was estimated between 41-95 fish. Obviously, this estimate should be cautiously considered since it was derived from just two sampling occasions and one year of recapture data (2015 when just one fish was recaptured). Nevertheless, it is clear that large numbers of NF Tieton Bull Trout are apparently unable to join the spawning population above the dam.
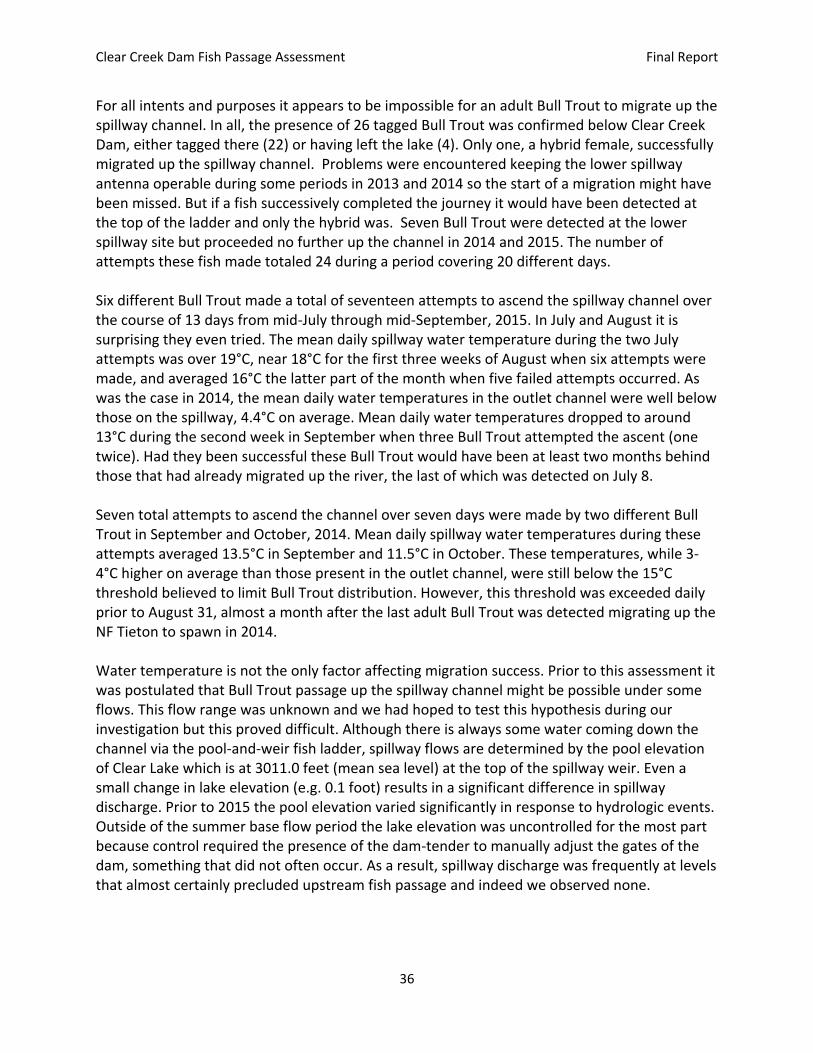
Clear Creek Dam Fish Passage Assessment Final Report
36
For all intents and purposes it appears to be impossible for an adult Bull Trout to migrate up the spillway channel. In all, the presence of 26 tagged Bull Trout was confirmed below Clear Creek Dam, either tagged there (22) or having left the lake (4). Only one, a hybrid female, successfully migrated up the spillway channel. Problems were encountered keeping the lower spillway antenna operable during some periods in 2013 and 2014 so the start of a migration might have been missed. But if a fish successively completed the journey it would have been detected at the top of the ladder and only the hybrid was. Seven Bull Trout were detected at the lower spillway site but proceeded no further up the channel in 2014 and 2015. The number of attempts these fish made totaled 24 during a period covering 20 different days. Six different Bull Trout made a total of seventeen attempts to ascend the spillway channel over the course of 13 days from mid-July through mid-September, 2015. In July and August it is surprising they even tried. The mean daily spillway water temperature during the two July attempts was over 19°C, near 18°C for the first three weeks of August when six attempts were made, and averaged 16°C the latter part of the month when five failed attempts occurred. As was the case in 2014, the mean daily water temperatures in the outlet channel were well below those on the spillway, 4.4°C on average. Mean daily water temperatures dropped to around 13°C during the second week in September when three Bull Trout attempted the ascent (one twice). Had they been successful these Bull Trout would have been at least two months behind those that had already migrated up the river, the last of which was detected on July 8. Seven total attempts to ascend the channel over seven days were made by two different Bull Trout in September and October, 2014. Mean daily spillway water temperatures during these attempts averaged 13.5°C in September and 11.5°C in October. These temperatures, while 3-4°C higher on average than those present in the outlet channel, were still below the 15°C threshold believed to limit Bull Trout distribution. However, this threshold was exceeded daily prior to August 31, almost a month after the last adult Bull Trout was detected migrating up the NF Tieton to spawn in 2014. Water temperature is not the only factor affecting migration success. Prior to this assessment it was postulated that Bull Trout passage up the spillway channel might be possible under some flows. This flow range was unknown and we had hoped to test this hypothesis during our investigation but this proved difficult. Although there is always some water coming down the channel via the pool-and-weir fish ladder, spillway flows are determined by the pool elevation of Clear Lake which is at 3011.0 feet (mean sea level) at the top of the spillway weir. Even a small change in lake elevation (e.g. 0.1 foot) results in a significant difference in spillway discharge. Prior to 2015 the pool elevation varied significantly in response to hydrologic events. Outside of the summer base flow period the lake elevation was uncontrolled for the most part because control required the presence of the dam-tender to manually adjust the gates of the dam, something that did not often occur. As a result, spillway discharge was frequently at levels that almost certainly precluded upstream fish passage and indeed we observed none.

Clear Creek Dam Fish Passage Assessment Final Report
37
During the winter of 2014-15, Reclamation’s Yakima Field Office automated the gates at Clear Creek Dam allowing them to adjust dam releases electronically from Yakima. During most of 2015, the pool elevation of Clear Lake was maintained at levels which we believed would provide hydraulic conditions on the spillway most conducive to bull trout passage. After observing the spillway for three years we had seen a wide range of flows and formed a solid opinion regarding the range of pool elevations likely to produce the best passage conditions. This range was between 3011.1 and 3011.4 feet and was not solely based on our expert opinion. The pool elevation was within this range at the time of the two successful upstream migrations by the hybrid female in 2013 and 2014 (during her third successful ascent in 2015 the pool elevation was 3011.3 feet). The pool elevation was within this range during all seven of the unsuccessful migration attempts in 2014 and all 17 which occurred in 2015. In fact, between May 1 and October 31 (184 days) the elevation was within this range for all but ten days, half of these occurring in October. In addition to high water temperatures, hydraulic conditions in the spillway channel evidently represent a formidable obstacle for migrating Bull Trout even under what were considered the most favorable flows. The data collected during this assessment have established that a definite upstream passage problem exists for Bull Trout at Clear Creek Dam on the NF Tieton River. While a segment of the NF Tieton population utilizes Clear Lake as FMO habitat, significant numbers of Bull Trout from this population reside below the dam. Without exception these fish are unable to migrate up the lower portion of the bedrock spillway channel where a non-functional denil ladder exists. Extreme hydraulic conditions not suitable for passage are present in the spillway channel under essentially all flows and high water temperatures undoubtedly deter Bull Trout from entering the channel from late-spring or early summer through about mid-September. As a result, large numbers of Bull Trout congregate in the stilling basin below the dam. Over the next two years, and perhaps beyond, efforts will be undertaken to better determine the size of the population segment trapped below the dam and also to capture as many as possible for relocation above it. These fish, if not previously tagged, will be implanted with HDX PIT tags. They, along with those previously tagged, will be transported and released into Clear Lake adjacent to the dam. Their movements will be tracked utilizing numerous PIT tag interrogation sites located around the dam and spillway channel and in the river above the lake. It is hoped they will readily join the spawning population in the NF Tieton River.

Clear Creek Dam Fish Passage Assessment Final Report
38
Acknowledgements
The Clear Creek Dam Fish Passage Assessment would not have been possible without the dedicated efforts and contributions of the individuals and organizations acknowledged below. The Washington Department of Fish and Wildlife (Region 3) was a partner throughout the course of this investigation. They provided the ATV’s necessary to travel to and from the trap site and the Region 3 screen shop manufactured, repaired and modified the trap used to capture Bull Trout in the North Fork Tieton River. John Easterbrooks and Eric Anderson worked tirelessly to assemble and disassemble the trap all three years it was used. They also contributed many days manning the trap and assisting in the PIT tagging effort. Arden Thomas with the Washington Water Trust, formerly employed by the Bureau of Reclamation’s Columbia-Cascades Area Office, was instrumental in getting the study off the ground and put in many days in the field during the first two-and-a-half years of the investigation. Also very helpful with the trapping and tagging operation were Cassandra Weekes and Ashton Bunce from the Columbia River Fisheries Enhancement Group. We would like to thank the Washington Department of Fish and Wildlife’s Molecular Genetic Lab, particularly Maureen Small and Sarah Bell, for their excellent work in conducting the genetic analyses. Crews from the Bureau of Reclamation’s Yakima Field Office provided greatly appreciated assistance constructing two antennas in the spillway channel, one which had to be rebuilt once and the other numerous times. Finally we would like to acknowledge the U.S. Forest Service’s Naches Ranger Station for their cooperation with various aspects of this study.

Clear Creek Dam Fish Passage Assessment Final Report
39
Literature Cited
Allan, J.H. 1980. Life history notes on the Dolly Varden char (Salvelinus malma) in the Upper Clearwater River, Alberta. Manuscript Report. Red Deer, AB: Energy and Natural Resources, Fish and Wildlife Division. 58 pp.
Allendorf, F.W. and N. Ryman. 2002. The role of genetics in population viability analysis. .
Population Viability Analysis. D. R. M. S.R. Beissinger. Chicago, University of Chicago Press.
Brown, L.G. 1992. Draft management guide for the bull trout Salvelinus confluentus (Suckley) on
the Wenatchee National Forest. Wenatchee, WA: Washington Department of Wildlife. 75 pp.
Craig, S.D. (1996). North Fork Tieton River snorkel data. Central Washington University. Ellensburg, WA.
Fraley, J.J. and B.B. Shepard. 1989. Life history, ecology and population status of migratory bull
trout (Salvelinus confluentus) in the Flathead Lake river system, Montana. Northwest Science. 63 (4): 133-143.
Frankham, R. 1996. "Relationship in genetic variation to population size in wildlife."
Conservation Biology 10(6): 1500-1508. Goetz, F. 1991. Bull trout life history and habitat study. Corvallis, OR: Oregon State University.
49 pp. Thesis. Harza (2000). Clear Lake Dam Fish Ladder Evaluation for the U.S. Bureau of Reclamation. Harza
Engineering, August 2000. Miller, P.S and R.C Lacey. 1999. VORTEX Version 8 Users Manual. A stochastic simulation of the
simulation process. IUCN/SSC Conservation Breeding Specialist Group. Apple Valley, Minnesota.
Mizell, M. and E. Anderson. 2008. Monitoring Federally Listed Bull Trout (Salvelinus
confluentus) Movements Proximate to Bureau of Reclamation Dams in the Yakima Basin, WDFW Submitted to USBR.
Rieman, B. E. and F. W. Allendorf. 2001. "Effective Population Size and Genetic Conservation
Criteria for Bull Trout." NORTH AMERICAN JOURNAL OF FISHERIES MANAGEMENT 21:
756-764.

Clear Creek Dam Fish Passage Assessment Final Report
40
Rieman, B. E. and J. D. McIntyre. 1993. Demographic and habitat requirements for conservation
of Bull Trout. Ogden, UT (324 25th St. Ogden 84401), U.S. Dept. of Agriculture, Forest
Service, Intermountain Research Station.
Schabel, Z.E. 1938. The estimation of the total fish population of a lake. American Mathematical
Monographs 45:348-368. Small, M. P. and D. Hawkins (2009). WDFW Yakima bull trout report. Phase 3: Genetic
Analysis of Yakima Basin Bull Trout (Salvelinus confluentus), Washington Department of Fish and Wildlife.
Small, M. P. and E. Martinez (2011). Interim genetic analysis of Yakima basin bull trout.
Small, M. P., J. Thomas and D. Hawkins (2016). Clear Creek Dam Bull Trout Passage Assessment Genetic Analysis of Yakima Basin Bull Trout (Salvelinus confluentus). Final Report. Washington Department of Fish and Wildlife.
Soulé, R. 1980. Thresholds for survival: maintaining fitness and evolutionary potential. In: Soulé, M.E.; Wilcox, B.A., eds. Conservation biology: an evolutionary-ecological perspective. Sunderland, MA: Sinauer Associates: 151-169.
Soulé, R. 1987. Where do we go from here? In: Soulé, M.E., ed. Viable populations for
conservation. Cambridge, England: Cambridge University Press: 175-183. USFWS (2005). Fish Census of the North Fork Tieton River, Yakima River Basin, Washington.
Final report, U.S. Fish and Wildlife Service, Mid-Columbia River Fishery Resource Office.
USBR (2004). Draft Predesign Memorandum. Clear Creek Dam Fish Passage Facilities. June 2004.
USBR (2005). Predesign Memorandum [Addendum]. Clear Creek Dam Fish Passage Facilities. June 2005.
USBR (2005a). Predesign Memorandum [Temperature Control Curtain]. Clear Creek Dam Fish
Passage Facilities. August 2005.
Wang, J. 2004. Sibship Reconstruction From Genetic Data With Typing Errors. Genetics 166:
1963-1979.
WDFW (1992). Memorandum from Doug Keuhn to Brent Renfro. Subject: 1992 Clear Lake Dam reconstruction- Game fish trapped inside coffer dam.

Clear Creek Dam Fish Passage Assessment Final Report
41
WDFW (2011). Creel survey and contact data from the 2011 Bull Trout Task Force.
Whiteley, A. R., K. Hastings, et al. 2010. "Genetic variation and effective population size in
isolated populations of coastal cutthroat trout " Conservation Genetics 11(5): 1929-
1943.
Wofford, J. E. B., R. E. Gresswell, et al. 2005. "Influence of Barriers to Movement on Within-
Watershed Genetic Variation of Coastal Cutthroat Trout." Ecological Applications 15(2):
628-637.
Zydlewski, G., and G. Horton, T. Dubreuil, B. Letcher, S. Casey, and J. Zydlewski. 2006. Remote Monitoring of Fish in Small Streams: A Unified Approach Using Pit Tags. Fisheries, Vol. 31 No. 10, pp. 492-502.

Clear Creek Dam Fish Passage Assessment Final Report
42
Appendix A
Photographs of the spillway channel and
existing fish ladders
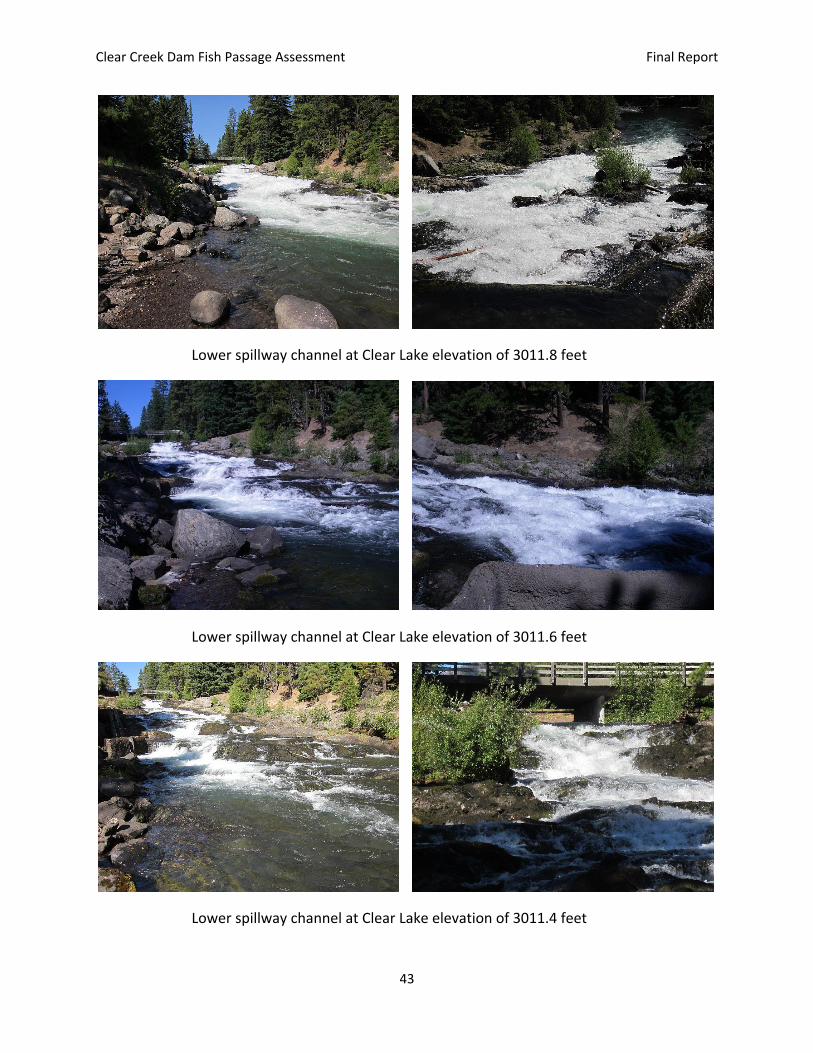
Clear Creek Dam Fish Passage Assessment Final Report
43
Lower spillway channel at Clear Lake elevation of 3011.8 feet
Lower spillway channel at Clear Lake elevation of 3011.6 feet
Lower spillway channel at Clear Lake elevation of 3011.4 feet
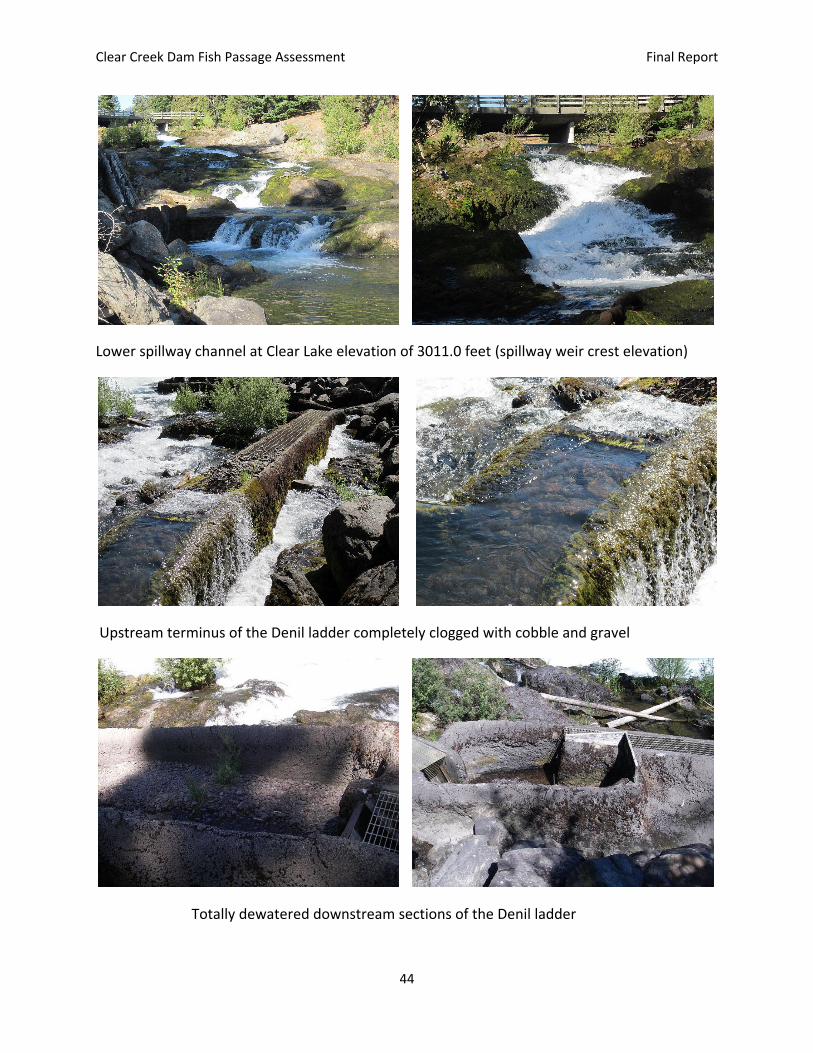
Clear Creek Dam Fish Passage Assessment Final Report
44
Lower spillway channel at Clear Lake elevation of 3011.0 feet (spillway weir crest elevation)
Upstream terminus of the Denil ladder completely clogged with cobble and gravel
Totally dewatered downstream sections of the Denil ladder
Clear Creek Dam Fish Passage Assessment Final Report
45
Upper spillway channel at lake elevation 3012.2 feet (left) and 3011.6 feet (right)
Upper spillway channel at lake elevation 3011.4 feet (left) and 3011.0 feet (right)
Pool-and-weir fish ladder in upper spillway channel

Clear Creek Dam Fish Passage Assessment Final Report
46
Appendix B
Photographs of the fish Trap on the North Fork Tieton River
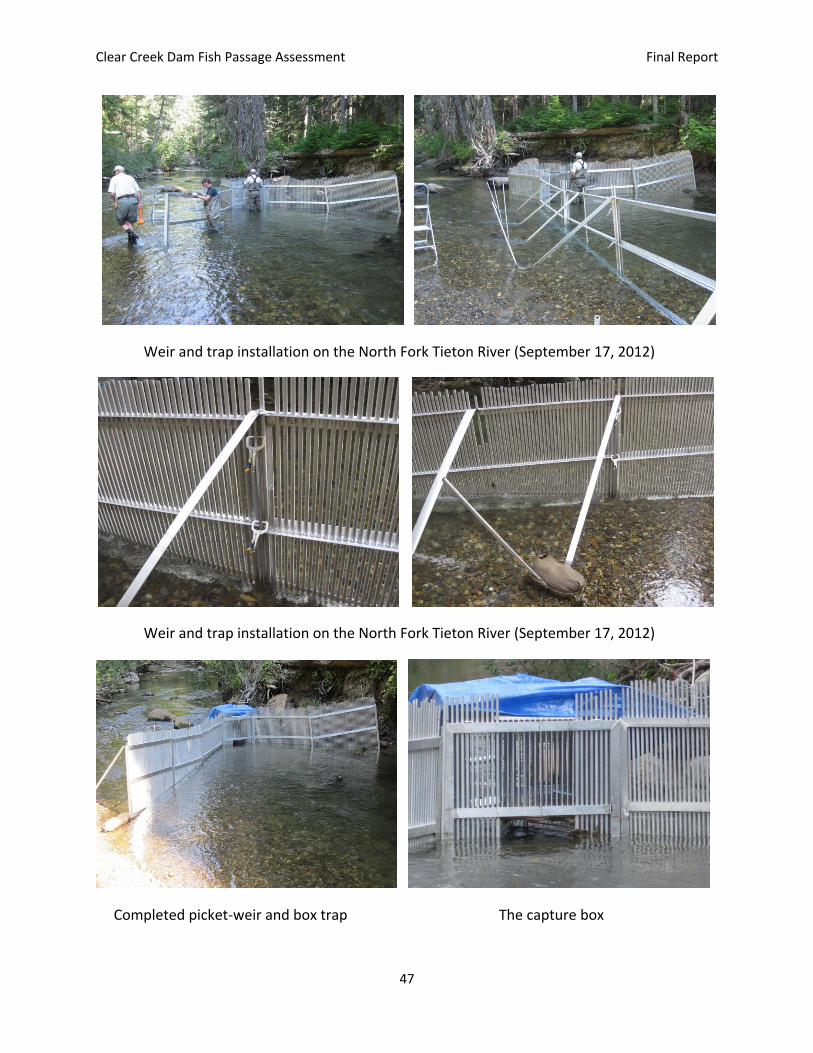
Clear Creek Dam Fish Passage Assessment Final Report
47
Weir and trap installation on the North Fork Tieton River (September 17, 2012)
Weir and trap installation on the North Fork Tieton River (September 17, 2012)
Completed picket-weir and box trap The capture box
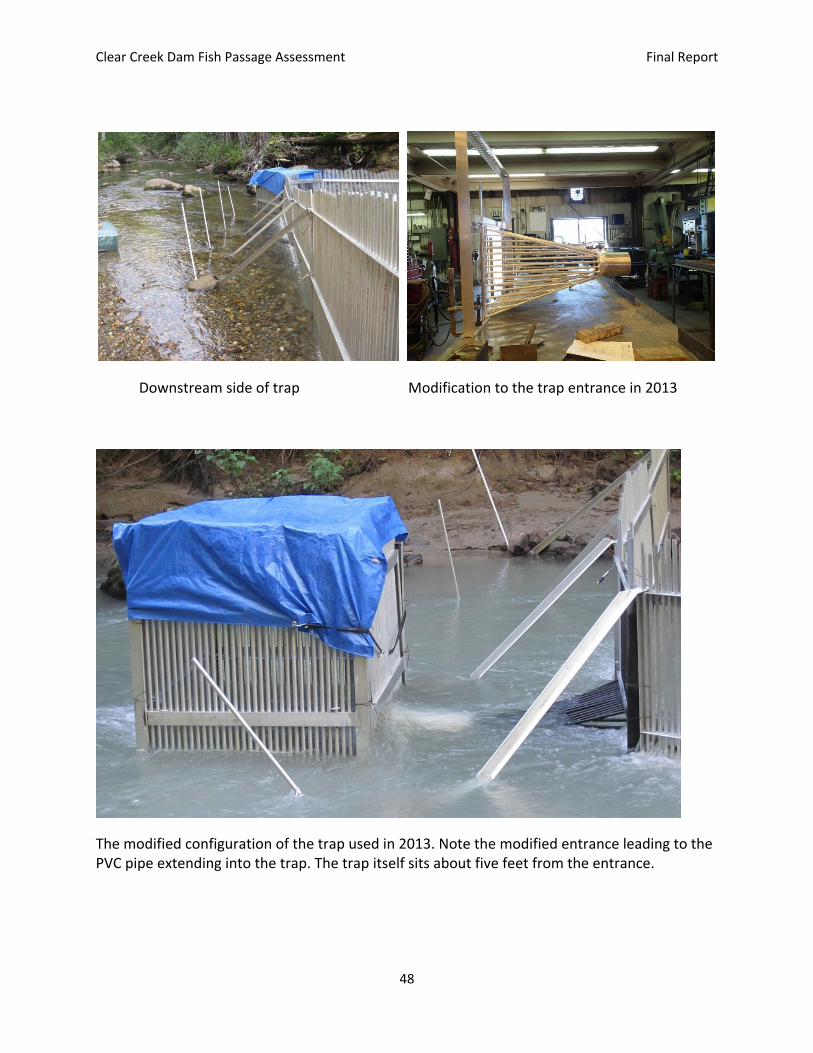
Clear Creek Dam Fish Passage Assessment Final Report
48
Downstream side of trap Modification to the trap entrance in 2013
The modified configuration of the trap used in 2013. Note the modified entrance leading to the PVC pipe extending into the trap. The trap itself sits about five feet from the entrance.

Clear Creek Dam Fish Passage Assessment Final Report
49
Appendix C
Photographs of the bull trout PIT tagging detection arrays
utilized in the study
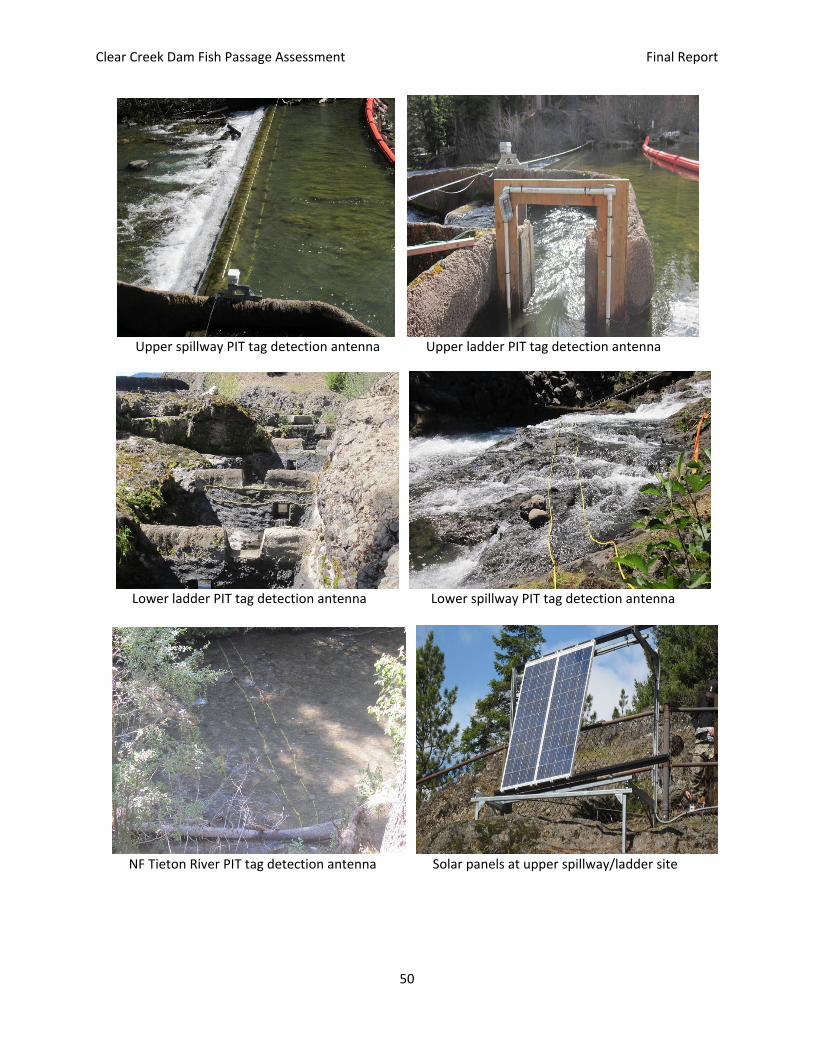
Clear Creek Dam Fish Passage Assessment Final Report
50
Upper spillway PIT tag detection antenna Upper ladder PIT tag detection antenna
Lower ladder PIT tag detection antenna Lower spillway PIT tag detection antenna
NF Tieton River PIT tag detection antenna Solar panels at upper spillway/ladder site
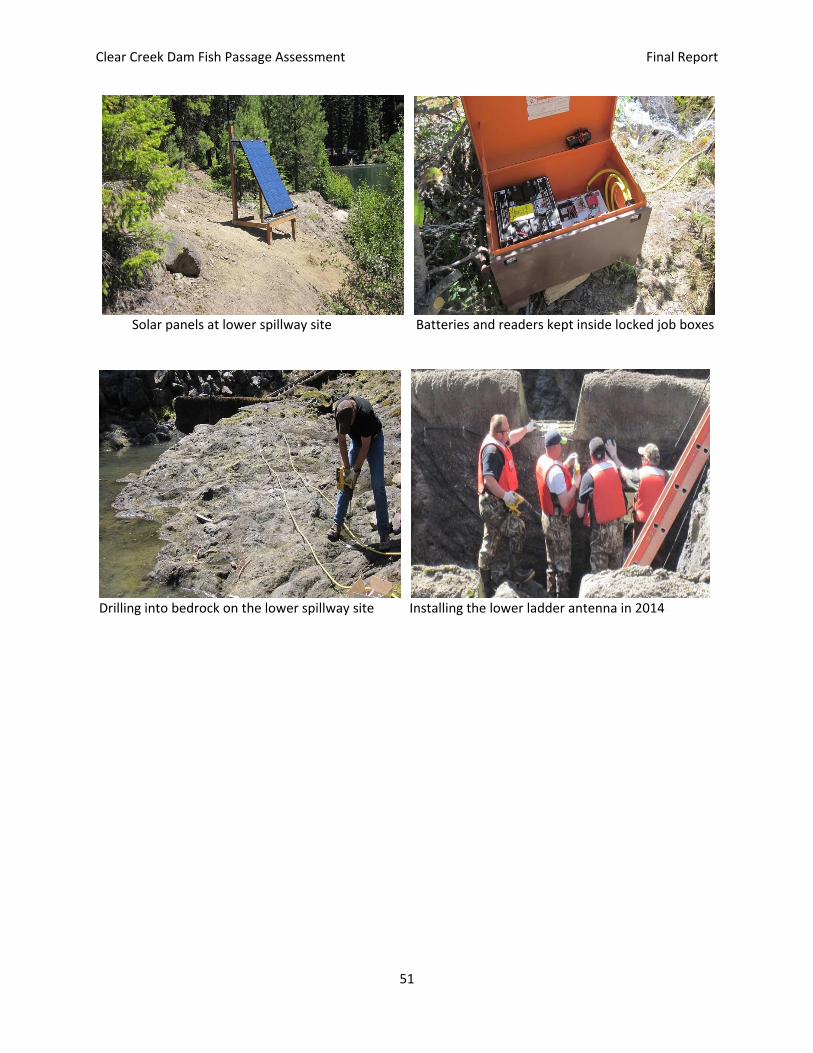
Clear Creek Dam Fish Passage Assessment Final Report
51
Solar panels at lower spillway site Batteries and readers kept inside locked job boxes
Drilling into bedrock on the lower spillway site Installing the lower ladder antenna in 2014

Clear Creek Dam Fish Passage Assessment Final Report
52
Appendix D
Photographs of the bull trout PIT tagging operation
on the North Fork Tieton River
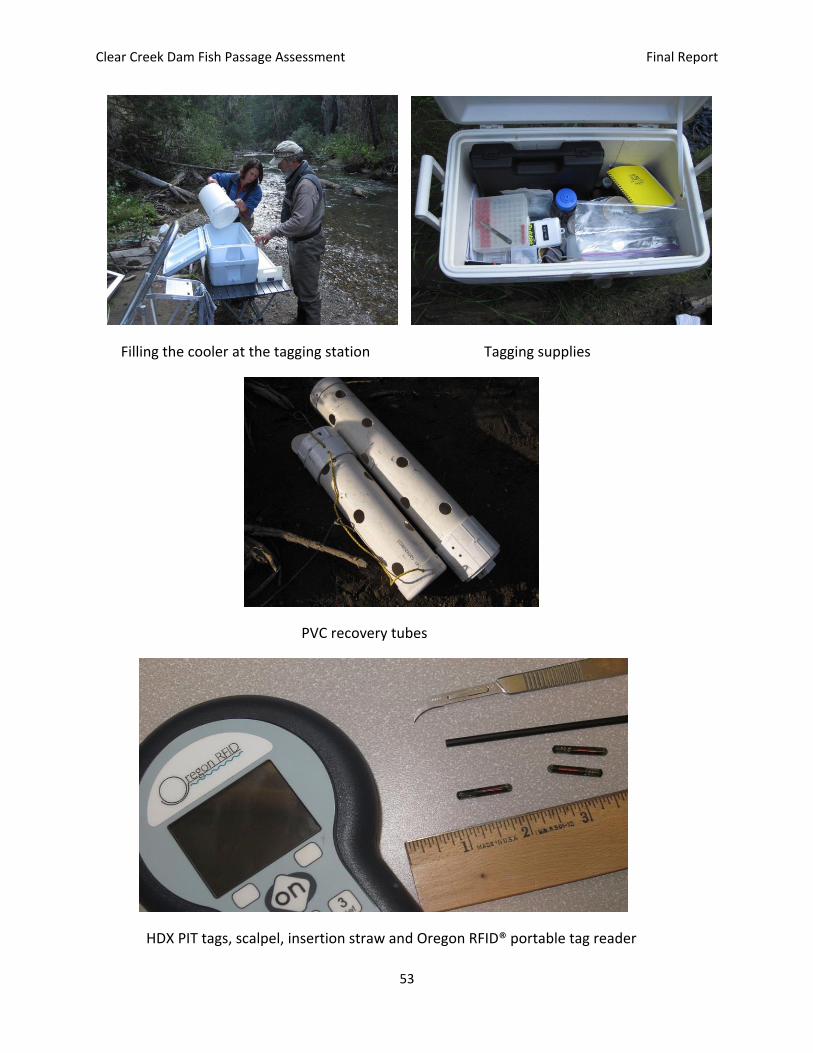
Clear Creek Dam Fish Passage Assessment Final Report
53
Filling the cooler at the tagging station Tagging supplies
PVC recovery tubes
HDX PIT tags, scalpel, insertion straw and Oregon RFID® portable tag reader
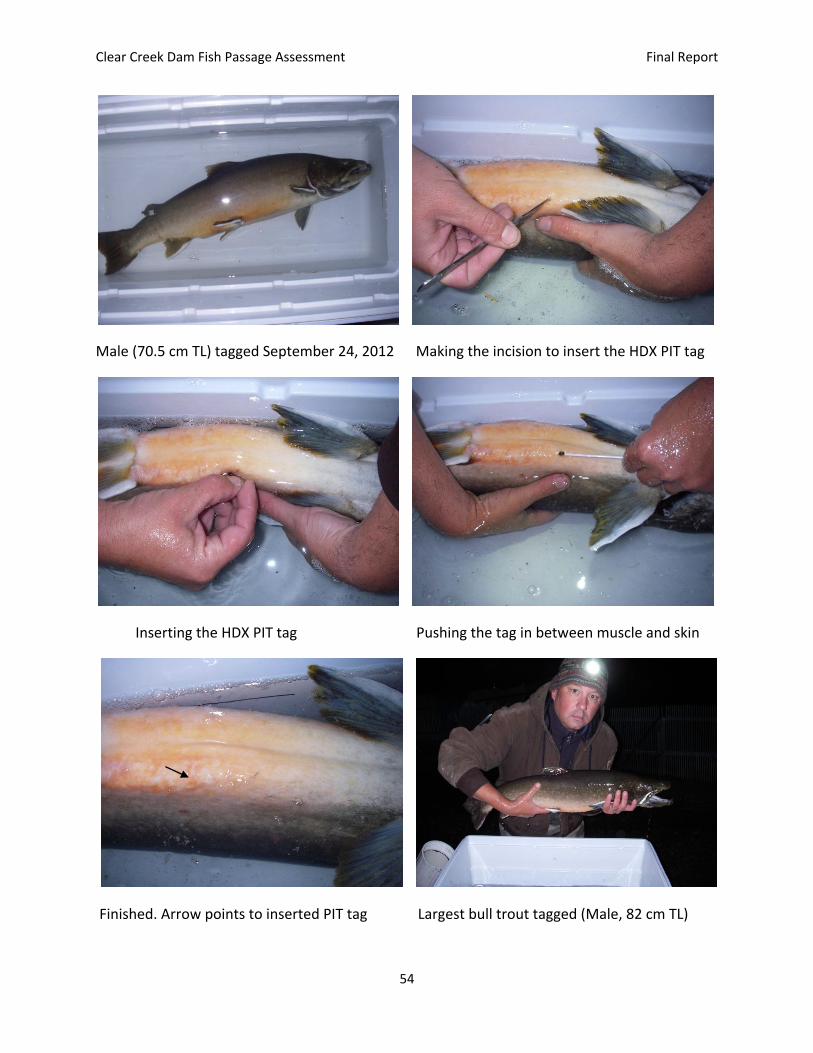
Clear Creek Dam Fish Passage Assessment Final Report
54
Male (70.5 cm TL) tagged September 24, 2012 Making the incision to insert the HDX PIT tag
Inserting the HDX PIT tag Pushing the tag in between muscle and skin
Finished. Arrow points to inserted PIT tag Largest bull trout tagged (Male, 82 cm TL)