fish creek fish passage improvement project –...
TRANSCRIPT
Fish Creek Fish Passage Improvement Project – Basis of Design
Prepared for:
Northwest California Resource Conservation and Development Council and the California State Coastal Conservancy
Prepared by:
NewFields River Basin Services, LLC
September 2013
Exhibit 2: Fish Creek Basis of Design Report
Table of Contents Introduction .................................................................................................................................................. 1
Design Process Summary .............................................................................................................................. 3
Design Alternatives Considered .................................................................................................................... 3
Basis of Design .............................................................................................................................................. 5
Target Species & Lifestage ........................................................................................................................ 5
Calculation of Lower and Upper Fish Passage Flows ................................................................................ 5
Recurrence Interval Design Flows ............................................................................................................. 7
HEC-RAS Model Files Including Boundary Conditions and Other Model Parameters .............................. 8
Water Surface Profiles and Average Channel Velocities for the Lower and Upper Fish Passage Flows, Design Flow, and the 100-Year Flow ....................................................................................................... 11
Description of Geomorphic Setting of Bottomless Culvert and Why Design is Appropriate for the Setting ..................................................................................................................................................... 15
Potential for Debris Loads or Jams at Bridge Site ................................................................................... 17
Scour Analysis ......................................................................................................................................... 17
Justification for Increases in Water Surface Elevation or Velocities Near the Bridge (if any) and the Use of Any Scour Protection .......................................................................................................................... 17
Geotechnical Assessment ....................................................................................................................... 17
Design Drawings Showing Site Topography and Dimensions of Culvert Structure in Plan, Elevation, Longitudinal Profile, and Cross-Sectional Views along with important component details............... 17
Tree Impact Minimization ........................................................................................................................... 18
Root Impact Zone Evaluation for 15’ Diameter Redwood ..................................................................... 18
Design Criteria ............................................................................................................................................. 19
Step-Pool Drop Structures ...................................................................................................................... 19
Grade Control Structure.......................................................................................................................... 20
Exhibit 2: Fish Creek Basis of Design Report

Value Engineering Note .............................................................................................................................. 20
References Cited ......................................................................................................................................... 21
Appendix A: NOAA Fisheries, Arcata Design Issues Memo & Project Team Response Memo ................... 22
Appendix B: 65% Design Drawings ............................................................................................................. 29
Exhibit 2: Fish Creek Basis of Design Report
1
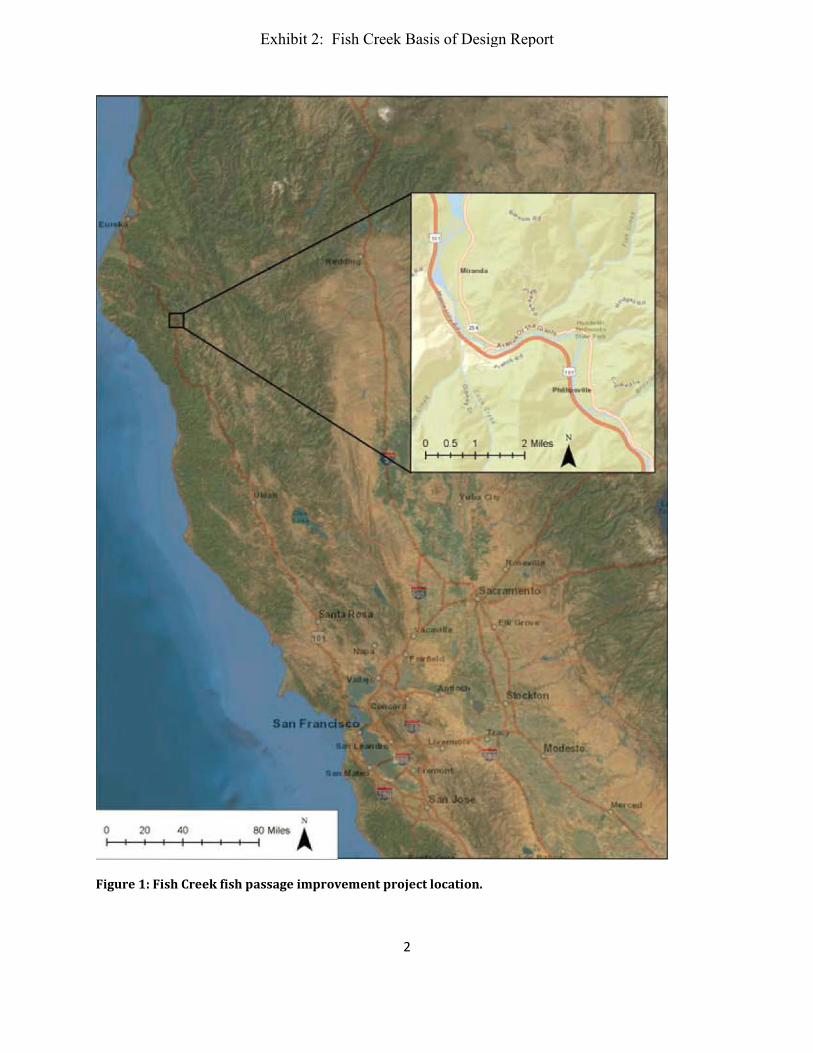
Introduction This document summarizes the basis of design for the Fish Creek Fish Passage Improvement Project. Fish Creek flows through an ancient grove of redwood trees, and the proposed project site is located at the Fish Creek crossing under State Highway 254 near Myers Flat in Humboldt County, California, within Humboldt Redwoods State Park (Figure 1). The proposed crossing would replace an existing box culvert constructed in 1919 that does not meet fish passage criteria for juvenile or adult salmonids. This was identified by CalTrans as the highest fish passage priority in District One, an area encompassing Del Norte, Humboldt, and Mendocino counties (Caltrans District 1 Pilot Fish Passage Assessment Study - Lang et al 2004).
A tributary to the South Fork Eel River, Fish Creek enters the Eel approximately 320 feet downstream of the project site. This culvert is the only fish passage barrier on Fish Creek. A 1999 California Department of Fish and Wildlife (CDFW) habitat survey identified 12,500 feet of usable salmonid habitat upstream of Fish Creek’s confluence with the South Fork Eel River. In 1993 CDFW located steelhead, Chinook, and Coho salmon in the outlet pool downstream of the existing culvert, and sixteen steelhead approximately 7,500 feet upstream of the culvert.
The proposal to remediate the Fish Creek barrier entails replacing the existing undersized and degraded seven-foot wide, six-foot tall, concrete, single-bay box culvert set at an 8% grade with a concrete arch span structure with internal step pools. The proposed design allows for full passage of adult and juvenile salmonids at the range of migration flows designated by applicable design criteria. The design also minimizes disturbance to all redwood tree root zones, a major design constraint on this project since its inception.
Exhibit 2: Fish Creek Basis of Design Report
2
Figure 1: Fish Creek fish passage improvement project location.
Exhibit 2: Fish Creek Basis of Design Report
3
Design Process Summary The proposed design builds on evaluations and discussions about fish passage improvement on Fish Creek dating back to 1993. NewFields’s involvement in Fish Creek began in July 2010 at a site visit with stakeholders including Five Counties Salmonid Conservation Program (5C), California State Parks, Caltrans, CDFW, and the State Coastal Conservancy. The site visit was intended to identify fish passage opportunities, constraints, and data gaps. The meeting was documented with photographs and meeting minutes. NewFields collected a variety of site data in November 2010, including:
• tree species, sizes, and locations
• channel cross sectional geometry and longitudinal profile
• channel bed sediment composition (pebble counts and bulk samples)
• large woody debris sizes and locations
NewFields also completed evaluations of site hydrology, hydraulics, sediment transport, and redwood root protection zones between November 2010 and March 2011. Following this analysis, NewFields presented proposed design criteria and initial design alternatives to the project stakeholders in March 2011. Extensive discussions between project stakeholders regarding the proposed design and additional design evaluations ensued; that dialogue concluded with 5C’s distribution of a report called “Fish Creek Fish Passage Improvement Project Design Alternatives Report” in March 2012. NOAA Fisheries, Arcata responded to the March 2012 alternatives report with comments focused on perceived potential sedimentation problems that could affect the performance of the proposed fish passage improvement design (Appendix A). In response to NOAA’s concerns, NewFields conducted additional analyses including hydraulic modeling and a channel bed sediment incipient motion evaluation. NewFields issued a memo in October 2012 (Appendix A) that clarified existing and expected sediment transport conditions at the project site.
In support of a proposed Fishery Restoration Grant Proposal for the proposed project, NewFields completed a brief design review with Marcin Whitman at CDFW in March 2013. At that time, the project proponents determined that additional design documentation and some minor design modifications would strengthen the application for submittal in 2014. This document summarizes the resulting 65% (approximate) design drawing package (included as Appendix B) and supporting analyses.
Design Alternatives Considered Over the course of NewFields’s involvement in the Fish Creek fish passage improvement project, the following six alternative fish passage design concepts have been considered.
No Action Alternative
The No Action Alternative would retain the existing culvert crossing that does not meet fish passage or peak flow conveyance criteria but is protective of redwood tree root zones. This alternative was
Exhibit 2: Fish Creek Basis of Design Report
4
eliminated from consideration in this design process as it does not satisfy the primary objective of fish passage improvement.
Channel Relocation Alternative (CRA)
The floodplain of Fish Creek at Highway 254 is relatively broad in in the project area, and the current Fish Creek channel flows near the western edge of the floodplain. Therefore, State Parks suggested that perhaps bypassing the original channel altogether might be an environmentally preferable way to achieve fish passage. At the site visit, the participants examined the floodplain and ancient channel remnant segments east of the current channel to determine the feasibility of establishing a high flow bypass channel to the east of the existing Fish Creek channel. Based on the site review it was determined that construction of either a new channel or a high flow bypass channel would require removal of large redwood trees and disruption of the root systems of numerous redwood trees causing more damage than an improved culvert in the existing channel alignment. In addition, a new culvert or bridge would be required for the new channel. The combination of these significant impacts eliminated this alternative from further consideration.
NOAA Fish Passage Guidelines (FPG) Alternative
The FPG Alternative is the most common design alternative selected when restoring habitat for listed anadromous salmonids in northwestern California. The Five Counties Salmonid Conservation Program and its member counties have selected this design alternative approximately 90% of the time that a fish passage improvement project is designed. Of the other 10% of design alternatives selected, only 2% did not meet the flood capacity requirements of the guidelines. On Fish Creek, meeting the FPG peak flow conveyance criteria would necessitate construction of an almost 40’ wide stream channel (based on downstream and upstream channel widths), requiring the removal of several ancient redwood trees and elevation of the state highway. Therefore, this alternative was eliminated from consideration because of its general infeasibility.
Box on Box Alternative (BOB)
The BOB Alternative would address adult migration of fish with a series of steps installed in the existing culvert combined with an additional box culvert installed above the existing culvert to convey excess peak flows and maintain hydraulics that satisfy fish passage criteria in the existing culvert. This approach would also use alternative shoring methods to minimize the excavation footprint and the resulting impact on redwood tree roots. However, while this design alternative would improve the peak flow conveyance capacity of the existing culvert, it would still not convey the Q100 flow. In addition, this approach would not satisfy juvenile fish passage criteria. Due to its biological limitations, this alternative was deemed unacceptable by CDFW biologists and was eliminated from consideration.
Adult Passage Only Alternative (APO)
The APO Alternative would construct a 20’ wide by 7’ high by approximately 110’ long box culvert with 1’ concrete steps approximately every 10’ within the culvert. The box would be set at the existing
Exhibit 2: Fish Creek Basis of Design Report
5
channel gradient. The design would meet criteria for adult fish passage but would not meet juvenile passage criteria for all possible migration flows. The alternative would increase flood flow capacity but would still not convey the Q100 year flow. In addition, this alternative would have greater root disturbance than the BOB Alternative but less than the Preferred Alternative (described below). This alternative was eliminated from consideration because it did not satisfy juvenile fish passage criteria.
Full Fish Passage Alternative (FFP)- Preferred Alternative
The FFP Alternative would construct a slightly less than 20’ wide by approximately 12’ high by approximately 110’ long open-bottom concrete box/arch culvert with 6” step-pool drop structures within the culvert. The channel slopes upstream and downstream of the culvert would be adjusted to roughly match the local slope of the existing channel in reaches outside the influence of the existing undersized culvert. In addition, some channel cut and fill would be completed upstream and downstream of the new structure to reduce the slope of the new culvert and further improve hydraulics at fish passage design flows. The design would meet criteria for adult and juvenile salmonid passage but backwater from the South Fork Eel River would begin to backwater Fish Creek at the proposed culvert at approximately a 25-year flow. Therefore, the proposed design would not pass the Q100 flow without a backwater upstream. Only the FFP and FPG alternatives provided full passage for both adult and juvenile salmonids at all migration flows. The FFP alternative balances reduced redwood disturbance and optimized passage of flood flows best and was therefore selected as the preferred alternative.
Basis of Design Per the recommendations of CDFW’s Marcin Whitman, the CDFW engineering checklist for review of culvert replacement (https://nrm.dfg.ca.gov/FileHandler.ashx?DocumentID=58461) is the organizing framework for this basis of design report. The following sections are adapted from the CDFW checklist and information is provided in each section to clearly demonstrate compliance with each checklist item.
Target Species & Lifestage The target fish species for the proposed Fish Creek fish passage improvement project are steelhead and Chinook and Coho salmon. Lamprey eel are also present, and considered to be beneficiaries of the proposed project.
Calculation of Lower and Upper Fish Passage Flows The design flows for this project are based on detailed hydrologic analysis (summarized in the following sub-sections) and guidance from CDFW in their Culvert Criteria for Fish Passage (CDFG 2002). All design flows were calculated with regression equations that give flow as a function of watershed area, precipitation, and height index. Table 1 summarizes lower and upper fish passage flows and related hydraulic design criteria. Lower fish passage flows were assumed as 1 and 3 cfs for juvenile and adult salmonids, respectively, and higher fish passage flows were calculated as a percentage of the 2-year flow for the watershed, both according to CDFW guidance for creeks without historical gage data.
Exhibit 2: Fish Creek Basis of Design Report

6
Table 1: Fish passage design flow criteria (based on CDFW guidance for hydraulic design)
Species / Lifestage High Design
Flow (cfs) Low Design Flow (cfs)
Maximum Average Velocity
(ft/sec)
Minimum Flow Depth
(ft)
Maximum Drop (ft)
Adult Anadromous Salmonids
253* 3 4 – 5 1.0 1
Juvenile Anadromous Salmonids
51** 1 1 0.5 0.5
*Equivalent to 50% of the 2-year flow **Equivalent to 10% of the 2-year flow Watershed Area
The watershed area for Fish Creek upstream of the Avenue of the Giants was delineated using the project Geographic Information System (GIS) and digitally rectified 1:24,000 scale USGS topographic maps. The watershed area was calculated at 4.53 square miles, which compares closely to the watershed area delineated using CalWater and shared drainage divides.
Average Annual Precipitation
Average annual precipitation was determined from PRISM data and was verified by NOAA precipitation data from the Garberville weather station. The PRISM data consisted of gridded data from 1971 to 2000 (http://www.prism.oregonstate.edu/products/viewer.phtml?file=/pub/prism/us_30s/graphics/ppt/Normals/us_ppt_1971_2000.14.png&year=1971_2000&vartype=ppt&month=14&status=final ). This data was downloaded and converted from an ASCII file to an ArcInfo GRID format and imported into the Fish Creek project GIS. The cell size is 800 meters and 19 cells were at least 50% contained in the Fish Creek watershed upstream of the Avenue of Giants. The 30-year average annual precipitation for the watershed was calculated as 57.7 inches by averaging the values in the 19 cells. The PRISM data was compared to Western Regional Climate Center precipitation data from 1971 to 2000 at Garberville, CA (Station # 043320, http://www.wrcc.dri.edu/cgi-bin/cliMAIN.pl?ca3320 ). The Garberville 30-year average annual precipitation is 55.85 inches and the weather station is located about 20 miles south of Fish Creek. The values from the PRISM data were used for the hydrologic calculations and were considered reasonable when compared with the Garberville weather station data.
Height Index
The height index is the average of the elevations (in thousands of feet) at 10% and 85% of the distance from the project site to the basin divide, measured along the main channel and the overland travel path
Exhibit 2: Fish Creek Basis of Design Report

7
to the basin divide (Caltrans 2010).The height index for the project area was determined by digitizing the Fish Creek channel centerline on the digital USGS 1:24,000 topographic map in GIS from the Avenue of the Giants to the drainage divide along the centerline of the creek. The overland flow path upstream of the headwaters channel was based on topography to the drainage divide. The terminal drainage divide was located at a saddle and was not the highest point in the watershed. The distance of the digitized line was calculated in GIS and the elevation taken from the digital USGS 1:24,000 topographic map at 10% (290’) and 85% (1520’) of the total channel width upstream of the Avenue of the Giants. For the North Coast region, the minimum value for the height index is 1.0. For the Fish Creek watershed upstream of the project site, the height index was calculated as 0.905. Therefore, the value used for the regional regression calculations was 1.0.
Recurrence Interval Design Flows Regional regression equations for the North Coast were used to estimate a range of recurrence interval flows in Fish Creek. The regional regression equations were developed by the USGS and are described by Wannenen and Crippen (1977). The regional regression equations for the North Coast Region are listed below for 2, 5, 10, 25, 50, 100-year recurrence intervals.
Q2=3.52 A0.90 P0.89 H-0.87
Q5=5.04 A0.89 P0.91 H-0.35
Q10=6.21 A0.88 P0.93 H-0.27
Q25=7.64 A0.87 P0.94 H-0.17
Q50=8.57 A0.87 P0.96 H-0.08
Q100=9.23 A0.87 P0.97
The fish passage design flows presented above in Table 1 were calculated as percentages of the two-year flow calculated using the regression equations and input data described above. The full range of calculated recurrence interval flows is summarized in Table 2. CalTrans design flows are included in Table 2 for reference only. Hydrology analysis input variables are summarized in Table 3, again with CalTrans values provided for reference only.
Exhibit 2: Fish Creek Basis of Design Report
8
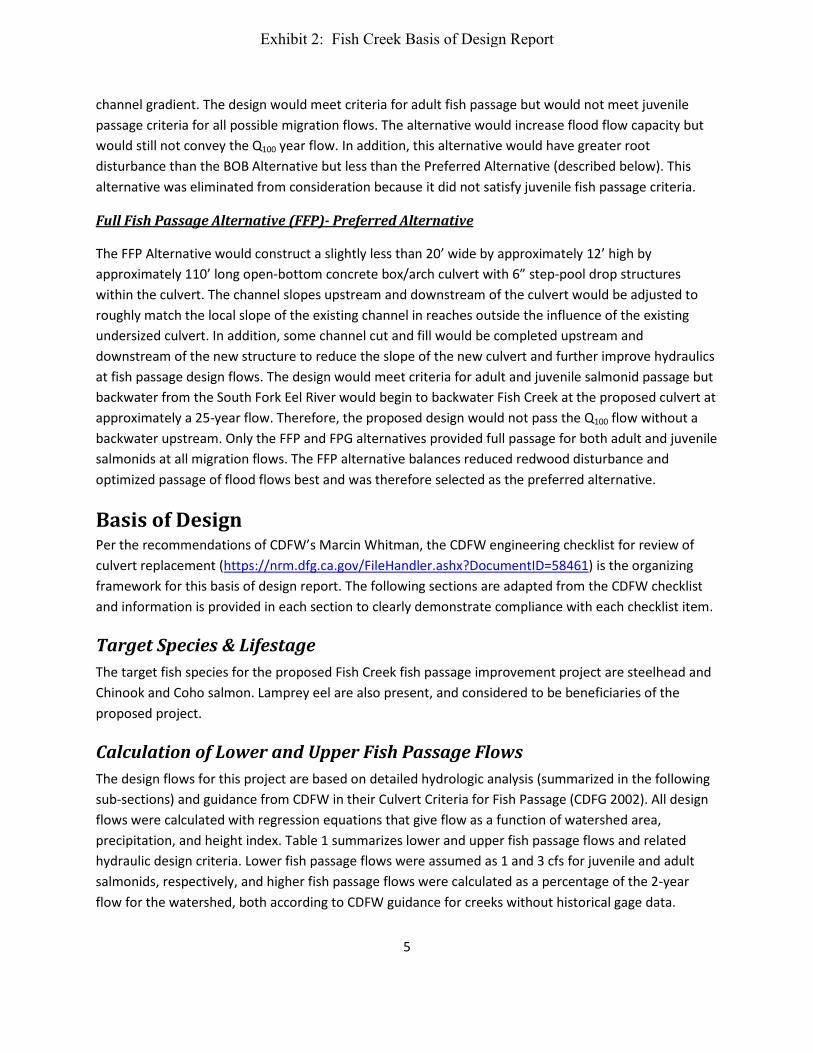
Table 2: Summary of recurrence interval flow estimates for Fish Creek
Recurrence Interval NewFields Flow
(cfs) Caltrans 2005 Fish Passage
Evaluation Flow (cfs) Caltrans 2006 Preliminary Bridge Design Flow (cfs)
Q2 506 520 Q5 774 790 Q10 1,019 1,045 1,293
Q25 1,286 1,320 Q50 1,565 1,605 Q100 1,755 1,800 2,332
Table 3: Summary of input parameters for Fish Creek
Variable Symbol Units NewFields Caltrans Fish Passage
Evaluation (2005) Caltrans Preliminary Bridge Design (2006)
Drainage Area A mi2 4.53 4.55 4.83 Average Annual
Precipitation P inch/yr 57.74 59 73
Altitude Index H thousands
of ft 1
1.2
Mean Elevation ft 905 800 Elevation at 10% ft 290
300
Elevation at 85% ft 1520
2000
HEC-RAS Model Files Including Boundary Conditions and Other Model Parameters HEC-RAS Modeling Introduction
NewFields constructed a hydraulic model of the project site in HEC-RAS, the US Army Corps of Engineers’ (USACE) 1-dimensional river hydraulics analysis system. Both existing and proposed conditions were modeled from the confluence with the Eel River to approximately 1000 feet upstream of the existing culvert. The following sections document the model construction and application.
Channel Topography
HEC-RAS represents a river channel as a sequence of cross sections. NewFields surveyed approximately 50 cross sections of the Fish Creek channel and its culvert to construct the hydraulic model. Three large redwood trees have fallen across the channel banks in the vicinity of the culvert and were determined to have the potential to influence peak flow hydraulics under both existing and proposed conditions. To capture this potential influence, channel spanning redwoods were modeled as “bridges” since they restrict flow in a similar manner to a bridge crossing. Proposed conditions topography in the model was
Exhibit 2: Fish Creek Basis of Design Report
9
modified to evaluate the proposed design and included modified channel bed slopes and geometry upstream and downstream of the roadway crossing and the new bottomless arch culvert.
Culvert Treatment
HEC-RAS is capable of modeling many forms of culverts, including the existing concrete box culvert and bottomless arch culverts. For the existing conditions model the existing culvert was modeled as a simple concrete box culvert. However, neither HEC-RAS nor any widely applied hydraulic model is capable of directly modeling a culvert with interior step-pool drop structures as proposed in this project. Therefore, two different models were created to evaluate low flow and high flow hydraulics within the proposed culvert. For low flows, where the depth of water is similar to the height of the drop structures (so-called “plunging flow”), the Fish Creek project area was modeled as an open channel with no culvert, and the step-pool drop structures were added as “inline structures” within the HEC-RAS. Modeling the culvert as an open channel at low flows is appropriate because under these conditions the culvert inlet is not submerged and the culvert behaves hydraulically as an open channel.
For high flows (so-called “streaming flow”) where the depth of water is greater than the drop structure heights, the culvert was modeled using the HEC-RAS culvert routine with relatively high Manning’s n roughness coefficient selected to represent the roughness imparted on flows by the drop structures. This roughness coefficient was determined by modeling Fish Creek at the high juvenile and high adult passage flows (51 and 253 cfs, respectively) with either the step-pool drop structures or the culvert routine, and selecting a culvert bottom n coefficient that produced a water surface profile through the culvert as similar as possible to the drop structure version of the model. Subsequently, low flows such as the low Juvenile and low Adult passage flows (1 and 3 cfs, respectively) were modeled with the open-channel drop structure version of the model and higher flows were modeled with the culvert version of the model.
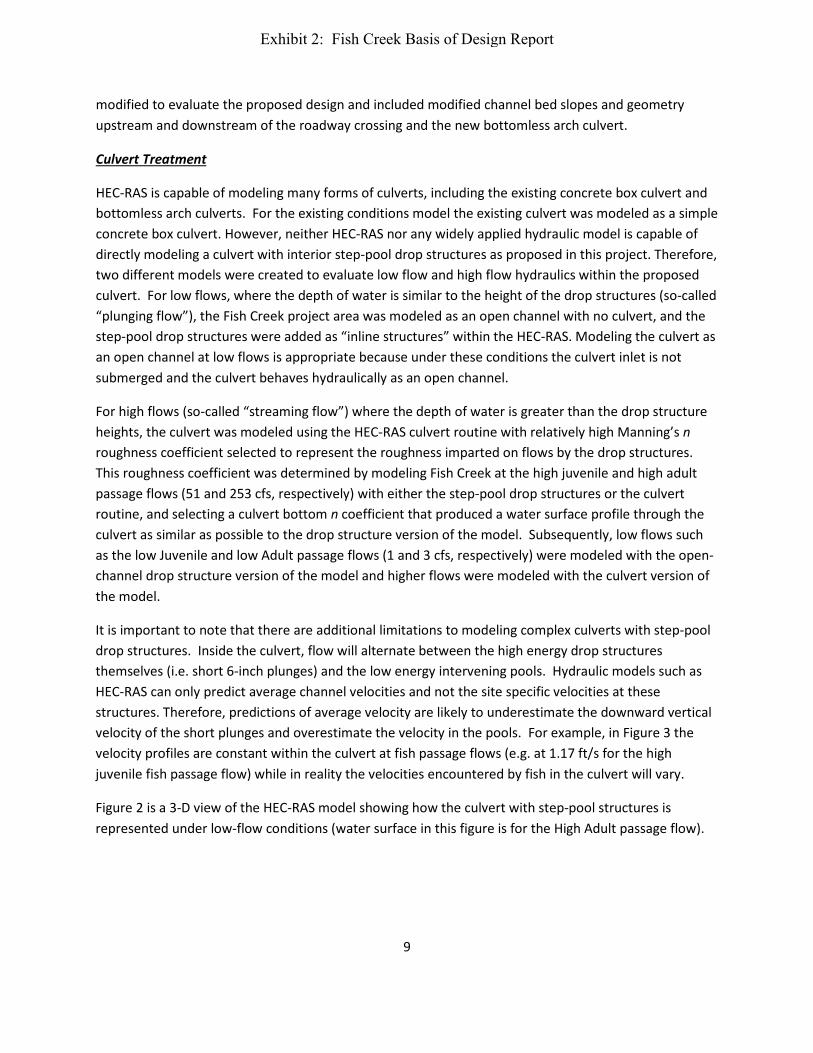
It is important to note that there are additional limitations to modeling complex culverts with step-pool drop structures. Inside the culvert, flow will alternate between the high energy drop structures themselves (i.e. short 6-inch plunges) and the low energy intervening pools. Hydraulic models such as HEC-RAS can only predict average channel velocities and not the site specific velocities at these structures. Therefore, predictions of average velocity are likely to underestimate the downward vertical velocity of the short plunges and overestimate the velocity in the pools. For example, in Figure 3 the velocity profiles are constant within the culvert at fish passage flows (e.g. at 1.17 ft/s for the high juvenile fish passage flow) while in reality the velocities encountered by fish in the culvert will vary.
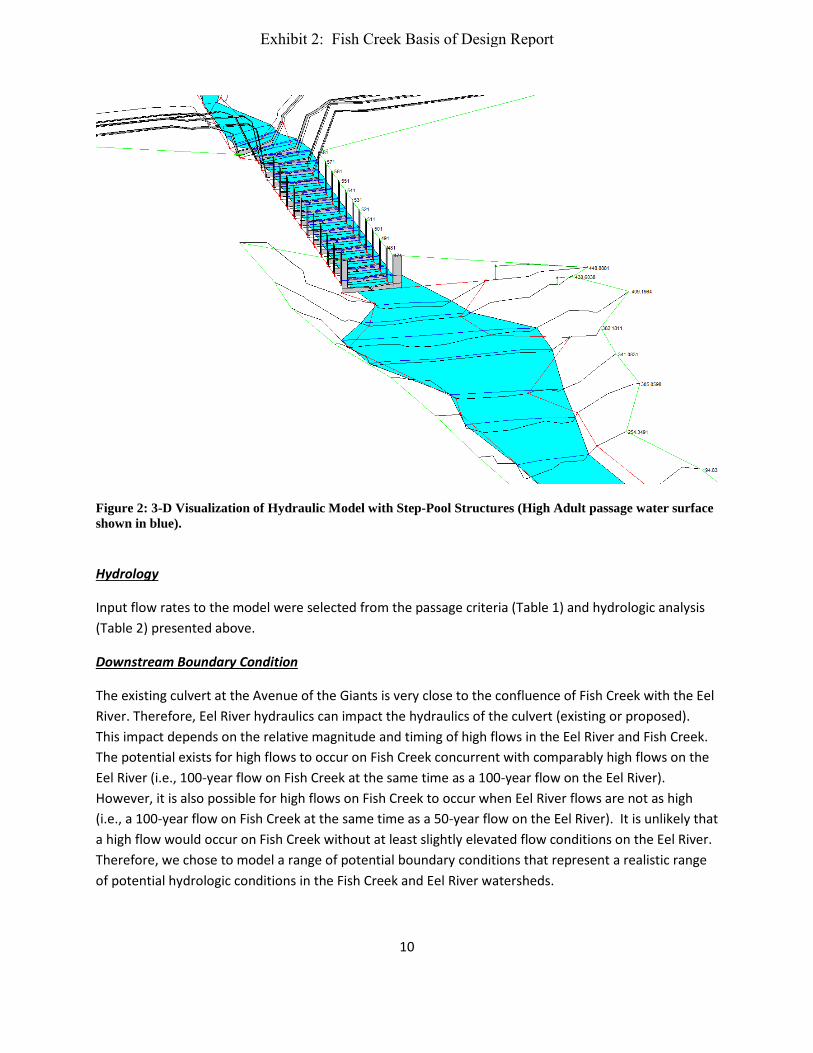
Figure 2 is a 3-D view of the HEC-RAS model showing how the culvert with step-pool structures is represented under low-flow conditions (water surface in this figure is for the High Adult passage flow).
Exhibit 2: Fish Creek Basis of Design Report
10
Figure 2: 3-D Visualization of Hydraulic Model with Step-Pool Structures (High Adult passage water surface shown in blue).
Hydrology
Input flow rates to the model were selected from the passage criteria (Table 1) and hydrologic analysis (Table 2) presented above.
Downstream Boundary Condition
The existing culvert at the Avenue of the Giants is very close to the confluence of Fish Creek with the Eel River. Therefore, Eel River hydraulics can impact the hydraulics of the culvert (existing or proposed). This impact depends on the relative magnitude and timing of high flows in the Eel River and Fish Creek. The potential exists for high flows to occur on Fish Creek concurrent with comparably high flows on the Eel River (i.e., 100-year flow on Fish Creek at the same time as a 100-year flow on the Eel River). However, it is also possible for high flows on Fish Creek to occur when Eel River flows are not as high (i.e., a 100-year flow on Fish Creek at the same time as a 50-year flow on the Eel River). It is unlikely that a high flow would occur on Fish Creek without at least slightly elevated flow conditions on the Eel River. Therefore, we chose to model a range of potential boundary conditions that represent a realistic range of potential hydrologic conditions in the Fish Creek and Eel River watersheds.
Exhibit 2: Fish Creek Basis of Design Report

11
• High Flow Eel River/ High Flow Fish Creek: this flow scenario assumes that the same return interval flow occurs on both rivers concurrently. The predicted water surface in the Eel River at the confluence with Fish Creek was used as the downstream boundary condition in model runs with this assumption.
• Low Flow Eel River/High Flow Fish Creek: this flow scenario assumes that a lower return interval flow occurs on the Eel River than on Fish Creek, as listed below.
o 50-year Eel River concurrent with 100-year Fish Creek flow
o 25-year Eel River concurrent with 50-year Fish Creek flow
o 10-year Eel River concurrent with 25-year Fish Creek flow
o 5-year Eel River concurrent with 10-year Fish Creek flow
o 2-year Eel River concurrent with 5-year Fish Creek flow
o 50% of the 2-Year flow on the Eel River concurrent with 2-Year Fish Creek flow
o 10% of the 2-Year flow on the Eel River concurrent with High Adult Fish Creek flow
o Baseflow Eel River (i.e., no Eel River backwater effect on Fish Creek) concurrent with High Juvenile Fish Creek flow
o Baseflow Eel River concurrent with Low Adult Fish Creek flow
o Baseflow Eel River concurrent with Low Juvenile Fish Creek flow
The predicted water surface in the Eel River at the confluence with Fish Creek was used for the downstream boundary condition.
• Baseflow: this flow scenario was only used for low passage flows and assumed no backwater condition from the Eel River. Therefore, a normal depth calculation boundary condition was used.
Water Surface Profiles and Average Channel Velocities for the Lower and Upper Fish Passage Flows, Design Flow, and the 100-Year Flow Water Surface Profiles
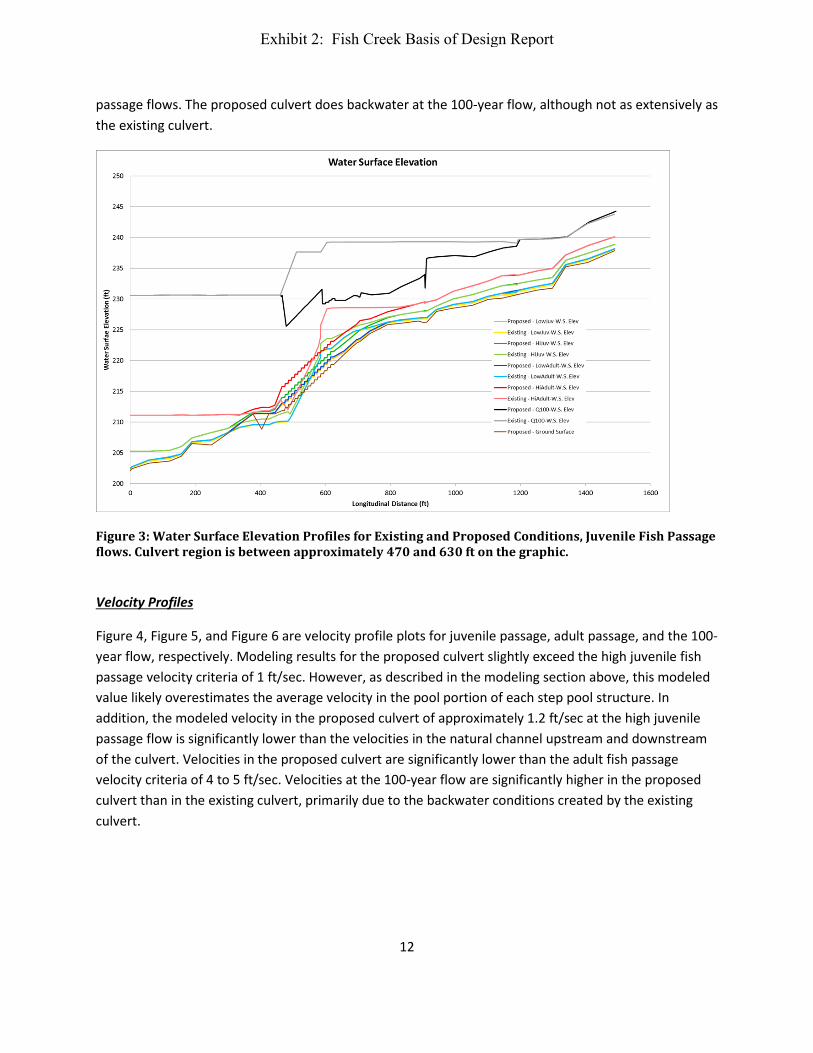
Figure 3 is a plot of modeled water surface profiles for existing and proposed low juvenile passage, high juvenile passage, low adult passage, high adult passage, and 100-year flows for Fish Creek. The existing culvert begins to backwater at the high adult passage flow (253 cfs) and creates a major backwater at the 100-year flow. The water surface profiles are all significantly flatter through the proposed culvert than the existing culvert at all fish passage flows, and no backwater conditions occur at any of the fish
Exhibit 2: Fish Creek Basis of Design Report
12
passage flows. The proposed culvert does backwater at the 100-year flow, although not as extensively as the existing culvert.
Figure 3: Water Surface Elevation Profiles for Existing and Proposed Conditions, Juvenile Fish Passage flows. Culvert region is between approximately 470 and 630 ft on the graphic.
Velocity Profiles
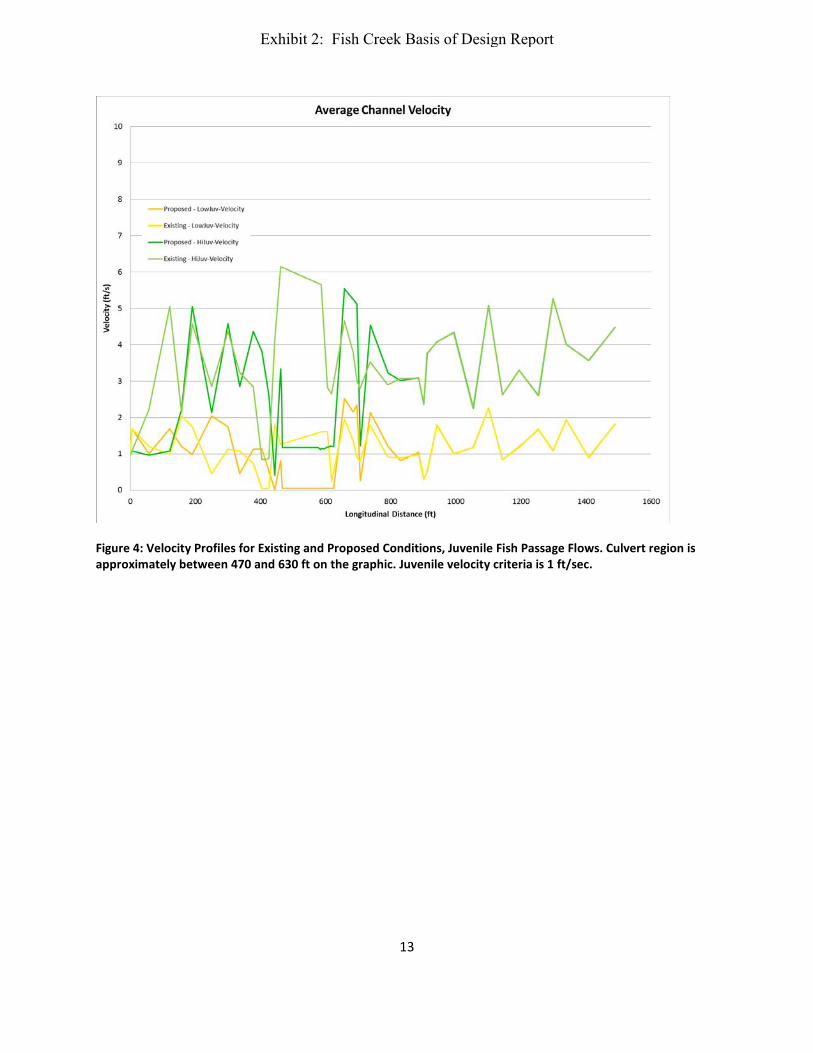
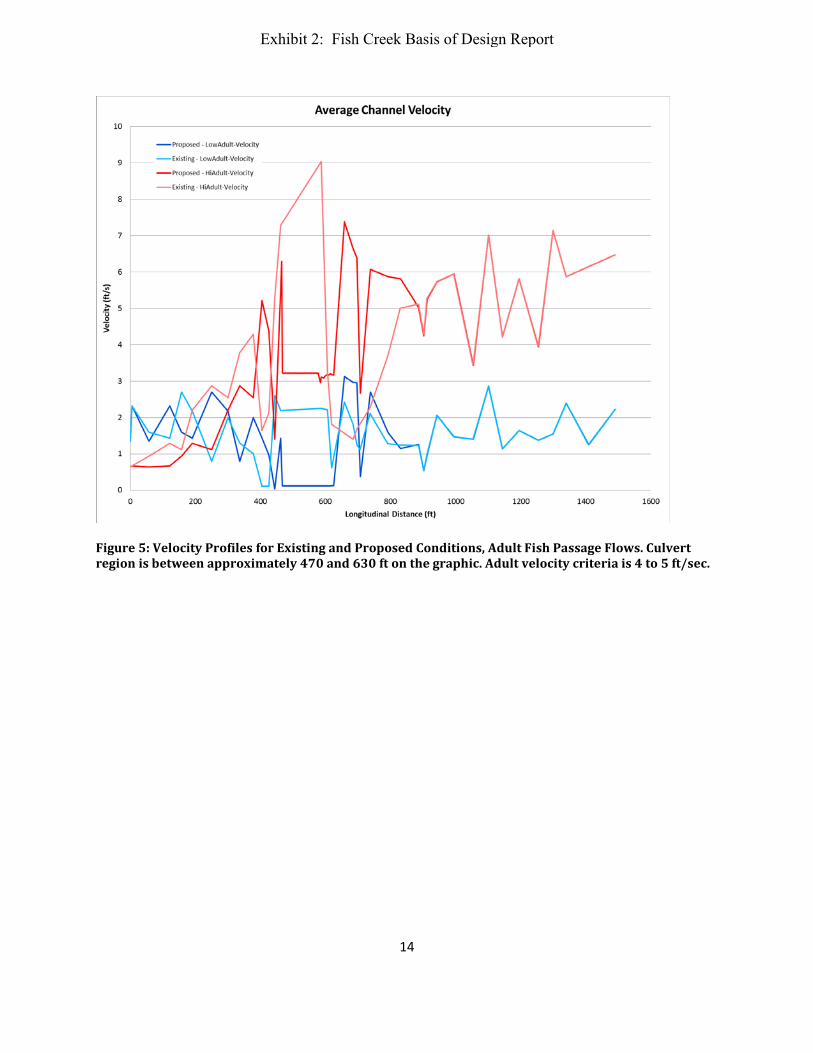
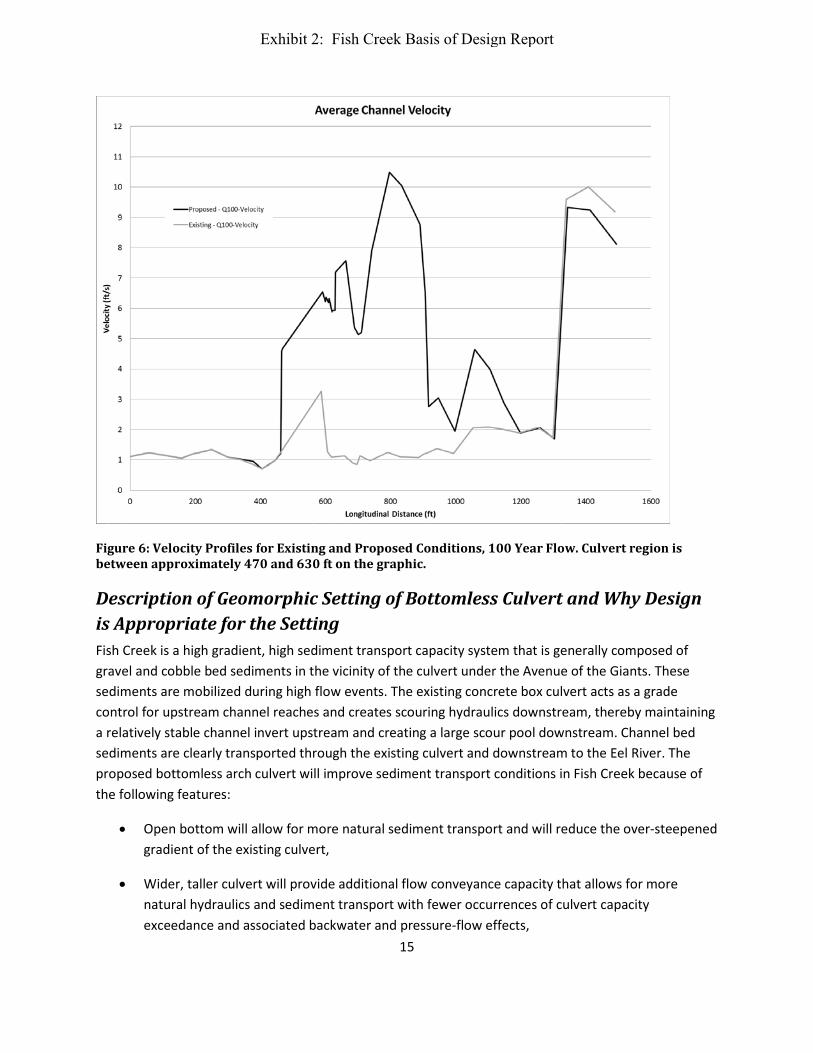
Figure 4, Figure 5, and Figure 6 are velocity profile plots for juvenile passage, adult passage, and the 100-year flow, respectively. Modeling results for the proposed culvert slightly exceed the high juvenile fish passage velocity criteria of 1 ft/sec. However, as described in the modeling section above, this modeled value likely overestimates the average velocity in the pool portion of each step pool structure. In addition, the modeled velocity in the proposed culvert of approximately 1.2 ft/sec at the high juvenile passage flow is significantly lower than the velocities in the natural channel upstream and downstream of the culvert. Velocities in the proposed culvert are significantly lower than the adult fish passage velocity criteria of 4 to 5 ft/sec. Velocities at the 100-year flow are significantly higher in the proposed culvert than in the existing culvert, primarily due to the backwater conditions created by the existing culvert.
Exhibit 2: Fish Creek Basis of Design Report
13
Figure 4: Velocity Profiles for Existing and Proposed Conditions, Juvenile Fish Passage Flows. Culvert region is approximately between 470 and 630 ft on the graphic. Juvenile velocity criteria is 1 ft/sec.
Exhibit 2: Fish Creek Basis of Design Report
14
Figure 5: Velocity Profiles for Existing and Proposed Conditions, Adult Fish Passage Flows. Culvert region is between approximately 470 and 630 ft on the graphic. Adult velocity criteria is 4 to 5 ft/sec.
Exhibit 2: Fish Creek Basis of Design Report
15
Figure 6: Velocity Profiles for Existing and Proposed Conditions, 100 Year Flow. Culvert region is between approximately 470 and 630 ft on the graphic.
Description of Geomorphic Setting of Bottomless Culvert and Why Design is Appropriate for the Setting Fish Creek is a high gradient, high sediment transport capacity system that is generally composed of gravel and cobble bed sediments in the vicinity of the culvert under the Avenue of the Giants. These sediments are mobilized during high flow events. The existing concrete box culvert acts as a grade control for upstream channel reaches and creates scouring hydraulics downstream, thereby maintaining a relatively stable channel invert upstream and creating a large scour pool downstream. Channel bed sediments are clearly transported through the existing culvert and downstream to the Eel River. The proposed bottomless arch culvert will improve sediment transport conditions in Fish Creek because of the following features:
• Open bottom will allow for more natural sediment transport and will reduce the over-steepened gradient of the existing culvert,
• Wider, taller culvert will provide additional flow conveyance capacity that allows for more natural hydraulics and sediment transport with fewer occurrences of culvert capacity exceedance and associated backwater and pressure-flow effects,
Exhibit 2: Fish Creek Basis of Design Report

16
• Step-pool drop structures will reduce velocities (compared to velocities in the existing culvert) which currently restrict fish passage.
During preliminary design of this project, comments were received from NOAA Fisheries regarding the backwater and sedimentation/geomorphic effects of the Eel River on Fish Creek (Appendix A). NOAA Fisheries staff questioned the appropriateness of the design approach. The boundary condition approach described in the modeling section above addressed these comments and confirmed the appropriateness of the proposed design for the geomorphic setting of the project. NOAA Fisheries voiced additional related concerns about potential effects of backwater from the Eel River on Fish Creek. These concerns, while not precisely explained by NOAA Fisheries staff, are identified and address below in our assessment of the potential for sedimentation issues with the proposed bottomless arch culvert, and in our conclusion that absent credible countervailing analysis or evidence, the proposed design is appropriate for the site.
NOAA Fisheries Concern 1 - Potential Sedimentation Process: Bedload sediments (i.e. coarse sand, gravel, and cobble) from the South Fork Eel River are transported up Fish Creek to the outlet of the existing culvert during high flows While the sediments we observed and measured in Fish Creek in the vicinity of the culvert outlet are composed of gravel and cobble, it is physically impossible for backwater hydraulics (i.e. low or zero velocity and shear stress) to transport bedload sediments roughly perpendicular to the primary flow direction of the South Fork Eel River and up-gradient approximately 10 vertical feet to the culvert outlet.
NOAA Fisheries Concern 2 - Potential Sedimentation Process: Suspended load sediments (i.e. fine sand, silt, and clay) from the South Fork Eel River are transported up Fish Creek to the outlet of the existing culvert during high flows Unlike the coarse material described above, the South Fork Eel River could transport suspended load sediments up-gradient to the Fish Creek culvert outlet. However, this phenomenon has no empirical support. Our observations, topographic surveys, and other geomorphic measurements show no evidence of fine sediment deposition near or downstream of the culvert outlet. In fact, the approximately 3-5 foot deep scour hole immediately downstream of the culvert outlet (referred to by NOAA Fisheries as a "sediment bowl," ) is clearly an erosional feature where sediments have been mobilized and transported downstream out of Fish Creek.
NOAA Fisheries Concern 3 - Potential Sedimentation Process: Backwater from the South Fork Eel River causes stagnant hydraulic conditions at the existing box culvert, preventing Fish Creek sediments from being transported downstream to the South Fork Eel River and causing them to accumulate at the culvert outlet Of the three potential backwater effects, this is the only one that merited additional analysis beyond the field data collection and modeling already completed in support of the proposed design. Additional hydraulic modeling and channel bed sediment incipient motion analysis concluded that this process is not occurring under existing hydraulic and sediment transport conditions, nor would it occur under the conditions created by our proposed design.
Exhibit 2: Fish Creek Basis of Design Report
17
Potential for Debris Loads or Jams at Bridge Site The proposed project will significantly increase the size of the existing culvert, thereby decreasing the likelihood that large woody debris will jam at the culvert entrance. In addition, because Fish Creek drains an ancient redwood forest, the majority of large wood in the channel occurs as channel spanning jams that remain in place for decades or longer. Therefore, while occasional log or debris jams are possible during extremely high flows, they present a relatively low risk to performance under typical hydrologic conditions.
Scour Analysis The proposed bottomless arch culvert design does not include any piers or other in-channel structures with the potential to scour the streambed. Depending on the results of a future geotechnical investigation of the site, a maximum depth of scour calculation may be required to complete final design of the proposed bottomless arch culvert foundation components.
Justification for Increases in Water Surface Elevation or Velocities Near the Bridge (if any) and the Use of Any Scour Protection Downstream of the culvert, velocities and water surface elevations will not significantly change with the proposed design because the channel configuration will not be significantly altered. Due to likely backwater conditions on the Eel River, velocities are generally very low in Fish Creek during flows above the 2-year return interval. The existing culvert cannot convey flows at or above the high adult passage flow (252 cfs), therefore velocities upstream of the culvert are very low due to backwater conditions. The proposed culvert will convey significantly higher flows without backwater conditions, therefore channel velocities upstream will be higher with the proposed project. However, velocities under proposed conditions are consistent with natural channel velocities elsewhere in the project area and will not require any special erosion or scour protection measures beyond the erosion and scour protection measures called for in the design drawings.
Geotechnical Assessment May be necessary to ensure project design is structurally appropriate. To be completed with input from Caltrans, 5C, and State Coastal Conservancy.
Design Drawings Showing Site Topography and Dimensions of Culvert Structure in Plan, Elevation, Longitudinal Profile, and Cross-Sectional Views along with important component details
The 65% design drawings are included as Appendix B of this Basis of Design Report.
Exhibit 2: Fish Creek Basis of Design Report
18
Tree Impact Minimization
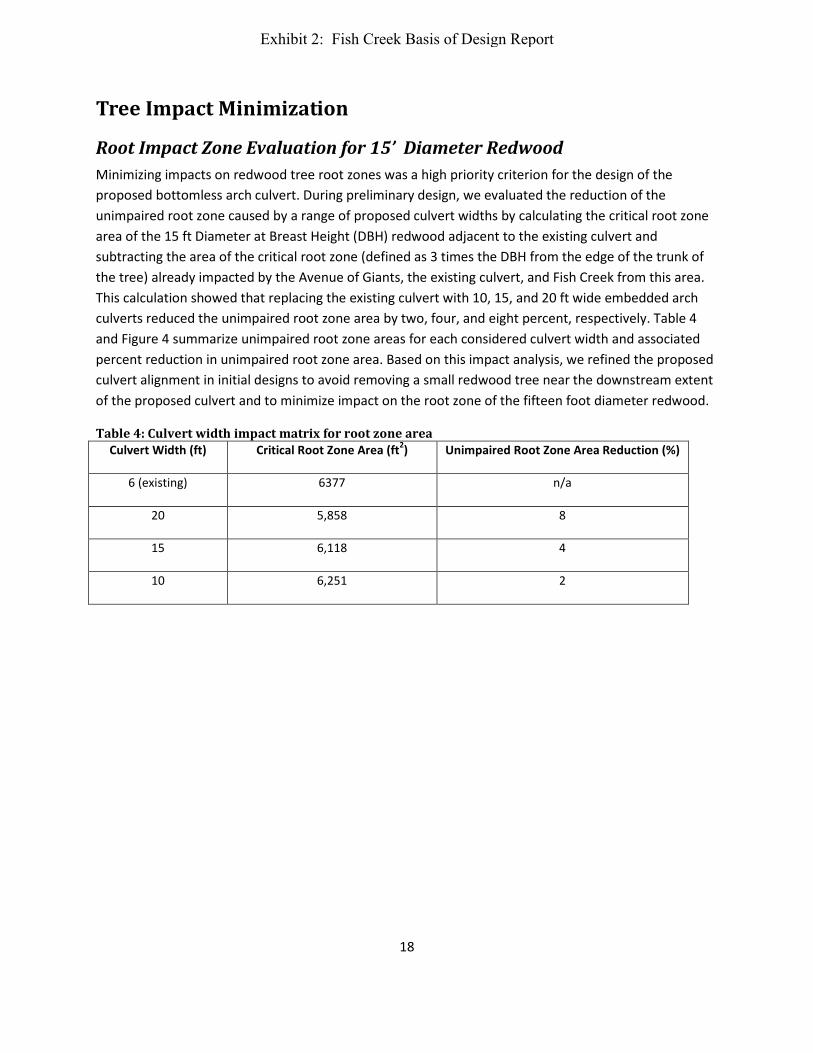
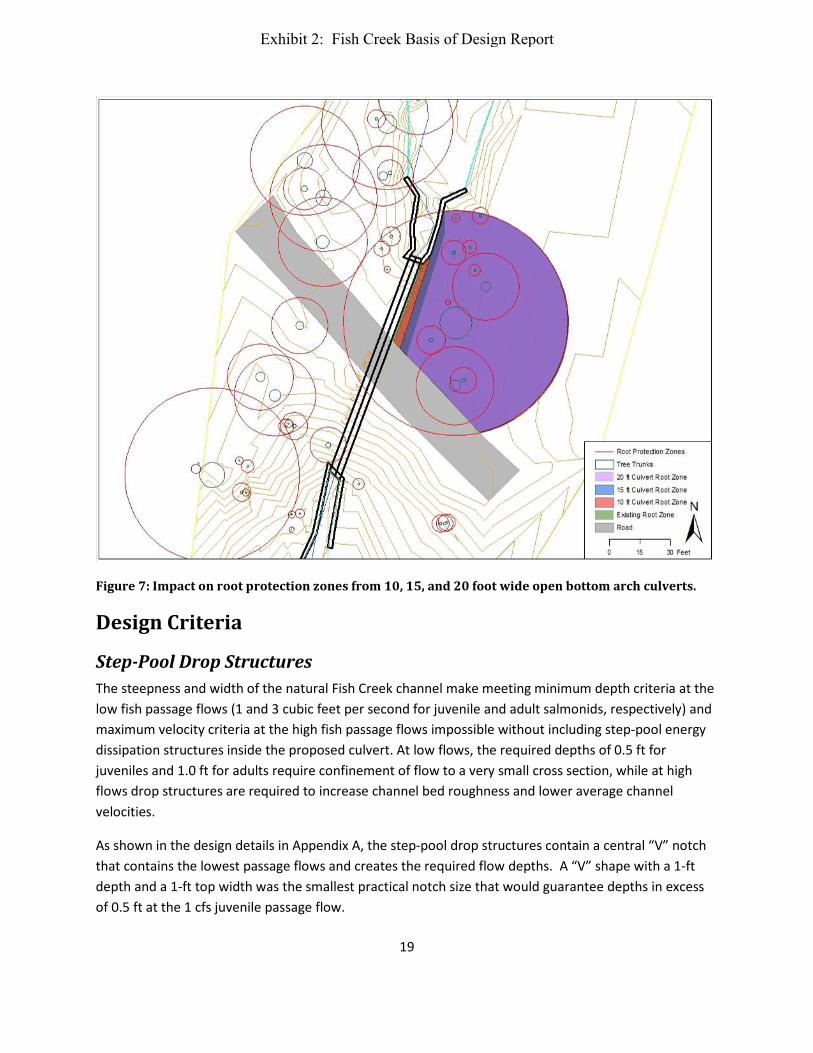
Root Impact Zone Evaluation for 15’ Diameter Redwood Minimizing impacts on redwood tree root zones was a high priority criterion for the design of the proposed bottomless arch culvert. During preliminary design, we evaluated the reduction of the unimpaired root zone caused by a range of proposed culvert widths by calculating the critical root zone area of the 15 ft Diameter at Breast Height (DBH) redwood adjacent to the existing culvert and subtracting the area of the critical root zone (defined as 3 times the DBH from the edge of the trunk of the tree) already impacted by the Avenue of Giants, the existing culvert, and Fish Creek from this area. This calculation showed that replacing the existing culvert with 10, 15, and 20 ft wide embedded arch culverts reduced the unimpaired root zone area by two, four, and eight percent, respectively. Table 4 and Figure 4 summarize unimpaired root zone areas for each considered culvert width and associated percent reduction in unimpaired root zone area. Based on this impact analysis, we refined the proposed culvert alignment in initial designs to avoid removing a small redwood tree near the downstream extent of the proposed culvert and to minimize impact on the root zone of the fifteen foot diameter redwood.
Table 4: Culvert width impact matrix for root zone area Culvert Width (ft) Critical Root Zone Area (ft2) Unimpaired Root Zone Area Reduction (%)
6 (existing) 6377 n/a
20 5,858 8
15 6,118 4
10 6,251 2
Exhibit 2: Fish Creek Basis of Design Report
19
Figure 7: Impact on root protection zones from 10, 15, and 20 foot wide open bottom arch culverts.
Design Criteria
Step-Pool Drop Structures The steepness and width of the natural Fish Creek channel make meeting minimum depth criteria at the low fish passage flows (1 and 3 cubic feet per second for juvenile and adult salmonids, respectively) and maximum velocity criteria at the high fish passage flows impossible without including step-pool energy dissipation structures inside the proposed culvert. At low flows, the required depths of 0.5 ft for juveniles and 1.0 ft for adults require confinement of flow to a very small cross section, while at high flows drop structures are required to increase channel bed roughness and lower average channel velocities.
As shown in the design details in Appendix A, the step-pool drop structures contain a central “V” notch that contains the lowest passage flows and creates the required flow depths. A “V” shape with a 1-ft depth and a 1-ft top width was the smallest practical notch size that would guarantee depths in excess of 0.5 ft at the 1 cfs juvenile passage flow.
Exhibit 2: Fish Creek Basis of Design Report

20
Grade Control Structure A grade control structure is proposed to be embedded flush with the channel bed downstream of the proposed culvert outlet pool to ensure that any bed scour or headcutting does not migrate upstream from the Eel River. This structure will also maintain a stable bed elevation in the area immediately downstream of the culvert and provide the foundation for a naturally maintained resting pool. The design of the proposed grade control structure consists of layers of rock placed in a trench excavated out of the bed and extending into both channel banks to prevent flanking by bank erosion.
The rock in the proposed grade control structure will be sized in the final design to be immobile under the highest expected stresses, but not oversized so as to incur unnecessary cost and construction complexity. Our model results indicate that the highest shear stresses in the channel downstream of the culvert range from one to two pounds per square foot and occur during the high juvenile and high adult passage flows. The design shear stresses correspond to mobilization of 5” and 20” diameter rock, respectively (Fischenich 2001). Higher flows such as the 2- and 100-year flows are expected to occur during backwater conditions from the Eel River, and channel bed shear stresses are lower under these conditions. Therefore, we have initially specified 24”minimum diameter rock for the grade control structure in the design drawings in Appendix A.
Value Engineering Note As illustrated in Figure 4, Figure 5, and Figure 6 above, flow velocities exceed fish passage design criteria outside the culvert under both existing and proposed conditions. Further, as show in Figure 8 below, flow depths at low fish passage design flows do not satisfy criteria outside of the culvert. The proposed design includes notched steps inside the culvert to achieve the low flow fish passage depth criteria. We strongly recommend that the final design consider the necessity of this design element given the depth and velocity conditions that will occur outside the culvert, as this design feature will likely incur significant additional cost.
Figure 8: Fish Creek upstream of the proposed culvert at flow near the low juvenile and adult fish passage design flows (1 to 3 cfs).
Exhibit 2: Fish Creek Basis of Design Report

21
References Cited
CalTrans 2010. Caltrans Highway Design Manual, Chapter 810 Hydrology. http://www.dot.ca.gov/hq/oppd/hdm/hdmtoc.htm
Fischenich, C. (2001). Stability Thresholds for Stream Restoration Materials. EMRRP Technical Notes Collection (ERDC TN - EMRRP-SR-29), U.S. Army Engineer Research and Development Center, Vicksburg, MS.
Waanenen, A. O., and J. R. Crippen, 1977. Magnitude and Frequency of Floods in California: U.S. Geological Survey Water Resources Investigations 77-21, 96p.
Exhibit 2: Fish Creek Basis of Design Report

22
Appendix A: NOAA Fisheries, Arcata Design Issues Memo & Project Team Response Memo
Exhibit 2: Fish Creek Basis of Design Report
23
NOAA Fisheries, Arcata, 9/13/12
Fish Creek Design issues:
1. First recommendation is to replace the culvert with a bridge (Margaret, Mark Smelser, and Marcin site visit). The footprint of a bridge could be much smaller than a culvert with headwalls. The footprint would be in the existing road prism. I am still uncertain why a bridge alternative isn’t being considered. A bridge at this location cannot pass the 100-year flood since the whole road would be overtopped by the SF Eel, but is not a requirement of the NMFS Fish Passage guidelines.
2. I do not have a complete set of plans or model to review of the latest proposal. The most recent HecRas model that I have been sent and commented on was a 10 ft wide culvert. No baffles are modeled. I didn’t spend much time reviewing the HecRas model presented but instead requested that the model be rerun including the South Fork Eel River.
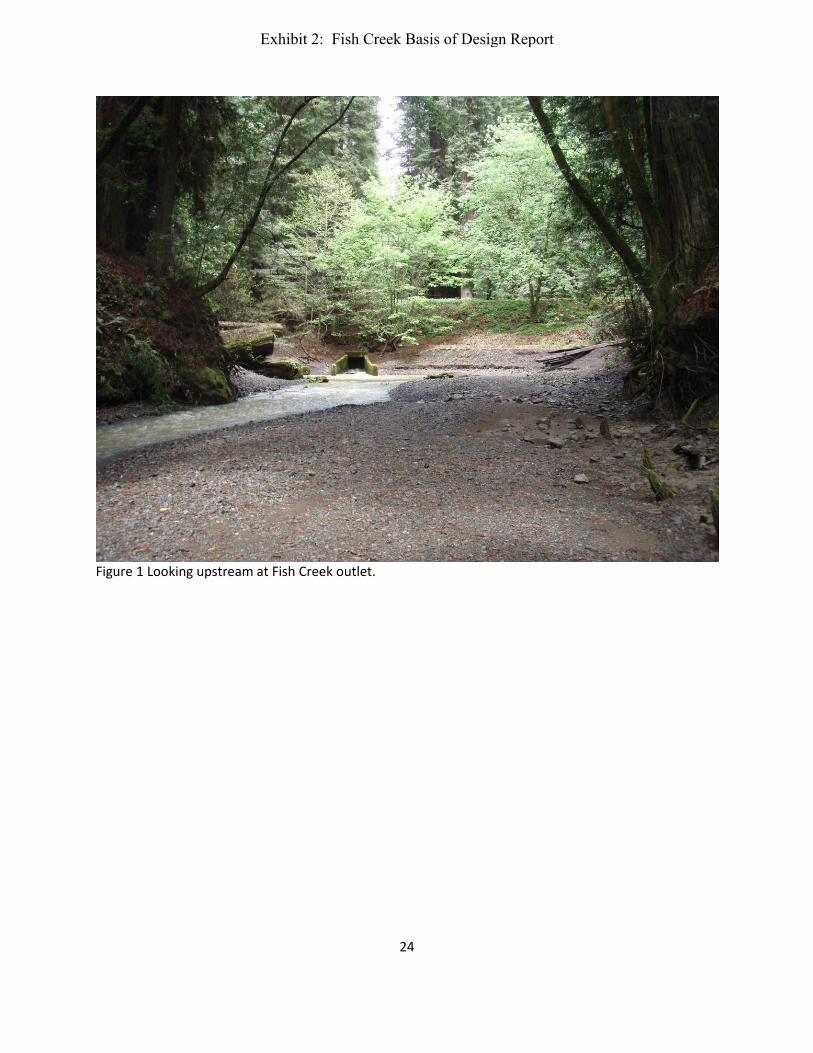
3. All projects must account for backwater effects and related sediment deposits from the South Fork Eel River. The sediment “bowl” at the outlet of the existing culvert ( Figure 1) and the channel width below the culvert indicate frequent backwater from SF Eel No model or designs have been presented that take into account the possible backwater effects.
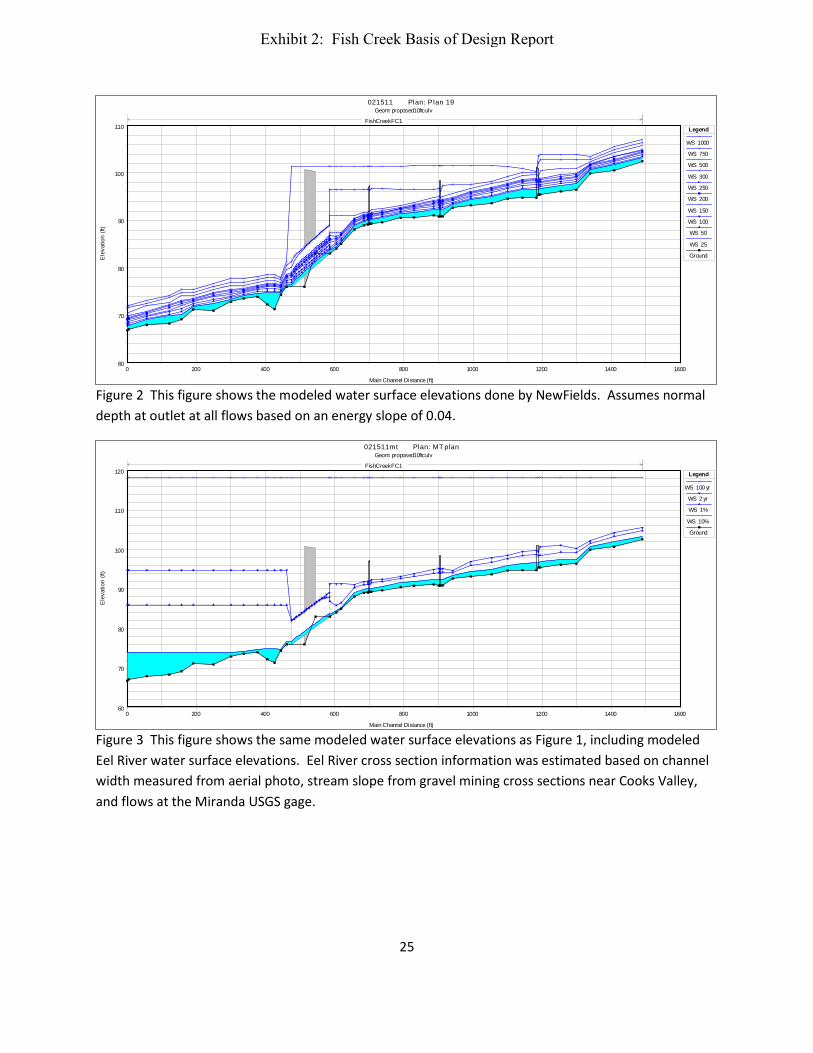
4. Figure 2 shows the water surface elevation without considering the SF Eel. Figure 2 shows the same Fish Creek flows taking into account the SF Eel.
5. A possible alternative might be to set the culvert at the upstream existing channel slope and build the fish ladder on the downstream outlet of the culvert. This would avoid early backwater and associated hydraulic and sedimentation problems from the SF Eel that seem to occur at fish passage flows with the existing design.
Exhibit 2: Fish Creek Basis of Design Report
24
Figure 1 Looking upstream at Fish Creek outlet.
Exhibit 2: Fish Creek Basis of Design Report
25
0 200 400 600 800 1000 1200 1400 160060
70
80
90
100
110
021511 Plan: Plan 19Geom: proposed10ftculv
Main Channel Distance (ft)
Ele
vatio
n (ft
)
Legend
WS 1000
WS 750
WS 500
WS 300
WS 250
WS 200
WS 150
WS 100
WS 50
WS 25
Ground
FishCreek FC1
Figure 2 This figure shows the modeled water surface elevations done by NewFields. Assumes normal depth at outlet at all flows based on an energy slope of 0.04.
0 200 400 600 800 1000 1200 1400 160060
70
80
90
100
110
120
021511mt Plan: MT planGeom: proposed10ftculv
Main Channel Distance (ft)
Ele
vatio
n (ft
)
Legend
WS 100 yr
WS 2 yr
WS 1%
WS 10%
Ground
FishCreek FC1
Figure 3 This figure shows the same modeled water surface elevations as Figure 1, including modeled Eel River water surface elevations. Eel River cross section information was estimated based on channel width measured from aerial photo, stream slope from gravel mining cross sections near Cooks Valley, and flows at the Miranda USGS gage.
Exhibit 2: Fish Creek Basis of Design Report
26
MEMORANDUM
TO: Mark Lancaster, Five Counties Salmonid Conservation Program, Michael Bowen, State Coastal Conservancy
FROM: Paul Frank , P.E. and Mark R. Tompkins, P.E., PhD. – NewFields
DATE: October 10, 2012
SUBJECT: Response to NOAA Fisheries, Arcata, Comments on proposed Fish Creek Fish Passage Improvement Project Design
The purpose of this memorandum is to respond to comments received from NOAA Fisheries, Arcata, regarding the proposed design for a new arch span crossing for Fish Creek under the Avenue of the Giants in Humboldt County, California. This memorandum also clarifies hydraulic modeling performed by NewFields between 2010 and 2012 in support of design of the new arch span crossing.
Fish Creek is located primarily on State Parks property in an ancient grove of Redwood trees. It is considered the highest priority fish passage priority in CalTrans District One, an area encompassing Del Norte, Humboldt and Mendocino counties. The proposed crossing would replace an existing, 7-foot wide, 6-foot tall box culvert that neither meets fish passage criteria for juvenile nor adult salmonids. This memorandum also clarifies aspects of our basis of design to address NOAA Fisheries’ concerns and allow final design and construction of this important fish passage improvement project to proceed. Each of NOAA’s four comments is addressed in detail below, but the comments also address NOAA staff’s unsubstantiated assertion that there is a sedimentation problem in Fish Creek related to backwater effects from the South Fork Eel River. This concern has been expressed by NOAA staff for over a year both verbally and in a recent (9/13/2012) memo to the project proponents.
While the specific nature of this asserted sedimentation problem was neither described nor explained in NOAA’s past or recent comments, we believe NOAA Fisheries is concerned about one or more of the following three potential backwater sedimentation processes:
• Potential Sedimentation Process 1: Bedload sediments (i.e. coarse sand, gravel, and cobble) from the South Fork Eel River are transported up Fish Creek to the outlet of the existing culvert during high flows. While the sediments we observed and measured in Fish Creek in the vicinity of the culvert outlet are composed of gravel and cobble, it is physically impossible for backwater hydraulics (i.e. low or zero velocity and shear stress) to transport bedload sediments roughly perpendicular to the primary flow direction of the South Fork Eel River and up-gradient approximately 10 vertical feet to the culvert outlet.
Exhibit 2: Fish Creek Basis of Design Report
27
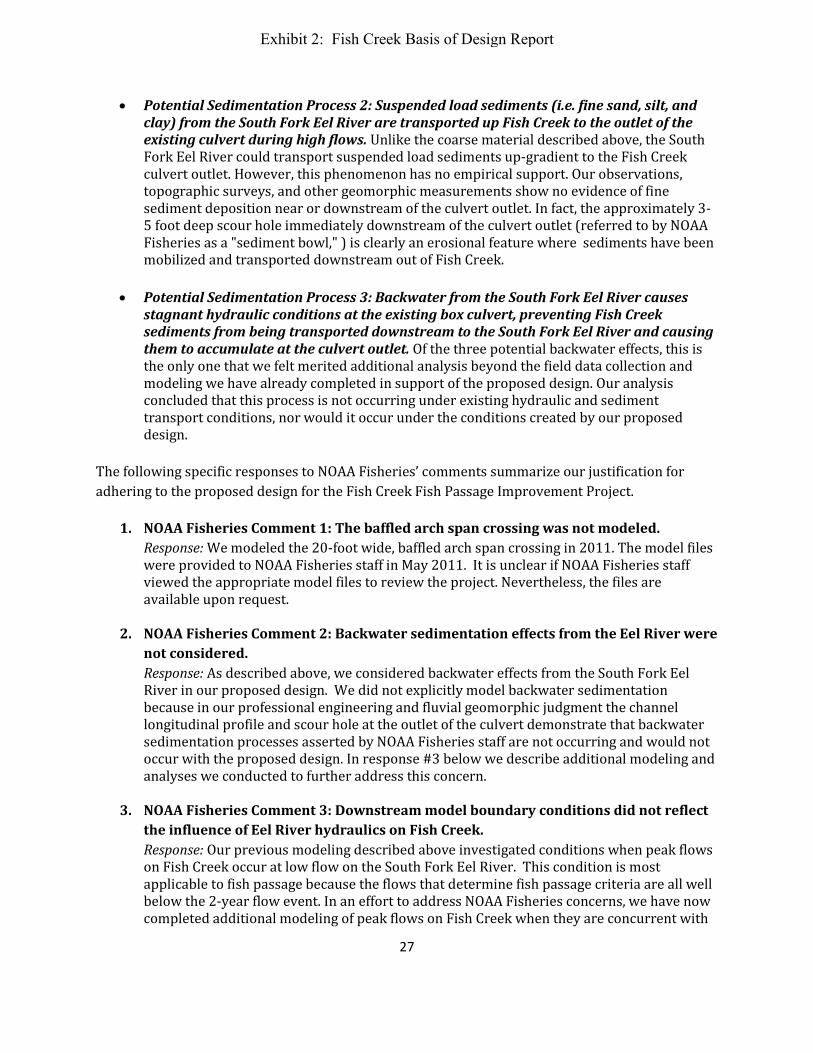
• Potential Sedimentation Process 2: Suspended load sediments (i.e. fine sand, silt, and clay) from the South Fork Eel River are transported up Fish Creek to the outlet of the existing culvert during high flows. Unlike the coarse material described above, the South Fork Eel River could transport suspended load sediments up-gradient to the Fish Creek culvert outlet. However, this phenomenon has no empirical support. Our observations, topographic surveys, and other geomorphic measurements show no evidence of fine sediment deposition near or downstream of the culvert outlet. In fact, the approximately 3-5 foot deep scour hole immediately downstream of the culvert outlet (referred to by NOAA Fisheries as a "sediment bowl," ) is clearly an erosional feature where sediments have been mobilized and transported downstream out of Fish Creek.
• Potential Sedimentation Process 3: Backwater from the South Fork Eel River causes
stagnant hydraulic conditions at the existing box culvert, preventing Fish Creek sediments from being transported downstream to the South Fork Eel River and causing them to accumulate at the culvert outlet. Of the three potential backwater effects, this is the only one that we felt merited additional analysis beyond the field data collection and modeling we have already completed in support of the proposed design. Our analysis concluded that this process is not occurring under existing hydraulic and sediment transport conditions, nor would it occur under the conditions created by our proposed design.
The following specific responses to NOAA Fisheries’ comments summarize our justification for adhering to the proposed design for the Fish Creek Fish Passage Improvement Project.
1. NOAA Fisheries Comment 1: The baffled arch span crossing was not modeled. Response: We modeled the 20-foot wide, baffled arch span crossing in 2011. The model files were provided to NOAA Fisheries staff in May 2011. It is unclear if NOAA Fisheries staff viewed the appropriate model files to review the project. Nevertheless, the files are available upon request.
2. NOAA Fisheries Comment 2: Backwater sedimentation effects from the Eel River were not considered. Response: As described above, we considered backwater effects from the South Fork Eel River in our proposed design. We did not explicitly model backwater sedimentation because in our professional engineering and fluvial geomorphic judgment the channel longitudinal profile and scour hole at the outlet of the culvert demonstrate that backwater sedimentation processes asserted by NOAA Fisheries staff are not occurring and would not occur with the proposed design. In response #3 below we describe additional modeling and analyses we conducted to further address this concern.
3. NOAA Fisheries Comment 3: Downstream model boundary conditions did not reflect the influence of Eel River hydraulics on Fish Creek. Response: Our previous modeling described above investigated conditions when peak flows on Fish Creek occur at low flow on the South Fork Eel River. This condition is most applicable to fish passage because the flows that determine fish passage criteria are all well below the 2-year flow event. In an effort to address NOAA Fisheries concerns, we have now completed additional modeling of peak flows on Fish Creek when they are concurrent with
Exhibit 2: Fish Creek Basis of Design Report
28
peak flows on the South Fork Eel River to evaluate the potential for backwater sedimentation to impair subsequent fish passage at the crossing. These two conditions bracket a reasonable range of potential hydraulic boundary conditions possible at the site. Both modeling exercises demonstrate that fish passage criteria are met under this range of conditions with our proposed arch span crossing design. Further, our analyses of modeled channel shear stresses under existing and proposed conditions show that the proposed alternative does not change sediment transport capacity downstream of the culvert, and actually increases transport capacity upstream of the culvert. We have always maintained that our final design will provide appropriate grade control to maintain upstream and downstream invert elevations. This would prevent any significant change in upstream sediment supply. Therefore, since our analysis has shown downstream transport capacity is not changed by our proposed design, in our professional opinion this reach will not become aggradational, as is asserted by NOAA Fisheries staff.
4. NOAA Fisheries Comment 4: A combination fish ladder/culvert would alleviate backwater sedimentation effects from the Eel River on Fish Creek. Response: We disagree, and in our professional opinion this concept has the potential to create or exacerbate sedimentation problems and may further impair fish passage at the crossing. While such an alternative would cause backwater from the South Fork Eel River to reach the culvert less frequently, it would only address potential backwater sedimentation effects if the source of the sediment was the South Fork Eel River. We have demonstrated above that neither suspended nor bedload sediments from the South Fork Eel River are deposited near the culvert. Therefore, this concept addresses sedimentation processes that do not exist and ignores the potential impact of Fish Creek sediment loads on the proposed fish ladder.
Exhibit 2: Fish Creek Basis of Design Report

29
Appendix B: 65% Design Drawings
Exhibit 2: Fish Creek Basis of Design Report