delineation of waters of the u.s. - united states fish … creek fish passage...delineation of...
TRANSCRIPT
Delineation of Waters of the U.S.
Mill Creek Fish Passage Restoration Project Tehama County, California
March 2015
Prepared for:
3950 Industrial Boulevard, Suite 100C West Sacramento, CA 95691
Prepared by:
Delineation of Waters of the U.S.
Mill Creek Fish Passage Restoration Project Tehama County, California
March 2015
Prepared by:
Prepared for:
3950 Industrial Boulevard, Suite 100C West Sacramento, CA 95691
Delineation of Waters of the U.S. Tehama Environmental Solutions, Inc. Mill Creek Fish Passage Restoration Project
Page i
TABLE OF CONTENTS
PAGE INTRODUCTION .......................................................................................................................... 1
Study Area Location and Directions ................................................................................. 1
Proposed Project ............................................................................................................. 1
Contact Information ......................................................................................................... 4
ENVIRONMENTAL SETTING ........................................................................................................ 4
General Site Characteristics ............................................................................................ 4
Land Use ......................................................................................................................... 5
Hydrology ........................................................................................................................ 5
Soils ................................................................................................................................ 5
Vegetation / Plant Communities ........................................................................................ 8
METHODS ................................................................................................................................... 9
RESULTS ................................................................................................................................... 10
Jurisdictional Considerations ........................................................................................ 12
REFERENCES ........................................................................................................................... 21
FIGURES 1. Site Vicinity Map .......................................................................................................... 2 2. Site Location Map ........................................................................................................ 3 3. Soil Survey Map ........................................................................................................... 7 4. – 11. Preliminary Delineation Maps ...................................................................... 13 - 20 TABLES 1. Summary of Preliminary Delineated Waters of the U.S. ....................................... 11 - 12
APPENDICES
A. Routine Wetland Delineation Forms B. Site Photos
Delineation of Waters of the U.S. Tehama Environmental Solutions, Inc. Mill Creek Fish Passage Restoration Project
Page 1
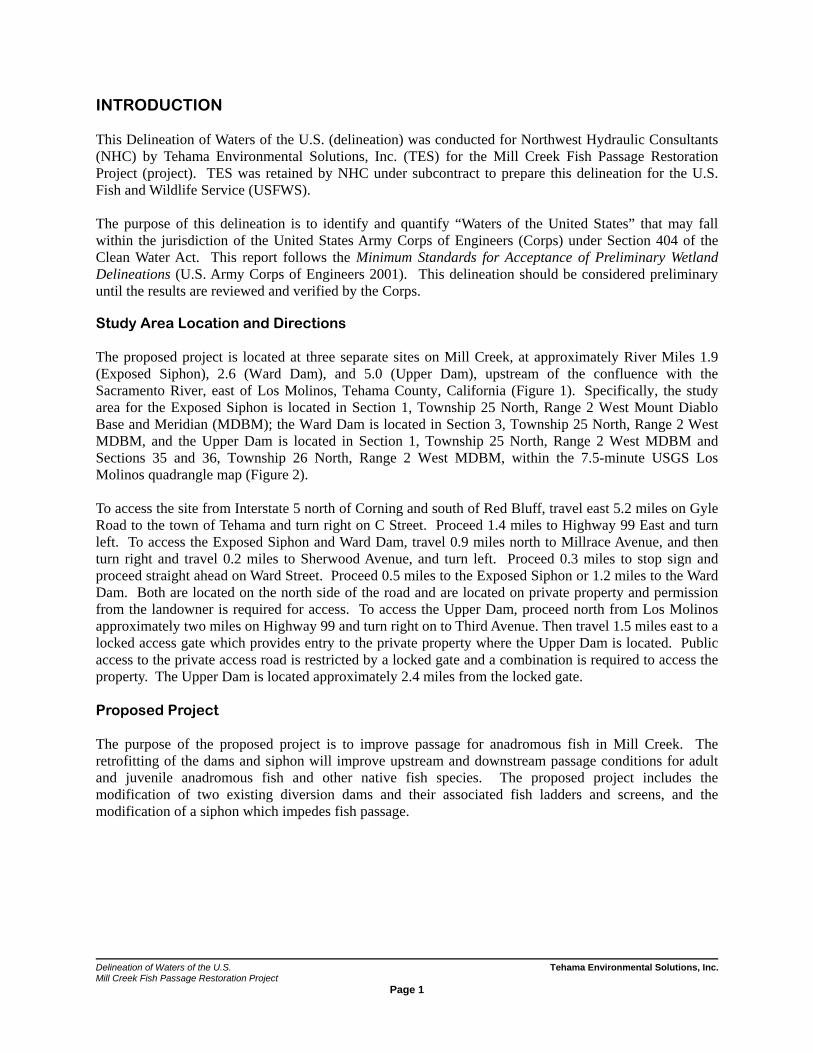
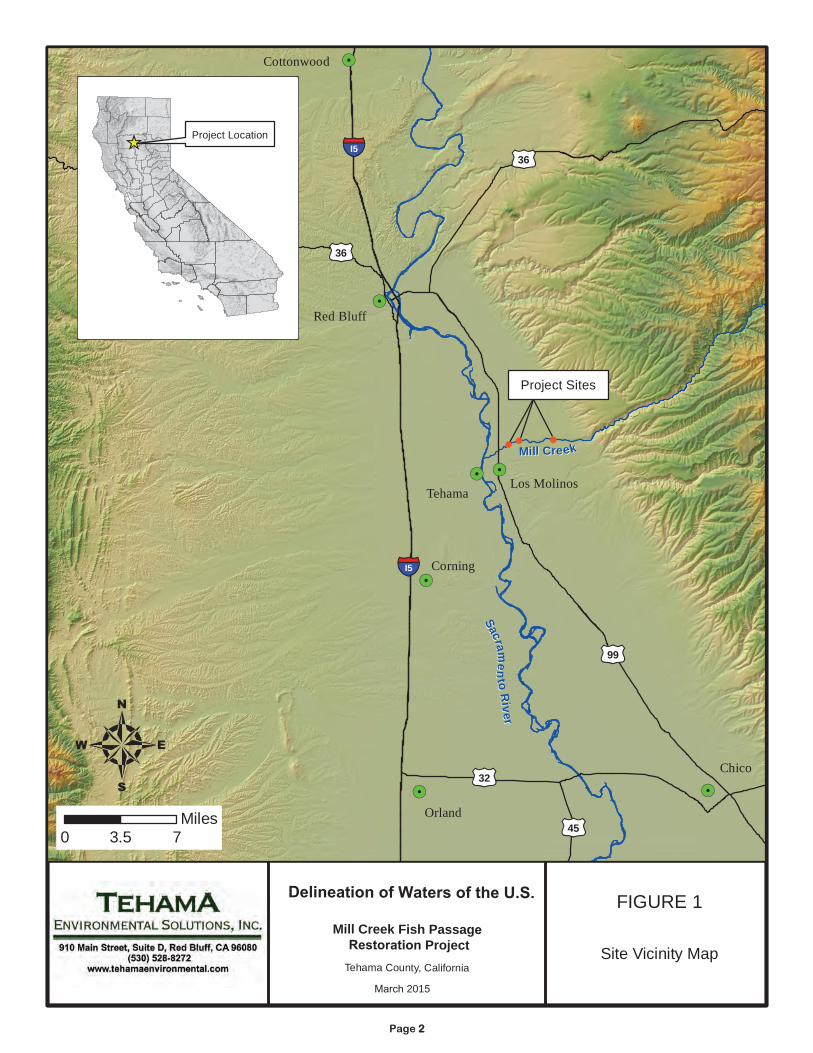
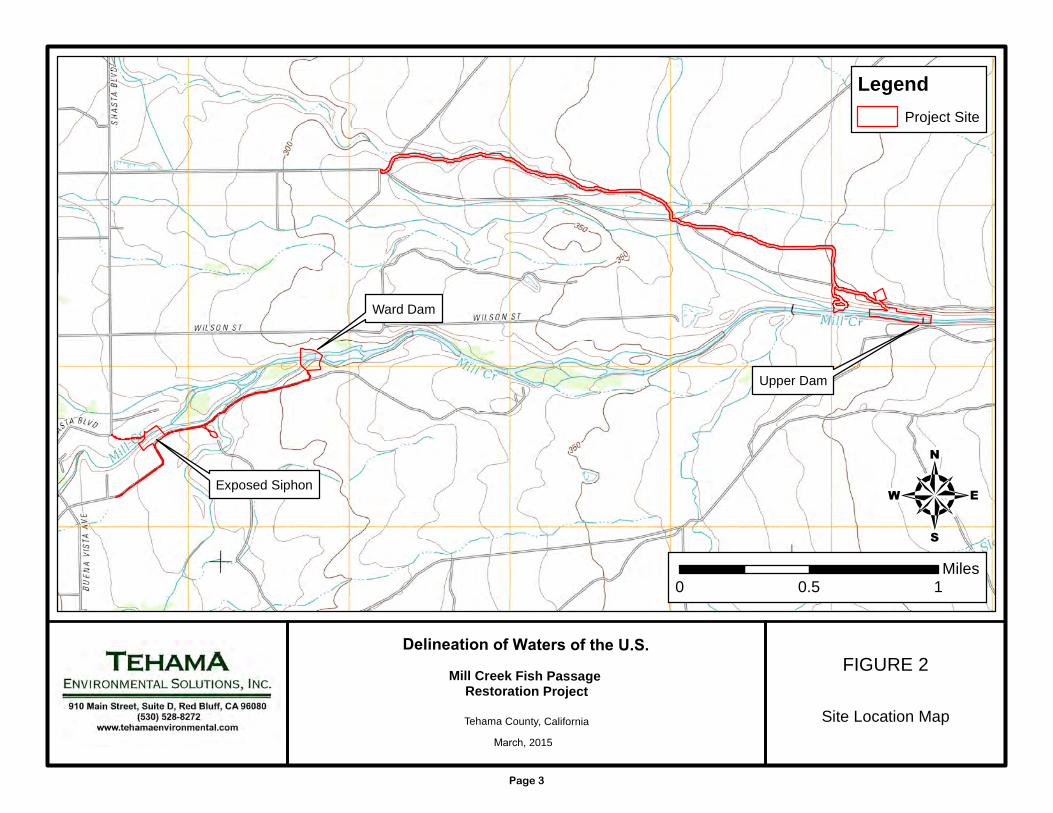
INTRODUCTION This Delineation of Waters of the U.S. (delineation) was conducted for Northwest Hydraulic Consultants (NHC) by Tehama Environmental Solutions, Inc. (TES) for the Mill Creek Fish Passage Restoration Project (project). TES was retained by NHC under subcontract to prepare this delineation for the U.S. Fish and Wildlife Service (USFWS). The purpose of this delineation is to identify and quantify “Waters of the United States” that may fall within the jurisdiction of the United States Army Corps of Engineers (Corps) under Section 404 of the Clean Water Act. This report follows the Minimum Standards for Acceptance of Preliminary Wetland Delineations (U.S. Army Corps of Engineers 2001). This delineation should be considered preliminary until the results are reviewed and verified by the Corps. Study Area Location and Directions The proposed project is located at three separate sites on Mill Creek, at approximately River Miles 1.9 (Exposed Siphon), 2.6 (Ward Dam), and 5.0 (Upper Dam), upstream of the confluence with the Sacramento River, east of Los Molinos, Tehama County, California (Figure 1). Specifically, the study area for the Exposed Siphon is located in Section 1, Township 25 North, Range 2 West Mount Diablo Base and Meridian (MDBM); the Ward Dam is located in Section 3, Township 25 North, Range 2 West MDBM, and the Upper Dam is located in Section 1, Township 25 North, Range 2 West MDBM and Sections 35 and 36, Township 26 North, Range 2 West MDBM, within the 7.5-minute USGS Los Molinos quadrangle map (Figure 2). To access the site from Interstate 5 north of Corning and south of Red Bluff, travel east 5.2 miles on Gyle Road to the town of Tehama and turn right on C Street. Proceed 1.4 miles to Highway 99 East and turn left. To access the Exposed Siphon and Ward Dam, travel 0.9 miles north to Millrace Avenue, and then turn right and travel 0.2 miles to Sherwood Avenue, and turn left. Proceed 0.3 miles to stop sign and proceed straight ahead on Ward Street. Proceed 0.5 miles to the Exposed Siphon or 1.2 miles to the Ward Dam. Both are located on the north side of the road and are located on private property and permission from the landowner is required for access. To access the Upper Dam, proceed north from Los Molinos approximately two miles on Highway 99 and turn right on to Third Avenue. Then travel 1.5 miles east to a locked access gate which provides entry to the private property where the Upper Dam is located. Public access to the private access road is restricted by a locked gate and a combination is required to access the property. The Upper Dam is located approximately 2.4 miles from the locked gate. Proposed Project The purpose of the proposed project is to improve passage for anadromous fish in Mill Creek. The retrofitting of the dams and siphon will improve upstream and downstream passage conditions for adult and juvenile anadromous fish and other native fish species. The proposed project includes the modification of two existing diversion dams and their associated fish ladders and screens, and the modification of a siphon which impedes fish passage.
!.Red Bluff
§̈¦I5
!.Cottonwood
MMiillll CCrree eekk
!.!.Tehama
Los Molinos
£¤99
£¤36
£¤36
§̈¦I5
!.!.
!.
Orland
Chico
Corning
£¤32
£¤45
Project Sites
SSaaccrraa
mmee
n nttoo
RRiivv
eerr
4FIGURE 1
_̂Project Location
Site Vicinity Map
March 201
Tehama County, California
0 3.5 7Miles
Deline of Waters of the U.S.
Mill Creek Fish Passag Project
Page 2
Exposed Siphon
Ward Dam
Upper Dam
40 0.5 1
Miles
March, 2015
Tehama County, California
Mill Creek Fish Passage Restoration Project
Delineation of Waters of the U.S.FIGURE 2
Site Location Map
LegendProject Site
Page 3
Delineation of Waters of the U.S. Tehama Environmental Solutions, Inc. Mill Creek Fish Passage Restoration Project
Page 4
Contact Information Project Applicant U.S. Fish and Wildlife Service Ms. Patricia Parker Hamelberg, Fish Biologist / Habitat Restoration Coordinator Red Bluff Fish and Wildlife Office 10950 Tyler Road Red Bluff, California 96080 (530) 527-3043, ext. 248 [email protected] Property Owner s Los Molinos Mutual Water Company Mr. Darrell Mullins, Manager 25162 Josephine Street Los Molinos, California 96055 (530) 384-2737 Mill Creek Ranch Mr. Flint Stumbaugh, Ranch Manager 25420 Tehama-Vina Road Los Molinos, California 96055 Dye Creek Preserve Ms. Andrea Craig, Preserve Manager 11010 Foothill Blvd. Los Molinos, California 96055 (530) 527-4261 ENVIRONMENTAL SETTING General Site Characteristics The study area is located in the foothills of the Cascade Range and on the Sacramento Valley floor within the property boundaries of several private landowners. Mill Creek is a tributary to the Sacramento River in Tehama County. The proposed project includes three components: the Exposed Siphon, the Ward Dam and the Upper Dam. The site is comprised of terrain which is generally gradually sloping and with steep slopes and varying aspects associated with a perennial creek which is the main drainage. The site has a general western aspect and drains to the west. The elevation of the site ranges from approximately 275 feet above mean sea level at the Exposed Siphon, 285 feet at Ward Dam, and 380 feet at the Upper Dam. The study area vegetation is relatively sparse along the banks at the Upper Dam with very dense vegetation along the banks of Ward Dam and the Exposed Siphon. The project is being implemented by the USFWS in cooperation with the private landowners and the Mill Creek Fish Passage Restoration Project Technical Team, which includes representatives from the USFWS, U.S. Bureau of Reclamation (Reclamation), National Marine Fisheries Service (NMFS), California Department of Fish and Wildlife (CDFW), California Department of Water Resources (DWR), Mill Creek Conservancy, Los Molinos Mutual Water Company (LMMWC) and several private consulting firms.
Delineation of Waters of the U.S. Tehama Environmental Solutions, Inc. Mill Creek Fish Passage Restoration Project
Page 5
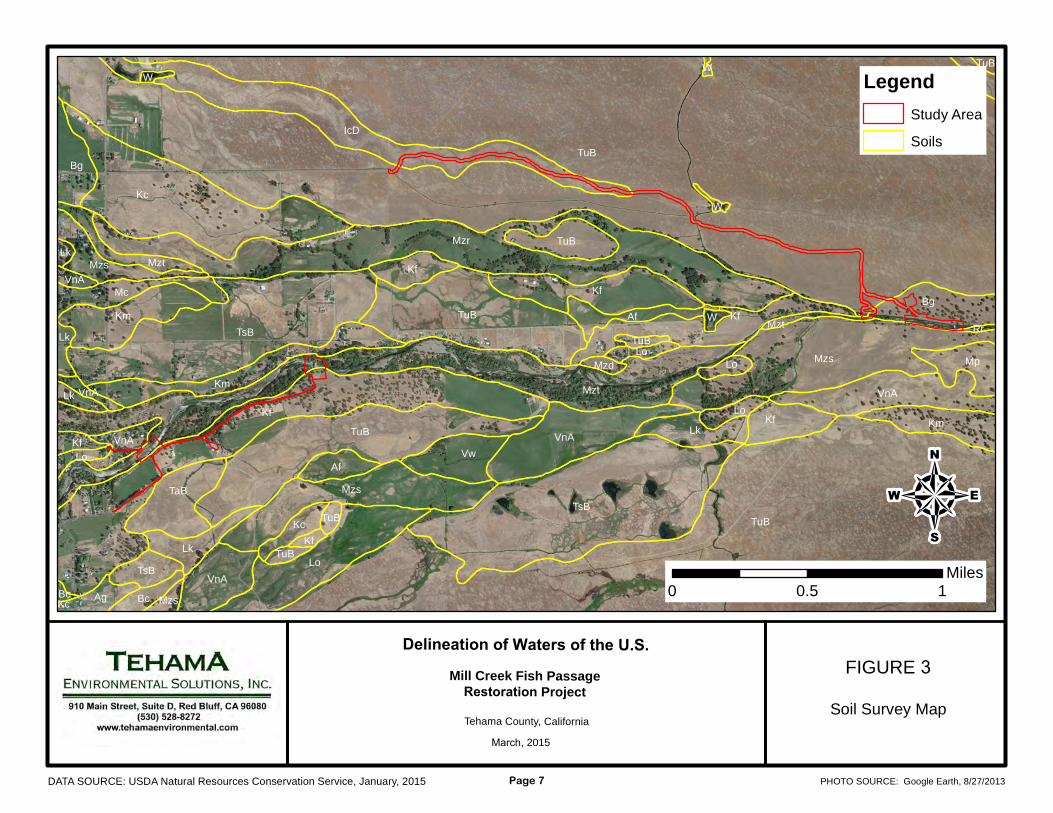
Land Use The project area is a working ranch, (Mill Creek Ranch) on the property south of Mill Creek and the Dye Creek Preserve managed by The Nature Conservancy on the north side of the creek. The Mill Creek Ranch includes several ranch houses and associated infrastructure for power and water. Livestock grazing occurs in portions of the project but mainly on adjacent lands. Many residences and outbuildings are in the general vicinity of the Exposed Siphon and Ward Dam project sites. The 37,540-acre Dye Creek Preserve serves as a site for the research, development and demonstration of ecological management and restoration techniques, outdoor education and also operates as a working ranch leasing grazing rights to a private rancher and hunting rights to a commercial outfitter. Hydrology Mill Creek is an approximately 60-mile long perennial stream flowing generally southwest, originating from the southern-facing slopes of Lassen Peak and eventually flowing into the Sacramento River near the towns of Tehama and Los Molinos, California. The Mill Creek watershed includes a total area of 134 square miles and drains from northeast to southwest into the Sacramento River. Below Mill Creek canyon, the creek flows for about eight miles before reaching the Sacramento River. No other streams are present within the study area, however there are a number of perennial and intermittent streams in the general area. The Exposed Siphon is downstream of the Ward Dam. The Exposed Siphon crosses Mill Creek at approximately 0.5 miles above the Shasta Boulevard Bridge and approximately 4,000 feet downstream from the Ward Dam. The Exposed Siphon is an underground pipe with a concrete cap which was exposed during a large flood event. The concrete cap is now about two feet higher in elevation than the channel bed elevation. A scour hole downstream of the Exposed Siphon near the south bank, formed as a result of the skewed alignment of the exposed pipe and concrete cap, directs flows towards this bank. The Ward Dam diversion has an appropriative water right for 52.5 cubic feet per second (cfs). Water from the Ward Dam diversion is conveyed through a constructed canal which has a fish screen. A bypass return pipe allows for some water and any fish entrapped in the canal to return to Mill Creek. Diverted water that is passed through the screen is conveyed through a series of unlined ditches to deliver irrigation and stock water to a number of LMMWC customers. The Upper Dam diversion has an appropriative water right for 90 cfs. Water from the Upper Dam diversion is conveyed through a constructed canal which has a fish screen. A bypass return pipe allows for some water and any fish entrapped in the canal to return to Mill Creek. Diverted water that is passed through the screen is conveyed through a series of unlined ditches until it reaches a number of LMMWC customers as irrigation and stock water. Soils Nine different soil map units occur within the study area (Figure 3) according to the local soil survey (U.S. Department of Agriculture [USDA] – Soil Conservation Service et al. 1967). The nine identified map units are listed below: Berrendos clay loam, 0 to 3 percent slopes (Bg) These soils are located east of the Sacramento River on narrow floodplains and are formed in alluvium, derived from basic volcanic rock. These soils are usually six feet deep, but in some areas there is a cemented layer at approximately three feet. This soil is moderately well drained, and permeability and runoff are slow. The soil is not listed as hydric on the state hydric soils list (USDA-Natural Resources
Delineation of Waters of the U.S. Tehama Environmental Solutions, Inc. Mill Creek Fish Passage Restoration Project
Page 6
Conservation Service [NRCS] 1995). The soil is listed as hydric as a component and an inclusion on the local hydric soils list (USDA-NRCS 2001). According to the California Soil Resource Lab (CSRL) website (UC Davis 2015), the taxonomy of the series is fine, montmorillonitic, thermic, Chromic Pelloxerents. Inks cobbly loam, 3 to 30 percent slopes (IcD) This soil is located on low rounded hills east of the Sacramento River and is formed of sediments washed from areas of volcanic rocks which are mostly andesite and basalt. The soil is well drained and permeability is moderate through the profile, but is slow through the underlying material. Runoff is slow to medium. The soil is not listed as hydric on the state hydric soils list (USDA-NRCS 1995). The soil is also not listed as hydric on the local hydric soils list (USDA-NRCS 2001). According to the USDA-NRCS Official Soil Series Descriptions website (USDA-NRCS 2015), the taxonomy of the series is loamy-skeletal, mixed, superactive, thermic, Lithic Argixerolls. Keefers loam, 0 to 3 percent slopes (Kf) This soil map unit is located on the eastern side of the Sacramento River on old stream terraces. The soils are formed on old alluvium, derived from basic igneous rock, mainly andesite and basalt. Roots and water are restricted due to the clay subsoil. The soil is well drained with slow runoff and permeability. The soil is not listed as hydric on the state hydric soils list (USDA-NRCS 1995). The soil is also not listed as hydric on the local hydric soils list (USDA-NRCS 2001). According to the USDA-NRCS Official Soil Series Descriptions website (USDA-NRCS 2015), the taxonomy of the series is clayey-skeletal, smectitic, thermic, Mollic Haploxeralfs. Molinos complex, channeled (Mzt) These soils are located along active streams east of the Sacramento River between 200 and 1,000 feet in elevation. The soils are from recent alluvium which is derived from basic igneous rocks, mainly andesite and basalt. This nearly level complex consists of well drained to somewhat excessively drained soils with very low runoff. This complex can consist of any of the Molinos soils. The soil is not listed as hydric on the state hydric soils list (USDA-NRCS 1995). The soil is listed as hydric as a component and inclusion on the local hydric soils list (USDA-NRCS 2001). According to the CSRL website (UC Davis 2015), the taxonomy of the series is coarse-loamy, mixed, nonacid, thermic, Aquic Xerofluvents. Molinos gravelly fine sandy loam (Mzs) These soils are located along active streams east of the Sacramento River between 200 and 1,000 feet in elevation. The soils are from recent alluvium which is derived from basic igneous rocks, mainly andesite and basalt. Molinos fine sandy loam is well drained to excessively drained. Runoff is very slow and permeability is moderately rapid. The soil is not listed as hydric on the state hydric soils list (USDA-NRCS 1995). The soil is also not listed as hydric on the local hydric soils list (USDA-NRCS 2001). According to the CSRL website (UC Davis 2015), the taxonomy of the series is, coarse-loamy, mixed, nonacid, thermic, Typic Xerorthents. Riverwash (Rr) This soil map unit is made up of deposits of sand and gravel. It consists of channels of intermittent streams and of active streams where the water is high. The soil is not listed as hydric on the state hydric soils list (USDA-NRCS 1995). The soil is listed as hydric in drainageways on the local hydric soils list (USDA-NRCS 2001). The series is not classified by higher categories in the soil survey. Tehama loam, 3 to 8 percent slopes (TaB) These soils are located along the edges of terraces, mostly west of the Sacramento River in elevations ranging from 200 to 1,000 feet. Tehama loam is formed in mixed alluvium, chiefly from sedimentary rock. These soils are well drained with medium runoff and slow permeability. The soil is not listed as
Lk
TsB
KcTuB
TsB
Mp
VnA
Rr
Lo
Kf
Mzs
Lo
Lk
Ag
TuB
Bc
Kf
VnA
Lk
Kf
Lo
Km
VnAMzs
TuB
Kf
KcBc
MzdLo
TsB
Km
TaB
TuB
W
TuB
IcD
Mzt
Lk
Lk
Bg
W
Lo
Vw
Mzs
VnA
Bg
Mzs
Af
Mzt
Kc
W
VnA
W
Mzt
At
KfTuB
Mc
KmKf
VnA
Af
TuB
TuB
TuB
Kf
Mzr
4
PHOTO SOURCE: Google Earth, 8/27/2013
0 0.5 1Miles
March, 2015
Tehama County, California
Mill Creek Fish Passage Restoration Project
Delineation of Waters of the U.S.
LegendStudy Area
Soils
FIGURE 3
Soil Survey Map
DATA SOURCE: USDA Natural Resources Conservation Service, January, 2015 Page 7
Delineation of Waters of the U.S. Tehama Environmental Solutions, Inc. Mill Creek Fish Passage Restoration Project
Page 8
hydric on the state hydric soils list (USDA-NRCS 1995). The soil is also not listed as hydric on the local hydric soils list (USDA-NRCS 2001). According to the USDA-NRCS Official Soil Series Descriptions website (USDA-NRCS 2015), the taxonomy of the series is fine-silty, mixed, superactive, thermic, Typic Haploxeralfs. Tuscan cobbly loam, 1 to 5 percent slopes (TuB) This series is located on the tops of old gently sloping terraces east of the Sacramento River. The soils are formed from old alluvium washed from areas of volcanic rock. The subsoil is underlain by a hardpan layer located at 10 to 20 inches in depth. The soil is well drained and permeability is very slow. Runoff is slow. The soil is not listed as hydric on the state hydric soils list (USDA-NRCS 1995). The soil is also not listed as hydric on the local hydric soils list (USDA-NRCS 2001). According to the USDA-NRCS Official Soil Series Descriptions website (USDA-NRCS 2015), the taxonomy of series is clayey, smectitic, thermic, shallow Typic Durixeralfs. Vina loam, 0 to 3 percent slopes (VnA) This soil is found east of the Sacramento River from 200 to 1,000 feet in elevation and was formed from recent alluvium washed from areas of volcanic rock. This soil is well drained and permeability is moderate. Runoff is very slow. The soil is not listed as hydric on the state hydric soils list (USDA-NRCS 1995). The soil is not listed as hydric on the local hydric soils list (USDA-NRCS 2001). According to the USDA-NRCS Official Soil Series Descriptions website (USDA-NRCS 2015), the taxonomy of the series is coarse-loamy, mixed, superactive, thermic, Pachic Haploxerolls. Vegetation / Plant Communities Six habitat types generally occur within the study area as defined by the California Wildlife-Habitat Relationships classification system (Mayer and Laudenslayer 1988). The habitat types include: Valley Foothill Riparian, Annual Grassland, Blue Oak Woodland, Valley Oak Woodland, Riverine and Fresh Emergent Wetland habitats. Valley foothill riparian habitat is present along the banks of Mill Creek at the Exposed Siphon, Ward Dam and the Upper Dam. In some reaches of the creek, the riparian habitat is scattered and discontinuous, while in other areas, such as immediately upstream of the diversion dams and Exposed Siphon, it exists as a corridor on one or both banks. At the Exposed Siphon, valley foothill riparian habitat occurs on both banks upstream and downstream of the siphon; however, it is patchy and less dense downstream of the siphon on the north bank of the creek. The dominant woody plant species at the Exposed Siphon site are white alder (Alnus rhombifolia), Fremont cottonwood (Populus fremontii), valley oak (Quercus lobata) and California sycamore (Platanus racemosa), with several other species including narrow-leaved willow (Salix exigua), red willow (Salix laevigata), mulefat (Baccharis salicifolia), fig (Ficus carica), California grape (Vitis californica), arroyo willow (Salix lasiolepis), California blackberry (Rubus ursinus) and Himalayan blackberry (Rubus armeniacus). Blue elderberry (Sambucus mexicana) shrubs are also found on the south bank downstream of the Exposed Siphon. The herbaceous layer includes native species such as deer grass (Muhlenbergia rigens), horsetail (Equisetum sp.) and mugwort (Artemisia douglasiana) along with other native and non-native grasses and forbs. At the Ward Dam, valley foothill riparian habitat occurs on both banks upstream and downstream of the dam; however, it is patchy and less dense upstream of the Ward Dam on the south bank of the creek. The dominant woody plant species at the Ward Dam site are white alder, Fremont cottonwood, valley oak and California sycamore, with several other species including Oregon ash (Fraxinus latifolia), California grape and arroyo willow. The herbaceous layer includes native species such as deer grass, horsetail and
Delineation of Waters of the U.S. Tehama Environmental Solutions, Inc. Mill Creek Fish Passage Restoration Project
Page 9
mugwort along with other native and non-native grasses and forbs. Scattered species throughout the site include red willow, narrow-leaved willow, mulefat, California blackberry and Himalayan blackberry. At the Upper Dam, valley foothill riparian habitat occurs on both banks upstream and downstream of the dam; however patches of dense habitat are only found on the north bank downstream of the dam near the fish screen and upstream of the dam on the south bank of the creek. The dominant woody plant species at the Upper Dam site are white alder and arroyo willow. The herbaceous layer includes mostly non-native grasses and forbs. Scattered species throughout the site include Himalayan blackberry, mare’s tail (Hippuris vulgaris), torrent sedge (Carex nudata), buckwheat (Eriogonum sp.), California wild grape, horsetail, California blackberry, and deer grass. Annual grassland habitat occurs along the haul roads to access the Upper Dam project site. All vernal pools / swales within the study area have been created along the access haul road prism, due to continual road traffic and disturbance, and are devoid of vegetation. Dominant herbaceous species here include native and non-native annual grasses and forbs. Several vernal pools, swales and ephemeral streams are present along the road. A corridor along a small portion of the Upper Dam access haul road, near the dam on the north high terrace, would be classified as blue oak woodland. The woody component is entirely blue oak. Dominant herbaceous species here include non-native annual grasses and forbs, along with some natives. Valley oak woodland habitat occurs along the upper southern bank of the Exposed Siphon and along the upper southern bank of Upper Dam. The dominant woody plant species at this location includes Valley oak, poison oak (Toxicodendron diversilobum), hoary coffee berry (Frangula californica ssp. tomentella) and buckbrush (Ceanothus cuneatus). Blue elderberry shrubs were also found along the south bank of the Upper Dam site. Fresh emergent habitat, where present, occurs in thin discontinuous bands along the creek channel margin and along the exposed barren rock, and gravel along banks of the stream. Islands in the channel support scattered woody and herbaceous species such as torrent sedge and willows (Salix spp.). METHODS A delineation of waters of the U.S. was conducted within the study area on various days during the months of May, June and July, 2014, by TES staff including Mr. Jeff Souza, Senior Biologist, Mr. Ben Myhre, Associate Biologist, and Mr. John Dittes, Senior Botanist of Dittes and Guardino Consulting. The delineation of wetlands was conducted in accordance with the 1987 Corps of Engineers Wetlands Delineation Manual (Environmental Laboratory 1987) and the Regional Supplement to the Corps of Engineers Wetland Delineation Manual: Arid West Region (Version 2.0) (U.S. Army Corps of Engineers 2008) using a Routine Determination Method. Four data points were characterized to determine the presence or absence of the three wetland parameters (vegetation, soils and hydrology). The data forms for the four data points are included in Appendix A. The wetland indicator status of plant species was based on the Arid West 2013 Regional Wetland Plant List (Lichvar 2013). Soil colors were determined using the Munsell Soil Color Charts (Munsell Color 2000). The boundaries of other waters of the U.S. were delineated based on the observed Ordinary High Water Mark (OHWM) using the methods outlined in A Field Guide to the Identification of the Ordinary High Water Mark (OHWM) in the Arid West Region of the Western United States (Lichvar and McColley 2008). Once delineated, the boundaries of all identified wetlands and other waters of the U.S. were then marked in the field with pin flags or field flagging, along with the location of all data points. The boundaries of all identified wetlands and other waters, and the locations of all data points, were then mapped using a
Delineation of Waters of the U.S. Tehama Environmental Solutions, Inc. Mill Creek Fish Passage Restoration Project
Page 10
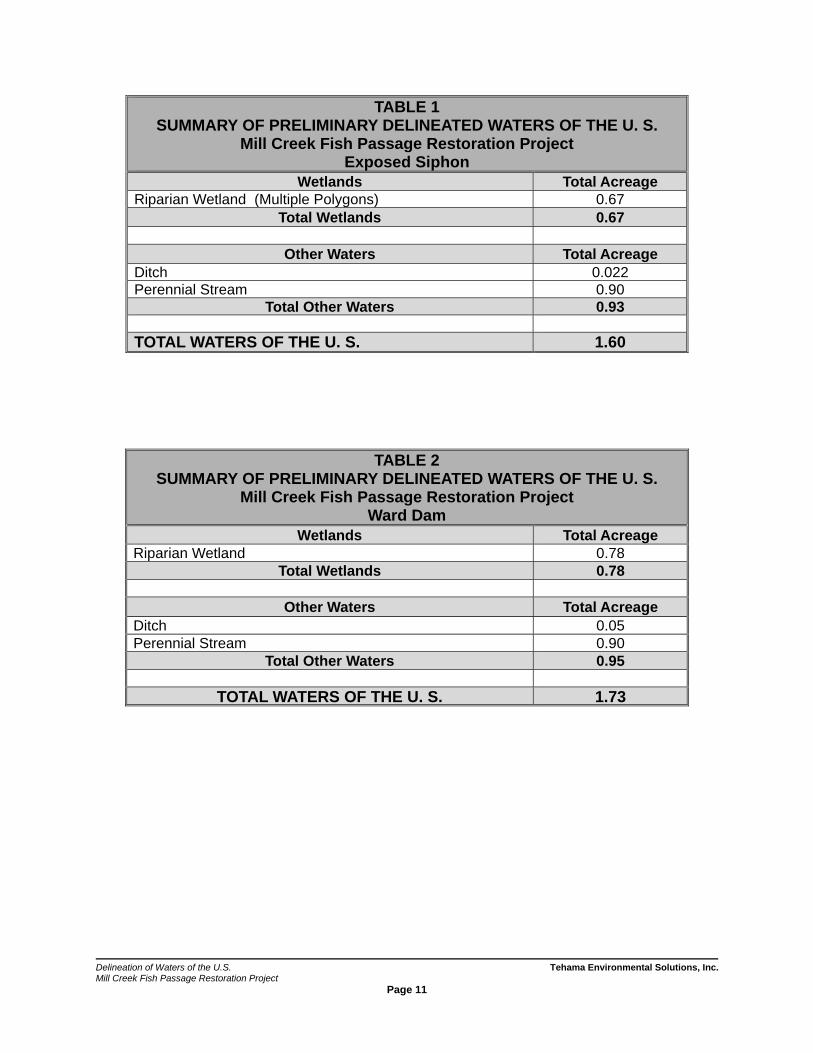
Trimble GeoExplorer 6000 series Global Positioning System (GPS) unit, capable of sub-meter accuracy. All area features less than two meters in width / diameter were collected as points or lines. Point features were physically measured to determine area data, while line features were assigned an average width and multiplied by the GPS-measured distance. These features and measurements are shown in Figures 4 - 10. RESULTS Based on the presence / absence of indicators of wetland hydrology, hydrophytic vegetation and hydric soils, 2.77 acres of potentially jurisdictional wetlands were identified and delineated between the three separate sites. Based on the presence of an OHWM, 4.06 acres of potentially jurisdictional other waters of the U.S. were also identified and delineated within the three separate sites. Tables 1, 2 and 3 present a summary of the total acreage of the jurisdictional waters of the U.S. for each site. The Exposed Siphon has 0.67 acres of potentially jurisdictional wetlands. Ward Dam has 0.78 acres of potentially jurisdictional wetlands and the Upper Dam has 1.32 acres of potentially jurisdictional wetlands. The Exposed Siphon has 0.93 acres of potentially jurisdictional other waters of the U.S. The Ward Dam has 0.95 acres of potentially jurisdictional other waters of the U.S. and the Upper Dam has 2.18 acres of potentially jurisdictional other waters of the U.S. The classification of wetland communities is based primarily on the descriptions found in Common Wetland Plants of Central California (Fiedler 1996). Site photos of the delineated waters and associated data points are included as Appendix B. Exposed Siphon The vegetation types in the Riparian Wetland features of the Exposed Siphon are dominated by white alder [FACW], and narrow-leaved willow [FACW]. Other woody species include Fremont cottonwood [FACW], valley oak [FACU], mulefat [FAC], California grape [FACU], arroyo willow [FACW] and Himalayan blackberry [FACU]. Herbaceous species include deergrass [FAC], horsetail [FAC] and mugwort [FAC]. Ward Dam The vegetation types in the Riparian Wetland features of the Ward Dam are dominated by white alder [FACW] and Oregon ash [FACW]. Other woody species include Fremont cottonwood [FACW], valley oak [FACU], California sycamore [FAC], California grape [FACU] and arroyo willow [FACW]. Herbaceous species include deer grass [FAC], horsetail [FAC] and mugwort [FAC] along with other native and non-native grasses and forbes. Upper Dam The vegetation types in the Riparian Wetland features of the Upper Dam are dominated by white alder [FACW] and arroyo willow [FACW]. The herbaceous layer includes mostly non-native grasses and forbs.
Delineation of Waters of the U.S. Tehama Environmental Solutions, Inc. Mill Creek Fish Passage Restoration Project
Page 11
TABLE 1 SUMMARY OF PRELIMINARY DELINEATED WATERS OF THE U. S.
Mill Creek Fish Passage Restoration Project Exposed Siphon
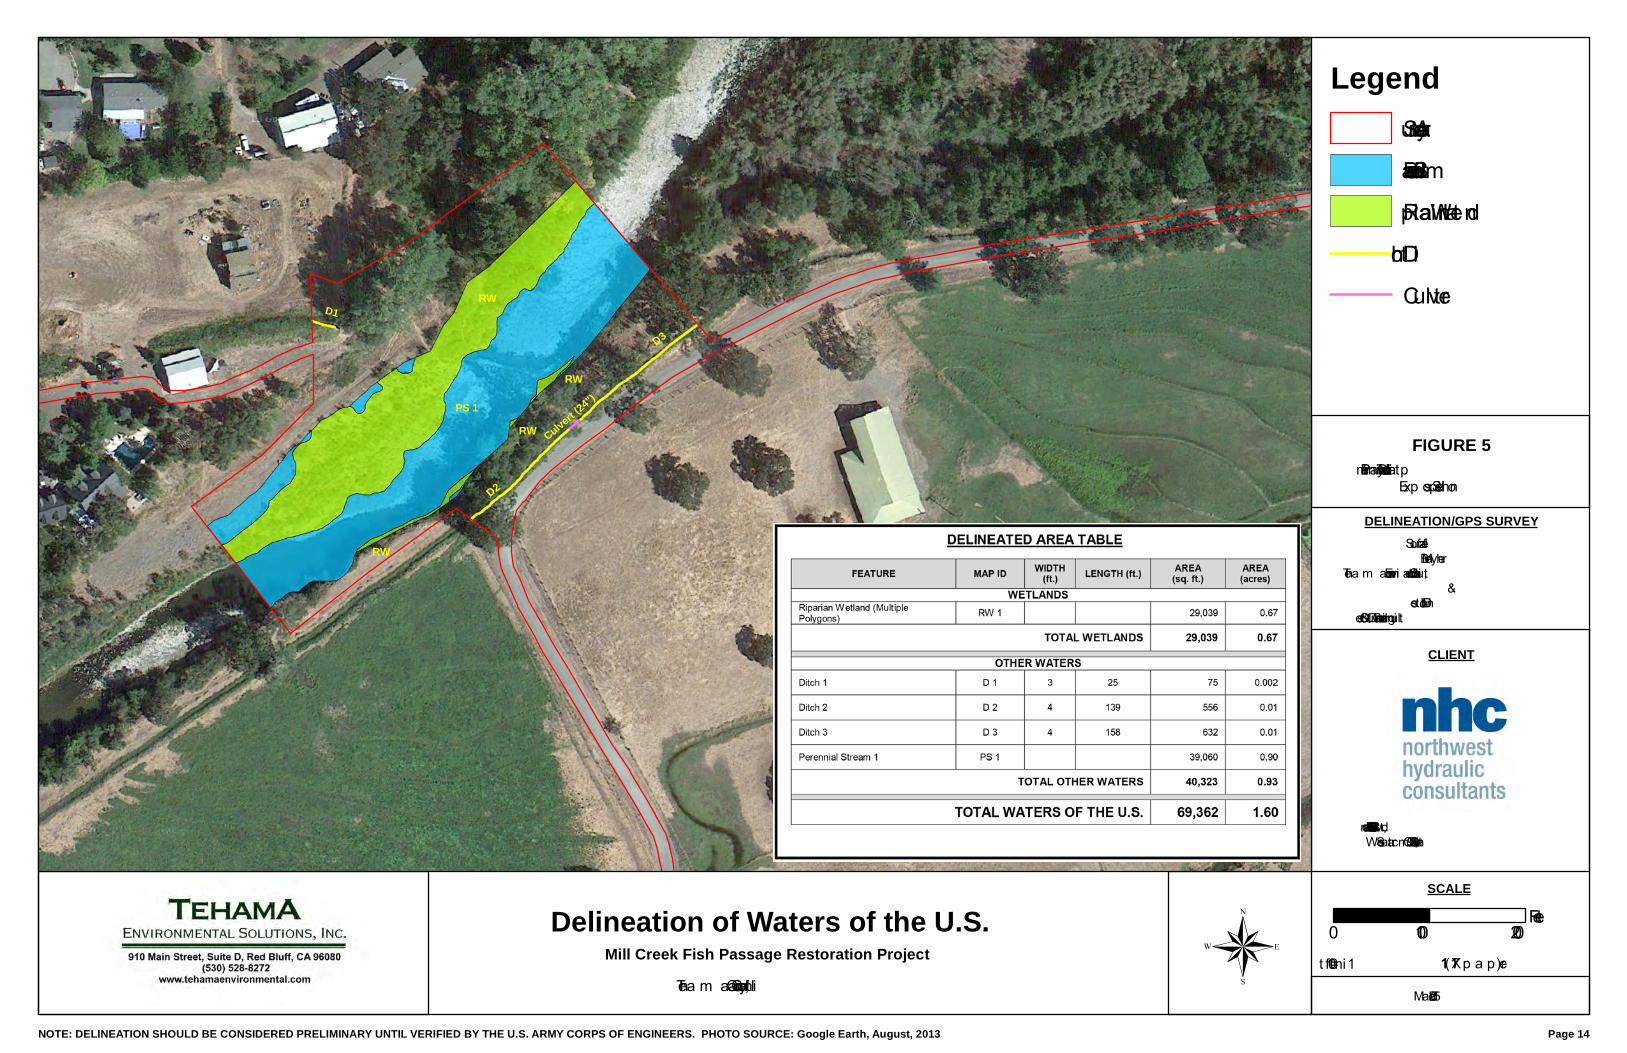
Wetlands Total Acreage Riparian Wetland (Multiple Polygons) 0.67
Total Wetlands 0.67
Other Waters Total Acreage Ditch 0.022 Perennial Stream 0.90
Total Other Waters 0.93 TOTAL WATERS OF THE U. S. 1.60
TABLE 2 SUMMARY OF PRELIMINARY DELINEATED WATERS OF THE U. S.
Mill Creek Fish Passage Restoration Project Ward Dam
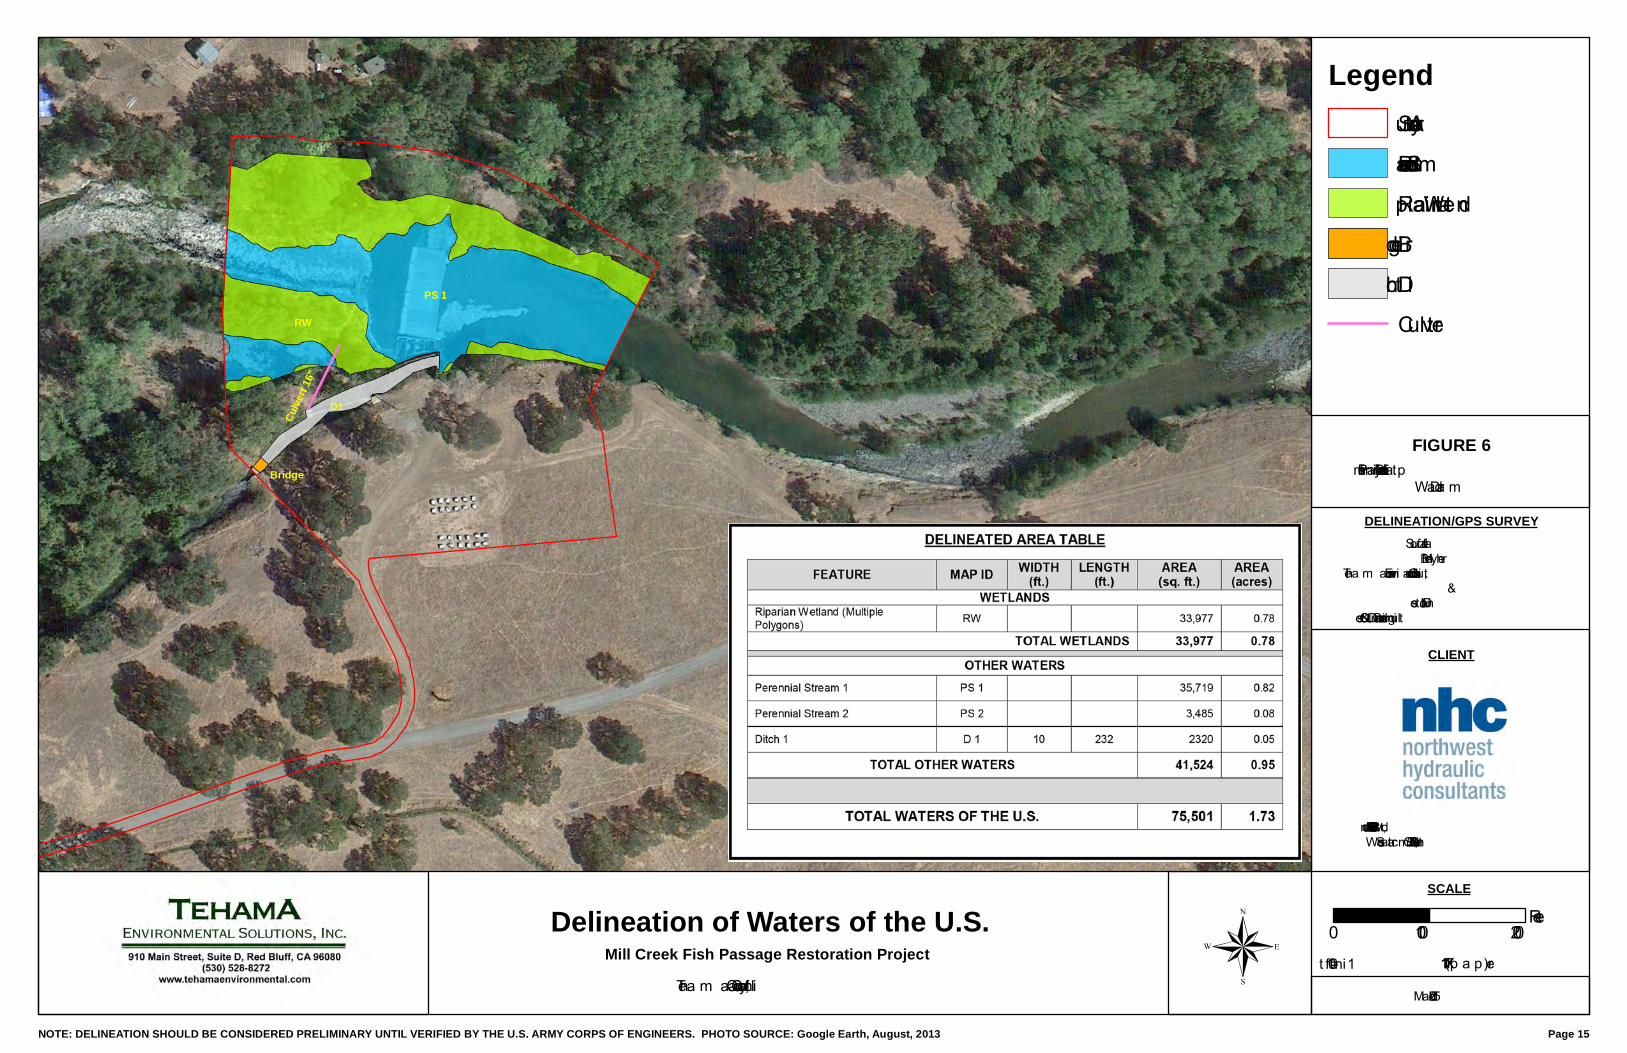
Wetlands Total Acreage Riparian Wetland 0.78
Total Wetlands 0.78
Other Waters Total Acreage Ditch 0.05 Perennial Stream 0.90
Total Other Waters 0.95
TOTAL WATERS OF THE U. S. 1.73
Delineation of Waters of the U.S. Tehama Environmental Solutions, Inc. Mill Creek Fish Passage Restoration Project
Page 12
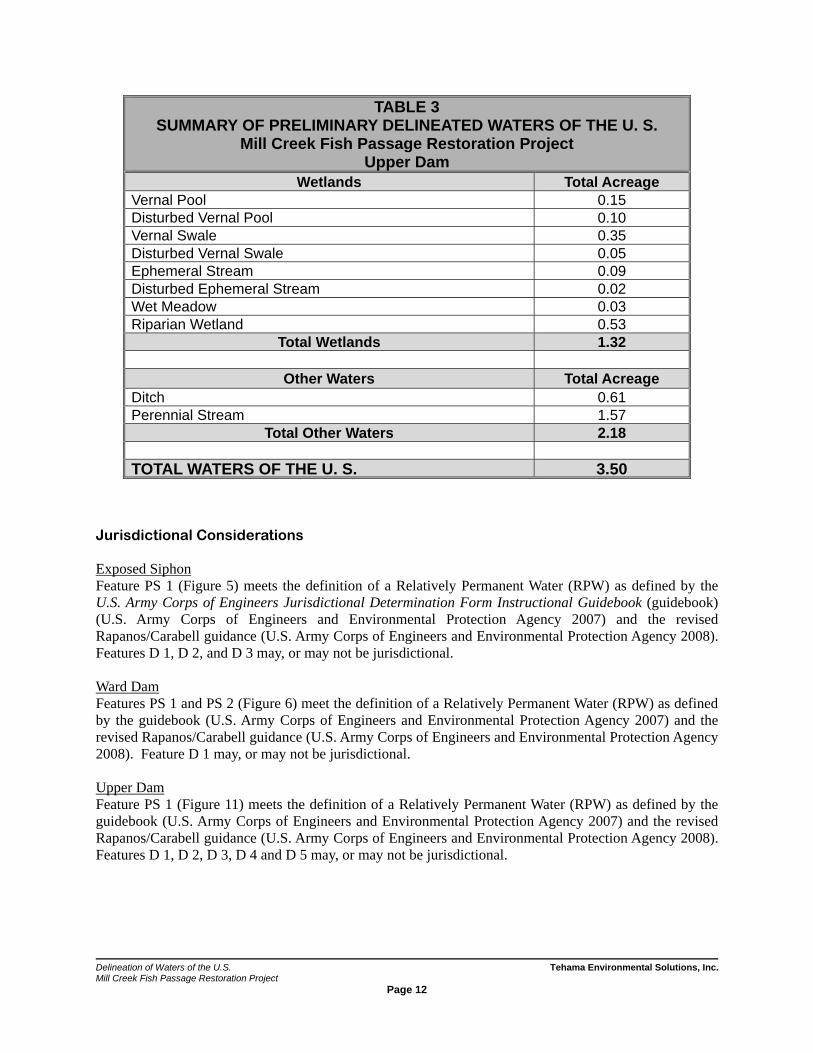
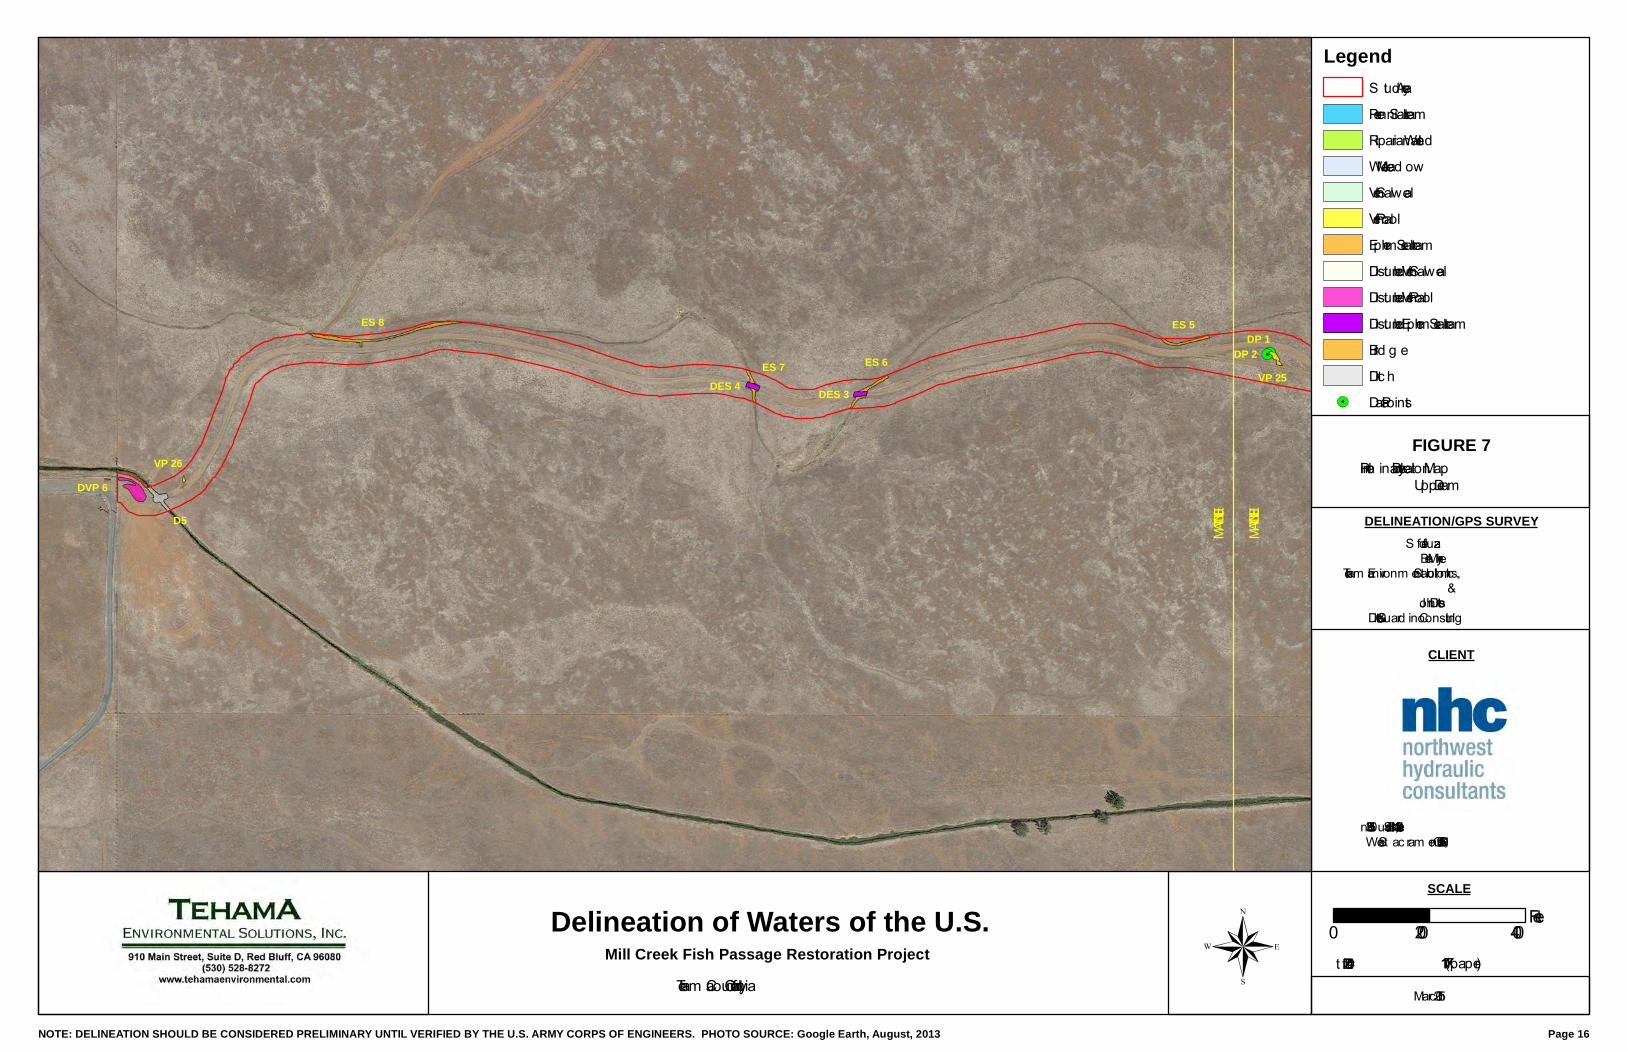
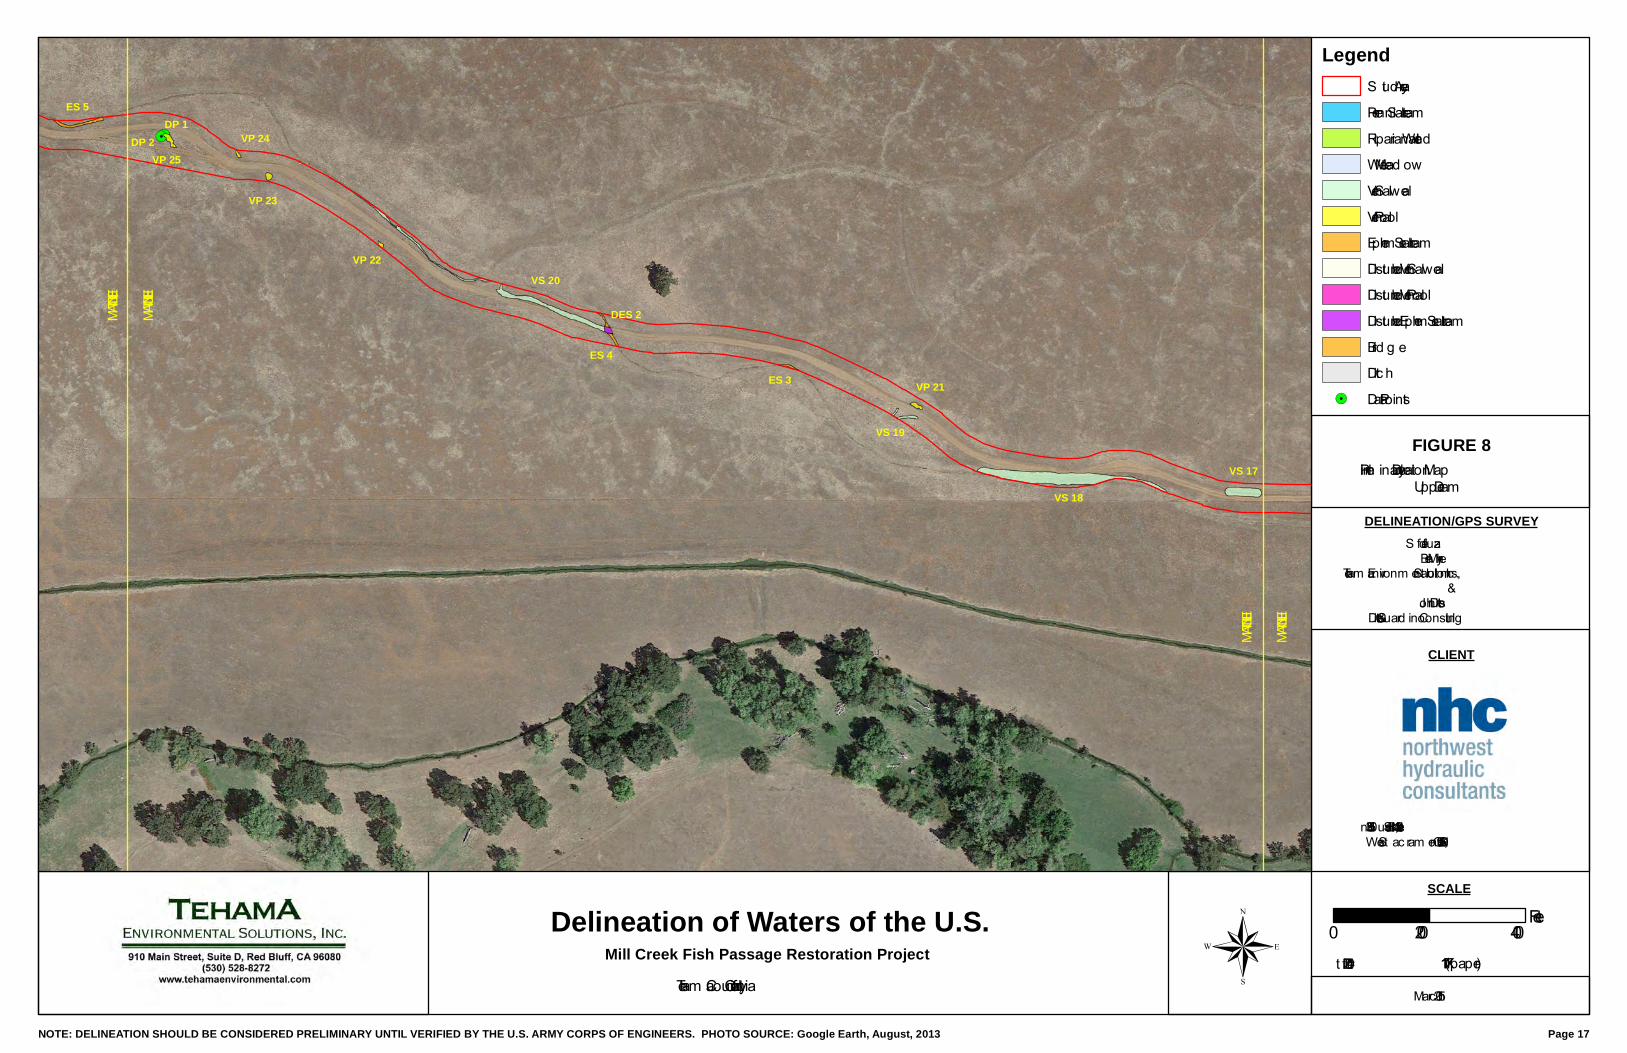
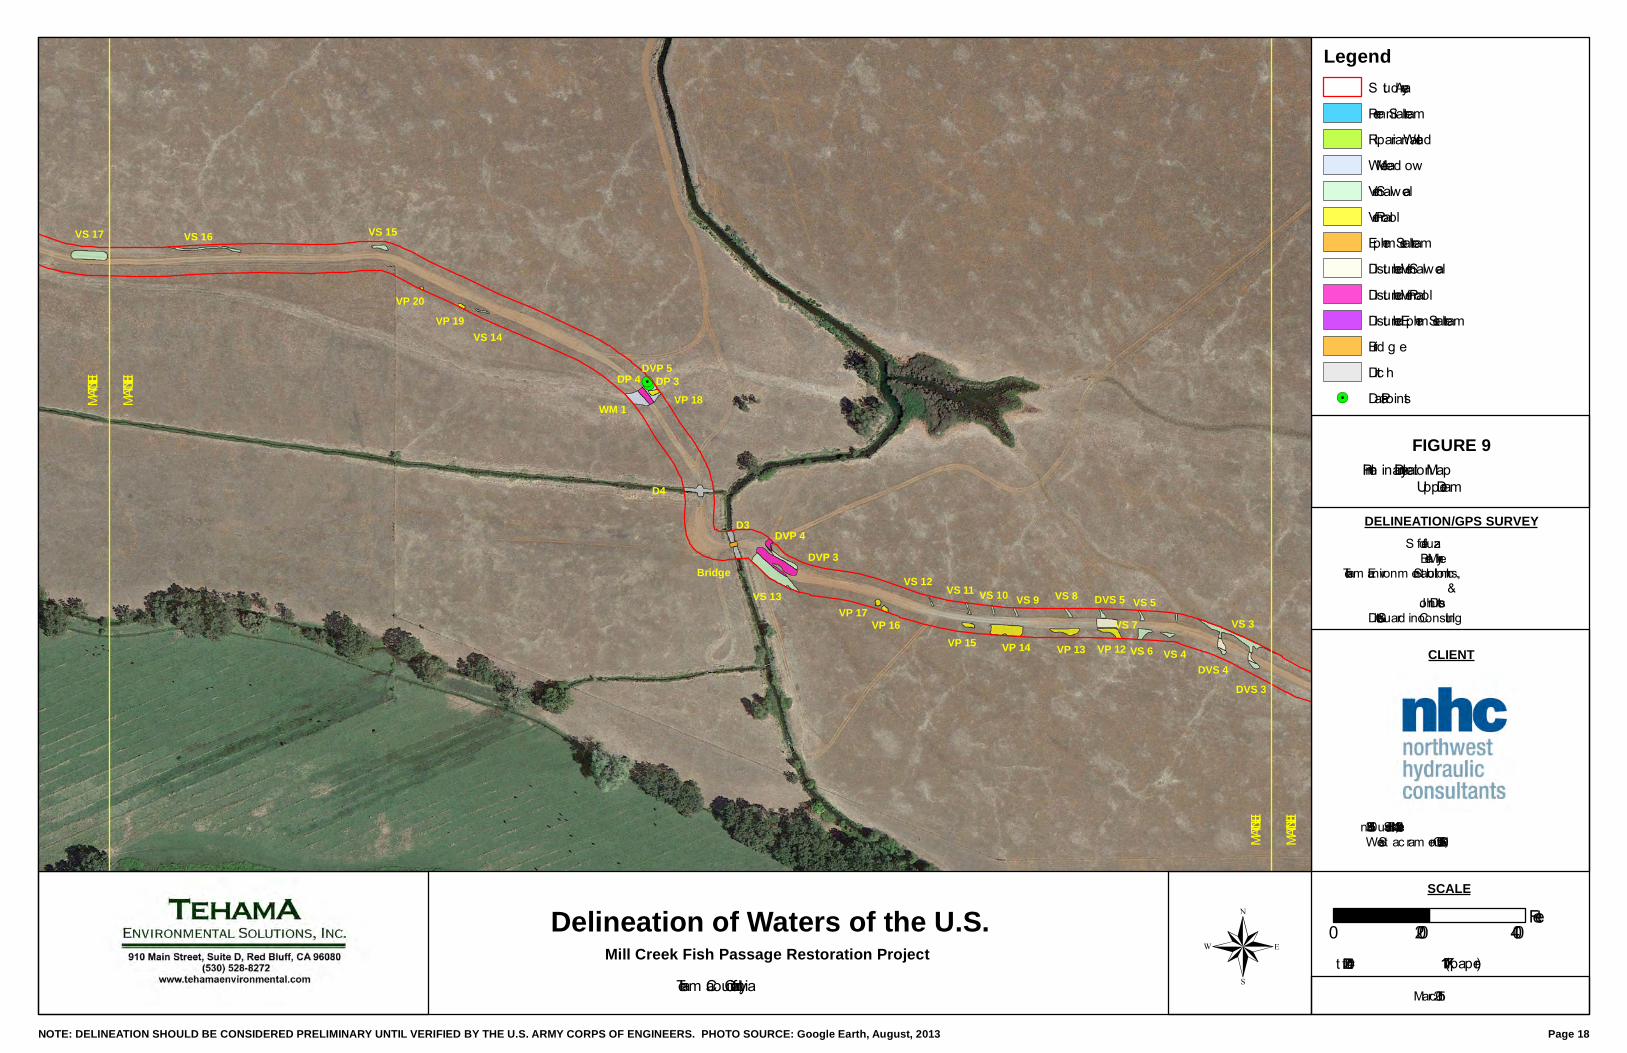
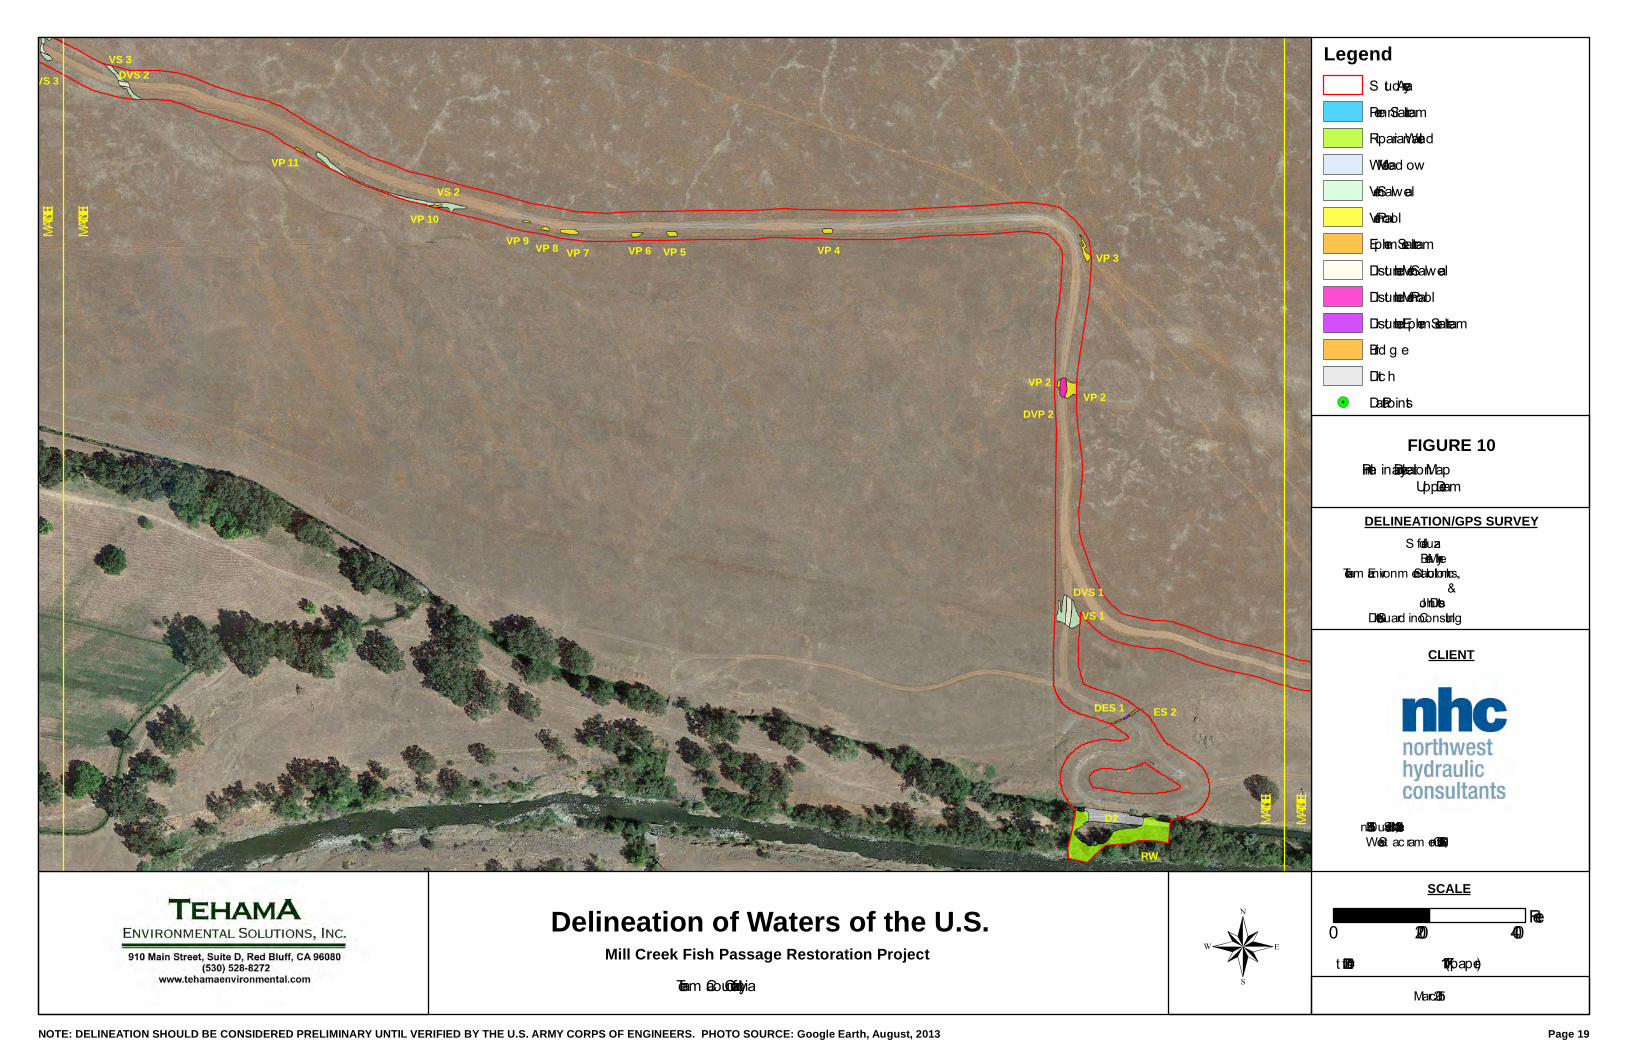
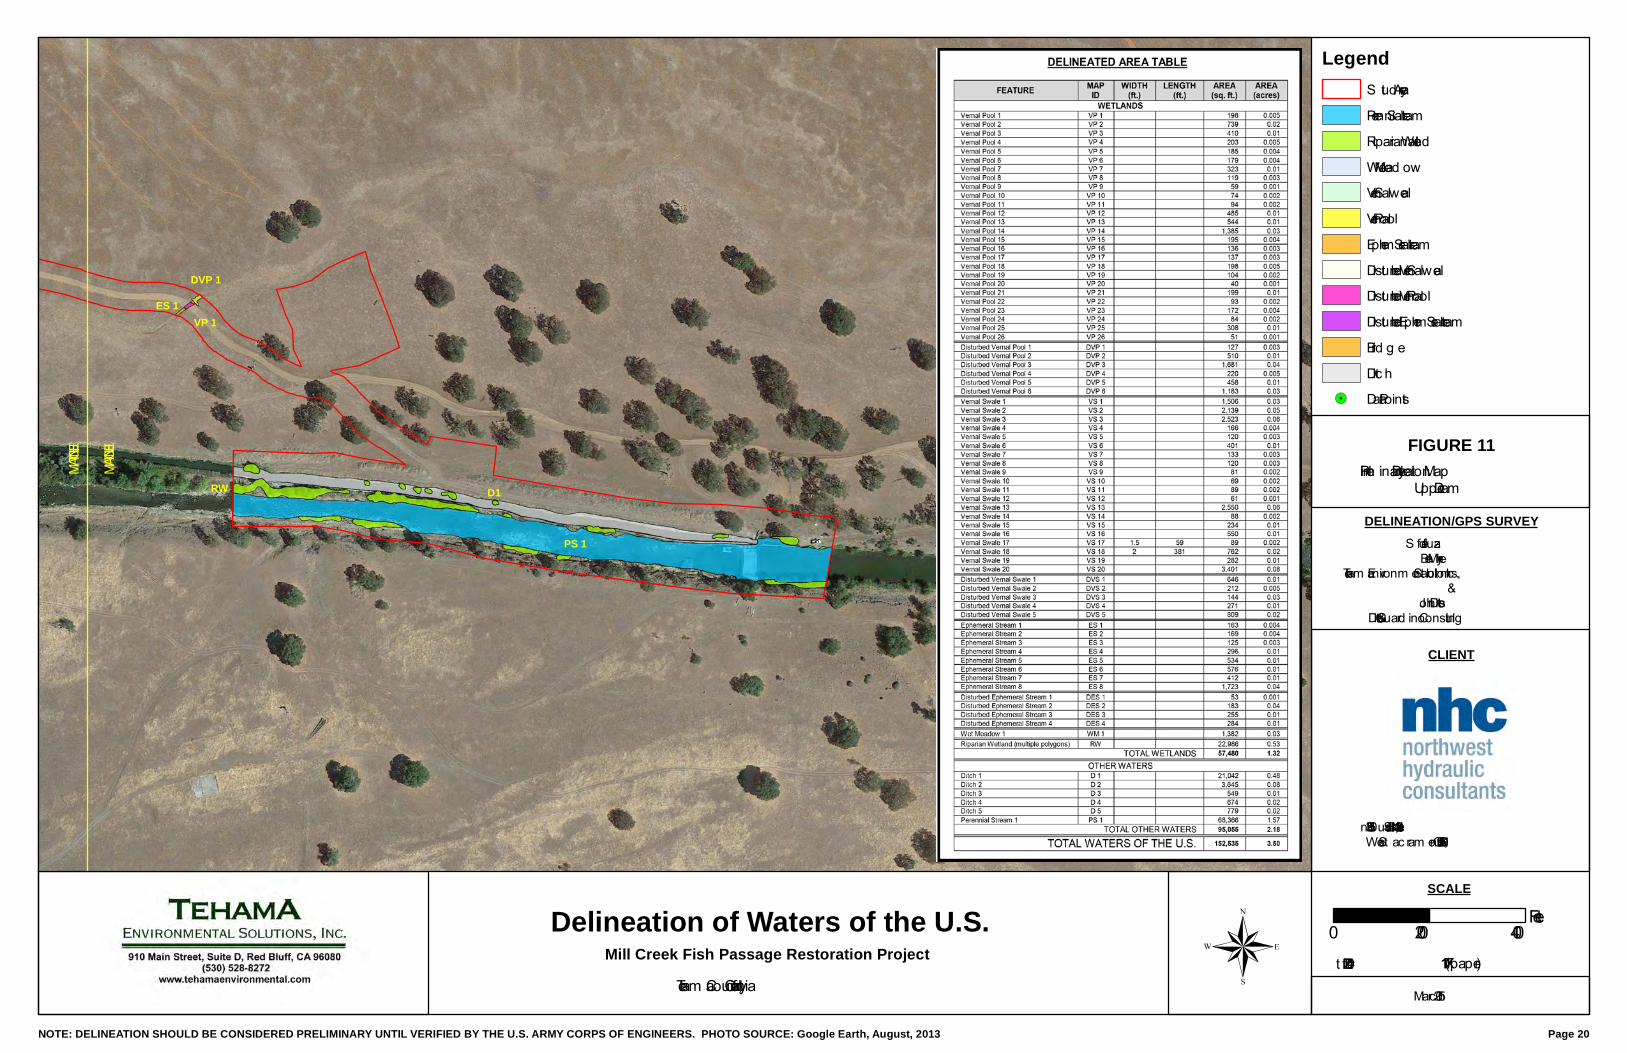
Jurisdictional Considerations Exposed Siphon Feature PS 1 (Figure 5) meets the definition of a Relatively Permanent Water (RPW) as defined by the U.S. Army Corps of Engineers Jurisdictional Determination Form Instructional Guidebook (guidebook) (U.S. Army Corps of Engineers and Environmental Protection Agency 2007) and the revised Rapanos/Carabell guidance (U.S. Army Corps of Engineers and Environmental Protection Agency 2008). Features D 1, D 2, and D 3 may, or may not be jurisdictional. Ward Dam Features PS 1 and PS 2 (Figure 6) meet the definition of a Relatively Permanent Water (RPW) as defined by the guidebook (U.S. Army Corps of Engineers and Environmental Protection Agency 2007) and the revised Rapanos/Carabell guidance (U.S. Army Corps of Engineers and Environmental Protection Agency 2008). Feature D 1 may, or may not be jurisdictional. Upper Dam Feature PS 1 (Figure 11) meets the definition of a Relatively Permanent Water (RPW) as defined by the guidebook (U.S. Army Corps of Engineers and Environmental Protection Agency 2007) and the revised Rapanos/Carabell guidance (U.S. Army Corps of Engineers and Environmental Protection Agency 2008). Features D 1, D 2, D 3, D 4 and D 5 may, or may not be jurisdictional.
TABLE 3 SUMMARY OF PRELIMINARY DELINEATED WATERS OF THE U. S.
Mill Creek Fish Passage Restoration Project Upper Dam
Wetlands Total Acreage Vernal Pool 0.15 Disturbed Vernal Pool 0.10 Vernal Swale 0.35 Disturbed Vernal Swale 0.05 Ephemeral Stream 0.09 Disturbed Ephemeral Stream 0.02 Wet Meadow 0.03 Riparian Wetland 0.53
Total Wetlands 1.32
Other Waters Total Acreage Ditch 0.61 Perennial Stream 1.57
Total Other Waters 2.18 TOTAL WATERS OF THE U. S. 3.50
® 1 in = 1,444 ft
Page 13
0 1,400 2,800Feet
March 2015Tehama Coun ty, Californ ia
NOTE: DELINEATION SHOULD BE CONSIDERED PRELIMINARY UNTIL VERIFIED BY THE U.S. ARMY CORPS OF ENGINEERS. PHOTO SOURCE: Google Earth, August, 2013
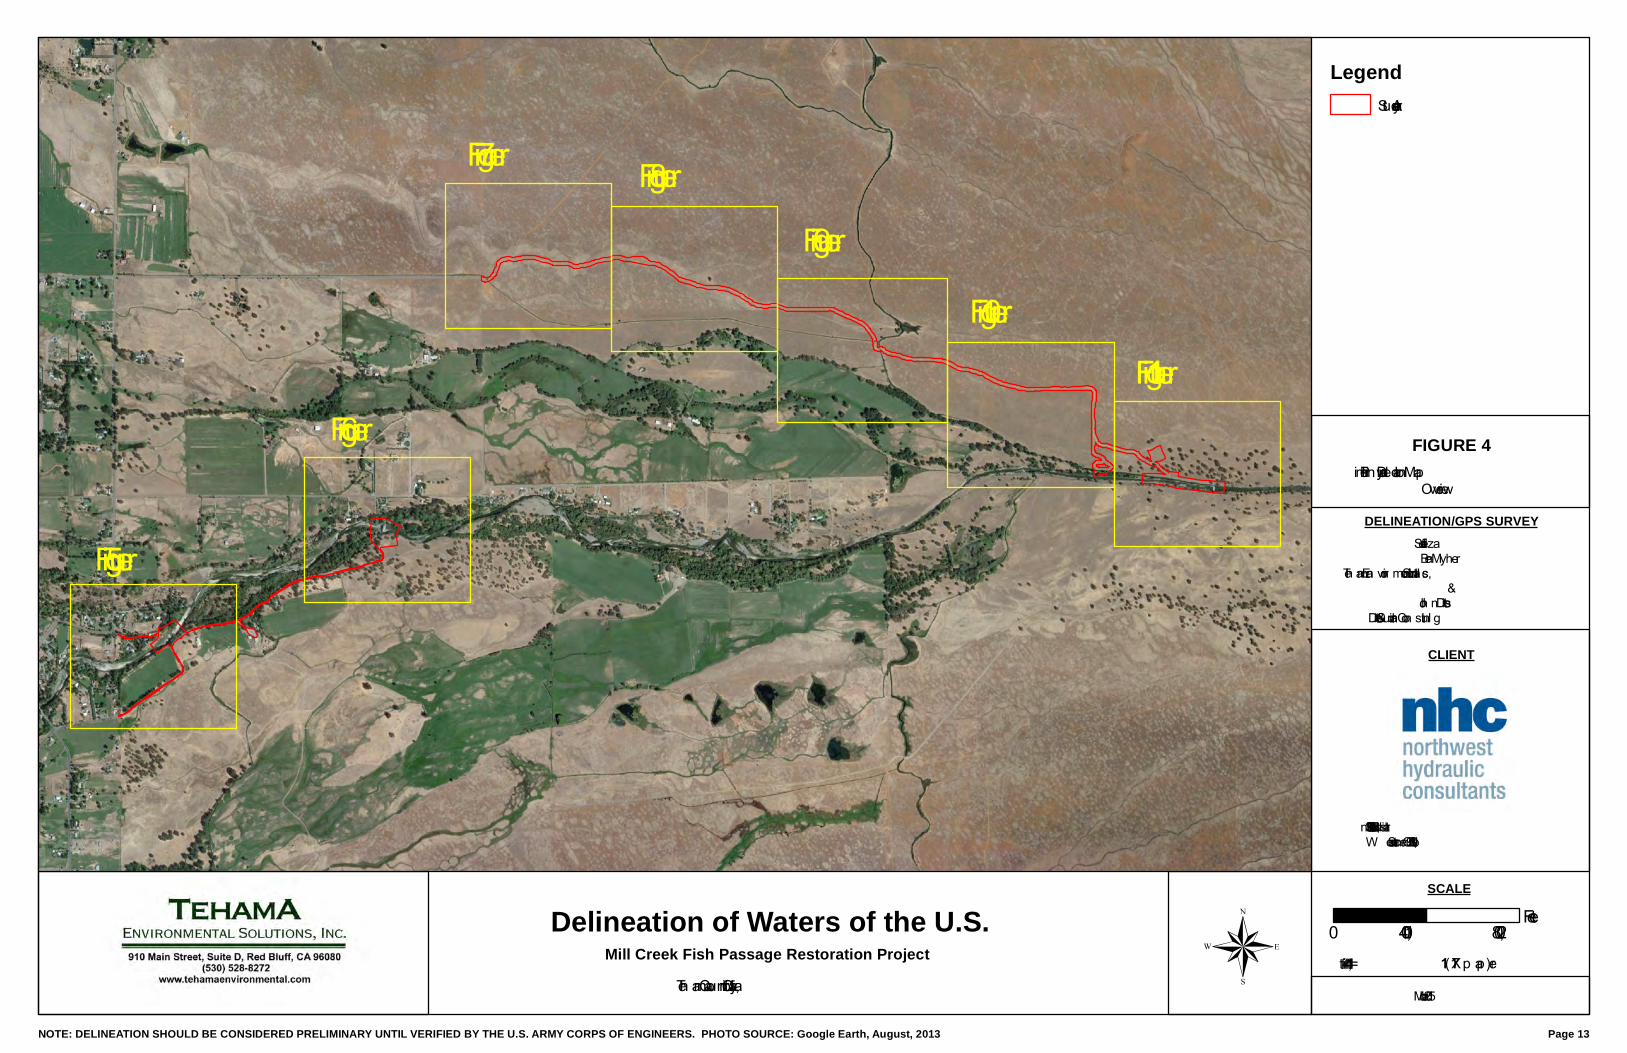
FIGURE 4Prelimin ary Delin eation Map
Overview
Delineation of Waters of the U.S.Mill Creek Fish Passage Restoration Project
SCALE
CLIENT
(11” X 17” p ap er)
3950 In dustrial Blvd, Ste 100cW est Sacramen to, CA 95691INSET MAP "A"INSET MAP "A"
DELINEATION/GPS SURVEYJeff SouzaBen Myh re
Tehama En viron men tal Solution s, In c.&
Joh n DittesDittes & Guardin o Con sultin g
LegendStudy Area
Figure 5
Figure 6
Figure 7
Figure 11Figure 10
Figure 9Figure 8
® 1 in = 100 ft
Page 14
0 100 200Feet
Ma rch 2015Teha m a County, Ca lifornia
NOTE: DELINEATION SHOULD BE CONSIDERED PRELIMINARY UNTIL VERIFIED BY THE U.S. ARMY CORPS OF ENGINEERS. PHOTO SOURCE: Google Earth, August, 2013
FIGURE 5Prelim ina ry Delinea tion Ma p
Exp os ed Sip hon
Delineation of Waters of the U.S.Mill Creek Fish Passage Restoration Project
SCALE
CLIENT
(11” X 17” p a p er)
3950 Industria l Blvd, Ste 100cWest Sa cra m ento, CA 95691INSET MAP "A"INSET MAP "A"
Culvert (24")
D1
RW
RW
RW
RW
D2
D3
PS 1
DELINEATION/GPS SURVEYJeff SouzaBen Myhre
Teha m a Environm enta l Solutions , Inc.&
John DittesDittes & Gua rdino Cons ulting
LegendStudy AreaPerennia l Strea mRip a ria n Wetla ndDitchCulvert
MC siphon map table.pdf (Command Line) MC siphon map table.pdf
® 1 in = 100 ft
Page 15
0 100 200Feet
Ma rch 2015Teha m a County, Ca lifornia
NOTE: DELINEATION SHOULD BE CONSIDERED PRELIMINARY UNTIL VERIFIED BY THE U.S. ARMY CORPS OF ENGINEERS. PHOTO SOURCE: Google Earth, August, 2013
FIGURE 6Prelim ina ry Delinea tion Ma p
Wa rd Da m
Delineation of Waters of the U.S.Mill Creek Fish Passage Restoration Project
SCALE
CLIENT
(11” X 17” p a p er)
3950 Industria l Blvd, Ste 100cWest Sa cra m ento, CA 95691INSET MAP "A"INSET MAP "A"
RW
D1
Bridge
Culve
rt 16"
PS 1
DELINEATION/GPS SURVEYJeff SouzaBen Myhre
Teha m a Environm enta l Solutions , Inc.&
John DittesDittes & Gua rdino Cons ulting
LegendStudy AreaPerennia l Strea mRip a ria n Wetla ndBridgeDitchCulvert
® 1 in = 200 ft
Page 16
0 200 400Feet
March 2015Teham a County, California
NOTE: DELINEATION SHOULD BE CONSIDERED PRELIMINARY UNTIL VERIFIED BY THE U.S. ARMY CORPS OF ENGINEERS. PHOTO SOURCE: Google Earth, August, 2013
FIGURE 7Prelim inary Delineation Map
Upper Dam
Delineation of Waters of the U.S.Mill Creek Fish Passage Restoration Project
SCALE
CLIENT
(11” X 17” paper)
3950 Ind ustrial Blvd, S te 100cWest S ac ram ento, CA 95691INSET MAP "A"INSET MAP "A"
MATCH LINE
MATCH LINE
DVP 6
VP 25
VP 26
ES 5
ES 6
ES 8
ES 7
D5
DP 1DP 2
DES 3DES 4
DELINEATION/GPS SURVEYJeff S ouzaBen Myhre
Teham a Environm ental S olutions, Inc.&
John DittesDittes & Guard ino Consulting
LegendS tud y AreaPerennial S treamRiparian WetlandWet Mead owVernal S w aleVernal PoolEphem eral S treamDisturbed Vernal S waleDisturbed Vernal PoolDisturbed Ephem eral S treamBrid g eDitch
!. Data Points
® 1 in = 200 ft
Page 17
0 200 400Feet
March 2015Teham a County, California
NOTE: DELINEATION SHOULD BE CONSIDERED PRELIMINARY UNTIL VERIFIED BY THE U.S. ARMY CORPS OF ENGINEERS. PHOTO SOURCE: Google Earth, August, 2013
FIGURE 8Prelim inary Delineation Map
Upper Dam
Delineation of Waters of the U.S.Mill Creek Fish Passage Restoration Project
SCALE
CLIENT
(11” X 17” paper)
3950 Ind ustrial Blvd, S te 100cWest S ac ram ento, CA 95691INSET MAP "A"INSET MAP "A"
MATCH LINE
MATCH LINE
MATCH LINE
MATCH LINE
VP 22
VP 23
VP 21
VP 24VP 25
ES 5
ES 3ES 4
DES 2
VS 20
VS 19
VS 18
VS 17
DP 1DP 2
DELINEATION/GPS SURVEYJeff S ouzaBen Myhre
Teham a Environm ental S olutions, Inc.&
John DittesDittes & Guard ino Consulting
LegendS tud y AreaPerennial S treamRiparian WetlandWet Mead owVernal S waleVernal PoolEphem eral S treamDisturbed Vernal S waleDisturbed Vernal PoolDisturbed Ephem eral S treamBrid g eDitch
!. Data Points
® 1 in = 200 ft
Page 18
0 200 400Feet
March 2015Teham a County, California
NOTE: DELINEATION SHOULD BE CONSIDERED PRELIMINARY UNTIL VERIFIED BY THE U.S. ARMY CORPS OF ENGINEERS. PHOTO SOURCE: Google Earth, August, 2013
FIGURE 9Prelim inary Delineation Map
Upper Dam
Delineation of Waters of the U.S.Mill Creek Fish Passage Restoration Project
SCALE
CLIENT
(11” X 17” paper)
3950 Ind ustrial Blvd, S te 100cWest S ac ram ento, CA 95691INSET MAP "A"INSET MAP "A"
!.!.
MATCH LINE
MATCH LINE
MATCH LINE
MATCH LINE
DVP 3DVP 4
DVP 5
VP 15VP 16
VP 17
VP 19VP 20
VP 12VP 13VP 14
VP 18
D3
D4
DVS 3DVS 4
DVS 5VS 13
VS 7
VS 12
VS 14
VS 15VS 16
VS 3
VS 4
VS 5
VS 6
VS 8VS 9VS 10VS 11
VS 17
WM 1
Bridge
DP 3DP 4
DELINEATION/GPS SURVEYJeff S ouzaBen Myhre
Teham a Environm ental S olutions, Inc.&
John DittesDittes & Guard ino Consulting
LegendS tud y AreaPerennial S treamRiparian WetlandWet Mead owVernal S w aleVernal PoolEphem eral S treamDisturbed Vernal S w aleDisturbed Vernal PoolDisturbed Ephem eral S treamBrid g eDitch
!. Data Points
® 1 in = 200 ft
Page 19
0 200 400Feet
March 2015Teham a County, California
NOTE: DELINEATION SHOULD BE CONSIDERED PRELIMINARY UNTIL VERIFIED BY THE U.S. ARMY CORPS OF ENGINEERS. PHOTO SOURCE: Google Earth, August, 2013
FIGURE 10Prelim inary Delineation Map
Upper Dam
Delineation of Waters of the U.S.Mill Creek Fish Passage Restoration Project
SCALE
CLIENT
(11” X 17” paper)
3950 Ind ustrial Blvd, S te 100cWest S ac ram ento, CA 95691INSET MAP "A"INSET MAP "A"
MATCH LINE
MATCH LINE
MATCH LINE
MATCH LINE
RW
DVP 2VP 2
VP 3VP 4VP 5VP 7VP 8VP 9 VP 6
VP 10
VP 11
VP 2
ES 2
D2
DES 1
DVS 3
DVS 1
DVS 2
VS 2
VS 1
VS 3
DELINEATION/GPS SURVEYJeff S ouzaBen Myhre
Teham a Environm ental S olutions, Inc.&
John DittesDittes & Guard ino Consulting
LegendS tud y AreaPerennial S treamRiparian WetlandWet Mead owVernal S waleVernal PoolEphem eral S treamDisturbed Vernal S waleDisturbed Vernal PoolDisturbed Ephem eral S treamBrid g eDitch
!. Data Points
® 1 in = 200 ft
Page 20
0 200 400Feet
March 2015Teham a County, California
NOTE: DELINEATION SHOULD BE CONSIDERED PRELIMINARY UNTIL VERIFIED BY THE U.S. ARMY CORPS OF ENGINEERS. PHOTO SOURCE: Google Earth, August, 2013
FIGURE 11Prelim inary Delineation Map
Upper Dam
Delineation of Waters of the U.S.Mill Creek Fish Passage Restoration Project
SCALE
CLIENT
(11” X 17” paper)
3950 Ind ustrial Blvd, S te 100cWest S ac ram ento, CA 95691INSET MAP "A"INSET MAP "A"
MATCH LINE
MATCH LINE
DVP 1
VP 1ES 1
PS 1
D1RW
DELINEATION/GPS SURVEYJeff S ouzaBen Myhre
Teham a Environm ental S olutions, Inc.&
John DittesDittes & Guard ino Consulting
LegendS tud y AreaPerennial S treamRiparian WetlandWet Mead owVernal S waleVernal PoolEphem eral S treamDisturbed Vernal S waleDisturbed Vernal PoolDisturbed Ephem eral S treamBrid g eDitch
!. Data Points
Delineation of Waters of the U.S. Tehama Environmental Solutions, Inc. Mill Creek Fish Passage Restoration Project
Page 21
REFERENCES Environmental Laboratory. 1987. Corps of Engineers Wetlands Delineation Manual. Technical Report
Y-87-1, U.S. Army Corps of Engineers Waterways Experiment Station, Vicksburg, Mississippi. Fiedler, P.L. 1996. Common Wetland Plants of Central California. U.S. Army Corps of Engineers,
Sacramento District. Mayer, K.E. and W.F. Laudenslayer, Jr., Editors. 1988. A Guide to Wildlife Habitats of California.
California Department of Forestry and Fire Protection, Sacramento, California. Lichvar, R.W. 2013. The National Wetland Plant List: 2013 Wetland Ratings. Phytoneuron 2013-49: 1-
241. U.S. Army Corps of Engineers, U.S. Army Engineer Research and Development Center, Cold Regions Research and Engineering Laboratory, Hanover, New Hampshire.
Lichvar, R.W. and S.M. McColley. 2008. A Field Guide to the Identification of the Ordinary High Water Mark (OHWM) in the Arid West Region of the Western United States. U.S. Army Corps of Engineers, U.S. Army Engineer Research and Development Center, Cold Regions Research and Engineering Laboratory, Hanover, New Hampshire.
Munsell Color. 2000. Munsell Soil Color Charts. Grand Rapids, Michigan.
U.S. Army Corps of Engineers. 2001. Minimum Standards for Acceptance of Preliminary Wetland Delineations. Regulatory Branch, Sacramento District.
U.S. Army Corps of Engineers. 2005. Ordinary High Water Mark Identification. Regulatory Guidance
Letter No. 05-05. December 7, 2005. U.S. Army Corps of Engineers and Environmental Protection Agency. 2007. U.S. Army Corps of
Engineers Jurisdictional Determination Form Instructional Guidebook. U.S. Army Corps of Engineers and Environmental Protection Agency. 2008. Clean Water Act
Jurisdiction Following the U.S. Supreme Court’s Decision in Rapanos v. United States & Carabell v. United States. Memorandum dated December 2, 2008.
U.S. Army Corps of Engineers. 2008. Regional Supplement to the Corps of Engineers Wetlands
Delineation Manual: Arid West Region (Version 2.0). ERDC/EL TR-08-28. U.S. Army Engineer Research and Development Center, Vicksburg, Mississippi.
U.S. Department of Agriculture, Soil Conservation Service and Forest Service in cooperation with
University of California Agricultural Experiment Station. 1967. Soil Survey Tehama County California. U.S. Government Printing Office, Washington D.C.
U.S. Department of Agriculture - Natural Resources Conservation Service. 2001. Hydric Soils List.
Tehama County NRCS Field Office, Red Bluff, California. U.S. Department of Agriculture - Natural Resources Conservation Service. 1995. Hydric Soils of
California. Revised December 15, 1995. University of California Davis Soil Resource Laboratory Lab. 2015. California Soil Resource Lab. 2015
Website. http://casoilresource.lawr.ucdavis.edu/. Accessed January 2015.

Delineation of Waters of the U.S. Tehama Environmental Solutions, Inc. Mill Creek Fish Passage Restoration Project
Page 22
U.S. Department of Agriculture - Natural Resources Conservation Service. 2015. Web Soil Survey
Website. http://websoilsurvey.nrcs.usda.gov/app/WebSoilSurvey.aspx. Accessed January 2014. U.S. Department of Agriculture - Natural Resources Conservation Service. 2014. Official Soil Series
Descriptions (OSDs) Website. http://www.nrcs.usda.gov/wps/portal/nrcs/detailfull/soils/home/. Accessed January 2015.
APPENDIX A
Routine Wetland Delineation Forms
WETLAND DETERMINATION DATA FORM – Arid West Region
VEGETATION – Use scientific names of plants.
Tree Stratum (Plot size: ) Absolute % Cover
Dominant Species?
Indicator Status
Dominance Test Worksheet:
1. Number of Dominant Species That Are OBL, FACW, or FAC:
3 (A) 2.
3. Total Number of Dominant Species Across All Strata:
3 (B) 4.
50% = , 20% = 0 = Total Cover Percent of Dominant Species That Are OBL, FACW, or FAC:
100 (A/B) Sapling/Shrub Stratum (Plot size: )
1. Prevalence Index worksheet:
2. Total % Cover of : Multiply by:
3. OBL species 36 x1 = 36
4. FACW species 7 x2 = 14
5. FAC species 15 x3 = 45
50% = , 20% = 0 = Total Cover FACU species x4 =
Herb Stratum (Plot size:0.5 m²) UPL species x5 =
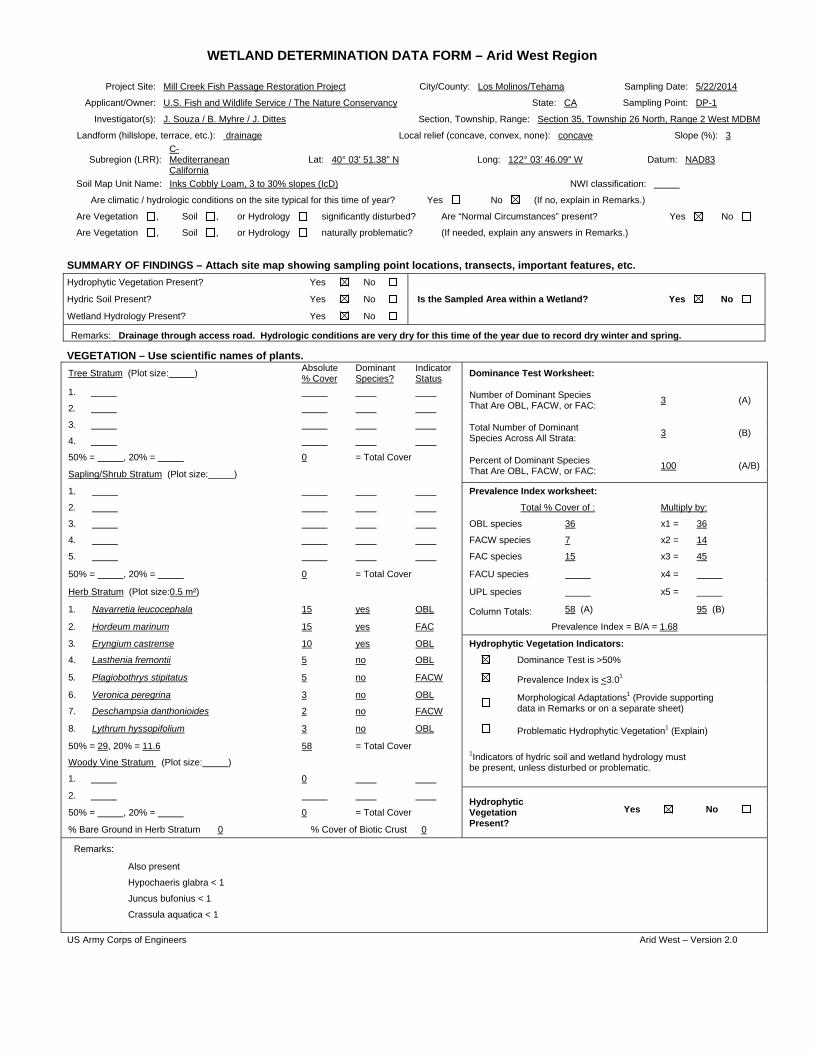
1. Navarretia leucocephala 15 yes OBL Column Totals: 58 (A) 95 (B)
2. Hordeum marinum 15 yes FAC Prevalence Index = B/A = 1.68
3. Eryngium castrense 10 yes OBL Hydrophytic Vegetation Indicators:
4. Lasthenia fremontii 5 no OBL Dominance Test is >50%
5. Plagiobothrys stipitatus 5 no FACW Prevalence Index is <3.01
6. Veronica peregrina 3 no OBL
Morphological Adaptations1 (Provide supporting data in Remarks or on a separate sheet) 7. Deschampsia danthonioides 2 no FACW
8. Lythrum hyssopifolium 3 no OBL Problematic Hydrophytic Vegetation1 (Explain)
50% = 29, 20% = 11.6 58 = Total Cover 1Indicators of hydric soil and wetland hydrology must be present, unless disturbed or problematic.
Woody Vine Stratum (Plot size: )
1. 0
2. Hydrophytic Vegetation Present?
Yes No 50% = , 20% = 0 = Total Cover
% Bare Ground in Herb Stratum 0 % Cover of Biotic Crust 0
Remarks:
Also present
Hypochaeris glabra < 1
Juncus bufonius < 1
Crassula aquatica < 1
US Army Corps of Engineers Arid West – Version 2.0
Project Site: Mill Creek Fish Passage Restoration Project City/County: Los Molinos/Tehama Sampling Date: 5/22/2014
Applicant/Owner: U.S. Fish and Wildlife Service / The Nature Conservancy State: CA Sampling Point: DP-1
Investigator(s): J. Souza / B. Myhre / J. Dittes Section, Township, Range: Section 35, Township 26 North, Range 2 West MDBM
Landform (hillslope, terrace, etc.): drainage Local relief (concave, convex, none): concave Slope (%): 3
Subregion (LRR): C-Mediterranean California
Lat: 40° 03' 51.38" N Long: 122° 03' 46.09" W Datum: NAD83
Soil Map Unit Name: Inks Cobbly Loam, 3 to 30% slopes (IcD) NWI classification:
Are climatic / hydrologic conditions on the site typical for this time of year? Yes No (If no, explain in Remarks.)
Are Vegetation , Soil , or Hydrology significantly disturbed? Are “Normal Circumstances” present? Yes No
Are Vegetation , Soil , or Hydrology naturally problematic? (If needed, explain any answers in Remarks.)
SUMMARY OF FINDINGS – Attach site map showing sampling point locations, transects, important features, etc.
Hydrophytic Vegetation Present? Yes No
Is the Sampled Area within a Wetland? Yes No Hydric Soil Present? Yes No
Wetland Hydrology Present? Yes No
Remarks: Drainage through access road. Hydrologic conditions are very dry for this time of the year due to record dry winter and spring.

SOIL Sampling Point: DP-1
Profile Description: (Describe to the depth needed to document the indicator or confirm the absence of indicators.)
Depth Matrix Redox Features
(inches) Color (moist) % Color (Moist) % Type1 Loc2 Texture Remarks
0 -1 7.5YR 2.5/3 90 5YR 4/4 10 C PL clay loam granular structure, many fine roots
1- 4 10YR 3/4 100 clay loam sub angular structure
4 - 12 5YR 3/3 100 sandy clay massive structure, manganese con.
12 - 17 10YR 3/3 100 sandy clay massive structure, manganese con.
1Type: C= Concentration, D=Depletion, RM=Reduced Matrix, CS=Covered or Coated Sand Grains. 2Location: PL=Pore Lining, M=Matrix.
Hydric Soil Indicators: (Applicable to all LRRs, unless otherwise noted.) Indicators for Problematic Hydric Soils3:
Histosol (A1) Sandy Redox (S5) 1 cm Muck (A9) (LRR C)
Histic Epipedon (A2) Stripped Matrix (S6) 2 cm Muck (A10) (LRR B)
Black Histic (A3) Loamy Mucky Mineral (F1) Reduced Vertic (F18)
Hydrogen Sulfide (A4) Loamy Gleyed Matrix (F2) Red Parent Material (TF2)
Stratified Layers (A5) (LRR C) Depleted Matrix (F3) Other (Explain in Remarks)
1 cm Muck (A9) (LRR D) Redox Dark Surface (F6)
3Indicators of hydrophytic vegetation and
wetland hydrology must be present,
unless disturbed or problematic.
Depleted Below Dark Surface (A11) Depleted Dark Surface (F7)
Thick Dark Surface (A12) Redox Depressions (F8)
Sandy Mucky Mineral (S1) Vernal Pools (F9)
Sandy Gleyed Matrix (S4)
Restrictive Layer (if present):
Hydric Soils Present? Yes No
Type: Clay hardpan
Depth (Inches): 17
Remarks: Some cobble throughout soil pit
HYDROLOGY Wetland Hydrology Indicators:
Primary Indicators (minimum of one required; check all that apply) Secondary Indicators (2 or more required)
Surface Water (A1) Salt Crust (B11) Water Marks (B1) (Riverine)
High Water Table (A2) Biotic Crust (B12) Sediment Deposits (B2) (Riverine)
Saturation (A3) Aquatic Invertebrates (B13) Drift Deposits (B3) (Riverine)
Water Marks (B1) (Nonriverine) Hydrogen Sulfide Odor (C1) Drainage Patterns (B10)
Sediment Deposits (B2) (Nonriverine) Oxidized Rhizospheres along Living Roots (C3) Dry-Season Water Table (C2)
Drift Deposits (B3) (Nonriverine) Presence of Reduced Iron (C4) Crayfish Burrows (C8)
Surface Soil Cracks (B6) Recent Iron Reduction in Tilled Soils (C6) Saturation Visible on Aerial Imagery (C9)
Inundation Visible on Aerial Imagery (B7) Thin Muck Surface (C7) Shallow Aquitard (D3)
Water-Stained Leaves (B9) Other (Explain in Remarks) FAC-Neutral Test (D5)
Field Observations:
Surface Water Present? Yes No Depth (inches): Wetland Hydrology Present?
Yes
No
Water Table Present? Yes No Depth (inches):
Saturation Present? (includes capillary fringe)
Yes No Depth (inches):
Describe Recorded Data (stream gauge, monitoring well, aerial photos, previous inspections), if available:
Remarks: Hydrologic conditions are very dry for this time of the year due to record dry winter and spring. US Army Corps of Engineers Arid West – Version 2.0
Project Site: Mill Creek Fish Passage Assessment Project
WETLAND DETERMINATION DATA FORM – Arid West Region
VEGETATION – Use scientific names of plants.
Tree Stratum (Plot size: ) Absolute % Cover
Dominant Species?
Indicator Status
Dominance Test Worksheet:
1. Number of Dominant Species That Are OBL, FACW, or FAC:
2 (A) 2.
3. Total Number of Dominant Species Across All Strata:
3 (B) 4.
50% = , 20% = 0 = Total Cover Percent of Dominant Species That Are OBL, FACW, or FAC:
0 (A/B) Sapling/Shrub Stratum (Plot size: )
1. Prevalence Index worksheet:
2. Total % Cover of : Multiply by:
3. OBL species 1 x1 = 1
4. FACW species 6 x2 = 12
5. FAC species 40 x3 = 120
50% = , 20% = 0 = Total Cover FACU species 25 x4 = 100
Herb Stratum (Plot size:0.5 m²) UPL species 3 x5 = 15
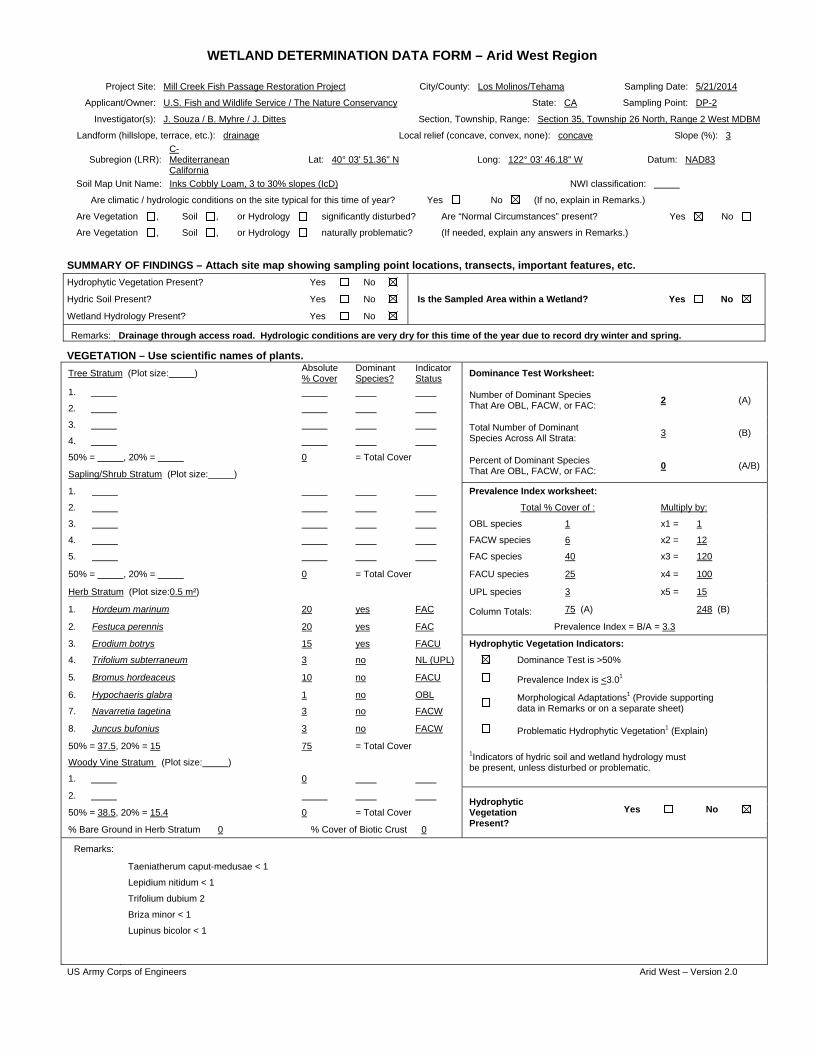
1. Hordeum marinum 20 yes FAC Column Totals: 75 (A) 248 (B)
2. Festuca perennis 20 yes FAC Prevalence Index = B/A = 3.3
3. Erodium botrys 15 yes FACU Hydrophytic Vegetation Indicators:
4. Trifolium subterraneum 3 no NL (UPL) Dominance Test is >50%
5. Bromus hordeaceus 10 no FACU Prevalence Index is <3.01
6. Hypochaeris glabra 1 no OBL
Morphological Adaptations1 (Provide supporting data in Remarks or on a separate sheet) 7. Navarretia tagetina 3 no FACW
8. Juncus bufonius 3 no FACW Problematic Hydrophytic Vegetation1 (Explain)
50% = 37.5, 20% = 15 75 = Total Cover 1Indicators of hydric soil and wetland hydrology must be present, unless disturbed or problematic.
Woody Vine Stratum (Plot size: )
1. 0
2. Hydrophytic Vegetation Present?
Yes No 50% = 38.5, 20% = 15.4 0 = Total Cover
% Bare Ground in Herb Stratum 0 % Cover of Biotic Crust 0
Remarks:
Taeniatherum caput-medusae < 1
Lepidium nitidum < 1
Trifolium dubium 2
Briza minor < 1
Lupinus bicolor < 1
US Army Corps of Engineers Arid West – Version 2.0
Project Site: Mill Creek Fish Passage Restoration Project City/County: Los Molinos/Tehama Sampling Date: 5/21/2014
Applicant/Owner: U.S. Fish and Wildlife Service / The Nature Conservancy State: CA Sampling Point: DP-2
Investigator(s): J. Souza / B. Myhre / J. Dittes Section, Township, Range: Section 35, Township 26 North, Range 2 West MDBM
Landform (hillslope, terrace, etc.): drainage Local relief (concave, convex, none): concave Slope (%): 3
Subregion (LRR): C-Mediterranean California
Lat: 40° 03' 51.36" N Long: 122° 03' 46.18" W Datum: NAD83
Soil Map Unit Name: Inks Cobbly Loam, 3 to 30% slopes (IcD) NWI classification:
Are climatic / hydrologic conditions on the site typical for this time of year? Yes No (If no, explain in Remarks.)
Are Vegetation , Soil , or Hydrology significantly disturbed? Are “Normal Circumstances” present? Yes No
Are Vegetation , Soil , or Hydrology naturally problematic? (If needed, explain any answers in Remarks.)
SUMMARY OF FINDINGS – Attach site map showing sampling point locations, transects, important features, etc.
Hydrophytic Vegetation Present? Yes No
Is the Sampled Area within a Wetland? Yes No Hydric Soil Present? Yes No
Wetland Hydrology Present? Yes No
Remarks: Drainage through access road. Hydrologic conditions are very dry for this time of the year due to record dry winter and spring.
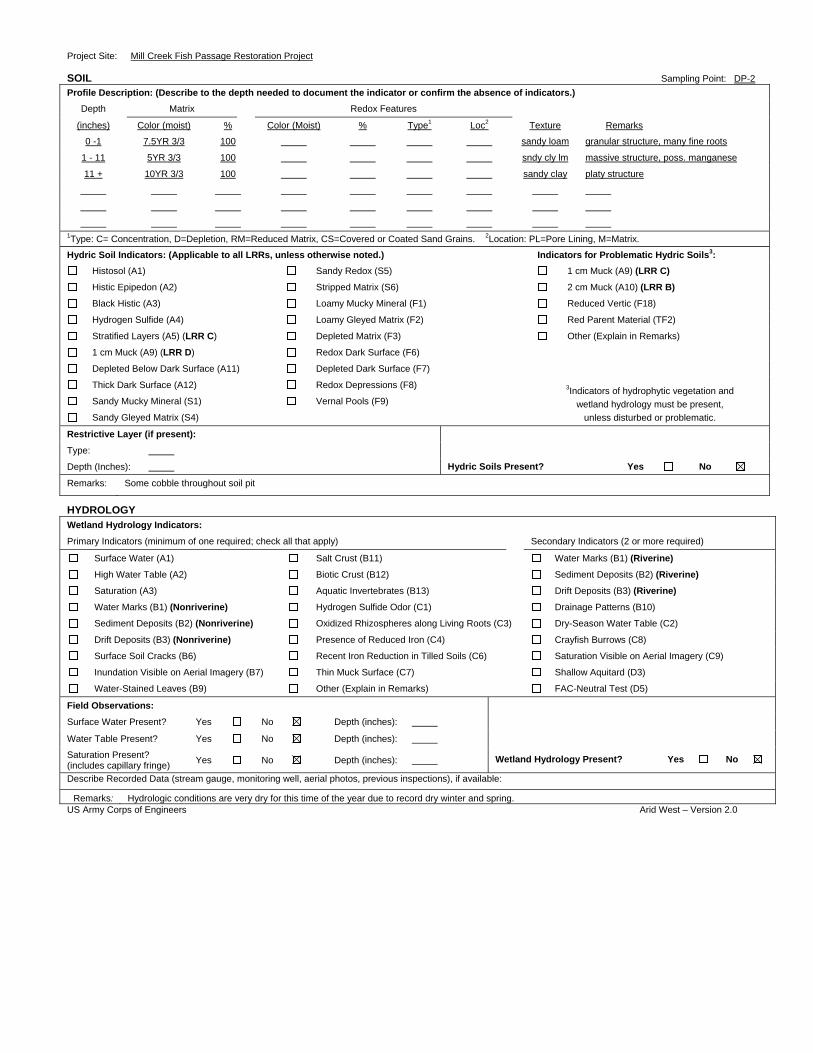
SOIL Sampling Point: DP-2
Profile Description: (Describe to the depth needed to document the indicator or confirm the absence of indicators.)
Depth Matrix Redox Features
(inches) Color (moist) % Color (Moist) % Type1 Loc2 Texture Remarks
0 -1 7.5YR 3/3 100 sandy loam granular structure, many fine roots
1 - 11 5YR 3/3 100 sndy cly lm massive structure, poss. manganese
11 + 10YR 3/3 100 sandy clay platy structure
1Type: C= Concentration, D=Depletion, RM=Reduced Matrix, CS=Covered or Coated Sand Grains. 2Location: PL=Pore Lining, M=Matrix.
Hydric Soil Indicators: (Applicable to all LRRs, unless otherwise noted.) Indicators for Problematic Hydric Soils3:
Histosol (A1) Sandy Redox (S5) 1 cm Muck (A9) (LRR C)
Histic Epipedon (A2) Stripped Matrix (S6) 2 cm Muck (A10) (LRR B)
Black Histic (A3) Loamy Mucky Mineral (F1) Reduced Vertic (F18)
Hydrogen Sulfide (A4) Loamy Gleyed Matrix (F2) Red Parent Material (TF2)
Stratified Layers (A5) (LRR C) Depleted Matrix (F3) Other (Explain in Remarks)
1 cm Muck (A9) (LRR D) Redox Dark Surface (F6)
3Indicators of hydrophytic vegetation and
wetland hydrology must be present,
unless disturbed or problematic.
Depleted Below Dark Surface (A11) Depleted Dark Surface (F7)
Thick Dark Surface (A12) Redox Depressions (F8)
Sandy Mucky Mineral (S1) Vernal Pools (F9)
Sandy Gleyed Matrix (S4)
Restrictive Layer (if present):
Hydric Soils Present? Yes No
Type:
Depth (Inches):
Remarks: Some cobble throughout soil pit
HYDROLOGY Wetland Hydrology Indicators:
Primary Indicators (minimum of one required; check all that apply) Secondary Indicators (2 or more required)
Surface Water (A1) Salt Crust (B11) Water Marks (B1) (Riverine)
High Water Table (A2) Biotic Crust (B12) Sediment Deposits (B2) (Riverine)
Saturation (A3) Aquatic Invertebrates (B13) Drift Deposits (B3) (Riverine)
Water Marks (B1) (Nonriverine) Hydrogen Sulfide Odor (C1) Drainage Patterns (B10)
Sediment Deposits (B2) (Nonriverine) Oxidized Rhizospheres along Living Roots (C3) Dry-Season Water Table (C2)
Drift Deposits (B3) (Nonriverine) Presence of Reduced Iron (C4) Crayfish Burrows (C8)
Surface Soil Cracks (B6) Recent Iron Reduction in Tilled Soils (C6) Saturation Visible on Aerial Imagery (C9)
Inundation Visible on Aerial Imagery (B7) Thin Muck Surface (C7) Shallow Aquitard (D3)
Water-Stained Leaves (B9) Other (Explain in Remarks) FAC-Neutral Test (D5)
Field Observations:
Surface Water Present? Yes No Depth (inches): Wetland Hydrology Present?
Yes
No
Water Table Present? Yes No Depth (inches):
Saturation Present? (includes capillary fringe)
Yes No Depth (inches):
Describe Recorded Data (stream gauge, monitoring well, aerial photos, previous inspections), if available:
Remarks: Hydrologic conditions are very dry for this time of the year due to record dry winter and spring. US Army Corps of Engineers Arid West – Version 2.0
Project Site: Mill Creek Fish Passage Restoration Project
WETLAND DETERMINATION DATA FORM – Arid West Region
VEGETATION – Use scientific names of plants.
Tree Stratum (Plot size: ) Absolute % Cover
Dominant Species?
Indicator Status
Dominance Test Worksheet:
1. Number of Dominant Species That Are OBL, FACW, or FAC:
4 (A) 2.
3. Total Number of Dominant Species Across All Strata:
4 (B) 4.
50% = , 20% = = Total Cover Percent of Dominant Species That Are OBL, FACW, or FAC:
100 (A/B) Sapling/Shrub Stratum (Plot size: )
1. Prevalence Index worksheet:
2. Total % Cover of : Multiply by:
3. OBL species 20 x1 = 20
4. FACW species 56 x2 = 112
5. FAC species 22 x3 = 66
50% = , 20% = = Total Cover FACU species 0 x4 = 0
Herb Stratum (Plot size:0.5 m²) UPL species 1 x5 = 5
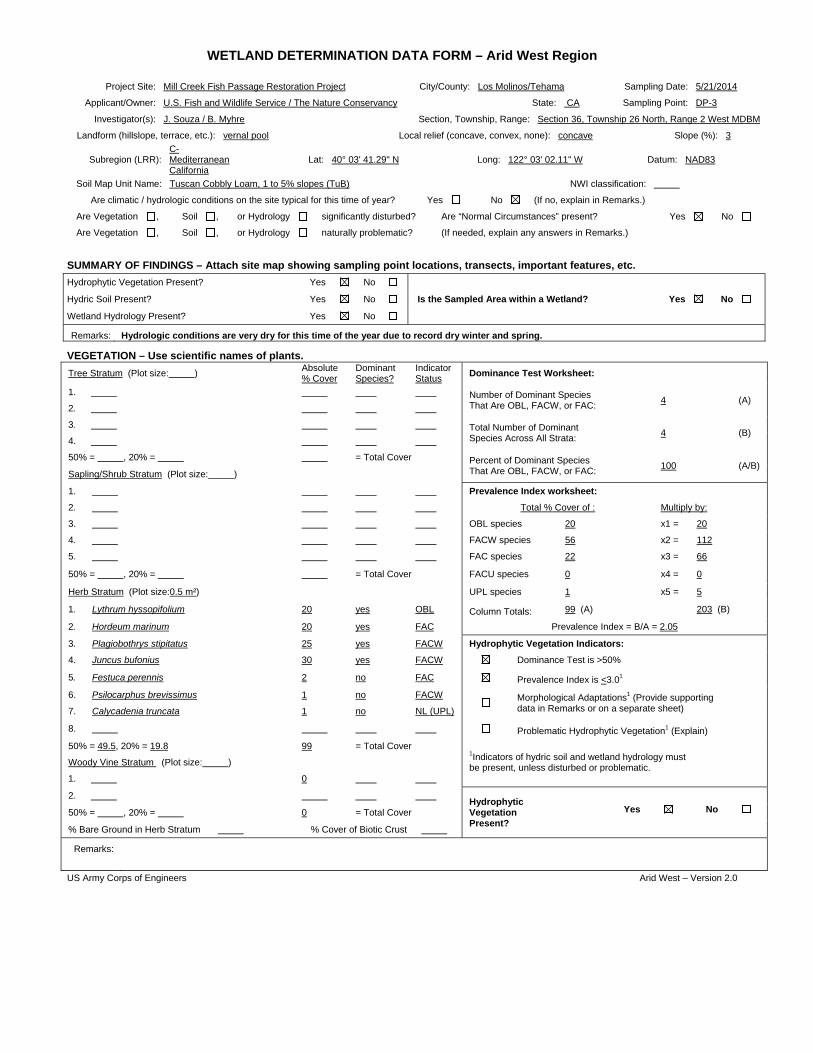
1. Lythrum hyssopifolium 20 yes OBL Column Totals: 99 (A) 203 (B)
2. Hordeum marinum 20 yes FAC Prevalence Index = B/A = 2.05
3. Plagiobothrys stipitatus 25 yes FACW Hydrophytic Vegetation Indicators:
4. Juncus bufonius 30 yes FACW Dominance Test is >50%
5. Festuca perennis 2 no FAC Prevalence Index is <3.01
6. Psilocarphus brevissimus 1 no FACW
Morphological Adaptations1 (Provide supporting data in Remarks or on a separate sheet) 7. Calycadenia truncata 1 no NL (UPL)
8. Problematic Hydrophytic Vegetation1 (Explain)
50% = 49.5, 20% = 19.8 99 = Total Cover 1Indicators of hydric soil and wetland hydrology must be present, unless disturbed or problematic.
Woody Vine Stratum (Plot size: )
1. 0
2. Hydrophytic Vegetation Present?
Yes No 50% = , 20% = 0 = Total Cover
% Bare Ground in Herb Stratum % Cover of Biotic Crust
Remarks:
US Army Corps of Engineers Arid West – Version 2.0
Project Site: Mill Creek Fish Passage Restoration Project City/County: Los Molinos/Tehama Sampling Date: 5/21/2014
Applicant/Owner: U.S. Fish and Wildlife Service / The Nature Conservancy State: CA Sampling Point: DP-3
Investigator(s): J. Souza / B. Myhre Section, Township, Range: Section 36, Township 26 North, Range 2 West MDBM
Landform (hillslope, terrace, etc.): vernal pool Local relief (concave, convex, none): concave Slope (%): 3
Subregion (LRR): C-Mediterranean California
Lat: 40° 03' 41.29" N Long: 122° 03' 02.11" W Datum: NAD83
Soil Map Unit Name: Tuscan Cobbly Loam, 1 to 5% slopes (TuB) NWI classification:
Are climatic / hydrologic conditions on the site typical for this time of year? Yes No (If no, explain in Remarks.)
Are Vegetation , Soil , or Hydrology significantly disturbed? Are “Normal Circumstances” present? Yes No
Are Vegetation , Soil , or Hydrology naturally problematic? (If needed, explain any answers in Remarks.)
SUMMARY OF FINDINGS – Attach site map showing sampling point locations, transects, important features, etc.
Hydrophytic Vegetation Present? Yes No
Is the Sampled Area within a Wetland? Yes No Hydric Soil Present? Yes No
Wetland Hydrology Present? Yes No
Remarks: Hydrologic conditions are very dry for this time of the year due to record dry winter and spring.
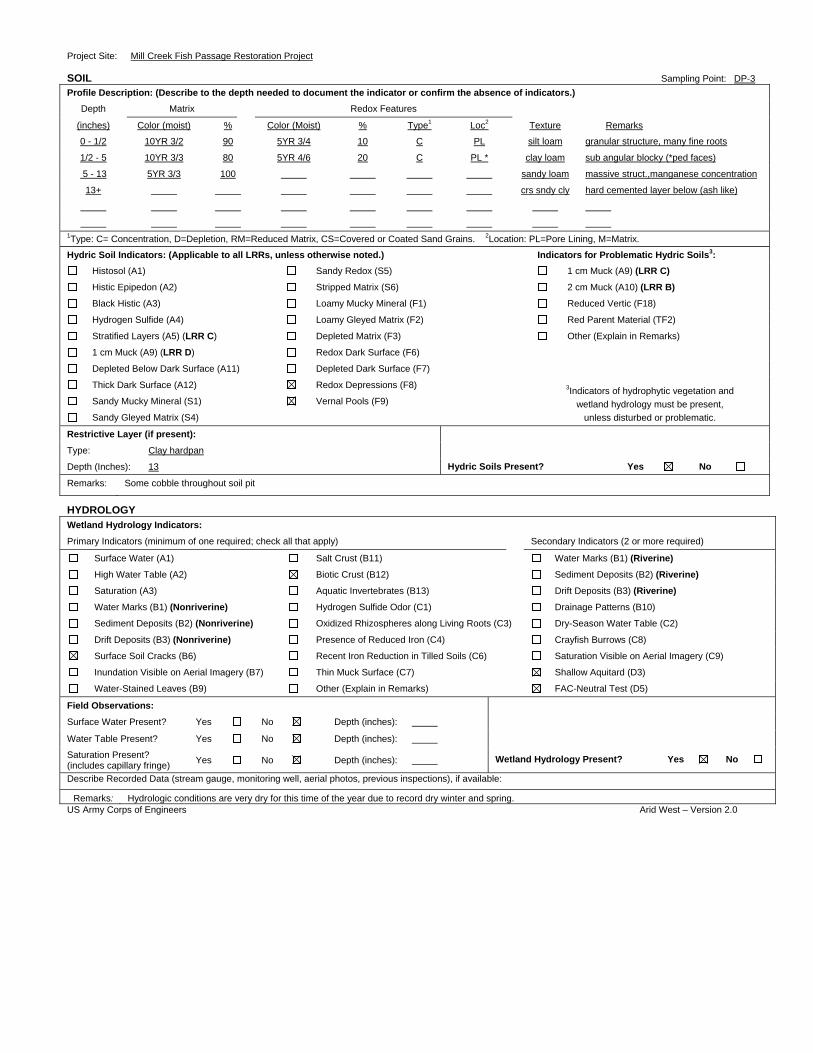
SOIL Sampling Point: DP-3
Profile Description: (Describe to the depth needed to document the indicator or confirm the absence of indicators.)
Depth Matrix Redox Features
(inches) Color (moist) % Color (Moist) % Type1 Loc2 Texture Remarks
0 - 1/2 10YR 3/2 90 5YR 3/4 10 C PL silt loam granular structure, many fine roots
1/2 - 5 10YR 3/3 80 5YR 4/6 20 C PL * clay loam sub angular blocky (*ped faces)
5 - 13 5YR 3/3 100 sandy loam massive struct.,manganese concentration
13+ crs sndy cly hard cemented layer below (ash like)
1Type: C= Concentration, D=Depletion, RM=Reduced Matrix, CS=Covered or Coated Sand Grains. 2Location: PL=Pore Lining, M=Matrix.
Hydric Soil Indicators: (Applicable to all LRRs, unless otherwise noted.) Indicators for Problematic Hydric Soils3:
Histosol (A1) Sandy Redox (S5) 1 cm Muck (A9) (LRR C)
Histic Epipedon (A2) Stripped Matrix (S6) 2 cm Muck (A10) (LRR B)
Black Histic (A3) Loamy Mucky Mineral (F1) Reduced Vertic (F18)
Hydrogen Sulfide (A4) Loamy Gleyed Matrix (F2) Red Parent Material (TF2)
Stratified Layers (A5) (LRR C) Depleted Matrix (F3) Other (Explain in Remarks)
1 cm Muck (A9) (LRR D) Redox Dark Surface (F6)
3Indicators of hydrophytic vegetation and
wetland hydrology must be present,
unless disturbed or problematic.
Depleted Below Dark Surface (A11) Depleted Dark Surface (F7)
Thick Dark Surface (A12) Redox Depressions (F8)
Sandy Mucky Mineral (S1) Vernal Pools (F9)
Sandy Gleyed Matrix (S4)
Restrictive Layer (if present):
Hydric Soils Present? Yes No
Type: Clay hardpan
Depth (Inches): 13
Remarks: Some cobble throughout soil pit
HYDROLOGY Wetland Hydrology Indicators:
Primary Indicators (minimum of one required; check all that apply) Secondary Indicators (2 or more required)
Surface Water (A1) Salt Crust (B11) Water Marks (B1) (Riverine)
High Water Table (A2) Biotic Crust (B12) Sediment Deposits (B2) (Riverine)
Saturation (A3) Aquatic Invertebrates (B13) Drift Deposits (B3) (Riverine)
Water Marks (B1) (Nonriverine) Hydrogen Sulfide Odor (C1) Drainage Patterns (B10)
Sediment Deposits (B2) (Nonriverine) Oxidized Rhizospheres along Living Roots (C3) Dry-Season Water Table (C2)
Drift Deposits (B3) (Nonriverine) Presence of Reduced Iron (C4) Crayfish Burrows (C8)
Surface Soil Cracks (B6) Recent Iron Reduction in Tilled Soils (C6) Saturation Visible on Aerial Imagery (C9)
Inundation Visible on Aerial Imagery (B7) Thin Muck Surface (C7) Shallow Aquitard (D3)
Water-Stained Leaves (B9) Other (Explain in Remarks) FAC-Neutral Test (D5)
Field Observations:
Surface Water Present? Yes No Depth (inches): Wetland Hydrology Present?
Yes
No
Water Table Present? Yes No Depth (inches):
Saturation Present? (includes capillary fringe)
Yes No Depth (inches):
Describe Recorded Data (stream gauge, monitoring well, aerial photos, previous inspections), if available:
Remarks: Hydrologic conditions are very dry for this time of the year due to record dry winter and spring. US Army Corps of Engineers Arid West – Version 2.0
Project Site: Mill Creek Fish Passage Restoration Project
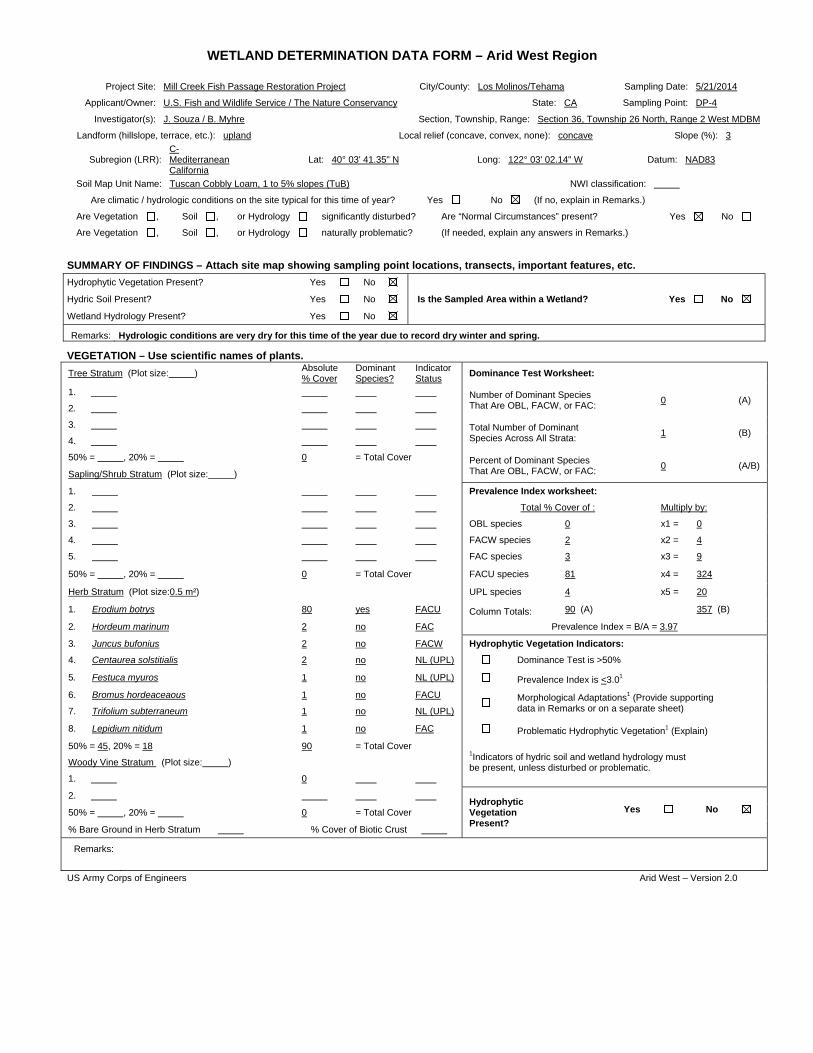
WETLAND DETERMINATION DATA FORM – Arid West Region
VEGETATION – Use scientific names of plants.
Tree Stratum (Plot size: ) Absolute % Cover
Dominant Species?
Indicator Status
Dominance Test Worksheet:
1. Number of Dominant Species That Are OBL, FACW, or FAC:
0 (A) 2.
3. Total Number of Dominant Species Across All Strata:
1 (B) 4.
50% = , 20% = 0 = Total Cover Percent of Dominant Species That Are OBL, FACW, or FAC:
0 (A/B) Sapling/Shrub Stratum (Plot size: )
1. Prevalence Index worksheet:
2. Total % Cover of : Multiply by:
3. OBL species 0 x1 = 0
4. FACW species 2 x2 = 4
5. FAC species 3 x3 = 9
50% = , 20% = 0 = Total Cover FACU species 81 x4 = 324
Herb Stratum (Plot size:0.5 m²) UPL species 4 x5 = 20
1. Erodium botrys 80 yes FACU Column Totals: 90 (A) 357 (B)
2. Hordeum marinum 2 no FAC Prevalence Index = B/A = 3.97
3. Juncus bufonius 2 no FACW Hydrophytic Vegetation Indicators:
4. Centaurea solstitialis 2 no NL (UPL) Dominance Test is >50%
5. Festuca myuros 1 no NL (UPL) Prevalence Index is <3.01
6. Bromus hordeaceaous 1 no FACU
Morphological Adaptations1 (Provide supporting data in Remarks or on a separate sheet) 7. Trifolium subterraneum 1 no NL (UPL)
8. Lepidium nitidum 1 no FAC Problematic Hydrophytic Vegetation1 (Explain)
50% = 45, 20% = 18 90 = Total Cover 1Indicators of hydric soil and wetland hydrology must be present, unless disturbed or problematic.
Woody Vine Stratum (Plot size: )
1. 0
2. Hydrophytic Vegetation Present?
Yes No 50% = , 20% = 0 = Total Cover
% Bare Ground in Herb Stratum % Cover of Biotic Crust
Remarks:
US Army Corps of Engineers Arid West – Version 2.0
Project Site: Mill Creek Fish Passage Restoration Project City/County: Los Molinos/Tehama Sampling Date: 5/21/2014
Applicant/Owner: U.S. Fish and Wildlife Service / The Nature Conservancy State: CA Sampling Point: DP-4
Investigator(s): J. Souza / B. Myhre Section, Township, Range: Section 36, Township 26 North, Range 2 West MDBM
Landform (hillslope, terrace, etc.): upland Local relief (concave, convex, none): concave Slope (%): 3
Subregion (LRR): C-Mediterranean California
Lat: 40° 03' 41.35" N Long: 122° 03' 02.14" W Datum: NAD83
Soil Map Unit Name: Tuscan Cobbly Loam, 1 to 5% slopes (TuB) NWI classification:
Are climatic / hydrologic conditions on the site typical for this time of year? Yes No (If no, explain in Remarks.)
Are Vegetation , Soil , or Hydrology significantly disturbed? Are “Normal Circumstances” present? Yes No
Are Vegetation , Soil , or Hydrology naturally problematic? (If needed, explain any answers in Remarks.)
SUMMARY OF FINDINGS – Attach site map showing sampling point locations, transects, important features, etc.
Hydrophytic Vegetation Present? Yes No
Is the Sampled Area within a Wetland? Yes No Hydric Soil Present? Yes No
Wetland Hydrology Present? Yes No
Remarks: Hydrologic conditions are very dry for this time of the year due to record dry winter and spring.

SOIL Sampling Point: DP-4
Profile Description: (Describe to the depth needed to document the indicator or confirm the absence of indicators.)
Depth Matrix Redox Features
(inches) Color (moist) % Color (Moist) % Type1 Loc2 Texture Remarks
0 -1 7.5YR 2.5/3 100 sandy loam many fine roots, granular structure
1 - 5 5YR 3/3 100 sandy loam massive structure, some manganese
5 -18+ 5YR 3/3 100 sandy clay massive structure
1Type: C= Concentration, D=Depletion, RM=Reduced Matrix, CS=Covered or Coated Sand Grains. 2Location: PL=Pore Lining, M=Matrix.
Hydric Soil Indicators: (Applicable to all LRRs, unless otherwise noted.) Indicators for Problematic Hydric Soils3:
Histosol (A1) Sandy Redox (S5) 1 cm Muck (A9) (LRR C)
Histic Epipedon (A2) Stripped Matrix (S6) 2 cm Muck (A10) (LRR B)
Black Histic (A3) Loamy Mucky Mineral (F1) Reduced Vertic (F18)
Hydrogen Sulfide (A4) Loamy Gleyed Matrix (F2) Red Parent Material (TF2)
Stratified Layers (A5) (LRR C) Depleted Matrix (F3) Other (Explain in Remarks)
1 cm Muck (A9) (LRR D) Redox Dark Surface (F6)
3Indicators of hydrophytic vegetation and
wetland hydrology must be present,
unless disturbed or problematic.
Depleted Below Dark Surface (A11) Depleted Dark Surface (F7)
Thick Dark Surface (A12) Redox Depressions (F8)
Sandy Mucky Mineral (S1) Vernal Pools (F9)
Sandy Gleyed Matrix (S4)
Restrictive Layer (if present):
Hydric Soils Present? Yes No
Type:
Depth (Inches):
Remarks: Some cobble throughout soil pit
HYDROLOGY Wetland Hydrology Indicators:
Primary Indicators (minimum of one required; check all that apply) Secondary Indicators (2 or more required)
Surface Water (A1) Salt Crust (B11) Water Marks (B1) (Riverine)
High Water Table (A2) Biotic Crust (B12) Sediment Deposits (B2) (Riverine)
Saturation (A3) Aquatic Invertebrates (B13) Drift Deposits (B3) (Riverine)
Water Marks (B1) (Nonriverine) Hydrogen Sulfide Odor (C1) Drainage Patterns (B10)
Sediment Deposits (B2) (Nonriverine) Oxidized Rhizospheres along Living Roots (C3) Dry-Season Water Table (C2)
Drift Deposits (B3) (Nonriverine) Presence of Reduced Iron (C4) Crayfish Burrows (C8)
Surface Soil Cracks (B6) Recent Iron Reduction in Tilled Soils (C6) Saturation Visible on Aerial Imagery (C9)
Inundation Visible on Aerial Imagery (B7) Thin Muck Surface (C7) Shallow Aquitard (D3)
Water-Stained Leaves (B9) Other (Explain in Remarks) FAC-Neutral Test (D5)
Field Observations:
Surface Water Present? Yes No Depth (inches): Wetland Hydrology Present?
Yes
No
Water Table Present? Yes No Depth (inches):
Saturation Present? (includes capillary fringe)
Yes No Depth (inches):
Describe Recorded Data (stream gauge, monitoring well, aerial photos, previous inspections), if available:
Remarks: Hydrologic conditions are very dry for this time of the year due to record dry winter and spring. US Army Corps of Engineers Arid West – Version 2.0
Project Site: Mill Creek Fish Passage Restoration Project

APPENDIX B
Site Photos
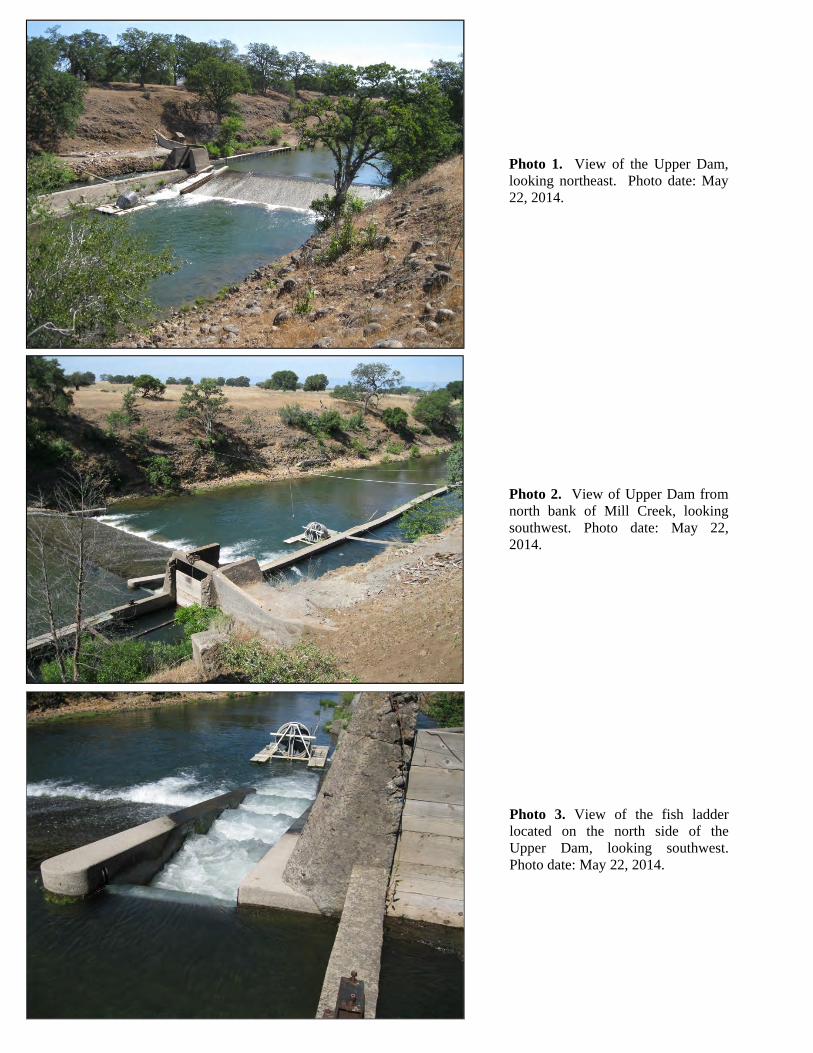
Photo 1. View of the Upper Dam, looking northeast. Photo date: May 22, 2014.
Photo 2. View of Upper Dam from north bank of Mill Creek, looking southwest. Photo date: May 22, 2014.
Photo 3. View of the fish ladder located on the north side of the Upper Dam, looking southwest. Photo date: May 22, 2014.
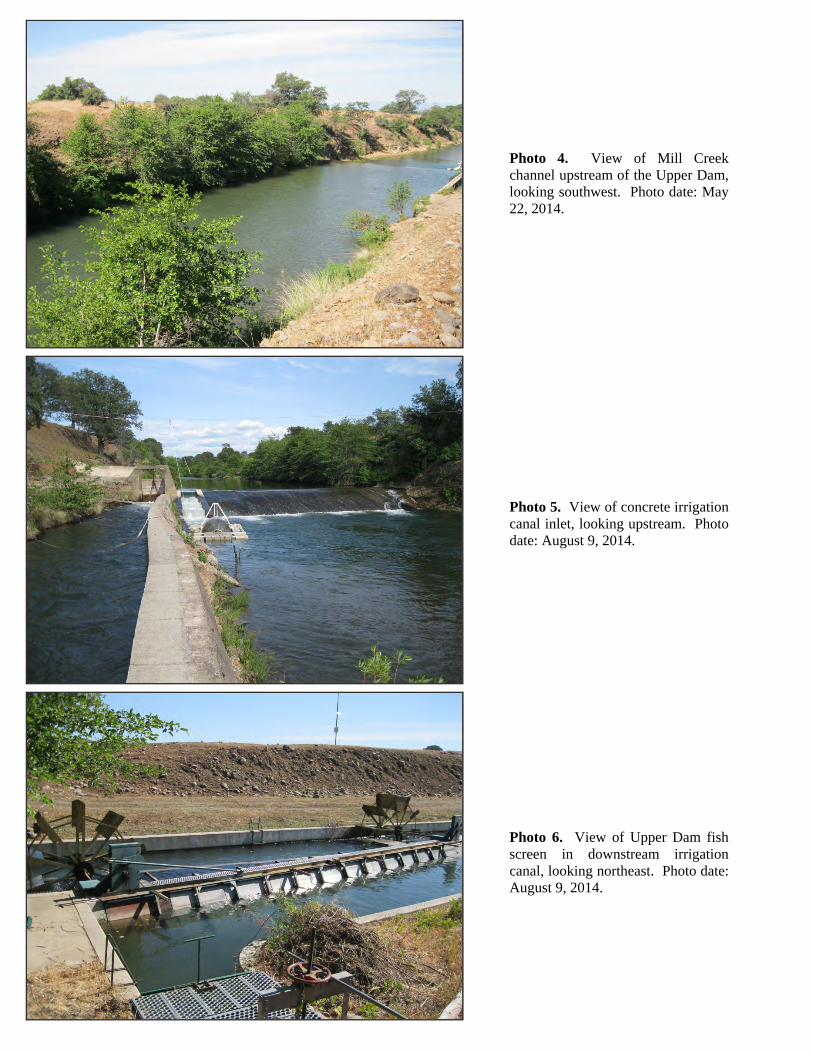
Photo 5. View of concrete irrigation canal inlet, looking upstream. Photo date: August 9, 2014.
Photo 6. View of Upper Dam fish screen in downstream irrigation canal, looking northeast. Photo date: August 9, 2014.
Photo 4. View of Mill Creek channel upstream of the Upper Dam, looking southwest. Photo date: May 22, 2014.
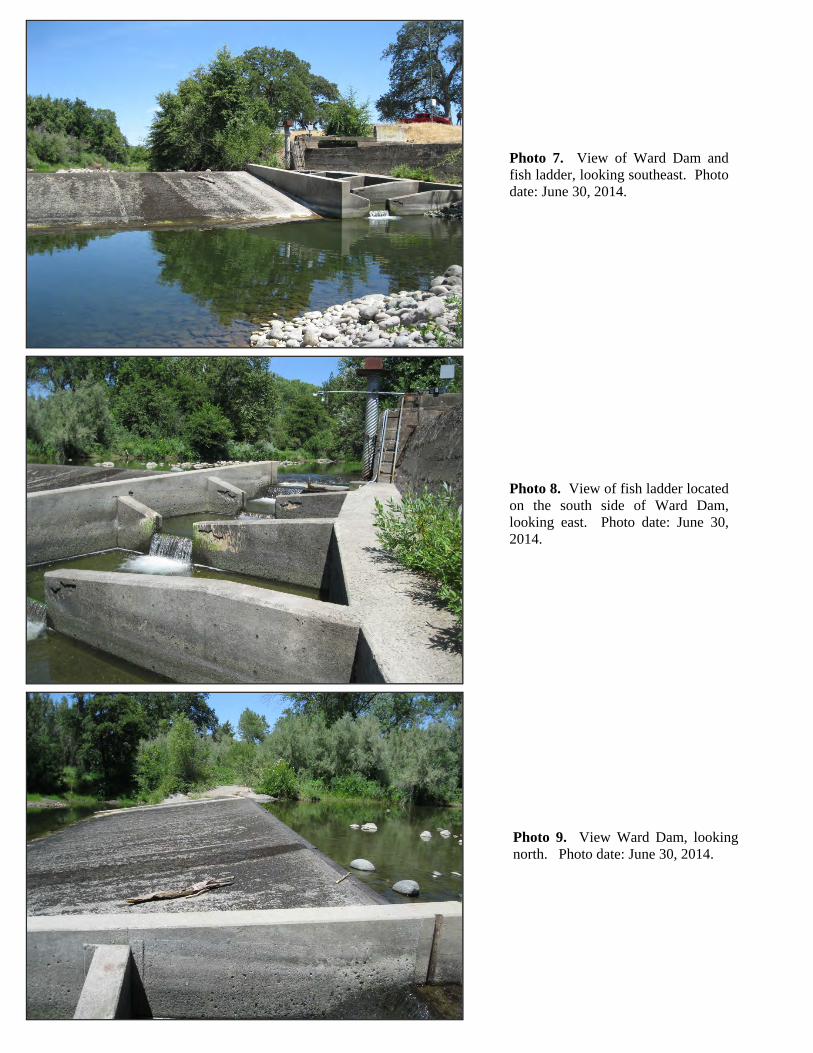
Photo 7. View of Ward Dam and fish ladder, looking southeast. Photo date: June 30, 2014.
Photo 8. View of fish ladder located on the south side of Ward Dam, looking east. Photo date: June 30, 2014.
Photo 9. View Ward Dam, looking north. Photo date: June 30, 2014.
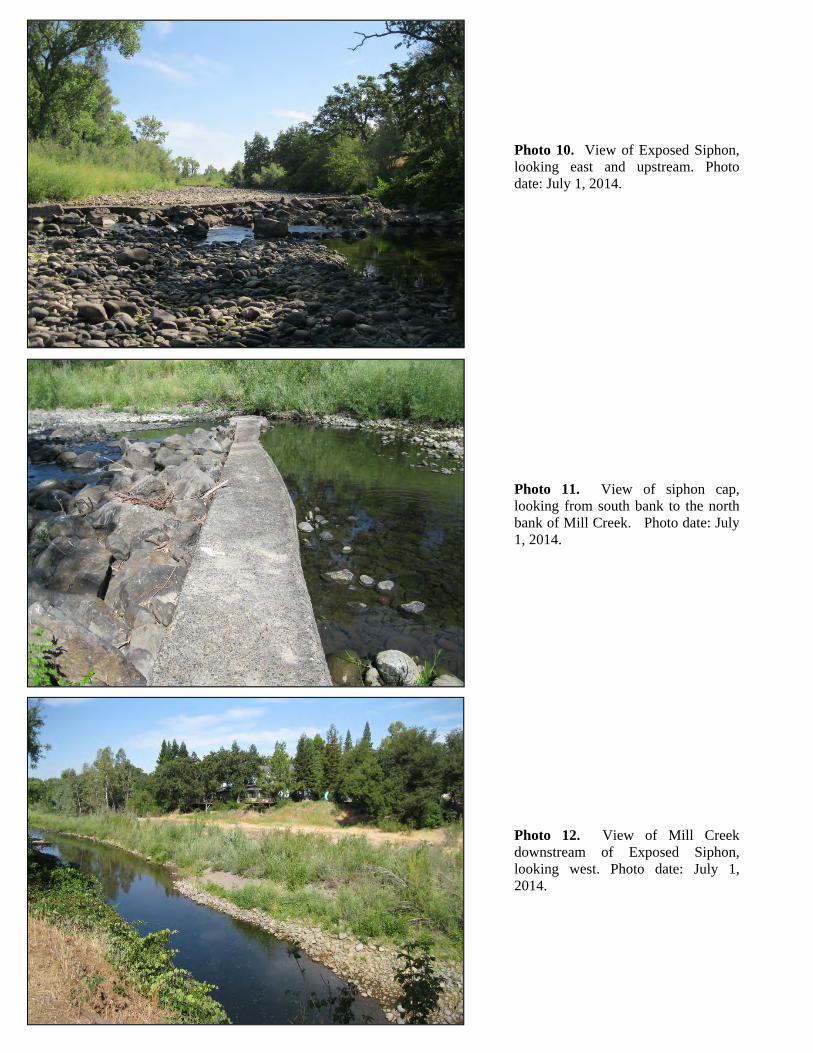
Photo 10. View of Exposed Siphon, looking east and upstream. Photo date: July 1, 2014.
Photo 11. View of siphon cap, looking from south bank to the north bank of Mill Creek. Photo date: July 1, 2014.
Photo 12. View of Mill Creek downstream of Exposed Siphon, looking west. Photo date: July 1, 2014.
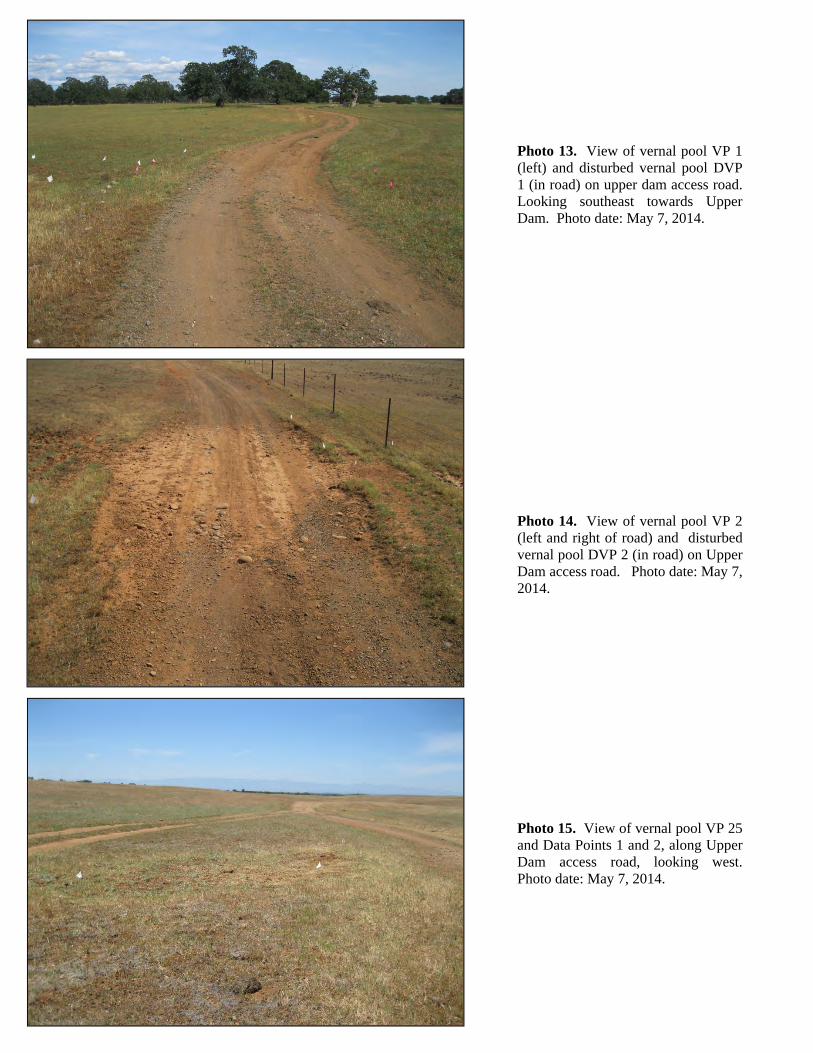
Photo 13. View of vernal pool VP 1 (left) and disturbed vernal pool DVP 1 (in road) on upper dam access road. Looking southeast towards Upper Dam. Photo date: May 7, 2014.
Photo 14. View of vernal pool VP 2 (left and right of road) and disturbed vernal pool DVP 2 (in road) on Upper Dam access road. Photo date: May 7, 2014.
Photo 15. View of vernal pool VP 25 and Data Points 1 and 2, along Upper Dam access road, looking west. Photo date: May 7, 2014.