geohydrological assessment and conceptualisation lake
TRANSCRIPT

Geohydrological assessment and conceptualisation – Lake Michelle,
Noordhoek REPORT:
GEOSS Report No: 2017/09-32
PREPARED FOR:
Shannon Lee Newman Evergreen Property Investments (Pty) Ltd
PREPARED BY: Daniel Mulder
GEOSS - Geohydrological and Spatial Solutions International (Pty) Ltd Unit 19, Technostell Building,
9 Quantum Street, TechnoPark
Stellenbosch 7600 Tel: (021) 880-1079
Email: [email protected] (www.geoss.co.za)
26 September 2017

Geohydrological assessment and conceptualisation–Lake Michelle, Noordhoek, Cape Peninsula, Western Cape
i
GEOSS Report No. G2017/09-32 26 September 2017
EXECUTIVE SUMMARY
Evergreen Property Investments (Pty) Ltd required an in-depth geohydrological
investigation of the Lake Michelle wetland area, Noordhoek. It has been noted that the
salinity of the area has been decreasing over the years. This could be directly related to the
water inflows into the wetland area. Therefore, it was required to conceptualise the role of
groundwater in the wetland area. Lake Michelle is located next to Noordhoek Main Road,
and faces southwest towards the west coast.
The Table Mountain Group (TMG) of the Cape Supergroup is represented within the study
area towards the north east where it overlies the mudstones and siltstones of the Graafwater
formation and the Cape Peninsula granite pluton of the Cape Granite Suite. In the valley the
basement granites are overlain by alluvium.
The Department of Water and Sanitation (DWS) have classified the Peninsula Formation of
the area as hosting a fractured aquifer, with an average borehole yield of 0.5 ℓ/s to 2.0 ℓ/s.
The upper layers of the Peninsula Formation are weathered. According to the DWS the
groundwater quality is indicated by electrical conductivity which ranges between 70 and
300 mS/m.
Field work commenced on 7 September 2017. The field work included the installation of
piezometers where water samples were collected. This was done to determine wetland
characteristics, water chemistry and the general groundwater flow direction. The piezometers
were augured so as to determine the hydraulic gradient of the local groundwater system. It is
believed that the general groundwater flow correlates with the topography of the area. The
groundwater from the piezometer at a higher elevation was noted to be of better quality
(lower salinity) than that of piezometers installed at a lower elevation. This is an indication
that groundwater is contributing to the wetland area. Groundwater isn’t the only water that
is flowing in to the wetland area, as there are storm water culverts directing surface water
straight into the wetland which are contributing to the decrease in salinity.
The thickness of sand varies throughout the wetland area, depending on the deposition
event. From the auguring and site conceptualisation it can be assumed that the site is
underlain by an extensive clay layer. The clay accumulated in the basin area acts as a semi
impermeable layer. The overlying sands form a perched water table enabling the lateral
movement of the groundwater from the seepage face to where it interacts with the wetland
and lake area down gradient. The wetland area is located where groundwater discharges from
the contact between the sandstones from the Peninsula Formation and the underlying lower
permeability Graafwater Formation (if present) and granite. The quantity of groundwater
contributing to the wetland is expected vary seasonally, but is expected to typically be of a
good quality (low salinity).

Geohydrological assessment and conceptualisation–Lake Michelle, Noordhoek, Cape Peninsula, Western Cape
GEOSS Report No. G2017/09-32 27 September 2017 ii
The Lake Michelle area is a highly disturbed and developed wetland area. To understand the
groundwater contribution to the wetland in more detail would require a detailed groundwater
monitoring and management plan with quantification of inflows and outflows to the system.
To understand the quality of the groundwater further upgradient of the wetland an up
gradient piezometer could be installed. The piezometers could be monitored (in terms of
water level and salinity) to evaluate the seasonal and ongoing variations and changes at the
site.
Ooooo OOO ooooO

Geohydrological assessment and conceptualisation – Lake Michelle, Noorhoek, Cape Peninsula, Western Cape
GEOSS Report No. 2017/09-32 26 September 2017 iii
TABLE OF CONTENTS
1. INTRODUCTION .............................................................................................. 1
2. TERMS OF REFERENCE ................................................................................. 1
3. REGIONAL SETTING ...................................................................................... 2 3.1 General ............................................................................................................................. 2
3.2 Rainfall .............................................................................................................................. 2
3.3 Evaporation ..................................................................................................................... 2
3.4 Regional Geology ............................................................................................................ 3
3.5 Regional Hydrogeology .................................................................................................. 3
3.6 Groundwater - Surface water interaction .................................................................... 3
4. SITE VISIT ......................................................................................................... 4
5. DISCUSSION ..................................................................................................... 10
6. RECOMMENDATIONS .................................................................................. 13
7. REFERENCES .................................................................................................. 14
8. APPENDIX A: MAPS ........................................................................................ 15
9. APPENDIX B: CHEMISTRY ........................................................................... 21
LIST OF MAPS AND FIGURES
Figure 1: Average monthly rainfall and evaporation (Noordhoek – ARC-ISCW) ................. 2 Figure 2: Correlation between groundwater levels (mamsl) and elevation at each piezometer site. ....................................................................................................................................................... 5 Figure 3: Pipter diagram of the three samples of the respective piezometers .......................... 8 Figure 4: Stiff diagrams of the water samples taken at the respective piezometer sites. ........ 9 Figure 5: Salinity diagram of the water samples taken at the respective piezometer sites. ..... 9 Figure 6: Geological cross-section along the wetland area. ..................................................... 10 Figure 7. Cross section based on geological information. ......................................................... 11 Figure 8: Field chemistry including; pH, Electrical Conductivity and Total Dissolved Solids. ............................................................................................................................................................ 12
Map 1: Location of the study area within a regional setting ..................................................... 16 Map 2: The study area and borehole locations from the National Groundwater Archive (NGA) (DWA). ............................................................................................................................... 17 Map 3: Map showing the cross section profiles used for the conceptualisation of the regional geological setting and the wetland area. ........................................................................ 18 Map 4: The study site superimposed on an aerial photograph. The map indicates the locations of respective piezometer locations and the general groundwater flow direction. 19 Map 5: Geological setting of the study area and NGA boreholes (Council for Geoscience map: 1:50 000 scale 3418AB & AD – Cape Penins ................................................................... 20
LIST OF TABLES Table 1: Geological formations within the study area ................................................................ 3 Table 2: Augur site and piezometer positions.............................................................................. 4 Table 3: A summary of the groundwater level and comments on the horizons augured. ..... 5 Table 4: Field chemistry .................................................................................................................. 6
Geohydrological assessment and conceptualisation – Lake Michelle, Noorhoek, Cape Peninsula, Western Cape
GEOSS Report No. 2017/09-32 26 September 2017 iv
ABBREVIATIONS ch collar height ha hectare ℓ/s litres per second m metres MAE Mean Annual Evaporation mamsl metres above mean sea level MAP Mean Annual Precipitation MAR Mean Annual Runoff mbch metres below collar height mbgl metres below ground level mg/ℓ milligrams per litre Mm/a millimetres per annum mS/m milliSiemens per meter NGA National Groundwater Archive TMG Table Mountain Group WGS84 Since the 1st January 1999, the official co-ordinate system for South Africa is based on the World Geodetic System 1984 ellipsoid, commonly known as WGS84.
GLOSSARY OF TERMS Aquifer: a geological formation, which has structures or textures that hold water or permit
appreciable water movement through them [from National Water Act (Act No. 36 of 1998)].
Borehole: includes a well, excavation, or any other artificially constructed or improved groundwater cavity which can be used for the purpose of intercepting, collecting or storing water from an aquifer; observing or collecting data and information on water in an aquifer; or recharging an aquifer [from National Water Act (Act No. 36 of 1998)].
Fractured aquifer: Fissured and fractured bedrock resulting from decompression and/or tectonic action. Groundwater occurs predominantly within fissures and fractures.
Groundwater: water found in the subsurface in the saturated zone below the water table or piezometric surface i.e. the water table marks the upper surface of groundwater systems.
Hydraulic conductivity: measure of the ease with which water will pass through earth material; defined as the rate of flow through a cross-section of one square metre under a unit hydraulic gradient at right angles to the direction of flow (in m/d)
Transmissivity: the rate at which a volume of water is transmitted through a unit width of aquifer under a unit hydraulic head (m2/d); product of the thickness and average hydraulic conductivity of an aquifer.
Vadose zone: the unsaturated zone above the water table and below the ground surface.
Geohydrological assessment and conceptualisation – Lake Michelle, Noorhoek, Cape Peninsula, Western Cape
GEOSS Report No. 2017/09-32 26 September 2017 v
Suggested reference for this report: GEOSS (2017). Geohydrological assessment and conceptualisation – Lake Michelle,
Noordhoek, Cape Peninsula, Western Cape. GEOSS Report Number: 2017/09-32. GEOSS - Geohydrological & Spatial Solutions International (Pty) Ltd. Stellenbosch, South Africa.
Cover photo: Aerial photograph of the Lake Michelle. GEOSS project number:
2017_08_2279

Geohydrological assessment and conceptualisation – Lake Michelle, Noorhoek, Cape Peninsula, Western Cape
GEOSS Report No. 2017/09-32 26 September 2017 1
1. INTRODUCTION
This study forms part of an environmental impact study for further development,
rehabilitation and conservation of the Lake Michelle salt marsh conducted by Doug Jeffery
Environmental Consultants.
GEOSS was approached by Evergreen Property Investments (Pty) Ltd to assess whether the
groundwater is a contributing factor to the surface water of the Lake Michelle area. This
includes a field investigation and a report presenting results of the investigation.
The site is located in the secure housing development Lake Michelle. Map 1 (Appendix A)
shows the regional setting of the site on a topocadstral map. Map 2 (appendix A) shows the
site on an aerial photograph with a 1km radius zone in which the hydrocensus was
conducted. Map 3 (Appendix A) shows the site overlain on an aerial photograph.
The study included a desktop assessment, literature review and field work. The field work
was restricted due to rainfall and the wet nature of the site during the study period
(September, late winter). However good data was obtained enabling conceptualisation of the
study area.
A geohydrological, hydrological and geotechnical study was done in 2001 for Lake Michelle
salt marsh as part of the phase 8 and phase 9 development by Wieringen & Associates (2001).
Relevant information from this report was included in this investigation.
2. TERMS OF REFERENCE
The geohydrological study should provide information regarding the geohydrological
characteristics. Therefore, the interaction between groundwater and the wetland area should
be assessed.
In regards to the field work carried out for this study, the following has relevance:
• Field work commenced in September towards the end of the rain season.
• No borehole drilling was carried out for this project
• There was only one borehole on the site and no others were identified in the
proximity of the study area.
• The piezometers were installed by means of hand auguring to as deep as possible,
targeting the semi impermeable clay layer.

Geohydrological assessment and conceptualisation – Lake Michelle, Noorhoek, Cape Peninsula, Western Cape
GEOSS Report No. 2017/09-32 26 September 2017 2
3. REGIONAL SETTING
3.1 General
The study area is located at the lakes in the Lake Michelle Estate, Noordhoek Main Road,
Western Cape. The site is situated in the G22A quaternary catchment with no significant
river system draining the area. It is mostly covered by water and sands with no bedrock
outcrops.
3.2 Rainfall
The nearest rainfall station from the ARC - ISCW is located in Noordhoek and the long term
average monthly rainfall is shown in Figure 1. The field work was carried out in September,
typically towards the end of the rain season.
3.3 Evaporation
The long-term average monthly evaporation data, obtained from an ARC-ISCW weather
station at Noordhoek is shown in Figure 1. Evaporation in the area exceeds rainfall, even
during the winter months.
Figure 1: Average monthly rainfall and evaporation (Noordhoek – ARC-ISCW)

Geohydrological assessment and conceptualisation – Lake Michelle, Noorhoek, Cape Peninsula, Western Cape
GEOSS Report No. 2017/09-32 26 September 2017 3
3.4 Regional Geology
The Geological Survey of South Africa (now the Council for Geoscience) has mapped the
area at 1:50 000 scale (3418AB & AD, Cape Peninsula). The geological setting is shown in
Map 5 (Appendix A). The main geology of the area is listed in Table 1.
Table 1: Geological formations within the study area
Symbol Formation Group
Alluvium Qsr
Witzand -
Os Peninsula Table Mountain Group
Graafwater
Peninsula
Pluton Cape Granite Suite
The Table Mountain Group (TMG) of the Cape Supergroup is represented within the study
area towards the north east where it overlies the mudstones and siltstones of the Graafwater
formation. The basal Cape Peninsula Pluton of the Cape Granite Suite is overlain by
alluvium from the Witzand formation.
The topography is relatively uniform and flat throughout the valley area, but higher
topography generally relates to outcrop of the sandstones from the TMG towards the south.
There is an inferred north west-south east trending fault that intersects the site. This fault is
most likely associated with a zone of increased fracturing and higher transmissivity and
groundwater flow.
3.5 Regional Hydrogeology
According to the 1:500 000 scale groundwater map of Cape Town (3317) the area does host
a fractured aquifer (i.e. the bedrock constitutes an aquifer) with an average borehole yield of
0.5 ℓ/s to 2.0 ℓ/s. The sandy deposits are not mapped as an aquifer. The groundwater map
indicates the fractured aquifer has a water quality as indicated by electrical conductivity (EC)
in the range of 70 – 300 mS/m. EC values in the TMG is however generally low (less than
70 mS/m).
3.6 Groundwater - Surface water interaction
The interaction of groundwater with wetland areas, especially in coastal terrains depend on
the topographical setting, usually associated with discharge of ground water from regional or
local flow systems. Wetlands may either gain water from groundwater inflow, recharge the
groundwater system or both. Winter et al. (1998) states that the source of water in wetlands
can be from the following:
• Groundwater discharge where the land surface is underlain by complex groundwater
flow fields,
• Groundwater discharge at seepages faces and at breaks in the slope of the local water
table,

Geohydrological assessment and conceptualisation – Lake Michelle, Noorhoek, Cape Peninsula, Western Cape
GEOSS Report No. 2017/09-32 26 September 2017 4
• streams,
• and where there is no form of stream inflow, precipitation, with groundwater
gradient sloping away from the wetland area.
4. SITE VISIT
Field work commenced on 7 September 2017. The field work included a walk over of the
terrain and the installation of piezometers where water samples were collected.
The field work included the assessment of the National Groundwater Archive (NGA) data
obtained from the Department of Water and Sanitation (DWS). The results of the NGA
search are shown on Map 2 (Appendix A). There are no boreholes in close proximity to the
study area. Only one borehole was found on site up gradient of the wetland area against the
eastern boundary fence. No water levels were measured due to some kind of obstruction
within the borehole.
During the site visit a number of locations were augured by hand. This was done to determine
wetland characteristics, water chemistry and the general groundwater flow direction. The
profiles from the auguring would be used to determine and classify the profiles according to
physical characteristics.
Where groundwater was intersected, a 50 mm PVC pipe was installed as deep as possible (i.e.
to the top of the impermeable layer). The PVC pipe was slotted (i.e. screened) to allow for
the sampling of the groundwater. Such piping and screening is referred to as a piezometer.
Of the sites augured, only one intersected the impermeable layer at the bottom of the sands.
The positions of the augured sites and piezometers are listed in Table 2.
The augering was undertaken to evaluate the significance of groundwater in the wetland area
and also to determine the sand thickness and depth of the semi impermeable clay layer.
Table 2: Augur site and piezometer positions
Date Site ID Lat_WGS
84
Long_WGS
84
Elevation
(m)
7-Sep-17 LMPZ_01 -34.11472 18.38136 8
7-Sep-17 LMPZ_02 -34.11496 18.38362 6
7-Sep-17 LMPZ_03 -34.11591 18.38450 4
The distribution of the augur sites and piezometers are shown in Map 3 (Appendix A). The
piezometer sites were selected to cover an area enabling an assessment of the hydraulic
gradient of the local groundwater system. The water levels and lithologies are recorded in
Table 3.

Geohydrological assessment and conceptualisation – Lake Michelle, Noorhoek, Cape Peninsula, Western Cape
GEOSS Report No. 2017/09-32 26 September 2017 5
Table 3: A summary of the groundwater level and comments on the horizons augured.
The correlation between the groundwater elevation and the site elevations is shown in Figure
2 and indicates a correlation between the water table elevation and topography. The
groundwater levels for each piezometer are:
• 7.66 mamsl (LMPZ01)
• 5.65 mamsl (LMPZ02)
• 3.73 mamsl (LMPZ03)
Figure 2: Correlation between groundwater levels (mamsl) and elevation at each
piezometer site.
The three piezometers were sampled. The field chemistry is listed in Error! Reference s
ource not found..
Site IDWL_mbch
(m)
WL_mbgl
(m)
Unit length
(m)
Depth_mbgl
(m)Comments
LMPZ_01 0.94 0.34 2 1.66
Top organic rich greyish sand (0.20m). Transition to
white sands with increasing depth (0.20 - 0.50). White
sands towards the end of the hole. Deeper sands
started collapsing. Installed piezometer.
LMPZ_02 1.05 0.35 2 1.30
Top organic rich greyish sand (0.20m). Transition to
white sands with some oxidation visible. Thin clayish
layer at 0.90m. White sands until end of the hole.
Deeper sands started collapsing. Installed
piezometer.
LMPZ_03 0.67 0.27 2 1.60
Top organic rich greyish sand (0.15). White sands with
signs of oxidation (0.30). Black clay from 0.30m.
Augured hole until it started collapsing. Installed
piezometer.

Geohydrological assessment and conceptualisation – Lake Michelle, Noorhoek, Cape Peninsula, Western Cape
GEOSS Report No. 2017/09-32 26 September 2017 6
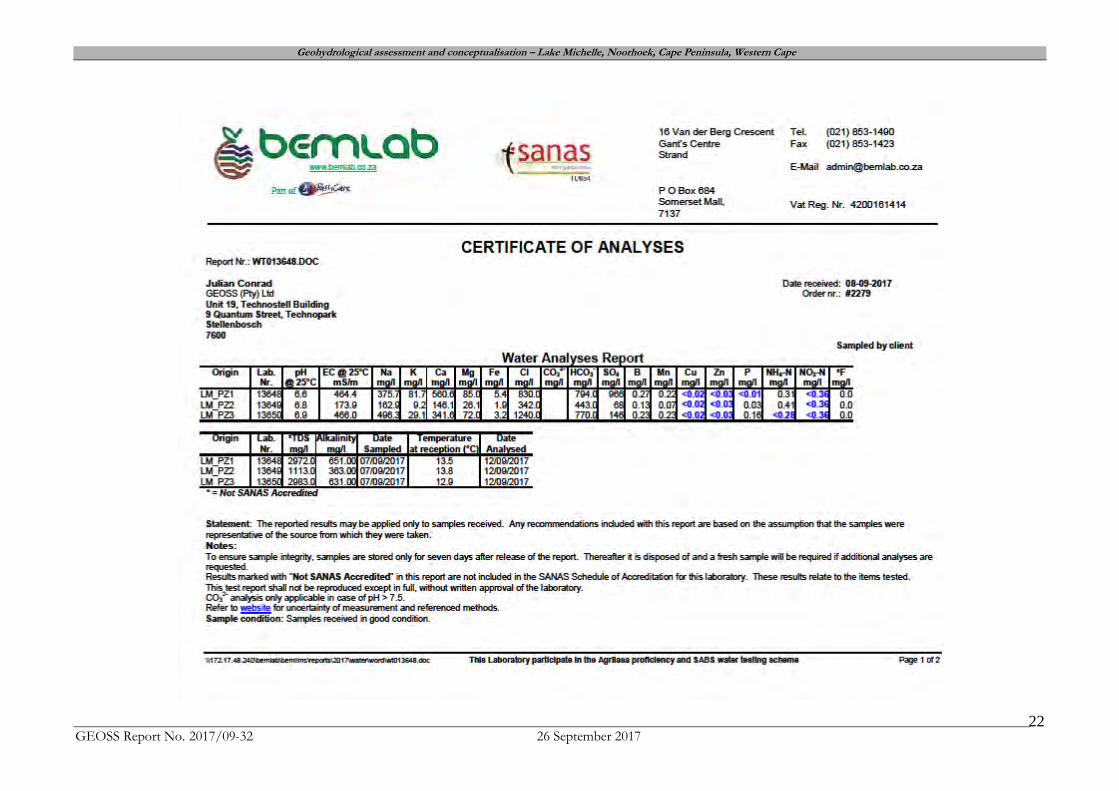
Table 4: Field chemistry
Three samples were collected and submitted for macro chemical analysis. These results are included in Appendix B. This includes site 01 to 03 correlating with LMPZ01 to
LMPZ03. The chemistry data is presented in Figure 3: Pipter diagram of the three samples of the respective piezometers
Site ID Date Time pH
EC
(ms/m)
TDS
(mglL) RP (mV)
LMPZ_01 7-Sep-17 12:30 7.82 375.9 2808 134
LMPZ_02 7-Sep-17 13:24 7.69 149.9 1176 23.6
LMPZ_03 7-Sep-17 13:40 7.89 368.4 2951 58.7
Geohydrological assessment and conceptualisation – Lake Michelle, Noorhoek, Cape Peninsula, Western Cape
GEOSS Report No. 2017/09-32 26 September 2017 7
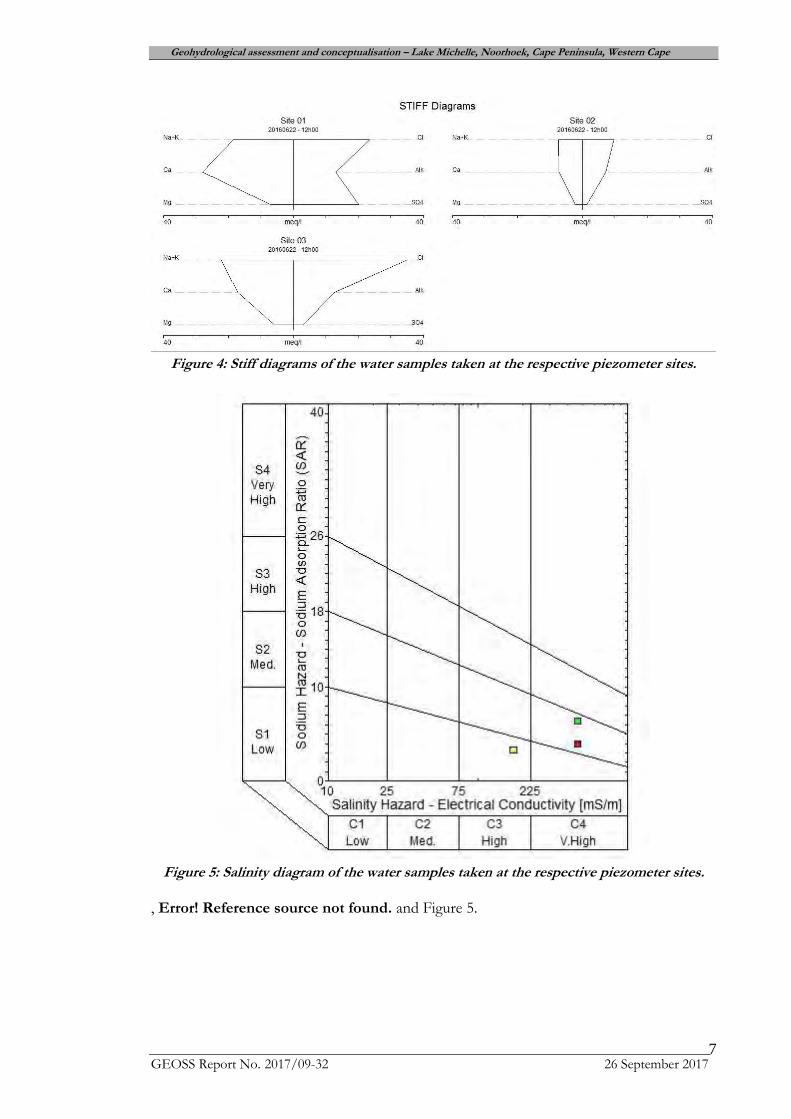
Figure 4: Stiff diagrams of the water samples taken at the respective piezometer sites.
Figure 5: Salinity diagram of the water samples taken at the respective piezometer sites.
, Error! Reference source not found. and Figure 5.

Geohydrological assessment and conceptualisation – Lake Michelle, Noorhoek, Cape Peninsula, Western Cape
GEOSS Report No. 2017/09-32 26 September 2017 8
Figure 3: Pipter diagram of the three samples of the respective piezometers
Geohydrological assessment and conceptualisation – Lake Michelle, Noorhoek, Cape Peninsula, Western Cape
GEOSS Report No. 2017/09-32 26 September 2017 9
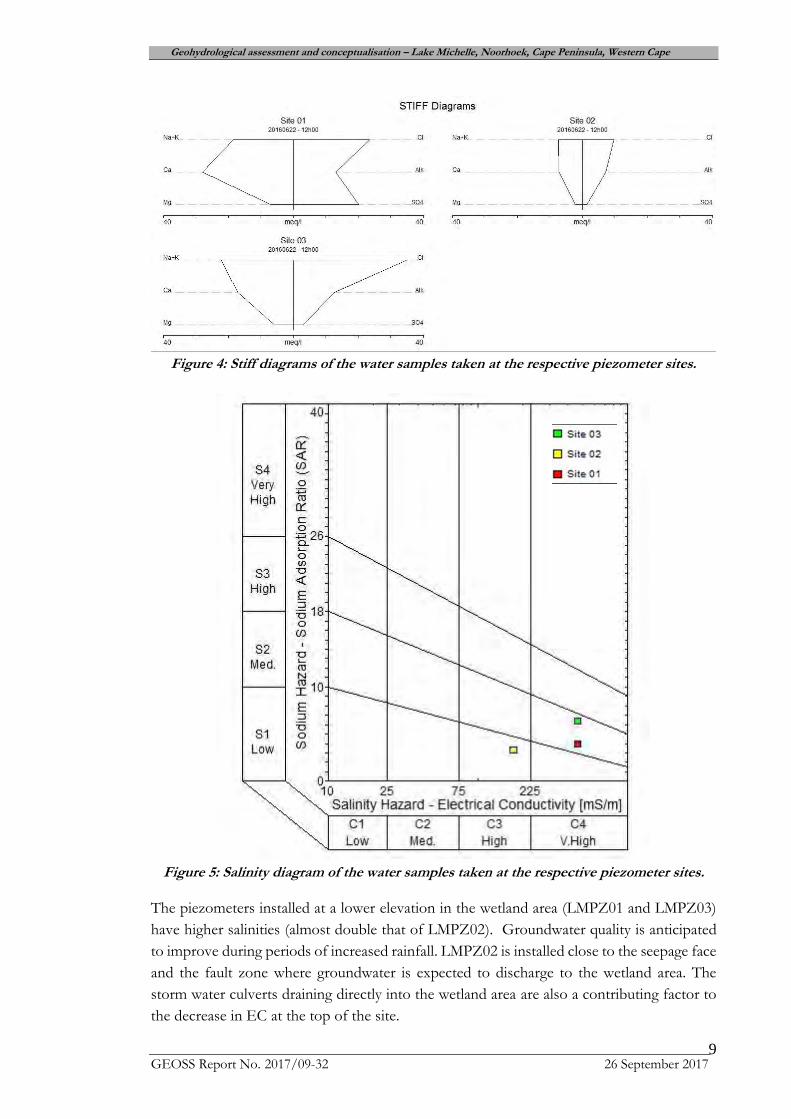
Figure 4: Stiff diagrams of the water samples taken at the respective piezometer sites.
Figure 5: Salinity diagram of the water samples taken at the respective piezometer sites.
The piezometers installed at a lower elevation in the wetland area (LMPZ01 and LMPZ03)
have higher salinities (almost double that of LMPZ02). Groundwater quality is anticipated
to improve during periods of increased rainfall. LMPZ02 is installed close to the seepage face
and the fault zone where groundwater is expected to discharge to the wetland area. The
storm water culverts draining directly into the wetland area are also a contributing factor to
the decrease in EC at the top of the site.

Geohydrological assessment and conceptualisation – Lake Michelle, Noorhoek, Cape Peninsula, Western Cape
GEOSS Report No. 2017/09-32 26 September 2017 10
The macro analysis indicates that one could expect lower salinity water at higher elevations.
The salinity then increases downgradient towards the piezometers and lower lying wetland
area. It has been noted that the concentration of sulphate is elevated at LMPZ01 in
comparison to that of LMPZ03. The reason for this is uncertain, but this piezometer is
located immediately down gradient of a waste disposal facility.
5. DISCUSSION
To understand the interaction between groundwater and the wetland area, two cross sections
were constructed. The cross-section profile lines are indicated in Map 3 (Appendix A).
Figure 6 is a conceptual cross-section based on information from the field visit. The thickness
of sand varies throughout the wetland area, depending on the deposition event and
subsequent erosion. From the conceptualisation of the study area it is assumed that there is
a fairly uniform spatially extensive clay layer. The clay accumulated in the basin area acts as
an impermeable layer. The sands that overlies the clay layer forms a perched aquifer that
allows the lateral movement of groundwater from the seepage face to where it is intersected
by topography and the lake.
Figure 6: Geological cross-section along the wetland area.
Figure 7 is a conceptual cross-section based on geological information available from
geological maps. The wetland area consists of alluvial sands deposited on an impermeable
clay layer that overlays granites from the Cape Granite Suite (CGS). The wetland area is
located where groundwater discharges from sandstones from the Peninsula formation at the
lower contact with the underlying siltstones/mudstones from the Graafwater Formation or
granites of the CGS. The contact between the higher permeability sandstones and the
underlying lower permeability rocks results in a seepage face where groundwater discharge
takes place.

Geohydrological assessment and conceptualisation – Lake Michelle, Noorhoek, Cape Peninsula, Western Cape
GEOSS Report No. 2017/09-32 26 September 2017 11
Figure 7. Cross section based on geological information.
During wet seasons the water flux from groundwater increases towards the wetland area
down gradient of the Peninsula Formation (TMG). The rise in groundwater level will then
cause the alluvium to become saturated with water and inundated resulting in shallow ponds.
To quantify the interaction would require detailed chemistry analysis and ongoing monitoring
of the piezometers and mass balance flows into and out of the wetland. During wet seasons
the groundwater flux in to the wetland area is expected to increase, in association with the
increase in groundwater recharge as well as surface water inflows.
It was noted that there are storm water culverts channelling water from surface water runoff
directly into the wetland area close to LMPZ_02. This increases the quantity of low salinity
water that seeps into the wetland area. Under natural conditions the groundwater recharging
the wetland area should increase in salinity as it makes its way through the wetland area in a
down gradient direction. This is due to the high salinity of the alluvium in the wetland.
Alluvium in low lying areas close to the coast is often associated with high salinity due to
deposition in a marine environment or from high tide events. The alluvium up gradient at
the groundwater seepage face and the culverts would have a high rate of leaching due to the
increased quantity of lower salinity water draining into the wetland. Therefore the TDS and
macro chemistry is expected to change from the seepage face towards the lower lying areas
in the wetland, with increasing sodium and chloride concentrations.

Geohydrological assessment and conceptualisation – Lake Michelle, Noorhoek, Cape Peninsula, Western Cape
GEOSS Report No. 2017/09-32 26 September 2017 12
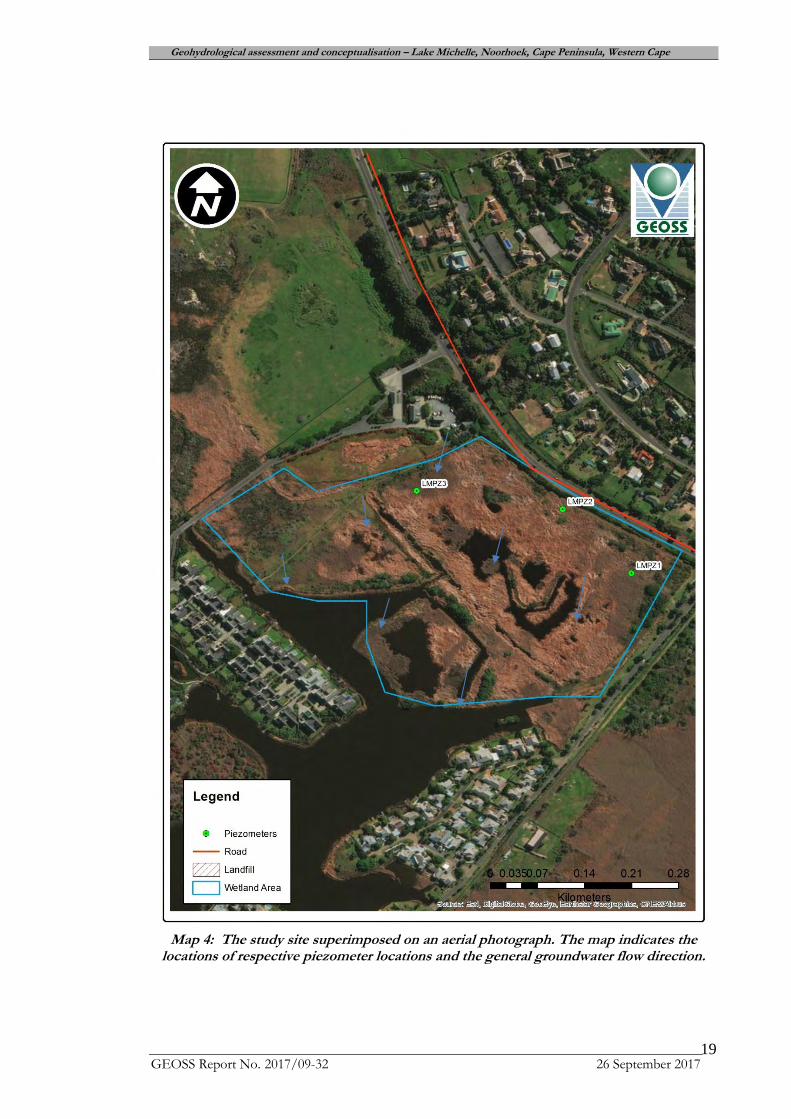
Comparing the locations and the field chemistry data some assumptions can be made
regarding the water source. Map 4. (Appendix A) indicates the locations of the respective
piezometers installed. Figure 8 is representative of the chemistry results from the field work.
Figure 8: Field chemistry including; pH, Electrical Conductivity and Total Dissolved Solids.
From the field chemistry results it is clear that LMPZ_01 and LMPZ_03 has similar brackish
water, where LMPZ_02 has significantly lower EC and TDS values. With reference to the
locality of the piezometers it should be noted that lower salinity water is entering the wetland
area from the higher lying areas towards the eastern boundary of Lake Michelle.
During the field visit it was noted that a significant quantity of water was flowing through
the storm water drains directly into the wetland area. It is believed that the increasing
development in the larger Noordhoek area causes the percentage surface drainage to
increase, increasing water flow through these storm water drains.
7.55
7.6
7.65
7.7
7.75
7.8
7.85
7.9
7.95
pH
0
500
1000
1500
2000
2500
3000
3500
TDS (mglL)
0
50
100
150
200
250
300
350
400
EC (ms/m)

Geohydrological assessment and conceptualisation – Lake Michelle, Noorhoek, Cape Peninsula, Western Cape
GEOSS Report No. 2017/09-32 26 September 2017 13
6. RECOMMENDATIONS
The Lake Michelle area is a highly disturbed and developed wetland area, and in order to
better understand the groundwater contribution a groundwater monitoring and management
program is recommended. The water sources that contributes to the water balance of the
wetland area should be identified. There are flows from above the Noordhoek Main Road
that are currently drained into the wetland by means of several culverts.
Additionally, the hydrogeological setting of the area and wetland suggests that groundwater
flows from the mapped fault structure and the contact between the Peninsula Formation and
underlying granites contributes to the wetland. The local setting consists of a perched water
table in shallow sands overlying clay.
To further understand the relevant inflows, it would be necessary to perform surface and
groundwater monitoring along with water chemistry sampling. Monitoring should be
performed at least on a quarterly basis, and should involve measurement of water levels,
quantification of inflows and outflows, and field measurements for EC and TDS. Rainfall
should also be monitored at the site.
One more piezometers could potentially be installed up gradient of the wetland area for a
control sample point where groundwater chemistry information can be obtained. In terms
of chemical characteristics of the wetland it would be important to measure the EC of the
local groundwater to monitor seasonal and ongoing changes in the water salinity.
Level loggers that have salinity monitoring capacity could potentially be installed in the
respective piezometers to monitor water level and salinity changes.

Geohydrological assessment and conceptualisation – Lake Michelle, Noorhoek, Cape Peninsula, Western Cape
GEOSS Report No. 2017/09-32 26 September 2017 14
7. REFERENCES
Wieringen & Associates (2001). Lake Michelle, Noordhoek; Salt Marsh study. Ecosense,
Consulting Environmentalists.
Winter T. C, Harvey, J. W., Franke O. L., Alley W. M. (1998). Groundwater and Surface
water: A Single Resource. USGS.
DWAF, 2002. Groundwater Resource Assessment – Phase 2. 1:500 000 Hydrogeological
National Map Series. Department of Water Affairs and Forestry. Pretoria.
Council for Geoscience 1:50 000 scale maps 3418AB & AD, Cape Peninsula.

Geohydrological assessment and conceptualisation – Lake Michelle, Noorhoek, Cape Peninsula, Western Cape
GEOSS Report No. 2017/09-32 26 September 2017 15
8. APPENDIX A: MAPS

Geohydrological assessment and conceptualisation – Lake Michelle, Noorhoek, Cape Peninsula, Western Cape
GEOSS Report No. 2017/09-32 26 September 2017 16
Map 1: Location of the study area within a regional setting

Geohydrological assessment and conceptualisation – Lake Michelle, Noorhoek, Cape Peninsula, Western Cape
GEOSS Report No. 2017/09-32 26 September 2017 17
Map 2: The study area and borehole locations from the National Groundwater Archive (NGA) (DWA).

Geohydrological assessment and conceptualisation – Lake Michelle, Noorhoek, Cape Peninsula, Western Cape
GEOSS Report No. 2017/09-32 26 September 2017 18
Map 3: Map showing the cross section profiles used for the conceptualisation of the
regional geological setting and the wetland area.
Geohydrological assessment and conceptualisation – Lake Michelle, Noorhoek, Cape Peninsula, Western Cape
GEOSS Report No. 2017/09-32 26 September 2017 19
Map 4: The study site superimposed on an aerial photograph. The map indicates the
locations of respective piezometer locations and the general groundwater flow direction.

Geohydrological assessment and conceptualisation – Lake Michelle, Noorhoek, Cape Peninsula, Western Cape
GEOSS Report No. 2017/09-32 26 September 2017 20
Map 5: Geological setting of the study area and NGA boreholes (Council for Geoscience map: 1:50 000 scale 3418AB & AD – Cape Penins

Geohydrological assessment and conceptualisation – Lake Michelle, Noorhoek, Cape Peninsula, Western Cape
GEOSS Report No. 2017/09-32 26 September 2017 21
9. APPENDIX B: CHEMISTRY
Geohydrological assessment and conceptualisation – Lake Michelle, Noorhoek, Cape Peninsula, Western Cape
GEOSS Report No. 2017/09-32 26 September 2017 22