geographical data in cohort/longitudinal studies - closer · geographical data in...
TRANSCRIPT

Geographical data in cohort/longitudinal studies
Zhiqiang Feng
University of Edinburgh
CLOSER workshop, 22 November, 2016

Acknowledgements
• Thanks for contribution from Jon Johnson from Centre for Longitudinal Studies and Gemma Seabrook, Rosie French, Jonathan Tebbett from the CLOSER team in UCL

Geographical data
• Geographical identifier• Information about the cohort members’ residential location
• Or other location, such as place of work, place of study
• The primary identifier is the address from which the other geographical identifiers can be derived. • Including administrative regions, postcode geography and grid references.

Cohort member
Household of Cohort member
Dwelling unit
Address
Grid references Postcode
Grid references
Higher level geographies
Relationship between residential address and geographical identifiers

Distances between one address to the postcode centroid in postcode IV4 7JX
© Crown Copyright. Ordnance Survey (Digimap Licence)

Statistic Distance (m)
Mean 30.1
Median 23.1
Standard deviation 37.2
min 0
Max 4029.3
Summary statistics for distances between addresses and their postcode centroid in Edinburgh
Statistic Distance (m)
Mean 195.6
Median 54.4
Standard deviation 517.9
Min 0
Max 23899.5
Summary statistics for distances between addresses and their postcode centroid in
Highland
Postcode centroids and address points

Geographical identifiers
• The most common type of geographical identifier is a code which denotes the area in which a person lives at a particular time.
• Postcode
• Grid reference,
• Census output area,
• Electoral ward
• Local authority
• Geographical region

Millennium Cohort Study (MCS)
• The most recent of Britain’s national longitudinal birth cohort studies
• 19,000 children
• Born in the UK in 2000-01
• Five sweeps, 9 months, 3, 5, 7 and 11 years old

Geographical identifiers MCS
• 1998 ward code
• Census statistics ward code 2001
• Lower Super Output Area 2001
• Middle Super Output Area 2001
• Output Area, 2001
• Local authority 2001
• Westminster Parliamentary Constituencies, 2001
Source: Jon Johnston, 2009, Geographical identifiers in MCS, CLSDavid Church: 2015 Millennium Cohort Study, CLSFor wave 5, 2011 census output areas, lower super output areas, middle super output areas, Westminster parliamentary constituencies 2011 also available
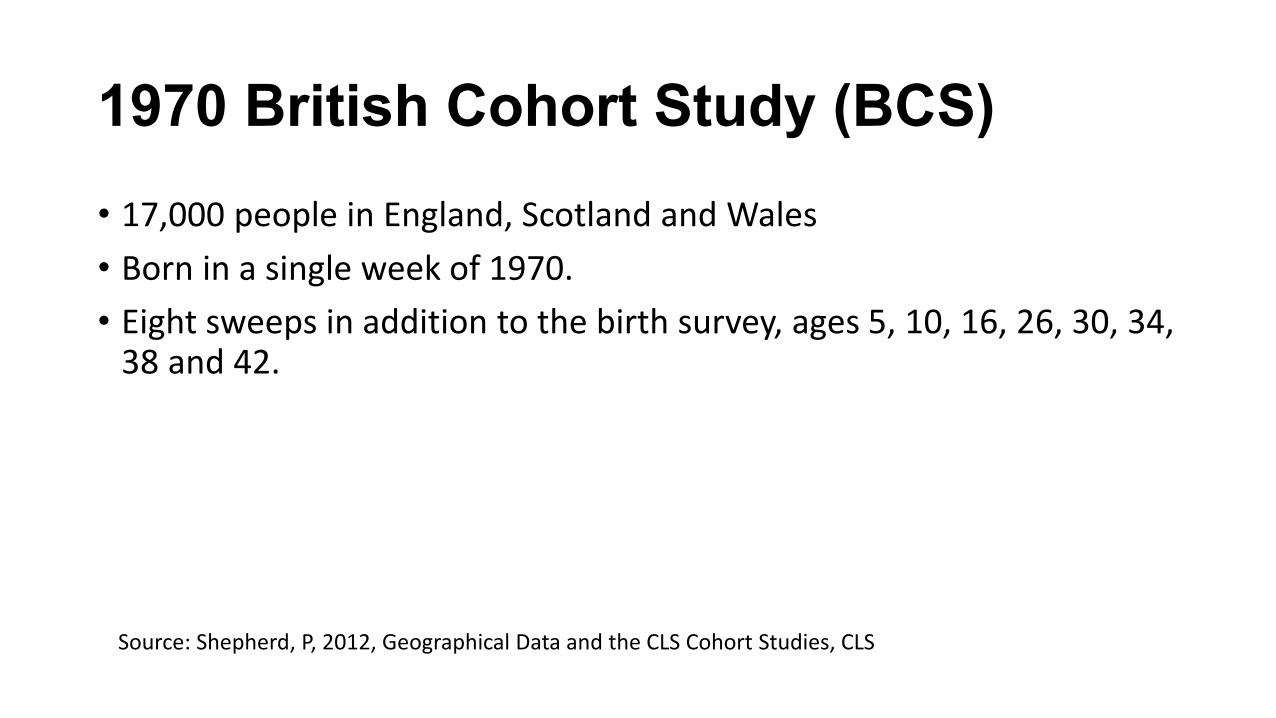
1970 British Cohort Study (BCS)
• 17,000 people in England, Scotland and Wales
• Born in a single week of 1970.
• Eight sweeps in addition to the birth survey, ages 5, 10, 16, 26, 30, 34, 38 and 42.
Source: Shepherd, P, 2012, Geographical Data and the CLS Cohort Studies, CLS

Address geocoding in BCS70
Source: Shepherd, P, 2012, Geographical Data and the CLS Cohort Studies, CLS
Geocoding of addresses of early sweeps
• The addresses from the 1970, 1975 and 1980 sweeps have not been digitised before.
• As part of the work package 6, the addresses from the 1970, 1975 and 1980 sweeps were digitised and geocoded to postcode or grid references.
• PAF and manual matching

1958 National Child Development Study (NCDS)
• Around 17,000 people in England, Scotland and Wales
• Born in a single week of 1958.
• The birth survey in 1958, plus nine further surveys of all cohort members at ages 7, 11, 16, 23, 33, 42, 46, 50 and 55
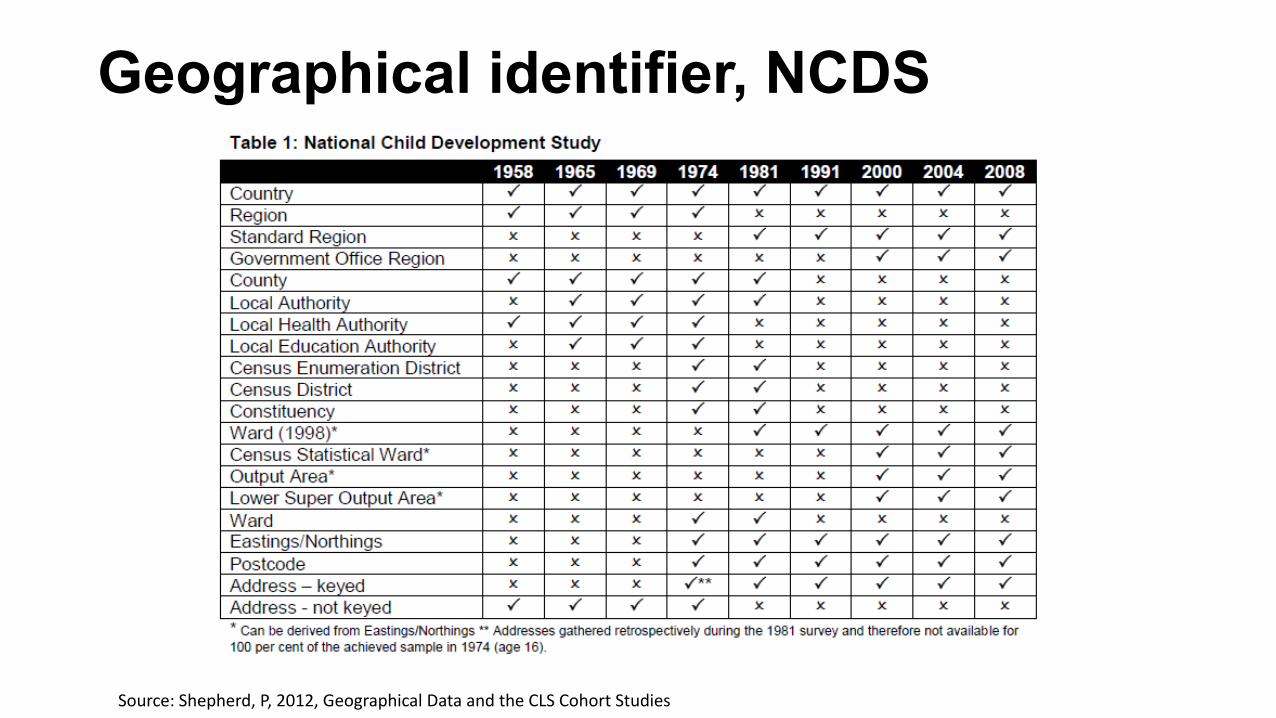
Geographical identifier, NCDS
Source: Shepherd, P, 2012, Geographical Data and the CLS Cohort Studies

Geographical identifiers, NCDS
• From sweep 6 (1991):• 1998 ward code
• Census statistics ward code 2001
• Lower Super Output Area 2001
• Middle Super Output Area 2001
• Output Area, 2001
• Local authority 2001
• Westminster Parliamentary Constituencies, 2001
Source: David Church: 2015 Geographical identifier, NCDS CLSFor wave 9, 2011 census output areas, lower super output areas, middle super output areas, westminster parliamentary constituencies 2011 also available

Understanding society
• 5 waves so far• 2009-10, 10-11, 11-12,12-13, 13-14
• Main sample
• Innovative panel
• Ethnicity sample

Understanding society• Local Authority District
• Westminster Parliamentary Constituencies
• Local Education Authorities
• Travel to Work Areas
• Strategic Health Authorities
• Primary Care Organisations
• Census Area Statistics Wards
• Census 2001 Middle Layer Super Output Areas
• Census 2011 Middle Layer Super Output Areas
• Census 2001 Lower Layer Super Output Areas
• Census 2011 Lower Layer Super Output Areas
• Grid references
Source: https://www.understandingsociety.ac.uk/about/data-linkage#part2

Geographical variables
• Derived from cohort studies
• Linked to census & administrative variables• Provided by cohort studies
• User generated
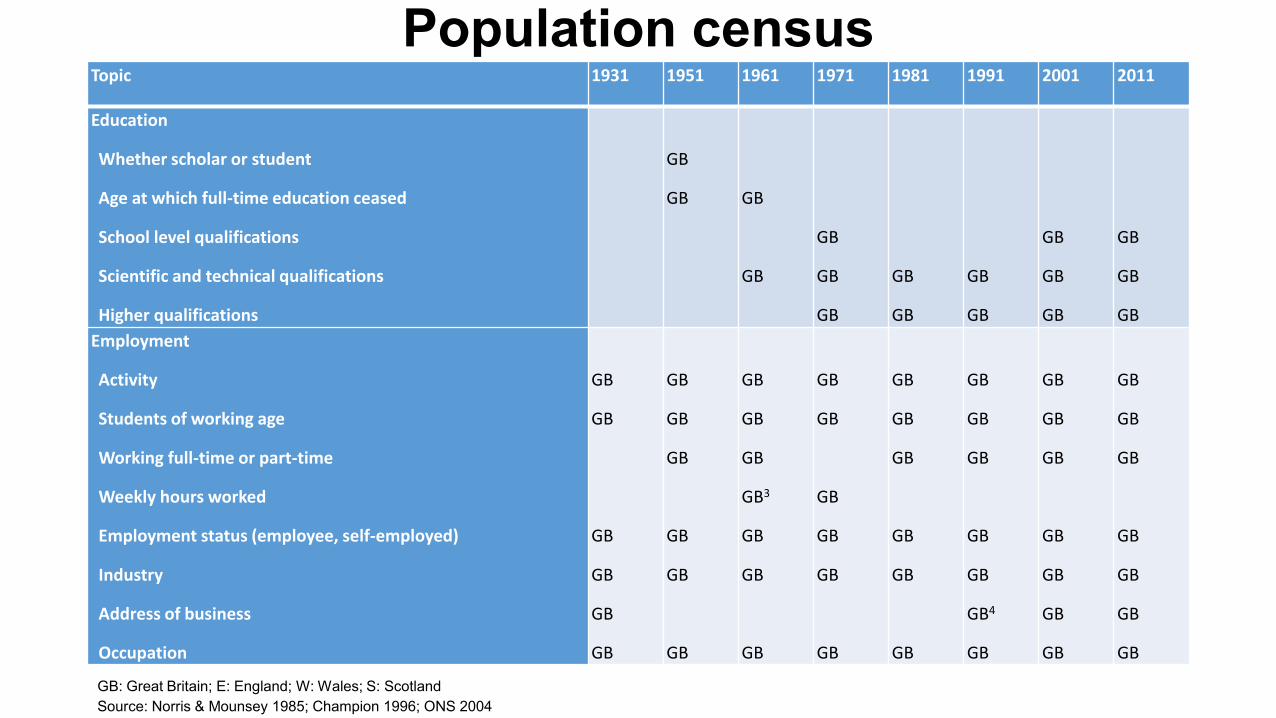
Population censusTopic 1931 1951 1961 1971 1981 1991 2001 2011
Education
Whether scholar or student
Age at which full-time education ceased
School level qualifications
Scientific and technical qualifications
Higher qualifications
GB
GB GB
GB
GB
GB
GB
GB
GB
GB
GB
GB
GB
GB
GB
GB
GB
Employment
Activity
Students of working age
Working full-time or part-time
Weekly hours worked
Employment status (employee, self-employed)
Industry
Address of business
Occupation
GB
GB
GB
GB
GB
GB
GB
GB
GB
GB
GB
GB
GB
GB
GB
GB3
GB
GB
GB
GB
GB
GB
GB
GB
GB
GB
GB
GB
GB
GB
GB
GB
GB
GB
GB
GB
GB4
GB
GB
GB
GB
GB
GB
GB
GB
GB
GB
GB
GB
GB
GB
GB
GB: Great Britain; E: England; W: Wales; S: Scotland
Source: Norris & Mounsey 1985; Champion 1996; ONS 2004

Year Geography
Enumeration
district
Output area Ward Local authority
1951 GB
1961 Partly on demand GB GB
1971 GB GB GB
1981 GB GB GB
1991 E,W S GB GB
2001 GB GB GB
2011 GB GB GB
Census geography
Note: for Scotland pseudo postcode sectors are used instead of ward in 1981, 1991 and 2001 censuses.
Source: Denham & Rhind 1983; Coombes, M. 1995

Areal deprivation from censusDeprivation indicator Description Note
Unemployment % as total economically active 1931 onward
Overcrowding % households with over 1 person per room 1931 onwards
Renters % households socially or privately rented; 1961 onwards
No car % households with no car or van 1971 onwards
Low social class % in social class 4 (partly skilled) and 5
(unskilled)
1951, 1971 for males
Lacking higher education % of all persons lacking higher level
qualifications
1951: terminated education at age 20 or
over (most
likely age category at which degree
obtained;
1971: holding a degree or equivalent ;
2001: level 4 or 5 out of five
degree level qualification

Back casting deprivation indicators
• Experiment using the 1991 and 2001 census data
• Scotland as study area (N of 2001 OAs = 42604, N of district=32, N of 1991 OAs = 38254, N of district 56)
1991 district level data
2001 Output area to 1991 district lookup table
Re-distributing 1991 district level data onto 2001 output area level
Summing up 1991 data from the 2001 OA level onto bespoke geographies

Bespoke geography
Radius = 1 kilometre
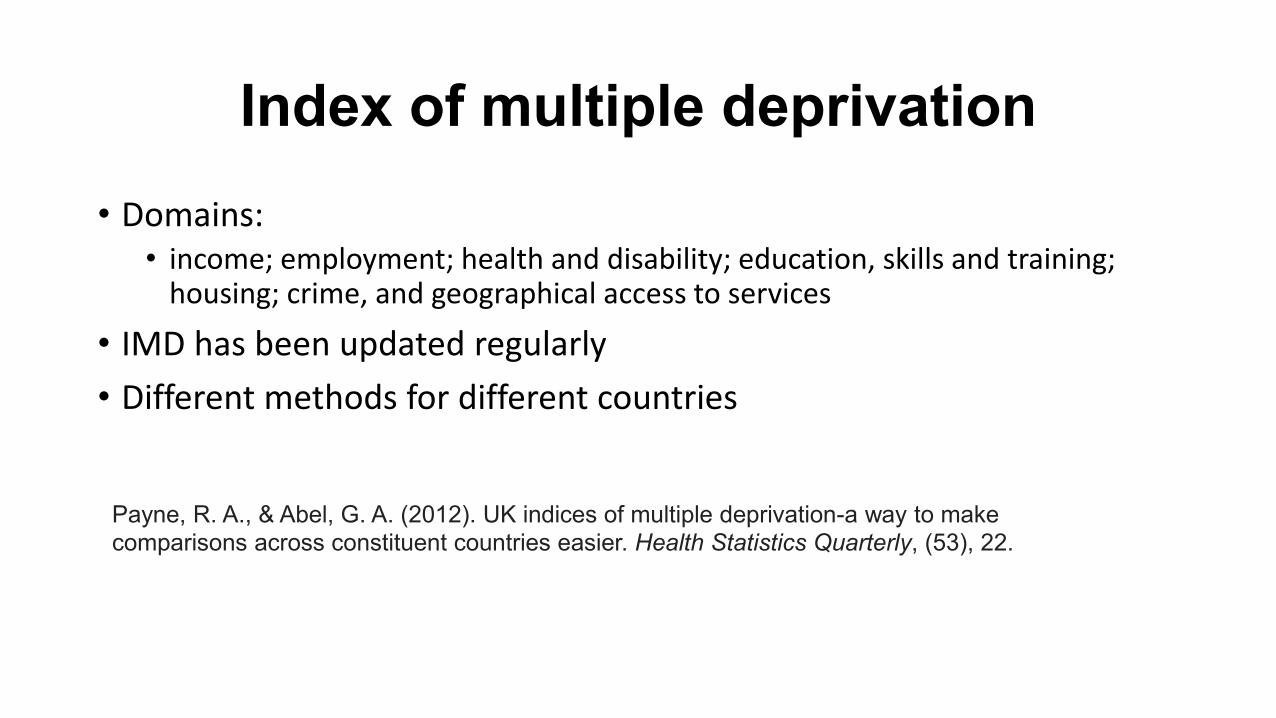
Index of multiple deprivation
• Domains: • income; employment; health and disability; education, skills and training;
housing; crime, and geographical access to services
• IMD has been updated regularly
• Different methods for different countries
Payne, R. A., & Abel, G. A. (2012). UK indices of multiple deprivation-a way to make
comparisons across constituent countries easier. Health Statistics Quarterly, (53), 22.

Air pollution
• In 1961 the UK established the world's first co-ordinated national air pollution monitoring network, called the National Survey.
• Data on daily average concentrations of BS and SO2 from monitoring sites can be obtained from the national air quality archive (www.airquality.co.uk).

Air pollution
• The CHESS project (Chronic Health Effects on Smoke and Sulphur project, Imperial College), concentrations of BS and SO2 at 1962, 1971, 1981, and 1991 were estimated onto 1 km grids in alignment with the 10-yearly UK population census.
• Air pollution dispersion models were developed to estimate annual average population exposures to PM10 (particulate matter 10 um), PM25 (particulate matter 2.5 um), NO2 (nitrogen dioxide), SO2 (sulphur dioxide), CO (carbon monoxide) and O3 (ozone) in Britain for 1994 onwards (Murrells et al 2010; Stedman 2003).
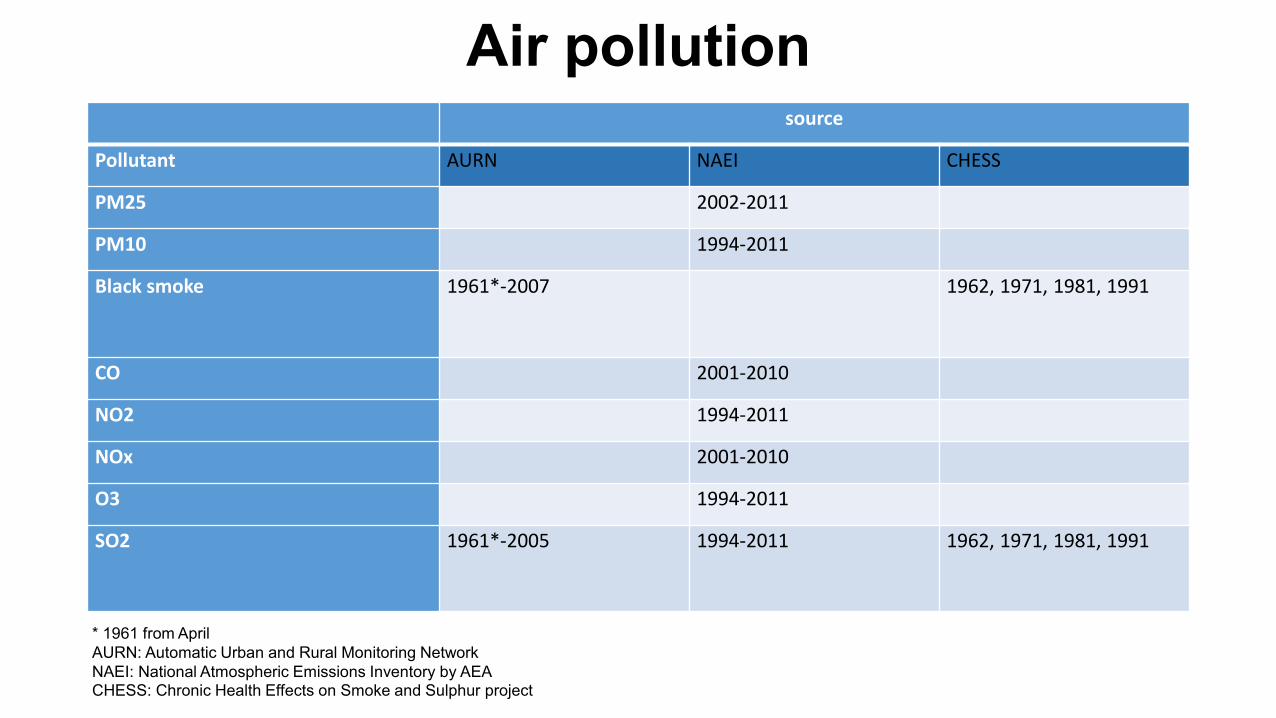
Air pollution source
Pollutant AURN NAEI CHESS
PM25 2002-2011
PM10 1994-2011
Black smoke 1961*-2007 1962, 1971, 1981, 1991
CO 2001-2010
NO2 1994-2011
NOx 2001-2010
O3 1994-2011
SO2 1961*-2005 1994-2011 1962, 1971, 1981, 1991
* 1961 from April
AURN: Automatic Urban and Rural Monitoring Network
NAEI: National Atmospheric Emissions Inventory by AEACHESS: Chronic Health Effects on Smoke and Sulphur project

Climatic data
• Daily weather records from observing stations:
• MIDAS (Met Office Integrated Data Archive System) (http://badc.nerc.ac.uk/view/badc.nerc.ac.uk__ATOM__dataent_ukmo-midas). • from 1853
• free for academics.
• Alternatively the data can be requested from Met Office (http://www.metoffice.gov.uk/). • There is normally a charge from the Met Office for producing the data.

Climatic data
• The Met Office also maintains several time series calculated from the station records, • Met Office UK Climate series
• Met Office Hadley Centre series.
• 5 km grid points
• 25 km grid points
• regions (Perry & Hollis, 2005).