cohort stability of percent proficient, sgp and vam models ... · cohort 2 cohort 3 cohort 1.71 .59...
TRANSCRIPT
Cohort Stability of Percent Proficient, SGP and
VAM Models on a State Accountability Test
Joseph J. Stevens
University of Oregon
Ann C. Schulte
Arizona State University
Presented at the Hawaii International Conference on Education, Honolulu, HI, January, 2017
© Stevens, 2017
1

Contact Information:Joseph Stevens, Ph.D.
College of Education
5267 University of Oregon
Eugene, OR 97403
(541) 346-2445
Presentation available at:
http://www.uoregon.edu/~stevensj/HICE2017.pdf
This work was supported by the Institute of Education Sciences, U.S.
Department of Education, through grant R32C110004 awarded to the
University of Oregon. The opinions expressed are those of the authors and
do not necessarily represent views of the Institute or the U.S. Department of
Education.
2

Presentation Purpose
Describe alternative models of school performance
Determine the extent to which estimates of school
performance are vulnerable to threats to validity
Are estimates (and corresponding inferences):
variable across successive cohorts of students (instability)?
correlated with the student composition of the school (not
independent from confounding factors)?
http://www.uoregon.edu/~stevensj/HICE2017.pdf3
Background
NCLB required schools, districts, and states to evaluate the
percent proficiency (PP) of students reaching state benchmarks
in mathematics and reading in Grades 3 to 8, and one year in
high school
With later federal flexibility, the PP metric has been expanded to
include a variety of analytic models to estimate school
effectiveness and, more recently, teacher effectiveness, including
student growth percentiles (SGP) and value added models
(VAM).
These models have been used to draw inferences about the
causal effects of teachers and schools on student achievement
http://www.uoregon.edu/~stevensj/HICE2017.pdf 4

Background
However, there’s uncertainty about how well these models
actually capture the effects they seek to estimate
These concerns have led to cautionary statements on the use of
VAMs from the AERA (2015) and the American Statistical
Association (2014)
Concerns expressed include:
The impact of measurement error on estimates
Estimates and rankings may change substantially when different model
variations or tests are used
Stability of estimates over time and cohorts
Effects attributed to a teacher or school may actually be caused by other
factors
http://www.uoregon.edu/~stevensj/HICE2017.pdf5
Samples
Our larger study includes data from four states (Arizona, North
Carolina, Oregon, Pennsylvania)
Three successive cohorts (2010, 2011, 2012) of all students in Grades 3 to 5
(elementary cohorts) or 6 to 8 (middle school cohorts)
All students took each state’s mandated mathematics or reading tests
For brevity, only OR results are presented here; additional results
are available on request from the first author
Oregon sample:
Mathematics Elementary: N = 29,836 students; 606 schools
Mathematics Middle: N = 25,486 students; 243 schools
Reading Elementary: N = 30,284 students; 604 schools
Reading Middle: N = 25,478 students; 243 schools
6

Samples
Averaged over cohorts and content, demographic characteristics
of OR elementary and middle school samples were:
Elementary: 49.7% Female; 12.6% SWD; 52.6% FRL; 9.6% LEP; 33.2%
minority
Middle: 49.6% Female; 11.4% SWD; 49.5% FRL; 4.6% LEP; 31.9%
minority
The outcome measures were the developmental scale scores on
the Oregon Assessment of Knowledge and Skills (OAKS)
mathematics and reading/language arts tests
7
Method and Analysis
We calculated three alternative school performance estimates:
Percent Proficient (PP), Student Growth Percentiles (SGP), and
Value Added Models (VAM)
PP = Percent proficient in “focal” year (Grade 5 or Grade 8)
SGP = Focal year test score regressed on the two prior years of
test scores (Grades 3 and 4 or Grades 6 and 7) using ordinal
methods (quantile regression; Betebenner, 2009)
VAM = mixed effects model that examines performance gains
over three years (the “layered model” of Ballou, Sanders, and
Wright, 2004)
8
Method and Analysis
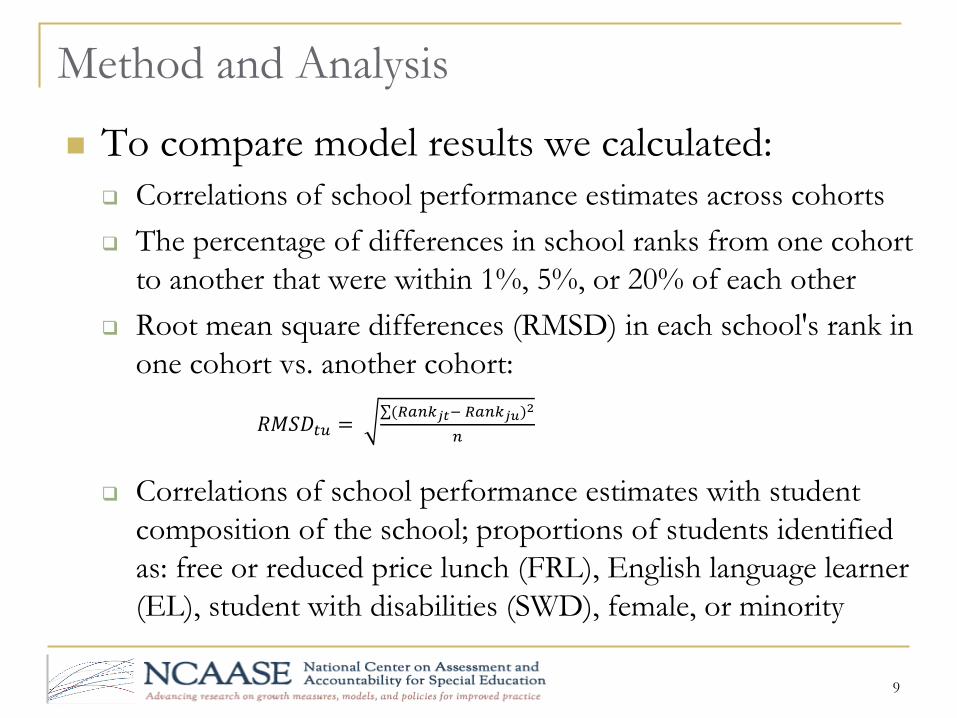
To compare model results we calculated:
Correlations of school performance estimates across cohorts
The percentage of differences in school ranks from one cohort
to another that were within 1%, 5%, or 20% of each other
Root mean square differences (RMSD) in each school's rank in
one cohort vs. another cohort:
𝑅𝑀𝑆𝐷𝑡𝑢 = (𝑅𝑎𝑛𝑘𝑗𝑡− 𝑅𝑎𝑛𝑘𝑗𝑢)
2
𝑛
Correlations of school performance estimates with student
composition of the school; proportions of students identified
as: free or reduced price lunch (FRL), English language learner
(EL), student with disabilities (SWD), female, or minority
9

10
Cohort 2 Cohort 3
Cohort 1 .59 .53
Cohort 2 .63
Percent Proficient by Cohort
Table 1. Correlations of School Performance Estimates in OR
Elementary Mathematics over the three cohorts
Student Growth Percentile
Estimates by Cohort
Value Added Model Estimates
by Cohort
Cohort 2 Cohort 3
Cohort 1 .42 .24
Cohort 2 .43
Cohort 2 Cohort 3
Cohort 1 .44 .28
Cohort 2 .47
11
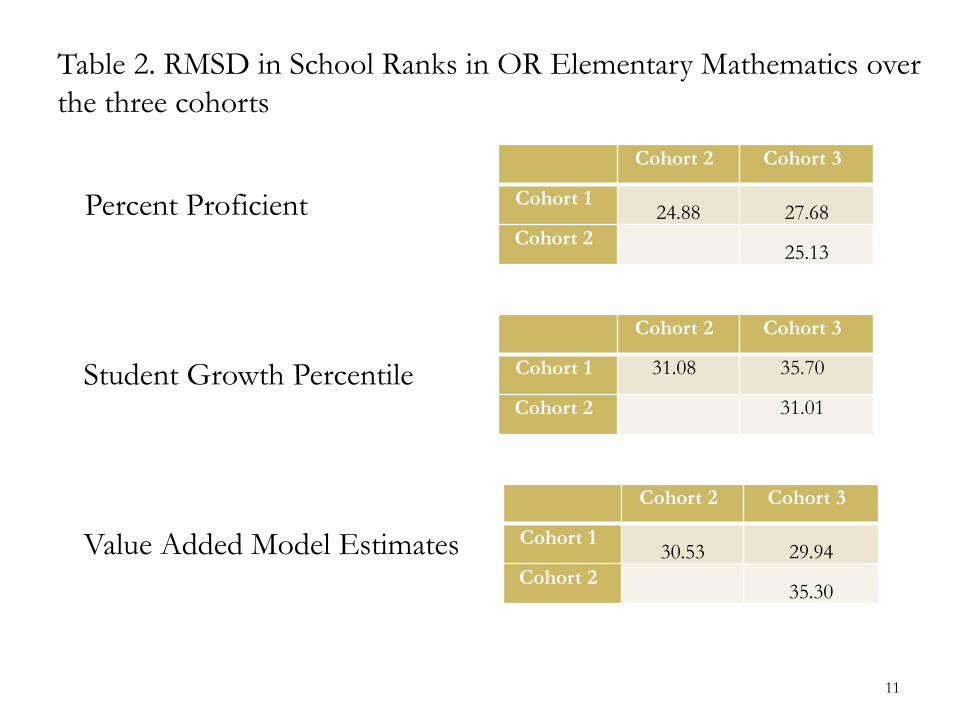
Cohort 2 Cohort 3
Cohort 124.88 27.68
Cohort 225.13
Percent Proficient
Table 2. RMSD in School Ranks in OR Elementary Mathematics over
the three cohorts
Student Growth Percentile
Value Added Model Estimates
Cohort 2 Cohort 3
Cohort 1 31.08 35.70
Cohort 2 31.01
Cohort 2 Cohort 3
Cohort 130.53 29.94
Cohort 235.30
12
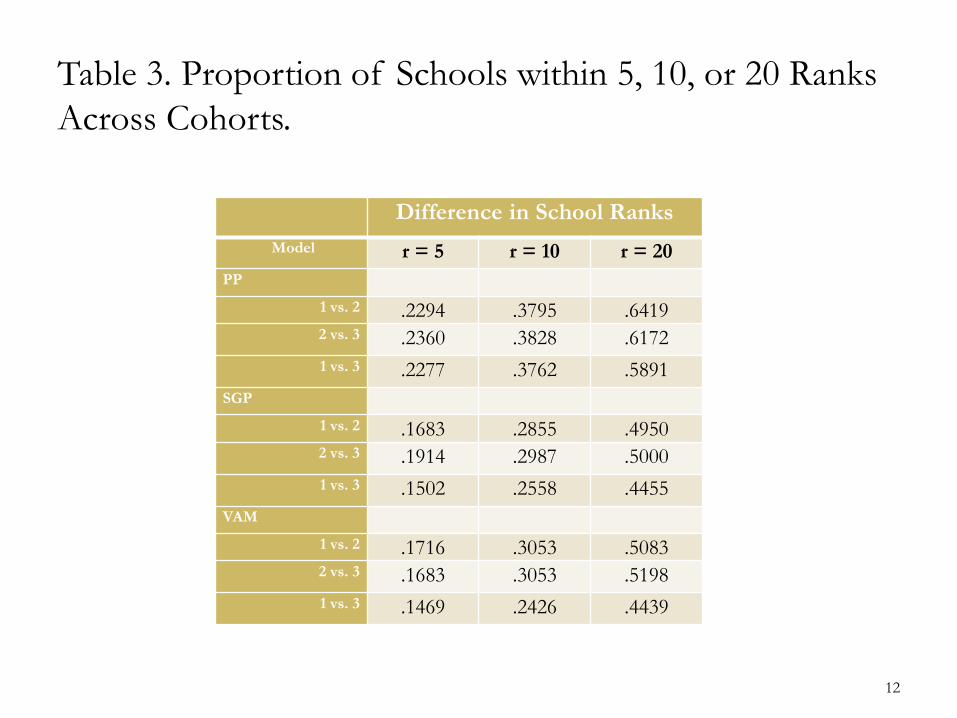
Table 3. Proportion of Schools within 5, 10, or 20 Ranks
Across Cohorts.
Difference in School Ranks
Model r = 5 r = 10 r = 20
PP
1 vs. 2 .2294 .3795 .64192 vs. 3 .2360 .3828 .6172
1 vs. 3 .2277 .3762 .5891
SGP
1 vs. 2 .1683 .2855 .49502 vs. 3 .1914 .2987 .5000
1 vs. 3 .1502 .2558 .4455
VAM
1 vs. 2 .1716 .3053 .50832 vs. 3 .1683 .3053 .5198
1 vs. 3 .1469 .2426 .4439
13
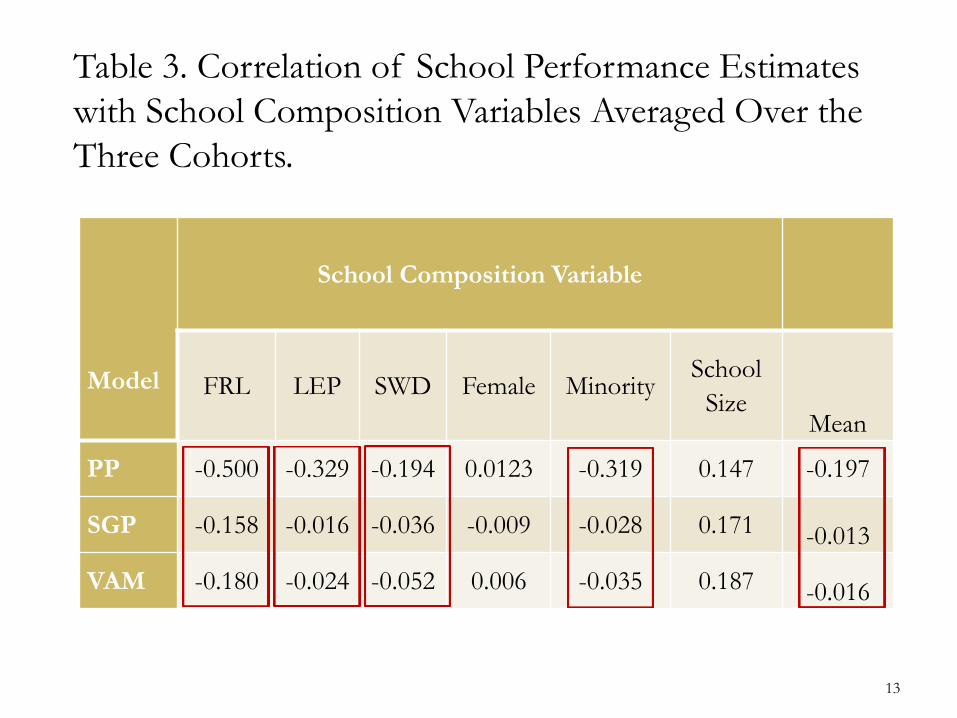
Model
School Composition Variable
FRL LEP SWD Female MinoritySchool
SizeMean
PP -0.500 -0.329 -0.194 0.0123 -0.319 0.147 -0.197
SGP -0.158 -0.016 -0.036 -0.009 -0.028 0.171 -0.013
VAM -0.180 -0.024 -0.052 0.006 -0.035 0.187 -0.016
Table 3. Correlation of School Performance Estimates
with School Composition Variables Averaged Over the
Three Cohorts.
14
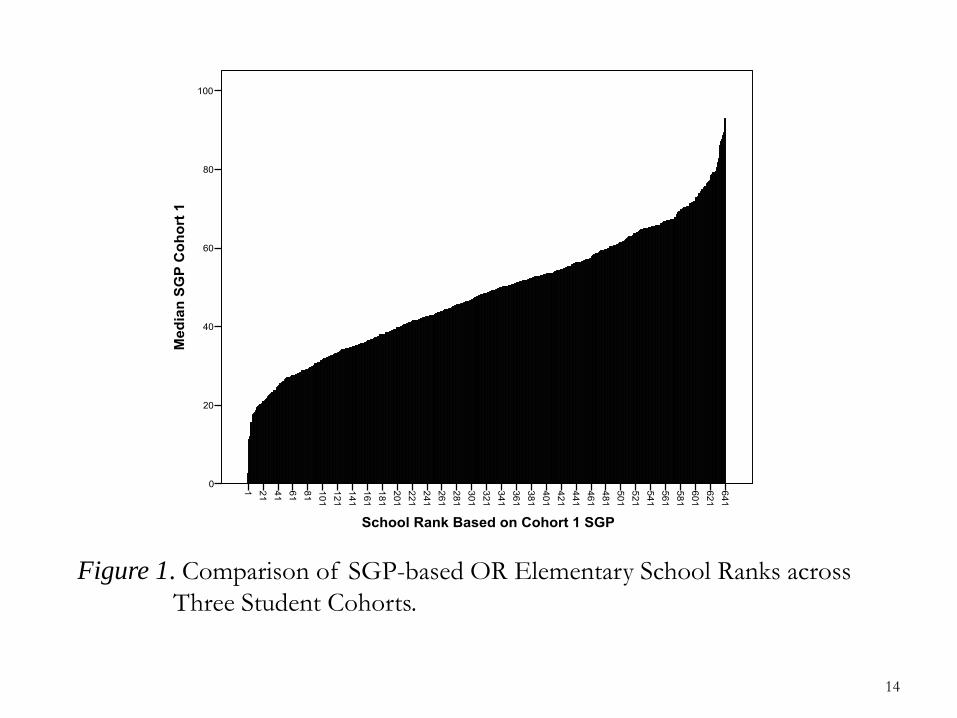
Figure 1. Comparison of SGP-based OR Elementary School Ranks across
Three Student Cohorts.
15
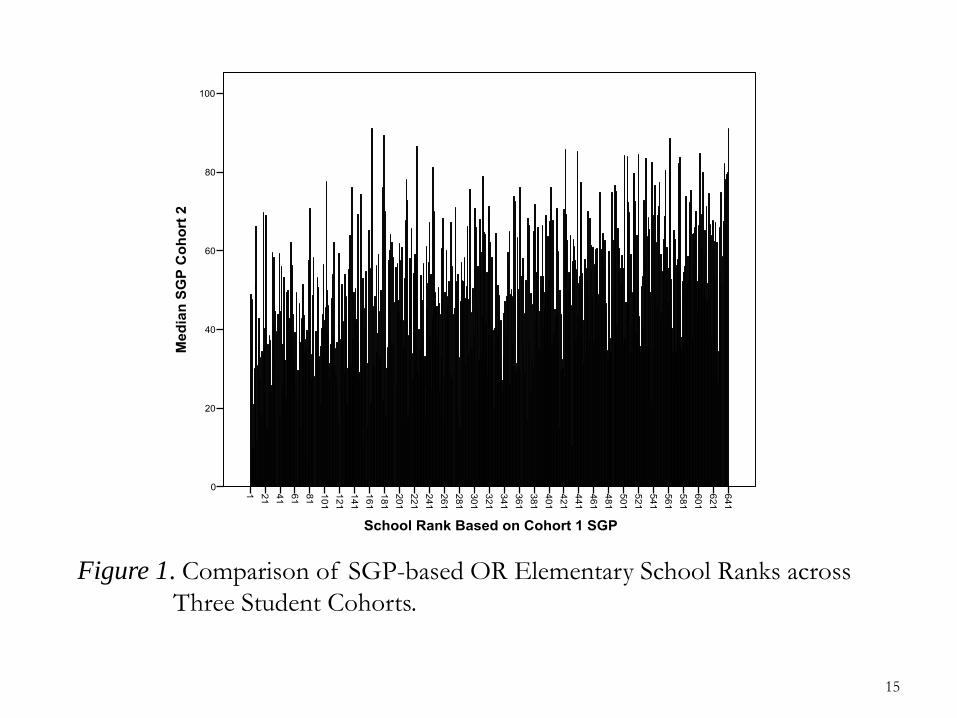
Figure 1. Comparison of SGP-based OR Elementary School Ranks across
Three Student Cohorts.

16
Figure 1. Comparison of SGP-based OR Elementary School Ranks across
Three Student Cohorts.

Summary and Conclusions
Results showed substantial variability in estimates of
school performance across different cohorts of students
Raises questions about how well the NCLB metric, PP,
and more recent SGP and VAM models can:
Accurately attribute school performance estimates to schools
Effectively discriminate school performance from other
factors like:
Variation in the composition and characteristics of one student cohort
versus other cohorts
Ability level of one cohort vs. another
17

Summary and Conclusions
Correlations of school composition variables with
school performance measures was:
Higher for NCLB PP than SGP or VAM model estimates
Suggests that models like SGP and VAM that take
account of prior achievement performance may control
better for extraneous variables unrelated to school
performance
Our results consistent with small literature that shows:
Cohort instability
Lack of agreement among alternative models
Choice of model matters!
18
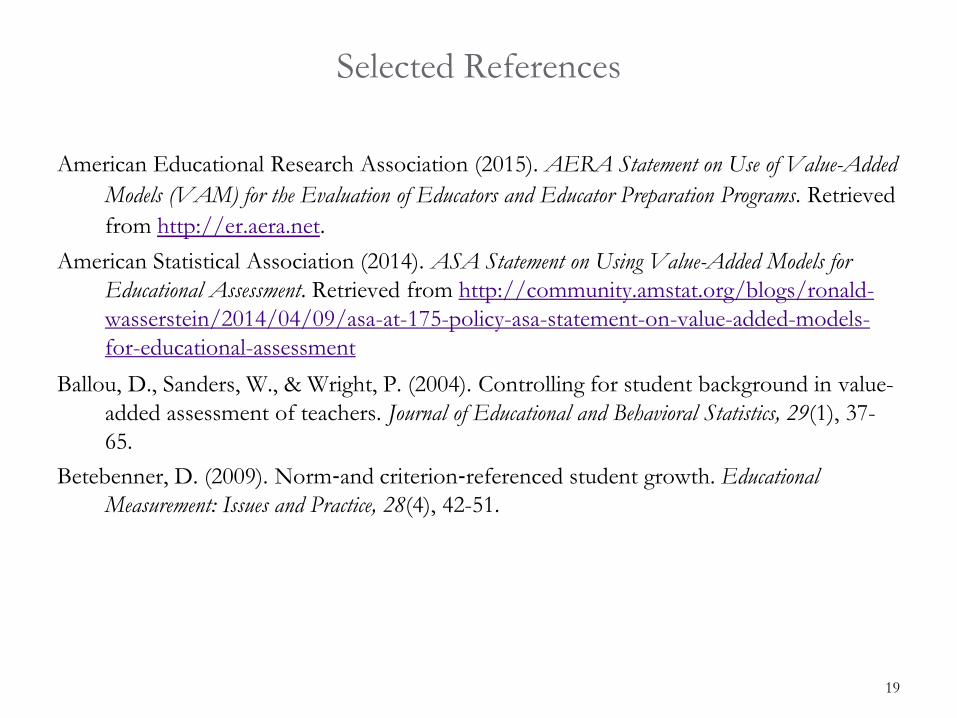
Selected References
American Educational Research Association (2015). AERA Statement on Use of Value-Added
Models (VAM) for the Evaluation of Educators and Educator Preparation Programs. Retrieved
from http://er.aera.net.
American Statistical Association (2014). ASA Statement on Using Value-Added Models for
Educational Assessment. Retrieved from http://community.amstat.org/blogs/ronald-
wasserstein/2014/04/09/asa-at-175-policy-asa-statement-on-value-added-models-
for-educational-assessment
Ballou, D., Sanders, W., & Wright, P. (2004). Controlling for student background in value-
added assessment of teachers. Journal of Educational and Behavioral Statistics, 29(1), 37-
65.
Betebenner, D. (2009). Norm‐and criterion‐referenced student growth. Educational
Measurement: Issues and Practice, 28(4), 42-51.
19

Appendices
Appendix A. Correlations among School Performance
Estimates for Middle School Mathematics and
Elementary and Middle School Reading.
Appendix B. Correlation of School Performance
Estimates for Middle School Mathematics and
Elementary and Middle School Reading.
20
21
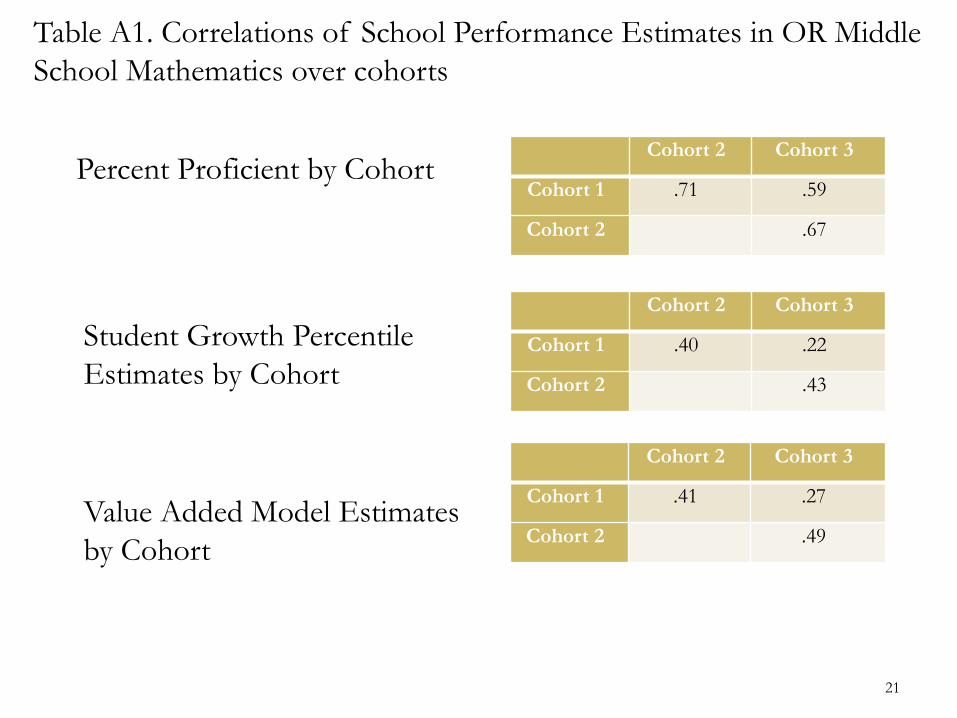
Cohort 2 Cohort 3
Cohort 1 .71 .59
Cohort 2 .67
Percent Proficient by Cohort
Table A1. Correlations of School Performance Estimates in OR Middle
School Mathematics over cohorts
Student Growth Percentile
Estimates by Cohort
Value Added Model Estimates
by Cohort
Cohort 2 Cohort 3
Cohort 1 .40 .22
Cohort 2 .43
Cohort 2 Cohort 3
Cohort 1 .41 .27
Cohort 2 .49
22
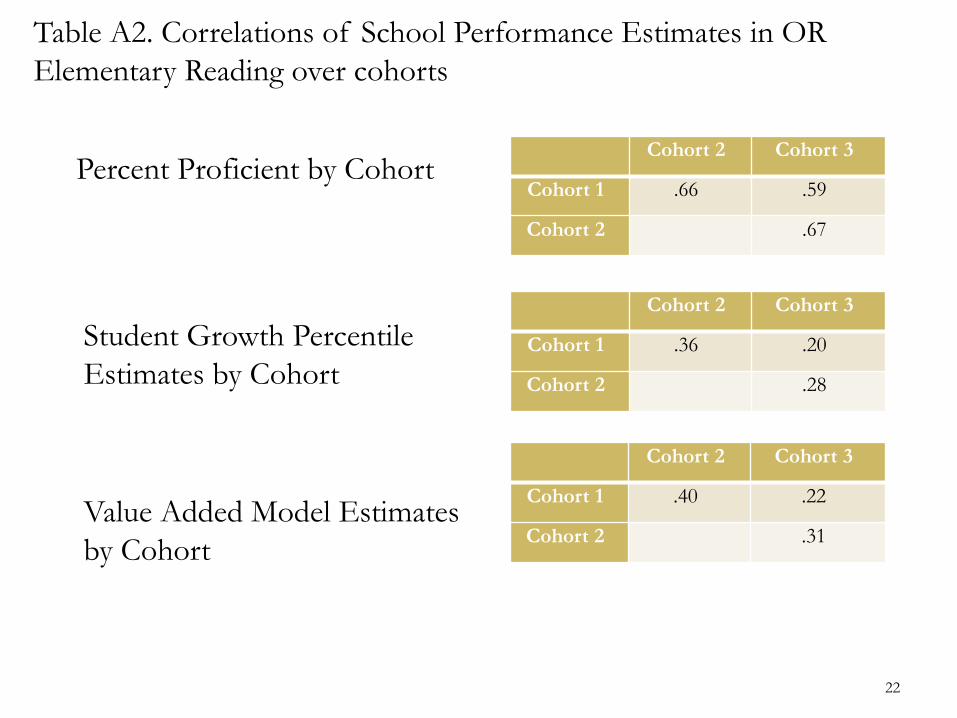
Cohort 2 Cohort 3
Cohort 1 .66 .59
Cohort 2 .67
Percent Proficient by Cohort
Table A2. Correlations of School Performance Estimates in OR
Elementary Reading over cohorts
Student Growth Percentile
Estimates by Cohort
Value Added Model Estimates
by Cohort
Cohort 2 Cohort 3
Cohort 1 .36 .20
Cohort 2 .28
Cohort 2 Cohort 3
Cohort 1 .40 .22
Cohort 2 .31
23
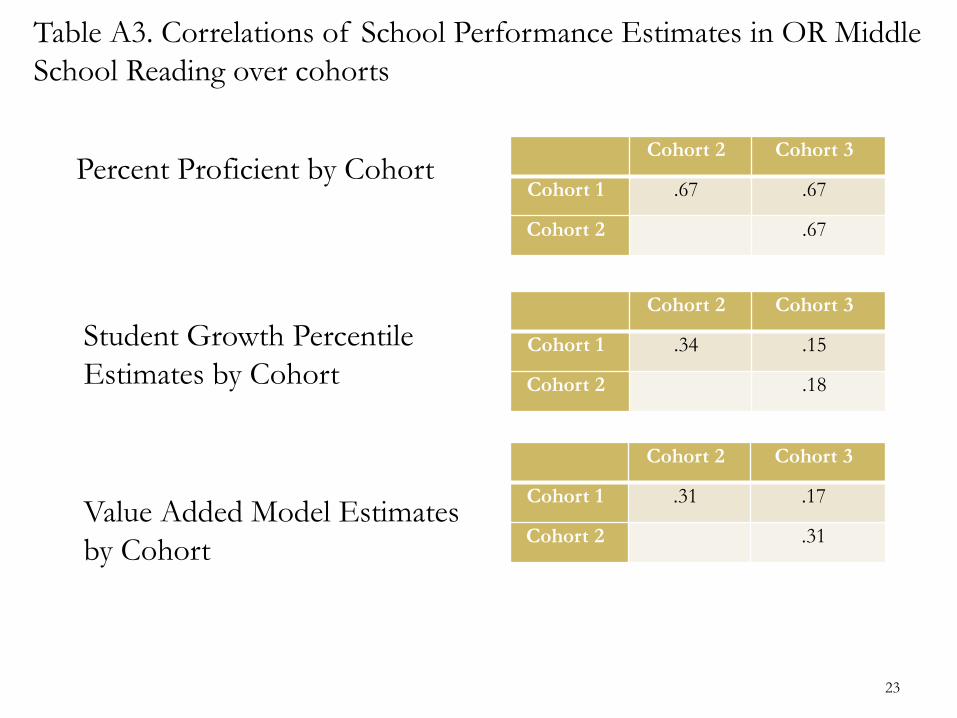
Cohort 2 Cohort 3
Cohort 1 .67 .67
Cohort 2 .67
Percent Proficient by Cohort
Table A3. Correlations of School Performance Estimates in OR Middle
School Reading over cohorts
Student Growth Percentile
Estimates by Cohort
Value Added Model Estimates
by Cohort
Cohort 2 Cohort 3
Cohort 1 .34 .15
Cohort 2 .18
Cohort 2 Cohort 3
Cohort 1 .31 .17
Cohort 2 .31
24
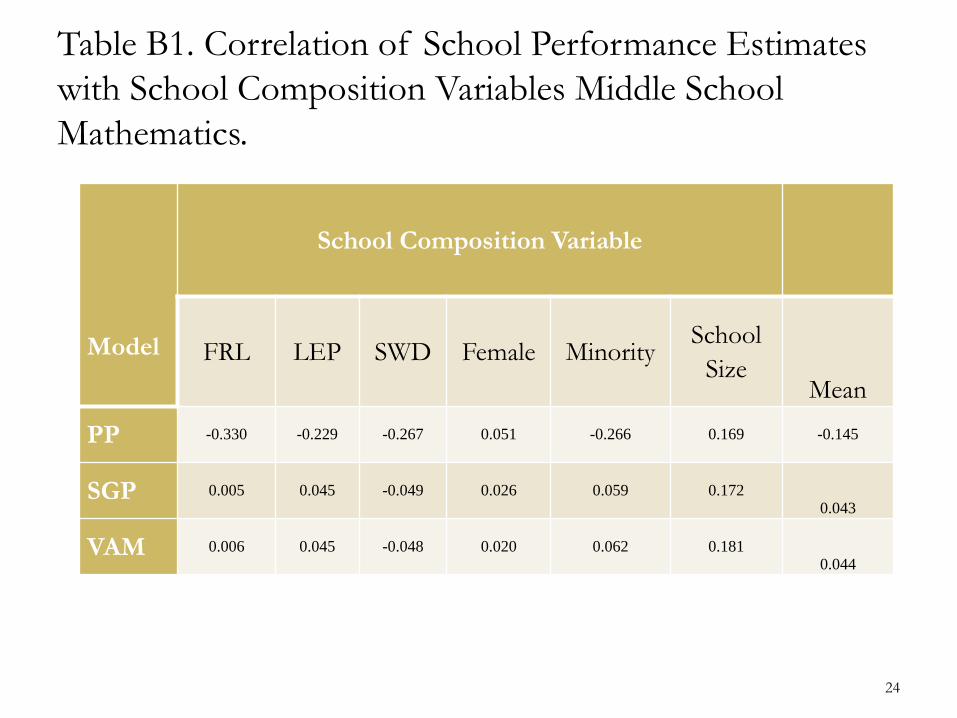
Model
School Composition Variable
FRL LEP SWD Female MinoritySchool
SizeMean
PP -0.330 -0.229 -0.267 0.051 -0.266 0.169 -0.145
SGP 0.005 0.045 -0.049 0.026 0.059 0.1720.043
VAM 0.006 0.045 -0.048 0.020 0.062 0.1810.044
Table B1. Correlation of School Performance Estimates
with School Composition Variables Middle School
Mathematics.

25
Model
School Composition Variable
FRL LEP SWD Female MinoritySchool
SizeMean
PP -0.600 -0.526 -0.204 0.002 -0.492 0.064 -0.293
SGP -0.210 -0.061 -0.041 -0.003 -0.105 0.110 -0.052
VAM -0.258 -0.110 -0.059 0.008 -0.141 0.125 -0.072
Table B2. Correlation of School Performance Estimates
with School Composition Variables Elementary Reading.
26
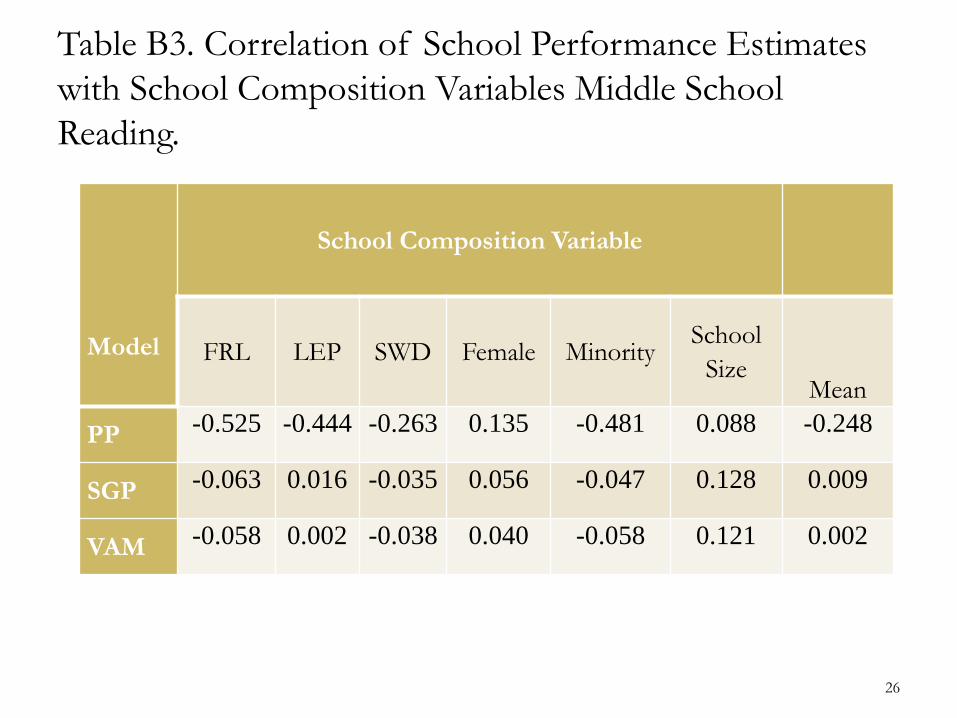
Model
School Composition Variable
FRL LEP SWD Female MinoritySchool
SizeMean
PP -0.525 -0.444 -0.263 0.135 -0.481 0.088 -0.248
SGP -0.063 0.016 -0.035 0.056 -0.047 0.128 0.009
VAM -0.058 0.002 -0.038 0.040 -0.058 0.121 0.002
Table B3. Correlation of School Performance Estimates
with School Composition Variables Middle School
Reading.