genome wide association study of soybean [(glycine max (l
TRANSCRIPT
Genome Wide Association Study of Soybean [(Glycine max (L.) Merr.] Germplasm
Derived from Canadian X Chinese Crosses to Mine for Unique Seed-Yield Alleles
by
Jagoda Arachchige Chanditha Sarith Priyanatha
A Thesis
presented to
The University of Guelph
In partial fulfilment of requirements
for the degree of
Master of Science
in
Plant Agriculture
Guelph, Ontario, Canada
© Chanditha Priyanatha, August, 2021
ABSTRACT
GENOME WIDE ASSOCIATION STUDY OF SOYBEAN [(GLYCINE MAX (L.) MERR.]
GERMPLASM DERIVED FROM CANADIAN X CHINESE CROSSES TO MINE FOR
UNIQUE SEED-YIELD ALLELES
Chanditha Priyanatha
University of Guelph, 2021
Advisor:
Dr. Istvan Rajcan
The phenotypic and genotypic evaluation of exotic soybean [(Glycine max (L.) Merr.]
germplasm could help widen the North American germplasm pool. The objective of this thesis was
to identify novel alleles underlying seed yield, seed protein and oil concentration from a genomic
diversity panel consisting of recombinant inbred lines (RIL) derived from several generations of
bi-parental crosses between elite Canadian x Chinese cultivars (CD-CH). A total of 200 genotypes
were evaluated in the field at Elora and Woodstock, Ontario, in 2019 and 2020. For seed yield, the
CD-CH genotypes yielded significantly more than the elite Canadian and Chinese genotypes. For
oil and protein concentrations, the performance of CD-CH group was similar to that of elite
Canadian cultivars. A putative candidate gene was identified for each of the evaluated traits.
Elucidation of the genetics underlying seed yield and seed quality traits from exotic germplasm
sources would greatly benefit future breeders in their efforts for continued improvement of the
crop.
iii
ACKNOWLEDGEMENTS
I would like to thank my advisor, Dr. Istvan Rajcan, for his tremendous support and
constant encouragement throughout my degree.
I would also like to express my sincerest thanks to Dr. Milad Eskandari, and Dr. Flavio
Schenkel for serving on my MSc advisory committee and providing feedback and their expertise
throughout the process.
During the past two years, I have been blessed to have help from the soybean field crew,
as well as lab staff, who contributed directly to my research, notably Chris Grainger, Davoud
Torkamaneh, Yesenia Salazar, Martha Jiminez, Mei Wu, Colbey Templeman Sebben, Cory
Schilling, Lin Liao, Reid Buchanan, Aria del Brocco, Brenda Zai, and Hayden Mitchell.
I would also like to acknowledge the funding partners without whose support none of this
research would have manifested, namely Canadian Agricultural Partnership, Grain Farmers of
Ontario, and Canadian Field Crop Research Alliance.
Lastly, I would like to share my heartfelt gratitude with my friends and roommates who
supported me through the thick of it all, and of course my parents, who continue to guide me on
the best way forward no matter what I set myself upon. Thank you all for supporting me.
iv
TABLE OF CONTENTS
Abstract ........................................................................................................................................... ii
Acknowledgements ........................................................................................................................ iii
Table of Contents ........................................................................................................................... iv
List of Tables ................................................................................................................................ vii
List of Figures .............................................................................................................................. viii
List of Abbreviations ..................................................................................................................... ix
Chapter 1: General Introduction and Literature Review ................................................................. 1
1.2. Literature Review..................................................................................................................... 3
1.2.1 Introduction .................................................................................................................... 3
1.2.2. Soybean Genetics .......................................................................................................... 5
1.2.3. Diversity loss or false alarm? The history of breeding elite cultivars .......................... 7
1.2.4. Exotic germplasm and their contributions .................................................................. 10
1.2.5. Soybean yield, agronomic traits, and their importance ............................................... 13
1.2.6. Soybean seed components and their importance ........................................................ 15
1.2.7. GWAS, marker types, their advantages, and limitations ............................................ 18
1.2.8. QTL from Crosses of Chinese and Canadian Elite Cultivars ..................................... 25
1.2.9. GWAS of Canadian x Chinese soybeans .................................................................... 26
1.2.10. Hypotheses: ............................................................................................................... 27
1.2.11. Objective: .................................................................................................................. 27
Chapter 2. Phenotypic evaluation of Canadian x Chinese elite germplasm in a diversity panel
for Seed Yield and Seed-Quality Traits ........................................................................................ 28

v
2.1. Introduction ........................................................................................................................ 29
2.2. Materials and Methods ....................................................................................................... 32
2.2.1. Plant material and experimental design ...................................................................... 32
2.2.2. Phenotypic Data Collection ........................................................................................ 33
2.2.3. DNA extraction and Genotyping-by-sequencing........................................................ 34
2.2.4. Statistical Analysis ...................................................................................................... 35
2.3. Results ................................................................................................................................ 36
2.3.1. Seed Yield (kg/ha) ...................................................................................................... 36
2.3.2. Seed-quality Traits - Protein Concentration ............................................................... 38
2.3.3. Seed-quality Traits: Oil Concentration ....................................................................... 39
2.3.4. Correlation analysis between seed yield, seed-quality traits, and agronomic traits .... 39
2.3.5. Correlation analysis between environments for seed yield, seed protein and seed oil
concentration ......................................................................................................................... 40
2.4. Discussion .......................................................................................................................... 41
Chapter 3. GWAS of Soybean Germplasm derived from Canadian x Chinese Crosses to mine for
seed yield, seed oil and seed protein alleles. ................................................................................. 57
3.1. Introduction ........................................................................................................................ 58
3.2. Materials and methods ....................................................................................................... 61
3.2.1. Plant materials ............................................................................................................. 61
3.2.2. DNA extraction ........................................................................................................... 61
3.2.3. Gentoyping and SNP Calling ...................................................................................... 62
3.2.4. GWAS ......................................................................................................................... 63
3.2.5. Candidate Gene Search ............................................................................................... 63
3.3. Results ................................................................................................................................ 64
3.3.1. Genotyping and SNP Calling ...................................................................................... 64
vi
3.3.2. GWAS and candidate gene search .............................................................................. 64
3.4. Discussion .......................................................................................................................... 67
Chapter 4: General Discussion and Conclusions .......................................................................... 82
4.1. General summary ............................................................................................................... 82
4.2. Limitations ......................................................................................................................... 84
4.3. Future directions ................................................................................................................ 84
References ..................................................................................................................................... 86
Appendix 1. ................................................................................................................................... 99
vii
LIST OF TABLES
Table 2.1. Summary of the combined environment analysis of soybean yield, seed quality and
agronomic trait evaluation of Canadian x Chinese genomic diversity panel for 2019-2020.
….…….…………………………………………………………………………………………..46
Table 2.2. Summary of soybean seed yield (kg/ha), seed protein and seed oil concentration for the
four environments: Elora 2019, Elora 2020, Woodstock 2019, and Woodstock 2020.
…………………………………………………………………………………………………....47
Table 2.3. Type III tests of fixed effects for seed yield (kg/ha), seed protein concentration and seed
oil concentration for combined environment analysis. ………….……………………………….48
Table 2.4. Least square means for seed yield (kg/ha), seed protein and seed oil concentration (dry
basis, %) and test of significance of differences for combined environment analysis.……….….49
Table 2.5. Top 10 highest yielding cultivars at Elora 2019, Elora 2020, Woodstock 2019, and
Woodstock 2020. ………………………………………………………………………………...50
Table 2.6. Least square means for soybean seed yield (kg/ha), seed protein and seed oil
concentration (dry basis, %) and test of significance of differences for the different genotypic
groups of GWAS panel across combined environment analysis. ….……………………...……...52
Table 2.7. Pearson Correlation Coefficients for soybean seed yield, seed oil concentration, seed
protein concentration, and agronomic traits. ………………………………………………….….53
Table 2.8. Pearson Correlation Coefficients for soybean seed yield (kg/ha) between Elora 2019,
Elora 2020, Woodstock 2019, and Woodstock 2020. …………………………………...……….54
Table 2.9. Pearson Correlation Coefficients for soybean seed protein concentration (dry basis, %)
between different environments: Elora 2019, Elora 2020, Woodstock 2019, and Woodstock 2020.
…………………………….…………………………………………………………………..….55
Table 2.10. Pearson Correlation Coefficients for soybean seed oil concentration (dry basis, %)
between Elora 2019, Elora 2020, Woodstock 2019, and Woodstock 2020. ………….…………56
Table 3.1. Significant associated genomic regions for soybean seed yield, seed protein and seed
oil concentrations detected in two-year combined environment GWAS analysis.
…………………………………………………………………………...……………………….72
Table 3.2. Significant associated genomic regions for the agronomic traits:100 seed weight, days-
to-maturity, plant height and lodging score, detected in combined environment GWAS analysis.
…………………………………………………………………………………………………....73
Table 3.3. Distribution of alleles in Canadian, Chinese, and CD-CH germplasm for soybean seed
yield, seed oil and protein concentration QTL.…………………………………………………..74
viii
LIST OF FIGURES
Figure 3.1. PCA depicting two major subpopulations and six minor subpopulations in the panel.
……………………………………………………………………………………........................76
Figure 3.2. Kinship matrix depicting the relationships among the GWAS panel members. …...77
Figure 3.3. The genome-wide average LD decay (R2) of the GWAS panel. …………………...78
Figure 3.4. Genome-wide SNP coverage showing the number of SNPs within 1Mb window size.
……………………………………………………………………………………………………79
Figure 3.5. Manhattan plots and corresponding Q-Q plots showing significantly associated SNPs
detected in combined environment GWAS analysis for soybean seed yield, seed protein and oil
concentration. ……………………………………………………………………………………80
Figure 3.6. Manhattan plots and corresponding Q-Q plots showing significantly associated SNPs
detected in combined environment GWAS analysis for the agronomic traits: 100-seed weight,
days-to-maturity, plant height and lodging score. ………………………………………………81
ix
LIST OF ABBREVIATIONS
AAFC, Agriculture and Agri-Food Canada
ANOVA, analyses of variance
CD, Canadian
CD-CH, Canadian x Chinese
CH, Chinese
Chr, chromosome
CMLM, compressed mixed linear model
CV, coefficient of variation
DTM, days to maturity
E, environment
ERS, Elora Research Station
FarmCPU, Fixed and random model Circulating Probability Unification
FEM, fixed effect model
G, genotype
GBS, genotyping-by-sequencing
GLM, general linear model
GSC, genetic similarity coefficient
GWAS, genome wide association study
GxE, genotype-by-environment
HAAS, Heilongjiang Academy of Agricultural Sciences
IBIS, Institut de Biologie Intégrative et des Systèmes
JAAS, Jilin Academy of Agricultural Sciences
x
K, subpopulation
Kb, kilo-base pair
kg ha-1, kilogram per hectare
LAAS, Liaoning Academy of Agricultural Sciences
LD, linkage disequilibrium
LSMEANS, least squared means
MABC, marker-assisted back crossing
MAF, minor allele frequency
MAS, marker assisted selection
MG, maturity group
MLM, mixed linear model
MLMM, multiple loci linear mixed model
NAM, nested-association mapping
NAU, Northeast Agricultural University
NIR, near infrared spectroscopy
nnRCBD, nearest neighbor randomized complete block design
PCA, principal component analysis
PH, plant height
Q-Q, quantile-quantile
QTL, quantitative trait locus
QTLSP, mega-environment specific quantitative locus
QTLU, mega-environment universal quantitative locus
r, Pearson’s correlation coefficient
r2, linkage disequilibrium value (squared allelic correlation)

xi
RADseq, restriction site-associated sequencing
REM, random effects model
RFLP, restriction fragment length polymorphisms (RFLP)
RIL, recombinant inbred line
SAS, Statistical Analysis System
SCN, soybean cyst nematode
SLAFseq, specific length amplified sequencing
SNP, single nucleotide polymorphism
SSR, simple sequence repeats
SW, 100-seed weight
USDA, United States Department of Agriculture
WRS, Woodstock Research Station
1
Chapter 1: General Introduction and Literature Review
1.1 General Introduction
There is growing concern that the current rate of gain is insufficient to meet the global crop
yield targets set by the United Nations for 2050 (Tilman et al. 2011; Ray et al. 2013). This problem
is further compounded by changes to climatic conditions and the genetic diversity available in elite
breeding pools (Oliver 2013; Kofsky et al. 2018; FAO 2020). Soybean [Glycine max. (L.) Merill.]
plays a significant role in human nutrition and food security, and is the third leading field crop in
Canada (Lee et al. 2013). Though consensus on whether the North American soybean germplasm
is narrow or not is divided, exotic germplasm continues to be a potentially viable source of novel
beneficial alleles and a potential solution to the problems surrounding food security and continued
crop improvement (Gizlice et al. 1993; Sneller et al. 2005; Hyten et al. 2006; Fu et al. 2007; Mikel
et al. 2010; Patil, S.S., Naik, M.R., Patil, A.B., and Ghodke 2011; Jeong et al. 2018).
Previous studies, utilizing recombinant inbred lines (RIL) derived from crosses between elite
Canadian cultivars elite exotic Chinese cultivars developed by the soybean breeding program led
by Dr. Istvan Rajcan, identified quantitative trait loci (QTL) governing seed yield, seed quality
traits, and agronomic traits (Palomeque et al. 2009b, a, 2010; Rossi et al. 2013). Since these studies
reported on QTL mapping conducted on a bi-parental population, a genome-wide association study
(GWAS) could potentially help identify novel alleles and overcome the limitations of QTL
mapping (Zhu et al. 2008). Building upon this previous research, the current thesis evaluated a
genomic diversity panel that included elite Canadian cultivars, elite exotic Chinese cultivars, and
soybean RILs described above. It was hypothesized that lines derived from the Canadian (CD) x
Chinese (CH) bi-parental crosses (CD-CH) contained beneficial novel genetic variation for yield,
2
and that genes and their alleles present in the germplasm of populations derived from CD-CH lines
could be identified in a genomic diversity panel using GWAS based on SNP markers. Field
evaluations were conducted in 2019 and 2020 at Elora and Woodstock, Ontario to evaluate the
yield potential, seed quality traits, agronomic trait performance and their correlations (Chapter 2).
A GWAS was conducted to identify novel alleles for seed yield, seed oil and seed protein
concentration, as well as agronomic traits, and potential candidate genes (Chapter 3). This thesis
provides a direct comparison of the performance of exotic elite soybean germplasm against
adapted elite Canadian cultivars in a diverse genotypic group and contribute to further our
understanding of the genetic potential of exotic soybean germplasm.

3
1.2. Literature Review
1.2.1 Introduction
Soybean [Glycine max. (L.) Merill.] was introduced to North America in 1765 by Samuel
Bowen (Hymowitz and Harlan 1983) and has grown steadily in its importance as an agricultural
commodity in both Canada and the United States. It was introduced to Ontario in 1893 as a hay
crop, with soybean breeding focusing on the improvement of forage yield of the early introductions
(Shurtleff and Aoyagi 2010). Being the third largest field crop in Canada, soybean production has
increased to 6.4 million metric tonnes in 2020 - a rise of 3.5% nationally (Statistics Canada 2020).
Furthermore, a 15.4% increase in yield helped offset a decrease of 10.1% in harvested area in
Canada; an important metric for sustainable agriculture and food security (FAO 2020). In Canada,
Ontario leads in growing soybeans, followed by Manitoba, Quebec, and Saskatchewan (Statistics
Canada 2020). According to crop production reports by Statistics Canada in 2020, Ontario
harvested 2.83 million acres of soybeans, with a yield of 50.7 bushels/acre. Though the area
harvested decreased from 2019, the yield increased from 44.1 bu/ac reported the year prior
(Statistics Canada 2020). Furthermore, based on market trends and supply vs. demand, Grain
Farmers of Ontario1 postulate that soybean acreage is likely to increase in 2021 (Ontario 2020).
These numbers highlight the importance of this oilseed crop for the province of Ontario, as well
as Canada as a whole.
Despite global trends of increasing production, Alston et al. (2005) found that yield growth
of soybean has slowed down globally from 1990 – 2007 when compared to previous years. Kofsky
11 https://gfo.ca/grain-market-commentary/ontario-grain-market-commentary-december-16-2020/
4
et al. (2018) stated that although global soybean production has more than doubled, the narrow
genetic base of G. max poses challenges in the effective development of environmentally resilient,
high-yielding cultivars that can withstand changing biotic and abiotic stresses. An alarming
development, especially given the current statistics reported by the World Food Program, which
reported in 2019 that 6.9% of the global population went hungry, a figure that had increased from
the previous five years. Furthermore, the Covid-19 global pandemic, along with other
environmental and climate considerations pose significant challenges to ensuring food security
and nutrition in the 21st century (Oliver 2013; Kofsky et al. 2018; FAO 2020).
Tilman et al. (2011) and Ray et al. (2013) stated that the current rate of gain is insufficient
to meet the global crop yield targets set by the United Nations for 2050 to feed the ever-growing
human population. Soybean and other legume crops play significant roles in human nutrition and
food security due to their nutrition profiles and other benefits such nitrogen fixation and soil
enrichment (Lee et al. 2013). Moreover, nutraceuticals found in soybean seed and other
leguminous crops render health benefits such as: prevention of cardiovascular diseases, obesity,
diabetes mellitus, cancer, and relief of menopausal symptoms (Messina 1999, 2016). Climate
change poses a great concern with the development of resilient crop cultivars becoming a major
focus for breeders in the new century (Oliver 2013; Kilian et al. 2020). To tackle climatic
considerations, biotic and abiotic stressors, and to address issues surrounding the perceived lack
of genetic diversity, it has been suggested that the inclusion of exotic or under-utilized germplasm
could serve as a potential solution (Sneller et al. 2005; Fox et al. 2015; Wang et al. 2017; Kofsky
et al. 2018; Gaire et al. 2020; Kilian et al. 2020).
5
Despite concerns regarding the lack of genetic diversity in commercial soybean breeding
programs, Sneller et al. (2005) suggested that there may still be sufficient genetic diversity left in
elite germplasm to warrant continued improvements. However, the same authors cautioned that
careful management of the breeding pool is necessary to integrate the existing diversity to
maximize yield gains (Sneller et al. 2005). Nevertheless, the literature appears to be divided on
whether there is sufficient genetic diversity to continue driving yield gains (Gizlice et al. 1993; Fu
et al. 2007; Mikel et al. 2010; Patil, S.S., Naik, M.R., Patil, A.B., and Ghodke 2011; Jeong et al.
2018). A combination of agronomic factors in tandem with genetic yield gain has been suggested
(Koester et al. 2014), while others (Patil et al. 2011) suggested that breeders utilize divergent
parents from different genotypic clusters to combine desirable alleles and further enhance the gene
pool available to breeders.
1.2.2. Soybean Genetics
In modern molecular breeding, the identification of molecular markers associated with a
trait of interest is one of the first steps to be taken (Karikari et al. 2020). Advancements in
molecular techniques opened novel ways to investigate the genetic diversity of soybeans across
the planet in a very efficient manner. Next-generation sequencing technology has helped the rapid
advance of our understanding of the underlying genetic-phenotypic relationships between different
traits of important commercial crops (Elshire et al. 2011; Patil et al. 2017, 2018; Kong et al. 2018).
Analysis of genetic variation in crop diversity panels can be achieved through techniques such as
whole-genome sequencing, exome capture, RNA sequencing, reduced representation
resequencing, and most recently genome-wide association studies (Li et al. 2009; Jiménez-Gómez
2011; Sonah et al. 2013; Torkamaneh and Belzile 2015; Patil et al. 2018; Schreiber et al. 2018).
6
Genetic maps, in that regard, facilitate thorough understanding of the underlying genetic basis for
structural and functional roles of the genome. The development of linkage maps with associated
markers aided in our understanding of the inheritance of both simple and complex traits (Bernatzky
and Tanksley 1986). Numerous soybean genetic maps have been constructed utilizing a range of
available molecular techniques with increasing precision (Shoemaker and Specht 1995; Song et
al. 2004; Mimura et al. 2007; Qi et al. 2014; Wang et al. 2018; Zhang et al. 2018c). Genetic maps
based on linkage analysis are constructed on the principle that alleles in close physical proximity
to one another are inherited together, as recombination follows an inverse relationship with the
physical distance between alleles and loci (Nielsen and Zaykin 2001). Thus, a gene responsible for
a trait of interest is mapped by the detection of marker loci with loci which segregate with the trait
of interest (Nielsen and Zaykin 2001).
The type and the number of polymorphic markers used in the construction of a genetic map
can influence its’ utility and applications. Soybean genetic maps have been constructed using
various molecular markers such as restriction fragment length polymorphisms (RFLP) markers,
simple sequence repeats (SSR) and single nucleotide polymorphism (SNP) markers (Cai et al.
2018). Moreover, the use of SNP markers has greatly enhanced the resolution achieved in genetic
maps, and consequently led to the development of cost-effective methods such as: RADseq
(Restriction site-associated sequencing), double digest RADseq, genotyping-by-sequencing
(GBS), and SLAFseq (Specific length amplified sequencing) (Wu et al. 2010; Qi et al. 2014;
Wang et al. 2016). Genetic maps constructed from SALFseq markers have been reported to have
smaller average distances compared to other methods (Qi et al. 2014). Current advancements have

7
led to higher resolution mapping, which in turn has resulted in more accurate mapping of
quantitative trait loci (QTL) - genomic regions responsible for the variation of a quantitative trait.
1.2.3. Diversity loss or false alarm? The history of breeding elite cultivars
The recurrent use of a small population of elite commercial cultivars in breeding programs
has resulted in reduced diversity in field crops (Mikel et al. 2010; Keilwagen et al. 2014). Ample
evidence is found within the literature that highlights concerns regarding the narrowness and
potentially detrimental implications of the North American soybean germplasm (Gizlice et al.
1993; Kisha et al. 1998; Fu et al. 2007; Mikel et al. 2010; Barabaschi et al. 2012). Barabaschi et
al. (2012) reported that the greater allelic diversity observed in wild soybeans, which is largely
absent from the commercial soybean cultivars, could potentially represent and contribute valuable
genetic content.
Bilyeu and Beuselinck (2005) reported that all accessions they investigated within the
collection of North American germplasm from the USDA contained the chloroplast haplotype #49,
which the authors cited as evidence for divergent clusters and ancestral North American soybean
germplasm sharing a common soybean chloroplast haplotype. Delannay et al. (1983) investigated
the genetic contributions via coefficient of parentage; a measure of genetic relatedness between
different individuals, in 158 American and Canadian public soybean varieties. They found that all
the lines traced back to 50 plant introductions. Furthermore, the authors stated that an investigation
of geographical origin re-affirmed the narrowness of soybean germplasm at the time of
publication, and that the constitution of North American soybean germplasm has changed little
over time. Different patterns have been observed in the way genetic diversity within the North
American soybean germplasm was distributed – including an observed North-South axis for the
8
United States (Gizlice et al. 1993, 1994), as well as maturity group (MG) clustering (Cui et al.
2000). Fu et al. (2007) reported that the variation among SSR markers were higher between exotic
germplasm compared to the Canadian elite cultivars, which had much lower diversity. The authors
also reported that compared to older Canadian cultivars, recent cultivars contained better genetic
diversity. In 2011, the diversity within Canadian soybean germplasm was explored using SSR
markers, where soybean lines from a private breeding program were compared to exotic
germplasm from several foreign geographic regions (Iquira et al. 2010). Based on principal
coordinate analysis (PCA), genetic distance matrix and UPGMPA cluster analysis, Iquira et al
(2010) concluded that the Canadian soybean germplasm contained less diversity compared to the
exotic germplasm that they had investigated. The narrow genetic base of elite germplasm has been
cautioned to potentially result in genetic vulnerability to emerging biotic and abiotic stress
(Mickelbart et al. 2015).
Contrary to the notion that the genetic narrowness of soybean results from breeding
strategies; Hyten et al. (2006) argue that the genetic narrowness in soybean maybe attributed to
the low diversity observed in the wild progenitor G. soja, combined with domestication bottlenecks
that resulted in further losses of more than 50% of genetic variation. However, the authors
acknowledged that domestication bottlenecks resulted in a loss of 81% of rare alleles, 60% change
in gene allele frequency, and nearly halved the nucleotide diversity (π) from G. soja (π = 2.47 ×
10−3) to landrace (π = 1.47 × 10⁻³), with further losses in genetic diversity accrued through
intense selection in the development of elite cultivars (Hyten et al. 2006).
Selective sweeps occur because of phenotypic selection and results in the retention and
fixation of the beneficial alleles that confer selective advantages. The detection of selective sweeps
9
can relay valuable information about the domestication and selection history of an organism
(Nurminsky 2005). Zhou et al. (2015) scanned genomic regions with extreme allele frequency
differentiation over extended linked regions to identify selective sweeps during soybean
domestication and subsequent improvement. They found a total of 121 domestication-related and
another 109 improvement-related sweeps. Furthermore, their analysis revealed that nearly 50% of
the resistance related genes found in G. soja were absent in landraces or domesticated soybean,
further highlighting the loss of genetic diversity that occurred during domestication and crop
improvement. Zhou et al. (2015) also reported that they detected selection signals in almost all
previously reported domestication-related QTL regions. These findings are similar to those by Han
et al. (2016), whose study investigated agronomically important traits, their genomic regions and
the domestication footprint underlying these traits. Han et al. (2016) evaluated a total of 512
soybean accessions, which included 404 G. max cultivars (fully domesticated), 36 G. gracilis
accessions (semi-domesticated), and 72 G. soja accessions (non-domesticated). They found
significant reductions in diversity compared with the non-domesticated group, a total of 111 fully
domesticated and 39 semi-domesticated selective footprints in highly differentiated genomic
regions. Additionally, 44 regions in the fully domesticated group showed significant reductions in
diversity compared to the semi-domesticated group. The authors concluded that these too are the
results of strong selective sweeps.
Selection based on morphological features during domestication and improvement may
have occurred at different evolutionary stages. Kofsky et al. (2018) suggested that these
morphological characters in elite cultivars are genetically controlled by a combined effect of the
genomic regions that were lost or subjected to selective sweeps during artificial selection and
10
domestication. Moreover, Kofsky et al. (2018) highlighted that it may be possible to re-introduce
these genetic variations by introgression of favourable alleles from G. soja, while balancing
important agricultural and agronomic traits.
The need to introgress novel alleles into elite cultivars, either from exotic or wild type
soybeans to broaden the North American soybean germplasm and introduce much needed genetic
variation has been repeatedly highlighted in the literature (Ehlers and Foster 1993; Sneller et al.
2005; Bernardo 2009; Ochanda et al. 2009; Fox et al. 2015; Cowling et al. 2017; Wang et al. 2017;
Kofsky et al. 2018; Gaire et al. 2020).
1.2.4. Exotic germplasm and their contributions
Exotic germplasm from elite adapted germplasm x domesticated plant introductions (PI),
or elite adapted germplasm x un-adapted soybean cultivars can lend more genetic variability, than
that arising from crosses between elite x elite parents. However, such genetic contributions so far
have failed to manifest in increased yield potential (Feng et al. 2011).
Though the yield potential of G. max is superior to that of G. soja due to strong selection
for this complex trait, one study identified a QTL in G. soja correlated with improved yield, which
was QTL mapped from a cross population of G. soja with G. max on chromosome 14. This QTL
was reported to be responsible for a 9.4% yield advantage and was validated in two elite genetic
backgrounds (Concibido et al. 2003). Soybean cyst nematode (SCN) is the most devastating
soybean pest in cultivated soybeans. Though resistance to SCN has come from two major SCN
resistance QTL (rhg1 on chr.18 or Rhg4 on chr.8) identified in G. max, two different SCN-
resistance QTL (cqSCN-006 on chr.15 and cqSCN-007 on chr.18) were identified in G. soja
11
genotype PI468916 (Kim et al. 2011). Such discoveries provide potentially novel or alternative
genetic sources to help combat biotic stresses. With further studies and fine mapping attempts, our
understanding of the genetic contributions from exotic or wild genotypes are likely to grow.
Despite the decrease in yield gain as the percentage of plant introductions increased in
soybean populations (Vello et al. 1984; St. Martin and Asiam 1986; Ininda et al. 1996), support
for the use of exotic germplasm to increase yield and genetic diversity has been reported (Kabelka
et al. 2004; Guzman et al. 2007; Palomeque et al. 2009a). Improved access and efficient utilization
of a broad range of genetic variation could potentially help identify novel allelic variation, which
would help to address challenges posed by narrow genetic base (Mickelbart et al. 2015; Wang et
al. 2017). Wang et al. (2017) stated that “efficient exploitation of exotic germplasm in changing
environments depends on (i) how well exotic germplasm has been collected, evaluated, and
documented; (ii) how rapidly breeders can identify useful genetic variation; and (iii) how
efficiently beneficial genetic variation can be incorporated into elite germplasm”. Additionally,
Wang et al. (2017) reported that exotic germplasm is under-utilized by plant breeders due to a lack
of identification and transfer of beneficial alleles into elite germplasm.
Upon identification of exotic accessions containing desirable traits, major genes from
exotic germplasm can be introgressed via different breeding methods, such as repeated back-
crosses (Ehlers and Foster 1993; Wang et al. 2017). Ochanda et al. (2009) investigated selection
before backcrossing to evaluate introgression of exotic germplasm in sorghum and recommended
against selection before a back-cross. Bilyeu and Beuselinck (2005) investigated North American
germplasm obtained from the USDA and found many plant introductions that contained favorable
alleles rendering resistance to soybean cyst nematode. Bernardo (2009) stated that genome-wide

12
selection for six to seven generations was necessary for effective introgression of exotic alleles
into elite cultivars in maize, based on simulation studies.
Major genes can be introgressed from elite or wild genotypes via marker-assisted
backcrossing or genome editing technologies (Wang et al. 2017). However, complex traits such as
yield pose challenges for successful introgression due to their polygenic nature. Genome-wide
selection has been highlighted to help select polygenic traits to maximize yield gains and lessen
the yield gap reported to exist between elite and exotic material (Longin and Reif 2014). In
addition, advanced breeding techniques such as marker-assisted back crossing (MABC) and
genomic selection can increase the efficiency of introgression and reduce the linkage drag that can
occur (Kofsky et al. 2018). Cowling et al. (2017) proposed that rapid cycles of recurrent selection
is likely to increase effective recombination rates, can help break up linkage blocks, and reduce
linkage drag when compared to extensive backcrossing. Additionally, it was proposed also that an
active pre-breeding in populations of exotic and elite lines undergoing optimal contribution
selection (OCS) for long-term genetic gain while retaining genetic diversity (Cowling et al. 2017).
By intermating elite and exotic lines, the exotic genes are introduced to the field in a semi-adapted
genetic background. The methods developed and described by Cowling et al. (2017) are potentially
valuable for self-pollinating grain legumes.
The common perception is that the development of cultivars with novel genetic diversity
and high yield potential is challenging or cumbersome, Akpertey et al. (2014) were able to develop
backcross lines with G. soja germplasm that were equivalent to G. max recurrent parent. These
findings lend further incentive for the utilisation of exotic germplasm in producing improved
soybean cultivars and paves the way for bringing in novel desirable genetics.

13
1.2.5. Soybean yield, agronomic traits, and their importance
Soybean yield continues to be one of the major focal points for breeding programs, along
with other traits of commercial interest such as fatty acid profile, seed oil and protein content
(Isabela Rodrigues et al. 2016; Contreras-Soto et al. 2017; Smallwood et al. 2017). On the other
hand, other agronomic traits such as plant height, lodging and seed weight are also important as
they affect yield.
Soybean seed weight is a main determinant of yield and end use. Different uses based on
seed weight are: large-seeded cultivars are used for boiled soybean (nimame), green soybean
(edamame), soymilk and tofu production, while smaller seed cultivars are preferred for fermented
soybean (natto) and sprouting (Liang et al. 2016; Teng et al. 2017). Due to the negative correlation
between yield and seed/crop quality traits makes it challenging for selecting these traits
simultaneously (Zhang et al. 2018c). As these traits are quantitative or polygenic with both major
and minor effects loci with considerable environmental influence, marker-assisted selection
(MAS), genome-wide association studies (GWAS), genomic selection, and modern, cost-effective
genotyping have been suggested as a useful tools in improving these complex traits (Wang et al.
2016; Contreras-Soto et al. 2017; Smallwood et al. 2017; Zatybekov et al. 2017; Karikari et al.
2020; Qi et al. 2020). Soybean yield as a complex trait is said to be positively correlated with seed
weight, and in general, higher yields are associated with late maturity and taller plants. However,
Kim et al. (2012) stated that there was no consistent relationship pattern observed between soybean
yield and other agronomic traits of importance (Fox et al. 2015; Contreras-Soto et al. 2017; Zhang
et al. 2018c). On the other hand, Contreras-Soto et al. (2017) observed both a positive and negative

14
significant relationships between seed yield and plant height and stated that their results are in line
with other studies.
Diers et al. (2018) developed a nested-association mapping (NAM) population of 5600
inbred lines of soybean to investigate the genetic architecture of yield and the following agronomic
traits: maturity, lodging, plant height and 100-seed weight. They identified between 15 and 29
marker-trait associations for the five traits, which the authors claimed as proof of the multigenic
nature of these traits.
The 100-seed weight (SW) is one of the major yield components having direct effect on
the final seed yield (Contreras-Soto et al. 2017). In their study of 169 soybean genotypes that were
evaluated at four field locations in Brazil, Contreras-Soto et al. (2017) identified 11 haplotypes
that were significantly associated with seed yield, 17 haplotypes associated with 100-seed weight,
and 59 haplotypes that were associated with plant height. Furthermore, they reported that some of
these haplotypes were in/or near regions where previous studies had identified QTL for yield or
yield-related traits. Haplotype blocks are defined as genomic regions where a set of allelic variants
are in strong linkage disequilibrium in a population of interest (Greenspan and Geiger 2004;
Hamblin and Jannink 2011).
Zhang et al. (2018) genotyped 149 F8:11 RIL populations by using SLAF-seq to identify
QTL associated with plant height, seed weight, seed oil and protein content. They located a total
of 35 QTL of which 21 were coincident with findings reported elsewhere.
In another study, eleven breeding lines were developed from crosses between elite and
exotic germplasm and had equivalent or significantly higher yield when compared to the elite
15
parent (Hegstad et al. 2019). They also identified 272 novel regions in the eleven lines, of which
37 matched previously reported yield QTL or marker-trait associations. These findings, along with
others that have been reported thus far further enhance our understanding of the underlying genetic
mechanisms of yield and yield-related traits.
1.2.6. Soybean seed components and their importance
Soybean oil, protein, and other secondary metabolites have made the crop globally
important with applications in human and animal consumption, as well as industrial applications.
Recently, evidence of implications to human health and nutrition has been published leading to
increased interest in the crop for these traits (Friedman and Brandon 2001; McCue and Shetty
2004; Mittal et al. 2004; Lule et al. 2015). Increased demand for soybean food products, due to
public awareness of the nutritional value and human health benefits of soybean has resulted in a
five-fold increase of the market from $1 billion in the year 2000 to $4.5 billion in 2013
(www.soyfood.org). Because soy-based food manufacturers require specific physical and
chemical characteristics of the seed for optimal production (Whiting et al. 2020), it becomes
imperative to thoroughly investigate the genetic basis for these important seed qualities.
To date, many studies have been published attempting to shed light on the genetic basis for
soybean seed yield and seed composition (Friedman and Brandon 2001; Chung et al. 2003; McCue
and Shetty 2004; Mittal et al. 2004; Eskandari et al. 2013; Lee et al. 2013; Lule et al. 2015; Isabela
Rodrigues et al. 2016; Contreras-Soto et al. 2017; Smallwood et al. 2017; Zhaoming et al. 2017;
Zhang et al. 2018b; Diers et al. 2018; Whiting et al. 2020).
16
Soybean seed is a rich source of protein, essential amino acids, oil, and metabolizable
energy (Patil et al. 2017). Approximately 60% of the value of soybean has been reported to come
from its meal (Pettersson and Pontoppi 2013), with the remaining 40% coming from its oil. Seed
protein (~400 gkg-1) and oil (~200gkg-1) are primary components of soybean that contributes to its
high value and are common targets in research efforts to improve the value of soybean (Smallwood
et al. 2017). Patil et al. (2017) stated that the total content of protein and oil in soybean seed is
more important than either component by itself. Furthermore, soybean meal, due to its high protein
content has become the leading protein feed source for the animal husbandry industry (Patil et al.
2017). About 68% and 77% of the soybean meal consumption in the European Union and United
States have been reported to be by livestock and poultry industries (wwww.soystats.com;
www.fediol.be). Commercial soybean cultivars have been reported to contain about 38 to 42%
seed protein on a dry weight basis (Willis 2003).
Soybean seeds consist of the following oil components, primarily: palmitic (16:0), stearic
(18:0), oleic (18:1), linoleic (18:2), and linolenic (18:3); occurring in relative concentrations of
100,40, 220, 540, and 100 gkg-1 of total lipids respectively (Smallwood et al. 2017). A goal in
soybean fatty acid composition improvement is the reduction of linolenic acid (<30gkg-1), to create
a more oxidatively stable soybean oil, eliminating the need for hydrogenation; a process that
creates partially hydrogenated soybean oil. Increasing the content of monounsaturated oleic acid
(>800gkg-1) increases shelf life for soybean food products (Kinney 1996) and biodiesel (Kinney
and Clemente 2005; Fallen et al. 2012), due to the improved oxidative stability of soybean oil
achieved by increasing the concentrations of oleic acid. Pantalone et al. (2004) stated that a greater
portion of total genetic variation can be captured by breeding with small effect modifier

17
quantitative trait loci (QTL) for fatty acids in addition to major QTL, which may also facilitate
greater trait stability. The identification of small effect QTL would, therefore, serve to further
improve soybean with regards to seed quality traits such as oil or protein.
Smallwood et al. (2017) determined fatty acid content for palmitic acid, stearic acid, oleic
acid, and linolenic acid by gas chromatography. Furthermore, the authors also reported usage of
near infrared reflectance spectroscopy (NIRS) to obtain estimates of protein and oil content. They
detected 30 QTL for yield (1), palmitic acid (6), stearic acid (1), oleic acid (3), linoleic acid (5),
protein (7), and oil (4). The authors stated that of the identified QTL in their study, Pal9, Pal17.2,
Lin13.2, Len13, and Prot13.2 were excellent candidates for confirmed QTL based on
comparisons with the SoyBase (www.soybase.org). The authors also stated that it was probable
that all the traits, except yield and stearic acid, were in pleiotropic relationships with other traits in
their study.
There is a well-established negative relationship between protein and oil, in soybean and
in other crops (Costa and Kronstad 1994; Simmonds 1995; Garcia del Moral et al. 2000; Hyten et
al. 2014). Soybean oil content is a quantitatively inherited trait that is controlled by multiple genes
(Zhaoming et al. 2017; Whiting et al. 2020). Zhaoming et al. (2017) studied the genetic
characteristics of soybean oil concentration across different environments to identify major QTL
for oil concentration and environment-specific QTL for the same trait in soybean. They reported a
high-density genetic map that included 5308 markers on 20 linkage groups, with a length of
2,655.68 cM, and an average distance of 0.5 cM between adjacent markers.
18
Based on the available sequence data and bioinformatics tools, 1489 candidate genes were
screened from the main-effect QTL. Eleven of those were identified as having a relationship with
seed oil content and/or fatty acid biosynthesis and metabolism, based on gene ontology and
annotation information, and their homologous or similar genes that have been reported in other
plants (Zhaoming et al. 2017). Zhaoming et al. (2017) concluded that their findings agree with the
results of previously reported works.
Hyten et al. (2014) conducted a genome-wide association study of seed protein and oil
content in soybean and found six SNPs that had significant associations with both protein and oil
but showed a negative association between them. The authors were able to identify 12 main effect
QTL for seed oil content, however, the authors concluded that future breeding efforts aimed at
increasing seed oil content should take into consideration epistatic effects, due to their interaction
with the environment, as observed in their study.
1.2.7. GWAS, marker types, their advantages, and limitations
GWAS on the following plant species has been published: barley, sorghum, wheat, rice,
sugarcane, soybean, and maize (Street and Ingvarsson 2010). GWAS is considered to have better
precision at identifying candidate genes, as compared to QTL association mapping (Zhu et al.
2008). Contreras-Soto et al. (2017) stated that GWAS is one of the most promising methods for
the detection of QTL. However, Nelson et al. (2015) reported that in their study of soybean, they
were unable to detect as many QTL as had been reported previously by Hyten et al. (2014); and
speculated that such results may have been caused by: population structure existing within their

19
mapping populations, stringency of the thresholds for the detection of marker-trait associations
and the distribution of alleles and allele frequencies in the population.
Weir (2010) reported that the efficiency of GWAS was affected by relatedness and
population structure. Street and Ingvarsson (2010) also provided commentary on the effect of
population structure, population size, extent of linkage disequilibrium (LD), and trait heritability
on GWAS. They stated that the problem of population structure arises in cases when phenotypic
traits were correlated with the underlying population structure at the non-causal loci. It is stated
further that even loci that were unrelated to the trait could show varying degrees of association
caused by confounding effects of population structure (Street and Ingvarsson 2010). Population
structure by itself was neither a confounding factor, nor a sufficient condition for confounding to
occur in a GWAS (Street and Ingvarsson 2010). Furthermore, Street and Ingvarsson (2010) stated
that confounding within GWAS studies is better approached as a model misspecification. Selection
of correct model and/or model parameters may, therefore, help circumnavigate the issues
mentioned thus far.
Barabaschi et al. (2012) reported that SNP makers are more inclined to be inherited as a
block; thus, haplotype analysis becomes an important avenue for molecular level population
structure investigation. He et al. (2017) reported that the bi-allelic SNP markers could not match
the multi-allelism of the traits in the germplasm materials of a GWAS study. Furthermore, a high
false-negative rate, and the missing heritability problem are among some of the other concerns
regarding GWAS. Street and Ingvarsson (2010) also report that the unexplained heritability
components are a major perceived limitation of GWAS studies.

20
The uneven distribution of SNP markers on the genome and tight and loose linkages
between SNPs can lead to a block-like structure of genomic sequences, which may be inherited
together (He et al. 2017). The treatment of such SNP blocks as multiple haplotypes/alleles was
suggested by He at al (2017) as a way to overcome the low polymorphisms and redundancy in the
QTL detection of bi-allelic SNP markers. To address the limitations of bi-allelic nature of SNP
markers and the high false-negative rate; He et al. (2017) introduced the following two novel
approaches: grouping tightly linked sequential SNPs into LD blocks knowns as SNPLDBs to
generate multi-allelic haplotypes, which served as genomic markers for the plant germplasm and
pre-selection of markers for a single locus model, followed by a multi-locus multi-allele model
stepwise regression for QTL identification.
For GWAS in self-pollinating plants, such as soybean, a key issue that has been highlighted
is the inbreeding-caused population structure bias for a shortened LD decay distance and effective
QTL detection. He et al. (2017) reported that despite notable improvements in the detection power
of RTM-GWAS, the phenotypic variation explained by the detected QTL and total phenotypic
variation still had gaps in them. The authors speculated that this was indicative of the Bonferroni
correction used in the RTM-GWAS as being too stringent and redundant. To support this claim,
the authors cited the results from their simulation and case studies: QTL detection of 100-seed
weight in the Chinese soybean germplasm population (CSGP). CSGP consisted of a collection of
1024 soybean accessions that included both wild and cultivated soybean. Using this panel, they
identified 16 QTL and 139 QTL, by thresholds with and without the Bonferroni correction,
respectively. Furthermore, their use of genetic similarity coefficient (GSC), defined as the
proportion of loci that are in identity-by-state between two individuals obtained from many
21
genome-wide SNPLDB for population structure correction was noted to have contributed to the
improvements in detection efficiency and power. However, the authors cautioned that the stepwise
regression algorithm utilized in the second stage of RTM-GWAS, may not be the criterion for
model selection (He et al 2017).
He et al (2018) also noted that for populations with a small sample size such as that of 200,
the detection power for RTM-GWAS is as low as 0.022, with a high False Discovery Rate (FDR)
of 0.326, but that the detection power increases rapidly at a sample size of 400. Furthermore, they
concluded that, as indicated by their simulations results, it is imperative to use a large enough
sample size, such as >400, and the trait heritability should be controlled at a high level (such as
>0/8), which can be achieved through experimental design and careful operation of the
experiments. These results indicated that both high heritability for the traits (or experimental
precision) and a large sample size are required for GWAS of complex traits. Nevertheless,
populations of 113, 147, 169,184, and 427 in soybean (Contreras-Soto et al. 2017; Zatybekov et
al. 2017; Zhaoming et al. 2017; Pan et al. 2018), as well as 208 accessions in Capsicum (Han et
al. 2018) have been successfully utilized to date in GWAS studies highlighting the feasibility of
utilizing a population size that is smaller than that mentioned by He et al. (2017) and Street and
Ingvarsson (2010).
He et al. (2017) reported that GWAS can have relatively high power for QTL with high
heritability despite low LD, meaning that in GWAS of populations with a high inbreeding
coefficient, the markers further away from the QTL can be significantly associated as noise, rather
than as useful locus information. The size and level of genetic variation in studied genetic panels
appear to be critical for the positive outcome of GWAS based projects (Zatybekov et al. 2017).
22
The drawbacks of QTL have been listed as follows: restricted genetic variation in the
mapping population due to only two parents being used to initiate the QTL mapping population;
the limited resolution of the map as resulting from the lower recombination events due to most
QTL mapping populations consisting of early generation crosses and the restrictive nature of
generating mapping populations through controlled crosses, which could be both time-consuming
and infeasible (Street and Ingvarsson 2010). Even when a QTL of large effect is identified, tracking
down the causal gene is a tedious and time-consuming task. In addition, a single large-effect QTL
often breaks down into multiple, intricately linked QTL of smaller, and sometimes opposite effects
on the phenotype (Doerge 2002; Flint and Mackay 2009).
Street and Ingvarsson (2010) mentioned that an important consideration when it comes to
the selection of SNP markers in an association mapping study is that the process of selection of
SNP markers itself could potentially bias the results. Furthermore, they speculated that the use of
a small SNP discovery panel could potentially under-sample low frequency mutations and genetic
variants.
Association genetics to date has focused on either a candidate gene-based approach, or
GWAS. The extent of LD was reported to be a ‘critical factor’ as it determines the mapping
resolution that can be achieved, as well as the number of markers needed to ensure adequate
coverage of the genome in a GWAS study (Nordborg et al. 2002).
In species with LD extending over large physical distances, a modest number of markers
are needed to ensure adequate genome coverage. In predominantly self-pollinating plants, LD can
extend for tens or even hundreds of kb. For instance, in A. thaliana, GWAS is possible using

23
roughly 140 000 tag SNPs (representative SNPs in a genome region of high LD), which
corresponds to roughly one marker per kb across in the A. Thaliana genome (Clark et al. 2007).
Viana et al. (2017) evaluated the relative efficiency of GWAS in a non-inbred population,
inbred population, and an inbred lines panel and assessed factors that affect GWAS. Furthermore,
the authors provided quantitative genetics theory to support their claim that the SNP-QTL
association depends on the LD between the SNP and at least one of the QTL that affect the trait,
after correcting for population structure (Viana et al., 2017). In addition, it was stated that the
inbred lines panel population provided an improvement over the non-inbred lines with regards to
the power of detecting QTL of low heritability and intermediate heritability, control of the type I
error, as well as mapping precision (Vianna et al, 2017).
Literature shows that the identification of candidate genes can be highly efficient,
depending on sample size and QTL heritability. LD was identified as another important factor
affecting GWAS by Weir (2008). Viana et al. (2017) also provided empirical proof that the
additive-dominance model, when fitted for traits controlled by dominance led to an increase in the
power of QTL detection. Furthermore, they reported that inbreeding did not affect the GWAS
efficiency, but RILs, if available, could help maximize the heritability of QTL, as they allowed for
the standard experimental procedures (local control and replication) and the assessment of SNP ×
environment interaction.
The application of the mixed linear model (MLM) with K and Q matrices in the GWAS
resulted in identification of 46 SNPs for 64 marker-trait associations (Zatybekov et al. 2017).
Zatybekov et al. (2017) super-imposed the physical position of each critical SNP marker and
24
discovered that it was on positions of known QTL and found that 32 out of 42 marker-trait
associations aligned with analogous QTL in the soybean genome.
To rectify the limitations of single-marker genome-wide scan models such as mixed linear
model (MLM) and general linear model (GLM), which are the most frequently used, several multi-
locus models have been developed and applied in recent GWAS in several crops including
soybean. Models such as mrMLM, FASTmrMLM, FASTmrEMMA, pLARmEB, pKWmEB &
ISIS EM- BLASSO can be implemented in R with the mrMLM.GUI package (Zhang et al. 2019).
Furthermore, these models have reportedly better detection power and more robustness when
identifying quantitative trait nucleotides (QTN) with complex traits (Chang et al. 2018a, b; Zhang
et al. 2018b). Further improvements to GWAS have been suggested by Yin et al. (2021), through
the Memory-efficient, Visualization-enhanced, and Parallel-accelerated package (rMVP) in R. In
this package, FarmCPU (Fixed and random model Circulating Probability Unification) is utilized
due to its higher statistical power over both GLM and MLM for evaluating populations with
structure (Yin et al. 2021). Another improvement in rMVP was the inclusion of vanRaden method
for the construction of a genomic relationship matrix (VanRaden 2008; Yin et al. 2021). FarmCPU
increases the statistical power by removing the confounding effects of kinship matrix and the SNP
that is being tested (Sandhu et al. 2019; Gaire et al. 2020). Wei et al. (2017) compared the GWAS
results under FarmCPU against compressed mixed linear model (CMLM) and reported that
FarmCPU was able to identify significant marker-trait associations even at more stringent levels
of FDR (<0.05), when CMLM failed to do so at the same significance threshold. The FarmCPU
model uses multiple loci linear mixed model (MLMM) and incorporates multiple markers
simultaneously as covariates in a stepwise MLM to partially remove the confounding between

25
testing markers and kinship. To further eliminate confounding, MLMM is split as a fixed effect
model (FEM) and a random effect model (REM) which are run iteratively. FEM contains testing
markers, one at a time, and multiple associated markers as covariates to control false positives.
Liu et al. (2016) stated that FarmCPU provides improved statistical power, increases
computational efficiency, and the ability to control false positives and false negatives as compared
to other models.
1.2.8. QTL from Crosses of Chinese and Canadian Elite Cultivars
In order to investigate the genetic basis of yield and related agronomic trait QTL in a
population derived from exotic Chinese and elite Canadian parents, Palomeque et al. (2009)
evaluated a soybean mapping population in Canadian and Chinese mega-environments to assess
their performance in either environment. They identified two QTL that behaved as mega-
environment-specific (QTL; being significant in either Canada or China, but not both and five
mega-environment-universal (QTLU) for yield (Palomeque et al., 2009). Furthermore, Palomeque
et al. (2009) reported that the exotic parent contributed favourable alleles in both environments,
which explained large amounts of phenotypic variation (R2) in certain cases. They identified four
yield QTLU that were co-localized with an agronomic trait QTL that behaved either as a QTLU or
QTL for the agronomic trait. Upon conducting a validation study to confirm these findings,
Palomeque et al. (2010) found no association between seed yield and QTL, and suggested that
their results could be due to the seed yield QTL being unstable in the particular genetic
background, or due to the presence of different alleles from the original mapping population.
However, the validation of association between QTLU Satt162 and lodging, and the identification

26
of contributions of favourable alleles from exotic and adapted parents provided evidence for the
use of exotic germplasm to potentially improve seed yield and other agronomic traits of interest in
soybean.
Building further upon this work, Rossi et al. (2013) evaluated two RIL populations derived
from high-yielding Canadian cultivars and elite Chinese cultivars (OAC Millennium x Heinong
38, and Pioneer 9071 x #8902) in Canada, United States, and China. Rossi et al. (2013) identified
two yield QTL in the first population at all three environments, and one yield QTL was identified
in the second population across all environments. Furthermore, they found that yield QTL were
co-localized with an agronomic trait QTL (Rossi et al., 2013). These findings lend further credence
to the potential for exotic germplasm to contribute beneficial alleles to North American soybean
breeding pools. However, it should be noted that both studies were conducted using bi-parental
populations. A GWAS could potentially help overcome the limitations of QTL mapping and help
identify QTL associated with seed yield or other agronomic traits that may be more stable through
different cycles of breeding and genetic backgrounds.
1.2.9. GWAS of Canadian x Chinese soybeans
As it has been highlighted thus far, exotic germplasm, such as elite Chinese cultivars may
serve as reservoirs of important and novel genetic variation. This current study aims to utilize this
unique germplasm to help identify QTL related to yield and other agronomic traits in a genome-
wide association study design. This includes elite commercial cultivars developed at the University
of Guelph, lines derived from Canadian x Chinese crosses, elite Chinese cultivars developed at the
Chinese Academy of Sciences, Heilongjiang Academy of Agricultural Sciences (HAAS), Jilin
Academy of Agricultural Sciences (JAAS), Liaoning Academy of Agricultural Sciences

27
(LAAS),and Northeast Agricultural University (NAU), as well as other experimental lines
developed at the University of Guelph in a genomic diversity panel.
1.2.10. Hypotheses:
1) Lines derived from the Canadian (CD) x Chinese (CH) bi-parental crosses contain
beneficial novel genetic variation for yield. The detection of allelic variants in the GWAS
panel is possible when they are represented at levels higher than minor allele frequency
(MAF).
2) Alleles associated with yield, seed oil and protein, and traits of agronomic interest present
in the germplasm of populations derived from CD-CH lines will be identified in a genomic
diversity panel using GWAS based on SNP markers.
1.2.11. Objective:
1) Identify novel QTL from the lines derived from Canadian x Chinese parentage from a
genomic panel that includes other elite Canadian, Chinese, and commercial soybean
cultivars. Such variation from exotic source could be introgressed into Canadian soybean
germplasm to equip the breeder with the genetic variation necessary for continued
improvement of the crop.
28
Chapter 2. Phenotypic evaluation of Canadian x Chinese elite
germplasm in a diversity panel for Seed Yield and Seed-Quality
Traits
Abstract
Soybean [(Glycine max (L.) Merr.] is the third largest field crop in Canada. Despite mounting
concerns of the narrowness of the genetic base of North American soybean germplasm, exotic
germplasm is seldom used by breeders due to the concern of diluting the genetic background of
adapted, high-performing Canadian elite cultivars. A genomic diversity panel consisting of 200
genotypes, including lines derived from several generations of bi-parental crosses between elite
Canadian x Chinese cultivars (CD-CH), elite Canadian cultivars (CD), and exotic elite Chinese
cultivars (CH), was evaluated in the field at Elora and Woodstock, Ontario, in 2019 and 2020.
Seed yield, oil, and protein concentrations, as well several agronomic traits, such as plant height,
100-seed weight, days to maturity etc. were evaluated. In combined environment analysis, the CD-
CH group outperformed others for seed yield. For seed oil and seed protein concentrations,
Canadian cultivars outperformed others, except for the CD-CH group, which was not significantly
different from the Canadian cultivars for either trait. Correlation analysis identified similar
relationships, as found in literature, where yield, oil, and protein were negatively correlated, while
yield was positively correlated with several agronomic traits. The yield potential observed in the
current study provides an exciting opportunity that should be further tested across multiple
environments.

29
2.1. Introduction
Though global soybean [Glycine max (L.) Merill.] production has more than doubled in
the past decade, there is growing concern regarding the challenges caused by the narrow genetic
base of soybean that may influence an effective development of environmentally resilient, high-
yielding cultivars, which can withstand changing biotic and abiotic stresses (Kofsky et al. 2018).
Additionally, climate change and shifting weather patterns, along with growing global human
population are expected to exacerbate these concerns, with the inclusion of exotic or under-utilized
germplasm proposed as a potential solution to addressing these issues (Sneller et al. 2005; Fox et
al. 2015; Wang et al. 2017; Kofsky et al. 2018; Gaire et al. 2020; Kilian et al. 2020). Despite the
perceived challenges affiliated with the development of cultivars with novel genetic diversity and
high yield potential, such as yield-drag, excessive selection cycles, time-cost constraints, Akpertey
et al. (2014) were able to develop backcross lines with G. soja germplasm that were equivalent to
G. max recurrent parent. The successful introgression of soybean cyst nematode resistance is
another example of a positive contribution to crop improvement from exotic germplasm (Kim et
al. 2011).
Concurrent improvement of soybean seed yield, disease, and stress resistance, as well as
improvement of seed-quality traits drive most breeding efforts. However, other agronomic traits
such as plant height, lodging and seed weight are also important as they affect yield (Zhe et al.
2010; Zatybekov et al. 2017; Zhang et al. 2018c). For example, soybean seed weight could
determine its end use and significantly affect yield. Large-seeded cultivars for example are used
30
for nimame, green soybean (edamame), soymilk and tofu production, while smaller seed cultivars
are preferred for fermented soybean (natto) and sprouting (Liang et al. 2016; Teng et al. 2017).
Simultaneous selection for seed yield and seed-quality traits become challenging due to the
negative correlation between these traits (Zhang et al. 2018c).
Due to the often polygenic or quantitative nature of these traits with both major and minor
effects loci with considerable environmental influence, marker-assisted selection (MAS), genome-
wide association studies (GWAS), genomic selection, and modern, cost-effective genotyping have
been suggested as a useful tool in improving these complex traits (Wang et al. 2016; Contreras-
Soto et al. 2017; Smallwood et al. 2017; Zatybekov et al. 2017; Karikari et al. 2020; Qi et al. 2020).
Soybean seed yield is a complex trait, which is often positively correlated with seed weight, and
high yield is often associated with late maturity and taller plants. However, these relationships
have been shown to be environment or population dependent (Posadas et al. 2014; Contreras-Soto
et al. 2017).
The high value of soybean seed is largely due to the constituents of the seed: a rich source
of protein, essential amino acids, oil, and metabolizable energy (Patil et al. 2017). Therefore,
soybean protein and oil, besides yield, remain the primary seed components that are commonly
targeted for improvement by breeders (Smallwood et al. 2017). With increasing evidence of
positive implications to human health and nutrition, an increased interest in the crop for these traits
has been proposed to further increase demand for soybean food products (Friedman and Brandon
2001; McCue and Shetty 2004; Mittal et al. 2004; Lule et al. 2015). Due to the specific physical
and chemical characteristics of the seed required for optimal production by food processors and
31
manufacturers (Whiting et al. 2020), it becomes imperative to thoroughly investigate the genetic
basis for these important seed qualities, as well as the phenotypic relationships that exist between
these different traits.
Recombinant inbred soybean lines (RILs) derived from crosses between adapted exotic
elite Chinese and Canadian cultivars were previously field evaluated in Canada (Palomeque et al.
2009b, a, 2010; Rossi et al. 2013). Significant variation for seed yield and differential performance
among these RIL lines were observed in Canada and China. However, these studies reported only
on a RIL line and did not include a genomic-diversity panel to assess the performance against a
multitude of lines. Furthermore, to the best of our knowledge, there is no evidence that there has
been a GWAS study conducted on a diversity panel that included advanced progeny lines derived
from the progeny of elite adapted Canadian x elite exotic Chinese cultivars.
The objective of the current study was to field evaluate a genomic diversity panel of
soybean lines that included progeny derived from exotic sources for seed yield, seed-quality traits,
and agronomic traits. Seed yield was the primary focus of this research with the latter being
secondary. To ensure diversity within the panel, soybean cultivars developed by Agriculture and
Agri-Food Canada (AAFC), experimental breeding lines and cultivars from the University of
Guelph soybean breeding program, elite Chinese cultivars from Northeast China, as well as
progeny derived from the Canadian x Chinese crosses were included.
32
2.2. Materials and Methods
2.2.1. Plant material and experimental design
A genomic diversity panel consisting of 200 genotypes of elite Canadian (CD) cultivars
(n=59), elite Chinese (CH) cultivars (n=53), and Canadian x Chinese (CD-CH) progeny lines
(n=88) (Appendix 1. Table S1.) was field evaluated at the Elora Research Station (43º64’104.4”
N; 80º40’567.4” W), Elora ON, and Woodstock Research Station (43°08’44.8” N 80°47’02.5”
W), Woodstock ON in 2019 and 2020. All lines were replicated twice per environment, in a nearest
neighbor Randomized Complete Block Design (nn-RCBD) with lines randomly assigned.
Due to the low availability of seed quantities and poor germination, some of the Chinese
cultivars were grown as a seed increase panel at the Woodstock Research Centre in 2019 (Table
S1.). Additionally, a modified plot size of 5.5 m2 was used as two-row plots, with 0.35m space
between rows at the Elora Research Centre environment to accommodate the low seed numbers
that were available for some of the cultivars. A total of 180 genotypes were evaluated in Elora in
2019, while 147 genotypes were evaluated in yield trials at Woodstock, ON. Woodstock 2019
research trials, as well as Elora trials in 2020 were grown as regular four-row plots of plot size of
8.25 m2 with 0.35m row spacing. Due to a hedging error, the plot size in Woodstock, ON in 2020
was 7.5 m2.
In both years, seeds for each cultivar were screened to remove off-types and packaged into
labeled envelopes of 500 seeds per envelope where available. These envelopes were then organised
per environment and arranged in the planting order. Hilum colour was recorded and used to cross-
reference between records to ensure uniformity of seeds.

33
In 2019, yield trials were planted on the 11th of June at Elora, ON and harvested on the 23rd
of October. Woodstock yield trials were planted on the 14th of June 2019 and harvested on the 23rd
of November 2019. In 2020, the yield trials were planted on the 22nd of May at Elora and on the
26th of May at Woodstock, ON and harvested on the 6th of November, at Elora, ON and on the 8th
of October at Woodstock, ON. Planting was done using a precision Wintersteiger research planter.
Harvesting was conducted with the research plot combines (Almaco and Wintersteiger). Due to
combine error, two plots were lost in Elora in 2020 (Table S2). Yield was recorded as kg/ha and
adjusted to 13% moisture.
2.2.2. Phenotypic Data Collection
Seedling emergence score was recorded for each plot three weeks after planting, based on
the plot-wise number of plants observed. A scale of 0-10 was used where 0 corresponded to no
emergence, and 10 corresponding to 100% emergence. Pubescence colour, flower colour, and leaf
morphology were recorded subsequently. Flower colour was recorded at the R1 stage (one flower
at any node), full maturity date was recorded at R8 stage where 95-100% of pods have turned
brown; lodging: scored at maturity on a scale ranging from 1-5, where 1 = plants fully upright, and
5 = plants fully prostrate; height: as the distance between the terminal node and the ground,
measured in cm (Ernpig and Fehr 1971). All field observations were recorded on an iPad and
exported as an MS Excel file.
After harvest, seeds were stored in cold storage. Seed quality traits were measured using
Perten Diode Array 7250 Near Infra-Red Spectroscopy (Springfield, USA) machine using the
manufacturer’s guidelines. Seeds were screened to remove off-types, dirt, and other impurities.
34
100-seed weight was measured with a regular commercial scale. Hilum colour, 100 seed weight,
plot number, entry numbers, and experiment number were entered into the NIR machine for each
entry. NIR results were exported as an excel file and screened for errors. Randomly selected
genotypes were re-run to ensure that the readings were consistent. Within the soybean seed-quality
traits, only the protein and oil concentration (expressed as % on a dry seed basis), and 100-seed
weight (g) were retained for analysis. One entry each from Elora 2019 and Woodstock 2019 was
removed from analysis due to machine error (Table S2).
Raw data was compiled into a single MS Excel file combining data from all environments
with the following variables: block number, entry, cultivar name, seed yield, protein content, oil
content, sucrose content, starch content, height at maturity, days to maturity, emergence score, and
lodging score. Raw data was screened for errors, missing data, and accuracy and exported as a
comma separated value excel file (csv) for statistical analysis.
2.2.3. DNA extraction and Genotyping-by-sequencing
Leaf tissue was collected into labeled 10 ml plant-tissue collection tubes. One to two young
leaves were collected into each tube. These tubes were then transported on ice back to the Soybean
Research Laboratory at the University of Guelph in Guelph, ON. Leaf tissue samples were freeze
dried with a Labonco FreeZone® freeze dry system (Savant Moduly, Kansas City, MO, USA) for
a period of 24 hours and stored at -4ºC.
Genomic DNA was extracted from samples of freeze-dried leaf tissue by using
NucleoSpin® Plant II DNA extraction kit by Macherey-Nagel using the manufacturer’s
guidelines. Extracted DNA samples were spot tested with a NanoDrop 8000 machine

35
(ThermoFisher Scientific, Waltham, MA, USA) to check for protein/RNA contamination and to
verify the quality of genomic DNA. DNA concentration was established with the QuBit 4 DNA
Analyzer (ThermoFisher Scientific, Waltham, MA, USA) and was standardized to 10 ng/µl.
A precise volume of 10µl was pipetted out to two 96-well semi-skirted PCR plates, which
were sent to Plateforme d’analyses génomiques [Institut de Biologie Intégrative et des Systèmes
(IBIS)], Université Laval (Quebec, QC, Canada) for Genotyping-by-Sequencing and SNP-calling.
Genotyping-by-sequencing (GBS) was conducted following the methods and recommendations
outlined by Elshire et al. (2011 and Légaré et al. (2013).
2.2.4. Statistical Analysis
Analysis of variance of seed yield, seed quality and agronomic traits were conducted using
the PROC GLIMMIX procedure in Statistical Analysis Systems (SAS) version 9.4 (SAS Institute
Inc., Cary, NC, US) for RCBD. The GLIMMIX procedure allows the use of generalized mixed
linear model - a standard in agricultural research (Camp et al. 2018). ‘Genotype’, ‘environment’
and ‘genotype-by-environment’ were considered fixed effects and ‘block (environment)’ was
considered random effect.
Due to the unbalanced number of genotypes in 2019 at Elora and Woodstock, data was
sorted by year and environment and separated into three sets: 2019 (with 147 genotypes), 2020
(200 genotypes), and combined years (147 genotypes). Using PROC GLIMMIX procedure the
least squared means (LSMEANS) values were calculated for seed yield, protein concentration and
oil concentration for both combined environments and individual environments. Shapiro-Wilk test
was conducted using PROC UNIVARIATE to determine the distribution of residuals. PROC
36
PLOT was used to examine the normality of residual distribution. Homogeneity of error variance
was tested by conducting Levene’s test on the absolute residuals.
Comparisons were made between environments, genotypes, and genotypes by
environments. Tukey-Kramer multiple comparison test was invoked along with the LINES
statement to generate statistically significant differences between comparison groups.
CONTRAST statements were used along with ESTIMATE statements to test the statistical
differences, if any, between the three different genotypic groups of the current study. These were
invoked with the statement 'CD vs. CH vs CD-CH’, where genotypic groups were assigned 1, -1,
and 0. Woodstock 2019 was not included in this analysis since Chinese cultivars were excluded
from the yield trials that year.
Pearson’s correlation coefficients were calculated with PROC CORR to establish the
magnitude, direction, and statistical strength of relationships between seed yield, seed-quality
traits, and agronomic traits. Correlation analysis was also conducted for the four different
environments for seed yield, seed protein content, and seed oil content. The type I error (α) was
set at 0.05.
2.3. Results
2.3.1. Seed Yield (kg/ha)
Mean yield across environments was 2590 ± 727.9 kg/ha, with a range of 126 kg/ha – 4805
kg/ha (Table 2.1.). Analysis of variance revealed that genotype and genotype-environment were

37
the main sources of variation, with environment also showing significance, albeit of smaller
magnitude (Table 2.3.). Mean yield at Woodstock 2019 differed significantly from Elora 2019 and
Woodstock 2020 (Table 2.4). The mean yield at Elora 2019 and Woodstock 2020 did not differ
significantly (Table 2.4). Elora 2020 on the other hand, did not differ in mean yield to either of the
other environments.
The mean yield at Elora 2019 was 2262 ± 654.5 kg/ha, with a range of 348-3931 kg/ha,
while Elora 2020 had a mean yield of 2723 ± 507.2 kg/ha, with a range of 1248-4334 kg/ha,
respectively (Table 2.2). Woodstock 2019 had a mean yield of 3219 ± 671.3 kg/ha, with a range
of 126-4805 kg/ha, whereas, Woodstock 2020 had the lowest mean yield with 2306 ± 678.8 kg/ha,
with a range of 826-3900 kg/ha (Table 2.2).
Table 2.5. presents the top 10 yielding cultivars at each environment. Except for Elora
2019, the highest yielding cultivar at each environment belonged to the CD-CH genotypic group.
At Elora 2019, the highest yield belonged to the Canadian genotypic group. In each environment,
there were 6, 3, 8, and 8 CD-CH genotypes that appeared in the top 10-yield rankings (Table 2.5.).
Exotic elite Chinese cultivars ranked among the top 10 at Elora 2020 and Woodstock 2020, with
5 and 2 genotypes at each, respectively. Both Elora 2019 and Woodstock 2019 had elite Canadian
cultivars that ranked among the top 10 with 4 and 2 genotypes at each.
CD-CH progeny lines outperformed both CD and CH cultivars in terms of seed yield in
both year-by-year (data not shown) and combined environment analysis (Table 2.6). CD-CH lines
had a mean yield and standard error of 2582 ± 75.0 kg/ha, whereas Canadian cultivars yielded
2289 ± 76.8 kg/ha, with Chinese cultivars yielding 2263 ± 79.5 kg/ha (Table 2.6).

38
2.3.2. Seed-quality Traits - Protein Concentration
The mean protein concentration observed across environments and years was 41.0% ±
1.95% (dry basis) with a range of 34%-46.8% (Table 2.1). Analysis of variance showed that
genotype, environment, and genotype-by-environment effects were all significant at explaining
the variation in the observed protein concentration (Table 2.3). Mean protein concentration at Elora
2019 differed significantly from Elora 2020, Woodstock 2019, and Woodstock 2020 (Table 2.4).
Though there was no significant difference in mean protein concentration between Woodstock
2019 and Elora 2020, there was a significant difference between these two years and Elora 2019,
as well as Woodstock 2020 (Table 2.4). The mean protein concentration at Woodstock 2020 was
significantly lower than all other environments.
The mean seed protein concentration at Elora 2019 was 42.2 ± 1.64% (dry basis), with a
range of 36.1%-46.3%, whereas Elora 2020 had 41.0 ± 1.38% (dry basis) with a range of 36.9%-
44.9% (Table 2.2). The mean seed protein concentration at Woodstock 2019 was 41.1 ± 2.11%
(dry basis), with a range of 35.5%-46.8%, whereas at Woodstock 2020, mean seed protein
concentration was 39.8 ± 1.88% (dry basis), with a range of 34.0%-45.2% (Table 2.2).
For seed protein concentration, there was no difference between Canadian genotypic group
and CD-CH genotypic group statistically (Table 2.6). However, there was significant difference
between these two groups and the Chinese genotypes, with the latter group containing the lowest
protein concentration at 40.6 ± 0.12 (se)%. Canadian genotypic group had the highest protein
concentration at 41.2% ± 0.11%, with CD-CH group containing 41.1± 0.09% (Table 2.6).

39
2.3.3. Seed-quality Traits: Oil Concentration
The mean oil concentration across all environments was 19.8% ± 1.23% (dry basis), with
a range of 14.9% - 23.1% (Table 2.1). For oil concentration, genotype, environment, and genotype-
by-environment effects were all significant (Table 2.3). The mean oil concentration between Elora
2020 and Woodstock 2020 did not differ significantly, however, the mean oil concentration in
these two environments differed from Elora 2019 and Woodstock 2019 (Table 2.4). The latter two
groups did not differ significantly in mean oil concentration between each other.
The mean seed oil concentration at Elora 2019 was 19.0 ± 1.18% (dry basis), with a range
of 14.9%-21.4%, whereas in Elora 2020 it was 20.0 ± 1.14% (dry basis), with a range of 16.1%-
22.8% (Table 2.2). The mean seed oil concentration at Woodstock 2019 was 19.2 ± 0.80% (dry
basis), with a range of 17.2%-21.4%, while Woodstock 2020 had the highest oil content with
20.7% ± 0.98%, (dry basis) with a range of 20.0% ± 1.14% (Table 2.2).
The mean seed oil concentration differed significantly between the three genotypic groups
(Table 2.6). Canadian genotypic group performed the best of the three for this trait, with 20.4% ±
0.07%, followed by the CD-CH genotypic group at 19.9% ± 0.06% and the Chinese genotypic
group bearing the lowest oil content at 19.1% ± 0.08% (Table 2.6).
2.3.4. Correlation analysis between seed yield, seed-quality traits, and agronomic traits
Correlations were calculated to evaluate the relationships between seed yield, seed-quality
traits and select agronomic traits (Table 2.7). The following traits were evaluated: seed yield,
40
protein concentration, oil concentration, seed weight (g), height (cm), days to maturity, emergence
score (1-10, %) and lodging score (1-5, %).
Yield was found to be positively correlated with height (r = 0.47; p <.0001) and lodging
score (r = 0.28; <.0001). Yield and emergence showed a strong positive correlation (r = 0.56; p
<.0001). Yield and oil concentration (r = -0.12; p <.0001), as well as yield and protein
concentration (r = -0.08; P = .0035) showed significant negative correlations.
Protein concentration was negatively correlated with yield (r = -0.08; .0035), oil
concentration (r = -0.40; <.0001), height (r = -0.23; p <.0001), and days to maturity (r = -0.15; p
<.0001). A significant positive relationship was observed between protein concentration and seed
weight (r = 0.18; p <.0001). Protein concentration was not correlated with emergence nor lodging.
Oil content showed significant negative relationships with seed yield (r = -0.12; p <.0001),
protein content (r = -0.40; p <.0001), height (r = -0.05; p = 0.0411), seed weight (r = -0.12; p
<.0001), days to maturity (r = -0.26; p <.0001) and lodging score (r = -0.24; p <.0001). There was
a significant positive relationship observed between oil and emergence (r = 0.07; p = 0.0088).
2.3.5. Correlation analysis between environments for seed yield, seed protein and seed oil
concentration
The four different environments Elora 2019, Woodstock 2019, Elora 2020, and Woodstock
2020 were analyzed for correlation between each for seed yield, seed protein content and seed oil
contents (Tables 2.8 to 2.10). For soybean seed yield, Elora 2019 showed a significant positive
41
relationship with Woodstock 2019 (r = 0.46; p <.0001), however, Elora 2019 was not correlated
to either Elora 2020 or Woodstock 2020 for this trait (Table 2.8). Yield at Elora 2020 was
correlated with yield at both Woodstock 2019 (r = 0.17; p = 0.0045) and Woodstock 2020 (r =
0.16; p = 0.0017) (Table 2.8).
For both protein and oil concentration, all environments were found to be correlated with
each other (Table 2.9 and Table 2.10). For protein concentration, Elora 2019, and Elora 2020 (r =
0.33; p <.0001), Elora 2019 and Woodstock 2019 (r = 0.44; p <.0001), Elora 2019 and Woodstock
2020 (r = 0.29; p <.0001) showed significant positive correlations (Table 2.9). The protein
concentration in Elora 2020 was correlated to Woodstock 2019 (r = 0.43; p <.0001) and Woodstock
2020 (r = 0.28; p <.0001). Woodstock 2019 and Woodstock 2020 were also correlated (r = 0.46;
p <.0001) (Table 2.9).
Elora 2019 was significantly correlated with Elora 2020 (r = 0.32; <.0001), Woodstock
2019 (r = 0.37; p <.0001), and Woodstock 2020 (r = 0.33; p <.0001) for seed oil concentration
(Table 2.10). Elora 2020 showed a positive correlation with Woodstock 2019 (r = 0.32; p <.0001),
and a strong correlation with Woodstock 2020 (r = 0.51; p <.0001) for seed oil concentration.
Woodstock 2019 and Woodstock 2020 also exhibited a positive correlation at r = 0.39 (p <.0001)
(Table 2.10).
2.4. Discussion
Soybean seed yield and seed-quality traits continue to be of economic importance and are
the primary targets for improvement by breeders. However, due to the recurrent use of elite
42
cultivars in breeding programs, coupled with genetic bottlenecks and low diversity of founding
populations, there is growing concern regarding the genetic variation found within breeding
programs (Gizlice et al. 1993, 1994; Kisha et al. 1998; Cui et al. 2000; Sneller et al. 2005; Hyten
et al. 2006; Iquira et al. 2010; Friedrichs et al. 2016). Low genetic diversity can result in diminished
yield gains and leave the crop vulnerable to biotic and abiotic stresses (St. Martin and Asiam 1986;
Bilyeu and Beuselinck 2005; Oliver 2013).
The use of exotic germplasm has been highlighted as a potential solution to this growing
concern and has been done with success in other plant species(Ehlers and Foster 1993; Concibido
et al. 2003; Sneller et al. 2005; Bernardo 2009; Palomeque et al. 2009b; Diers et al. 2018; Gaire et
al. 2020). Exotic germplasm is defined as germplasm that is un-adapted to the breeder’s target
environment and can be a great source of novel genetic variation that can potentially contribute
resilience to both biotic and abiotic stresses (Hallauer 2007; Mickelbart et al. 2015; Hoffmann et
al. 2018). Despite the challenges associated with the use of exotic germplasm, such as yield drag,
deleterious alleles, the need for excessive back-crossing, there is growing evidence to support the
use of exotic germplasm (Concibido et al. 2003; Kabelka et al. 2004; Guzman et al. 2007;
Palomeque et al. 2009b; Rossi et al. 2013; Akpertey et al. 2014; Hegstad et al. 2019).
Since China is one of the origins of soybean and adapted elite Chinese cultivars could
potentially contribute beneficial alleles and help improve seed yield, both Palomeque et al. (2010)
and Rossi et al. (2013) evaluated populations derived from Canadian x Chinese crosses to evaluate
the behaviour and inheritance of seed yield QTL in different environments. Building further upon
previous works mentioned above, this current study aimed to evaluate a diverse panel of 200

43
soybean germplasm that consisted of University of Guelph released cultivars and experimental
breeding lines, AAFC cultivars, elite Chinese cultivars, and Canadian x Chinese progeny lines
derived from different crosses. It was observed that the exotic elite Chinese cultivars had the lowest
seed yield compared to the adapted Canadian ones. This finding is in line with other studies that
reported on evaluations of RIL populations with exotic parentage vs adapted elite cultivars (St.
Martin and Asiam 1986; Palomeque et al. 2010; Rossi et al. 2013). Canadian x Chinese cultivars,
on the other hand, outperformed both the exotic Chinese and adapted elite Canadian cultivars.
Hegstad et al. (2019) reported on a study that evaluated the performance of exotic germplasm-
derived soybean lines against the performance of adapted elite cultivars. They reported that across
three field years, the highest yielding line yielded 280 kg/ha more than the adapted elite parent
(Hagstad et al, 2019).The average yield difference observed in my study between the Canadian
genotypic group and the Canadian x Chinese derived genotypic group was similar with a
difference of 293 kg/ha. Kim et al. (2012) reported on a study that included a Chinese cultivar (Tie
feng No. 8) used as a donor parent with repeat back-crossing. They reported that an yield increase
was observed in at least one of the populations being evaluated (Kim et al. 2012). Diers et al.
(2018) reported that in their evaluation of different soybean lines, the exotic founder germplasm
lines yielded the lowest compared to adapted parent lines, which is similar to the current
observation of exotic elite Chinese cultivars. None of these studies, however, reported on
evaluating exotic-derived germplasm against a diverse group of soybean germplasm to assess seed
yield, seed quality traits and agronomic traits. To the best of our knowledge, the current study is
the first to directly evaluate Canadian x Chinese progeny in a diverse pool of soybean lines through
GWAS. Moreover, Posadas et al. (2014) reported an average yield gain of 567 kg/ha with each
44
cycle of recurrent selection in a population developed from seven unadapted plant introductions.
Their study only included the evaluation of a single population derived from three Japanese, three
South Korean and one Chinese plant-introduction (Posadas et al., 2014). These findings, along
with the observations reported in the current chapter provide further support toward the potential
for contributing beneficial alleles from exotic germplasm sources for continued crop improvement.
Though soybean seed oil and protein are two major focal points for the crop improvement
for breeders, the complicated and often quantitative nature of these traits make direct improvement
quite challenging. As in the current study, Bellaloui et al. (2017) reported that in a two-year field
trial, they observed higher protein concentration affiliated with exotic-derived lines, akin to the
findings of the performance of Canadian x Chinese progeny lines.
Previous studies have identified similar relationships between seed yield, seed quality traits
and agronomic traits (Palomeque et al. 2009b, 2010; Rossi et al. 2013; Contreras-Soto et al. 2017).
Contreras-Soto et al. (2017) reported that soybean seed yield, plant height and days to maturity
showed positive correlations, with a general trend of later maturity and taller plants were associated
with higher yield. Additionally, Posadas et al. (2014) reported that the magnitude, direction and
significance for plant height, lodging and seed yield correlations were population-dependent.
A significant negative correlation was observed between seed oil and protein
concentration, which was consistent with previous reports (Hyten et al. 2014; Ficht 2018; Lee et
al. 2019). Patil et al. (2018) also reported similar results to the current study with regards to
relationships between seed yield and seed-quality traits and concluded that soybean seed
composition is significantly affected by the environment, which is consistent with reports

45
elsewhere in literature (Zhe et al. 2010). It is possible that this was the case in the current study,
therefore expanded environments and further testing will be needed to establish the precise nature
of these relationships.
In conclusion, the findings of the current study are consistent with previous reports and
show the promising potential of exotic soybean germplasm, specifically from China in improving
yield potential and seed-quality traits in Canada. Further studies across multiple years and
environments will be needed to verify the genotypic performance of the exotic-derived lines and
to rule out environmental or other effects that may have affected seed yield and seed-quality traits
during the period of the study. Furthermore, since the first year of field evaluations did not include
all 200 cultivars at each environment, inclusion of the full panel across all years and environments
would help overcome limitations of an uneven sample size experienced in the current study.
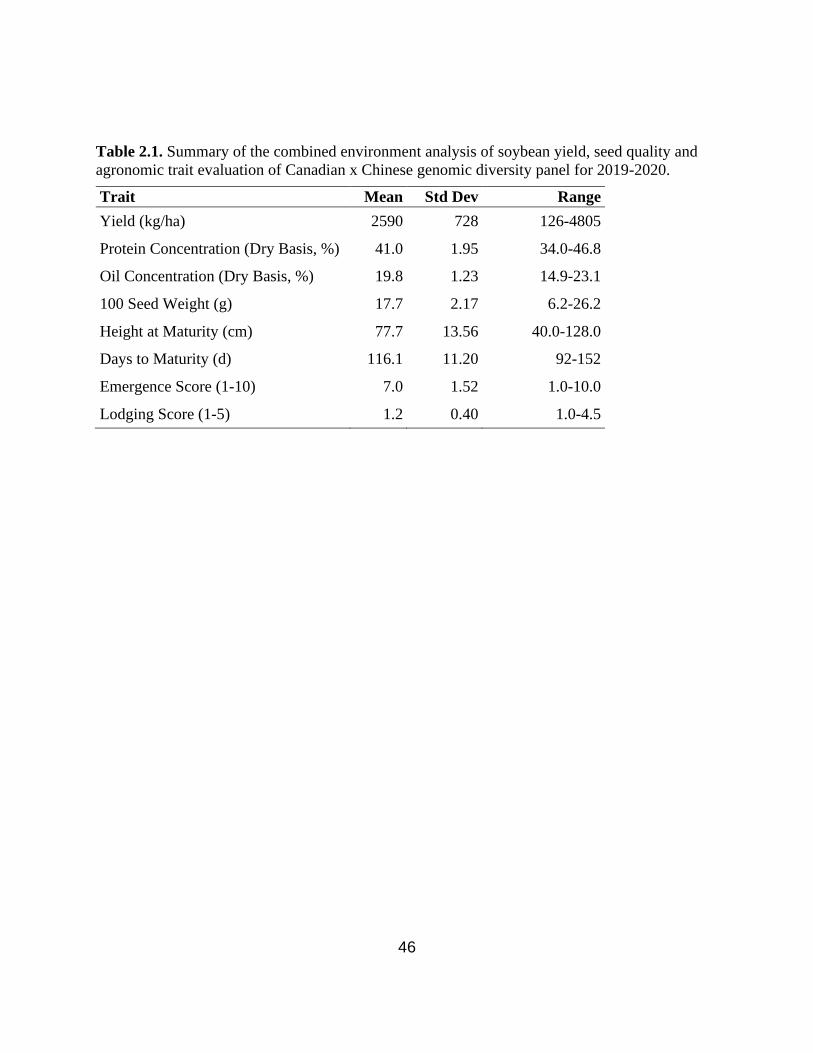
46
Table 2.1. Summary of the combined environment analysis of soybean yield, seed quality and
agronomic trait evaluation of Canadian x Chinese genomic diversity panel for 2019-2020.
Trait Mean Std Dev Range
Yield (kg/ha) 2590 728 126-4805
Protein Concentration (Dry Basis, %) 41.0 1.95 34.0-46.8
Oil Concentration (Dry Basis, %) 19.8 1.23 14.9-23.1
100 Seed Weight (g) 17.7 2.17 6.2-26.2
Height at Maturity (cm) 77.7 13.56 40.0-128.0
Days to Maturity (d) 116.1 11.20 92-152
Emergence Score (1-10) 7.0 1.52 1.0-10.0
Lodging Score (1-5) 1.2 0.40 1.0-4.5
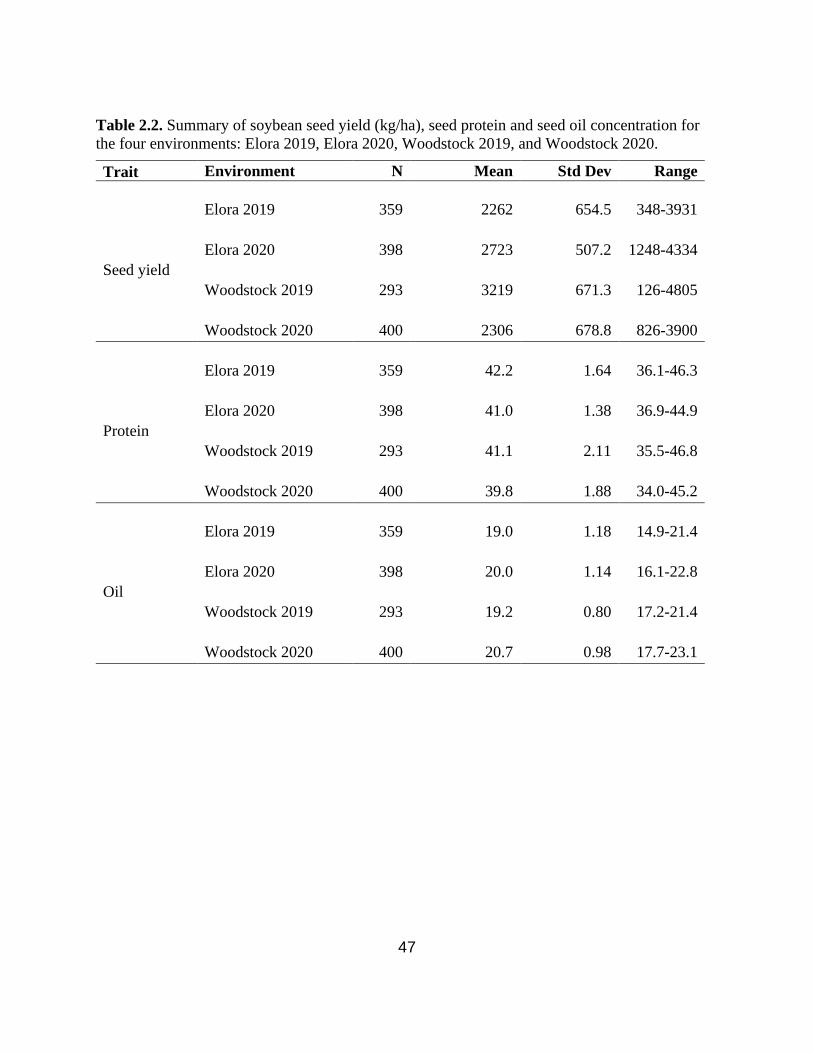
47
Table 2.2. Summary of soybean seed yield (kg/ha), seed protein and seed oil concentration for
the four environments: Elora 2019, Elora 2020, Woodstock 2019, and Woodstock 2020.
Trait Environment N Mean Std Dev Range
Seed yield
Elora 2019 359 2262 654.5 348-3931
Elora 2020 398 2723 507.2 1248-4334
Woodstock 2019 293 3219 671.3 126-4805
Woodstock 2020 400 2306 678.8 826-3900
Protein
Elora 2019 359 42.2 1.64 36.1-46.3
Elora 2020 398 41.0 1.38 36.9-44.9
Woodstock 2019 293 41.1 2.11 35.5-46.8
Woodstock 2020 400 39.8 1.88 34.0-45.2
Oil
Elora 2019 359 19.0 1.18 14.9-21.4
Elora 2020 398 20.0 1.14 16.1-22.8
Woodstock 2019 293 19.2 0.80 17.2-21.4
Woodstock 2020 400 20.7 0.98 17.7-23.1
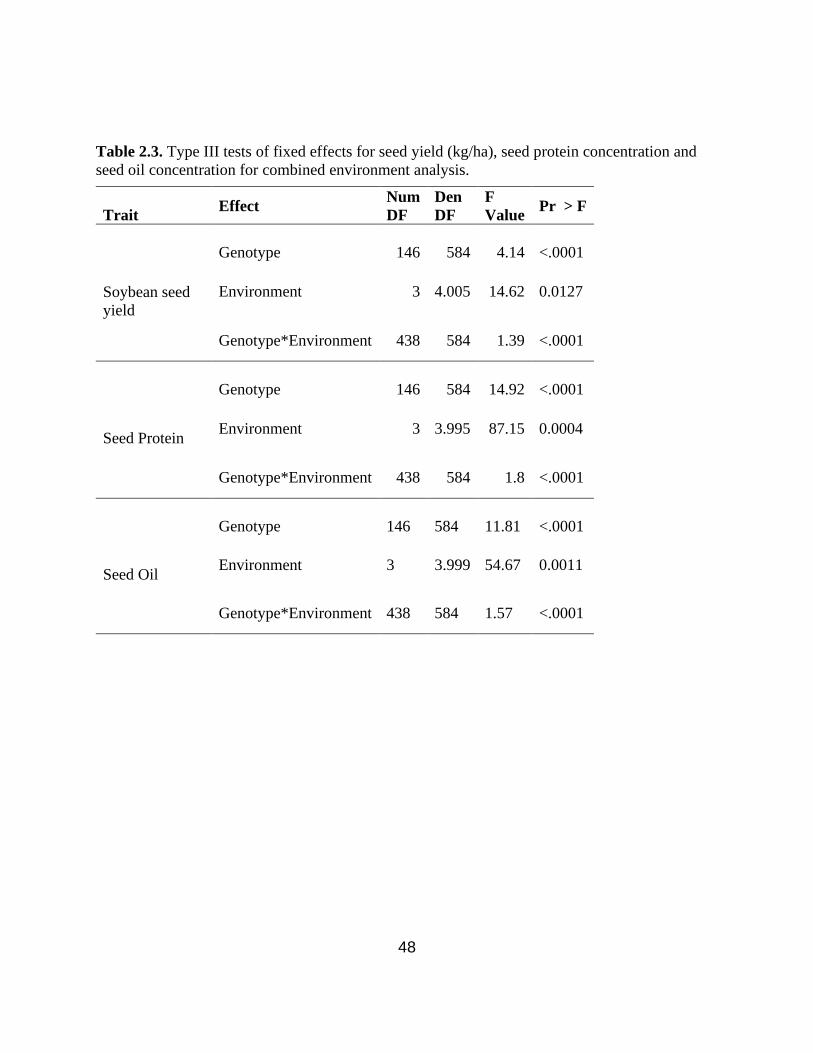
48
Table 2.3. Type III tests of fixed effects for seed yield (kg/ha), seed protein concentration and
seed oil concentration for combined environment analysis.
Trait Effect
Num
DF
Den
DF
F
Value Pr > F
Soybean seed
yield
Genotype 146 584 4.14 <.0001
Environment 3 4.005 14.62 0.0127
Genotype*Environment 438 584 1.39 <.0001
Seed Protein
Genotype 146 584 14.92 <.0001
Environment 3 3.995 87.15 0.0004
Genotype*Environment 438 584 1.8 <.0001
Seed Oil
Genotype 146 584 11.81 <.0001
Environment 3 3.999 54.67 0.0011
Genotype*Environment 438 584 1.57 <.0001

49
Table 2.4. Least square means for seed yield (kg/ha), seed protein and seed oil concentration
(dry basis, %) and test of significance of differences for combined environment analysis.
Trait Environment Estimate Standard
Error
Seed Yield
Elora 2019 2381 111.7 B1
Elora 2020 2731 111.8 AB
Woodstock 2019 3219 111.7 A
Woodstock 2020 2269 111.7 B
Protein
Elora 2019 42.3 0.09 A
Elora 2020 41 0.09 B
Woodstock 2019 41.2 0.09 B
Woodstock 2020 40.2 0.09 C
Oil
Elora 2019 19.2 0.11 B
Elora 2020 20.3 0.11 A
Woodstock 2019 19.2 0.11 B
Woodstock 2020 20.9 0.11 A
1Tukey-Kramer Grouping for environment Least Squares Means (Alpha=0.05).
LSM followed by the same letter are not significantly different.
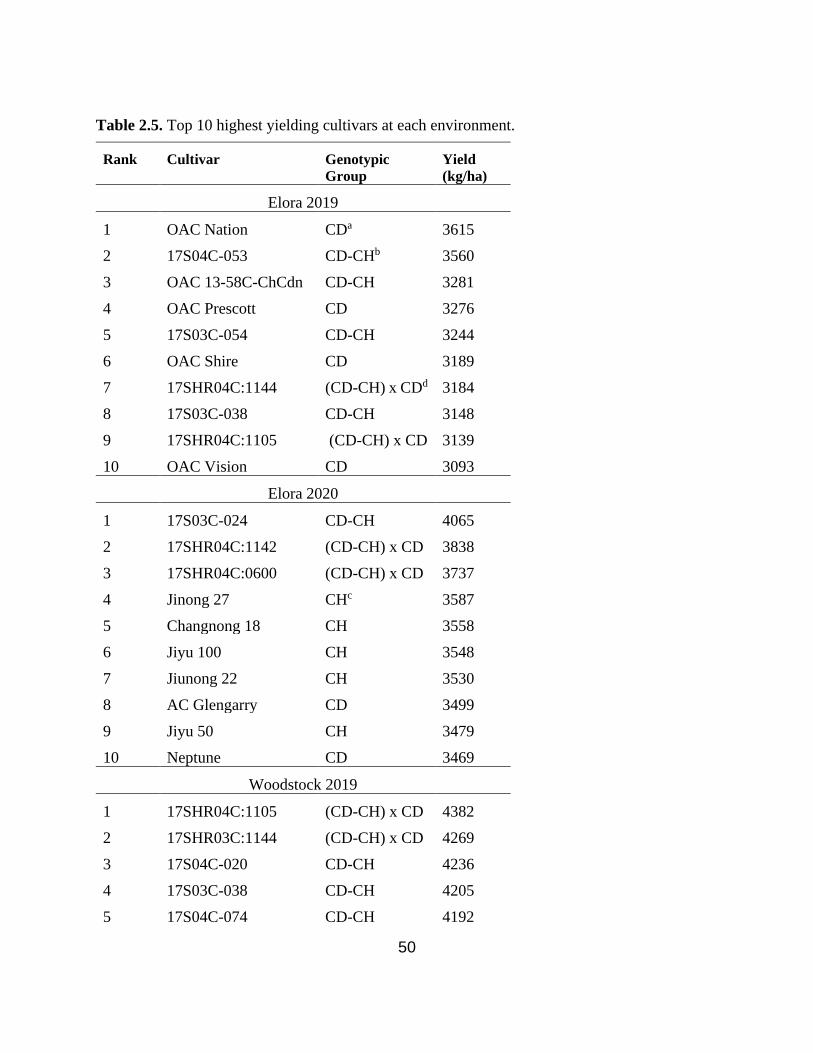
50
Table 2.5. Top 10 highest yielding cultivars at each environment.
Rank Cultivar Genotypic
Group
Yield
(kg/ha)
Elora 2019
1 OAC Nation CDa 3615
2 17S04C-053 CD-CHb 3560
3 OAC 13-58C-ChCdn CD-CH 3281
4 OAC Prescott CD 3276
5 17S03C-054 CD-CH 3244
6 OAC Shire CD 3189
7 17SHR04C:1144 (CD-CH) x CDd 3184
8 17S03C-038 CD-CH 3148
9 17SHR04C:1105 (CD-CH) x CD 3139
10 OAC Vision CD 3093
Elora 2020
1 17S03C-024 CD-CH 4065
2 17SHR04C:1142 (CD-CH) x CD 3838
3 17SHR04C:0600 (CD-CH) x CD 3737
4 Jinong 27 CHc 3587
5 Changnong 18 CH 3558
6 Jiyu 100 CH 3548
7 Jiunong 22 CH 3530
8 AC Glengarry CD 3499
9 Jiyu 50 CH 3479
10 Neptune CD 3469
Woodstock 2019
1 17SHR04C:1105 (CD-CH) x CD 4382
2 17SHR03C:1144 (CD-CH) x CD 4269
3 17S04C-020 CD-CH 4236
4 17S03C-038 CD-CH 4205
5 17S04C-074 CD-CH 4192
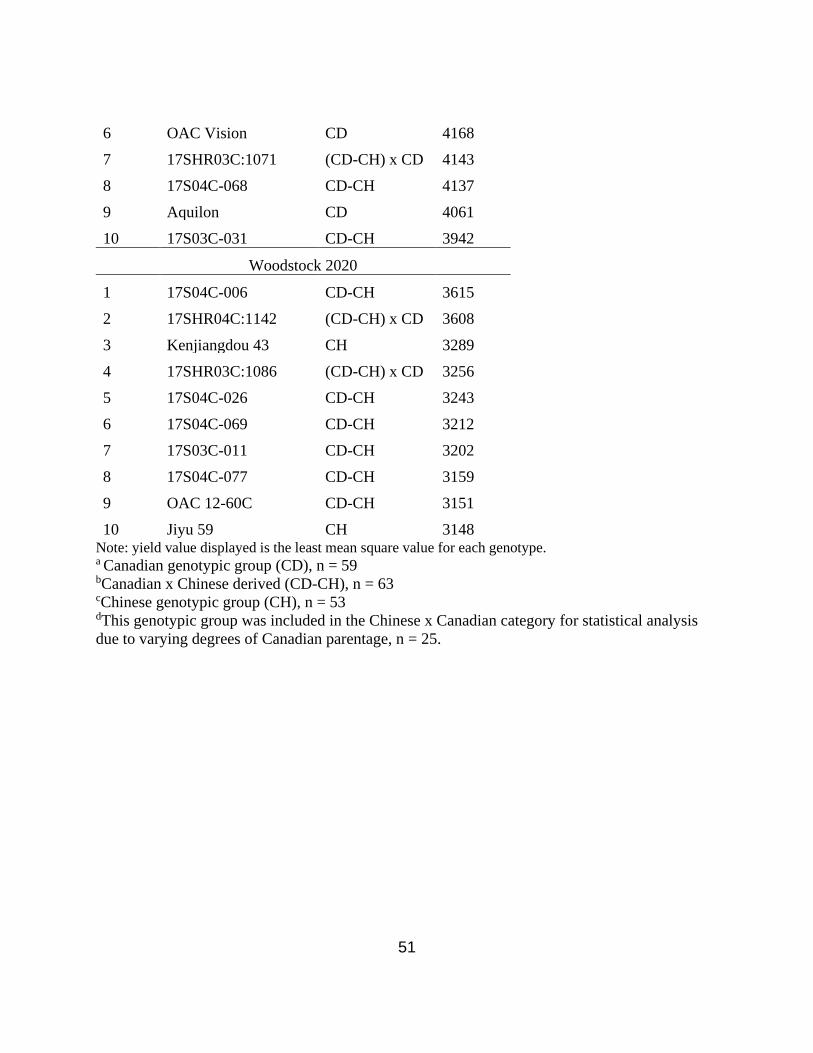
51
Note: yield value displayed is the least mean square value for each genotype. a Canadian genotypic group (CD), n = 59 bCanadian x Chinese derived (CD-CH), n = 63 cChinese genotypic group (CH), n = 53 dThis genotypic group was included in the Chinese x Canadian category for statistical analysis
due to varying degrees of Canadian parentage, n = 25.
6 OAC Vision CD 4168
7 17SHR03C:1071 (CD-CH) x CD 4143
8 17S04C-068 CD-CH 4137
9 Aquilon CD 4061
10 17S03C-031 CD-CH 3942
Woodstock 2020
1 17S04C-006 CD-CH 3615
2 17SHR04C:1142 (CD-CH) x CD 3608
3 Kenjiangdou 43 CH 3289
4 17SHR03C:1086 (CD-CH) x CD 3256
5 17S04C-026 CD-CH 3243
6 17S04C-069 CD-CH 3212
7 17S03C-011 CD-CH 3202
8 17S04C-077 CD-CH 3159
9 OAC 12-60C CD-CH 3151
10 Jiyu 59 CH 3148
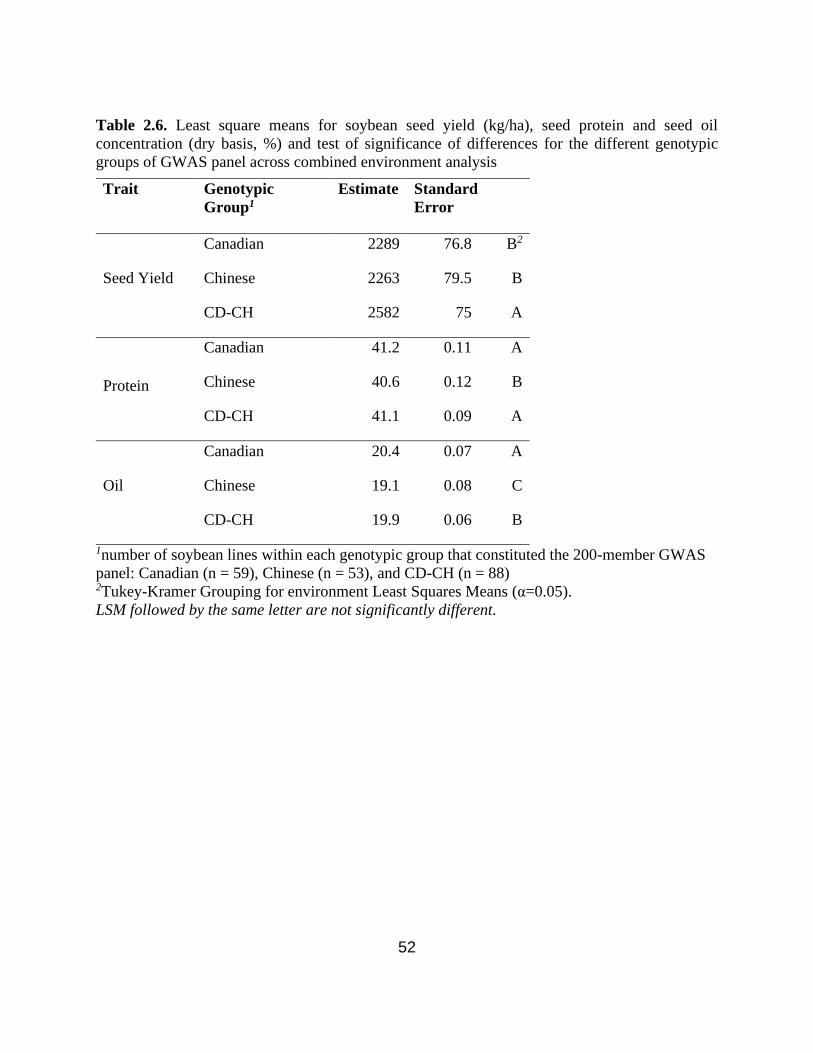
52
Table 2.6. Least square means for soybean seed yield (kg/ha), seed protein and seed oil
concentration (dry basis, %) and test of significance of differences for the different genotypic
groups of GWAS panel across combined environment analysis
Trait Genotypic
Group1
Estimate Standard
Error
Seed Yield
Canadian 2289 76.8 B2
Chinese 2263 79.5 B
CD-CH 2582 75 A
Protein
Canadian 41.2 0.11 A
Chinese 40.6 0.12 B
CD-CH 41.1 0.09 A
Oil
Canadian 20.4 0.07 A
Chinese 19.1 0.08 C
CD-CH 19.9 0.06 B
1number of soybean lines within each genotypic group that constituted the 200-member GWAS
panel: Canadian (n = 59), Chinese (n = 53), and CD-CH (n = 88) 2Tukey-Kramer Grouping for environment Least Squares Means (α=0.05).
LSM followed by the same letter are not significantly different.
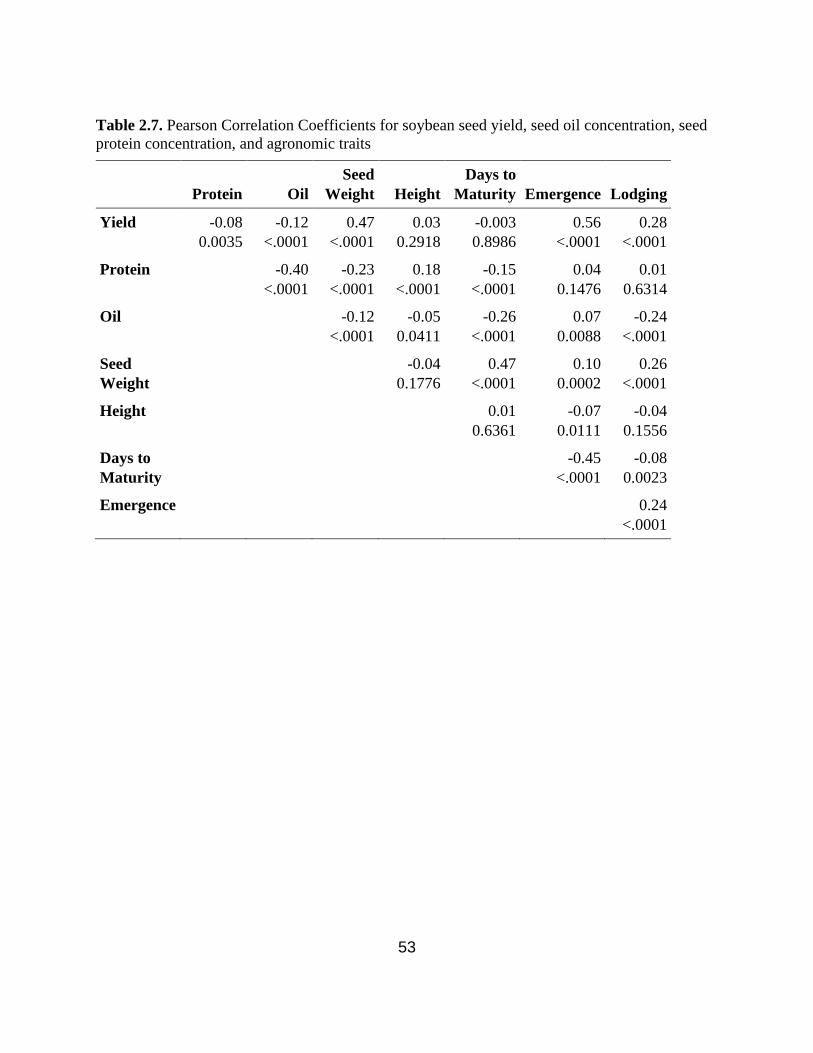
53
Table 2.7. Pearson Correlation Coefficients for soybean seed yield, seed oil concentration, seed
protein concentration, and agronomic traits
Protein Oil
Seed
Weight Height
Days to
Maturity Emergence Lodging
Yield -0.08
0.0035
-0.12
<.0001
0.47
<.0001
0.03
0.2918
-0.003
0.8986
0.56
<.0001
0.28
<.0001
Protein -0.40
<.0001
-0.23
<.0001
0.18
<.0001
-0.15
<.0001
0.04
0.1476
0.01
0.6314
Oil -0.12
<.0001
-0.05
0.0411
-0.26
<.0001
0.07
0.0088
-0.24
<.0001
Seed
Weight
-0.04
0.1776
0.47
<.0001
0.10
0.0002
0.26
<.0001
Height 0.01
0.6361
-0.07
0.0111
-0.04
0.1556
Days to
Maturity
-0.45
<.0001
-0.08
0.0023
Emergence 0.24
<.0001
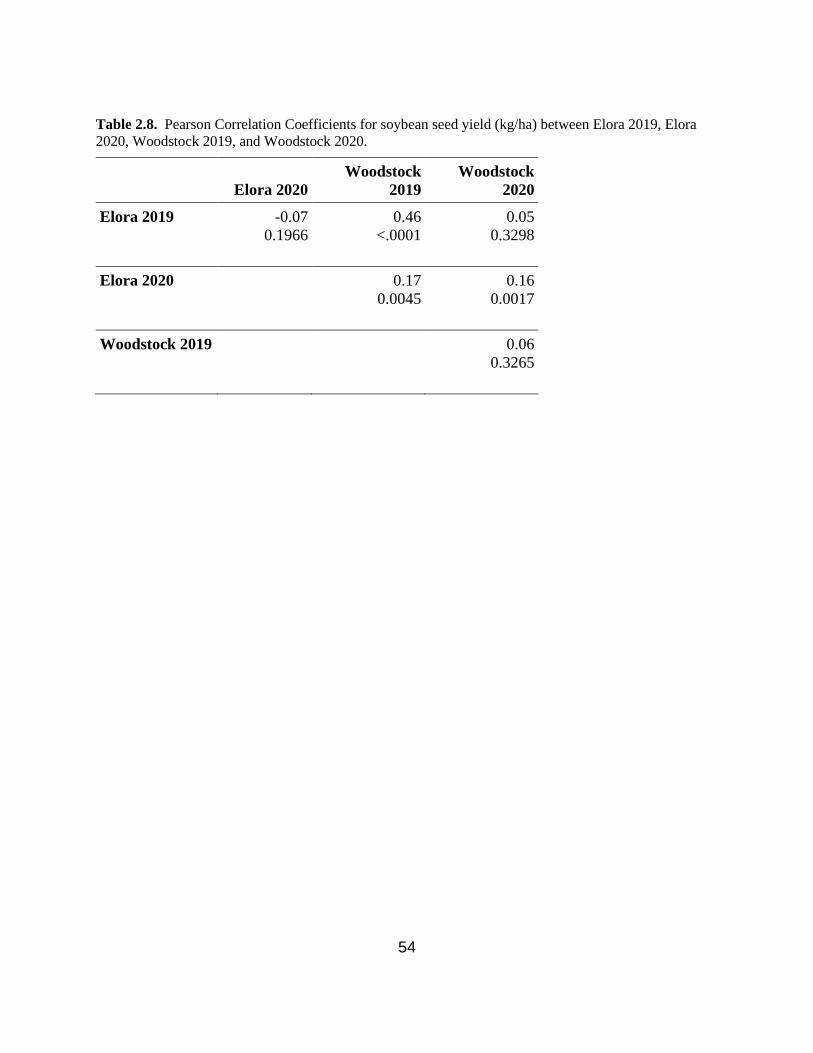
54
Table 2.8. Pearson Correlation Coefficients for soybean seed yield (kg/ha) between Elora 2019, Elora
2020, Woodstock 2019, and Woodstock 2020.
Elora 2020
Woodstock
2019
Woodstock
2020
Elora 2019 -0.07
0.1966
0.46
<.0001
0.05
0.3298
Elora 2020
0.17
0.0045
0.16
0.0017
Woodstock 2019
0.06
0.3265
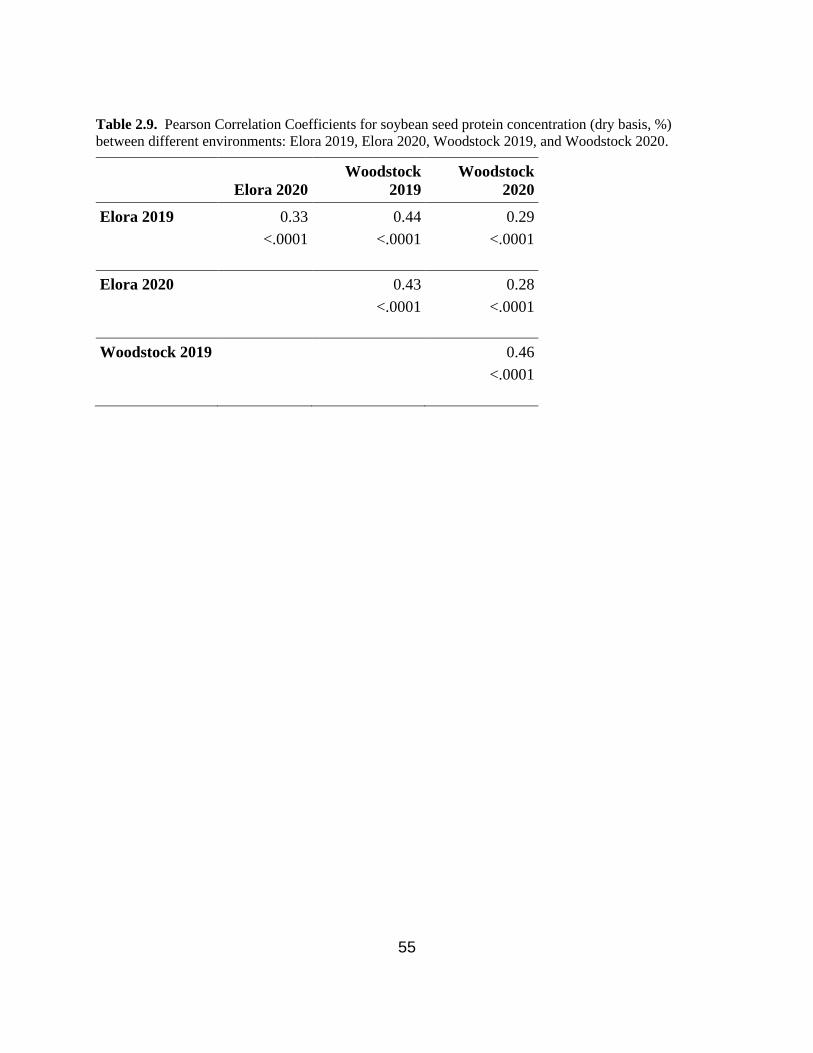
55
Table 2.9. Pearson Correlation Coefficients for soybean seed protein concentration (dry basis, %)
between different environments: Elora 2019, Elora 2020, Woodstock 2019, and Woodstock 2020.
Elora 2020
Woodstock
2019
Woodstock
2020
Elora 2019 0.33
<.0001
0.44
<.0001
0.29
<.0001
Elora 2020
0.43
<.0001
0.28
<.0001
Woodstock 2019
0.46
<.0001
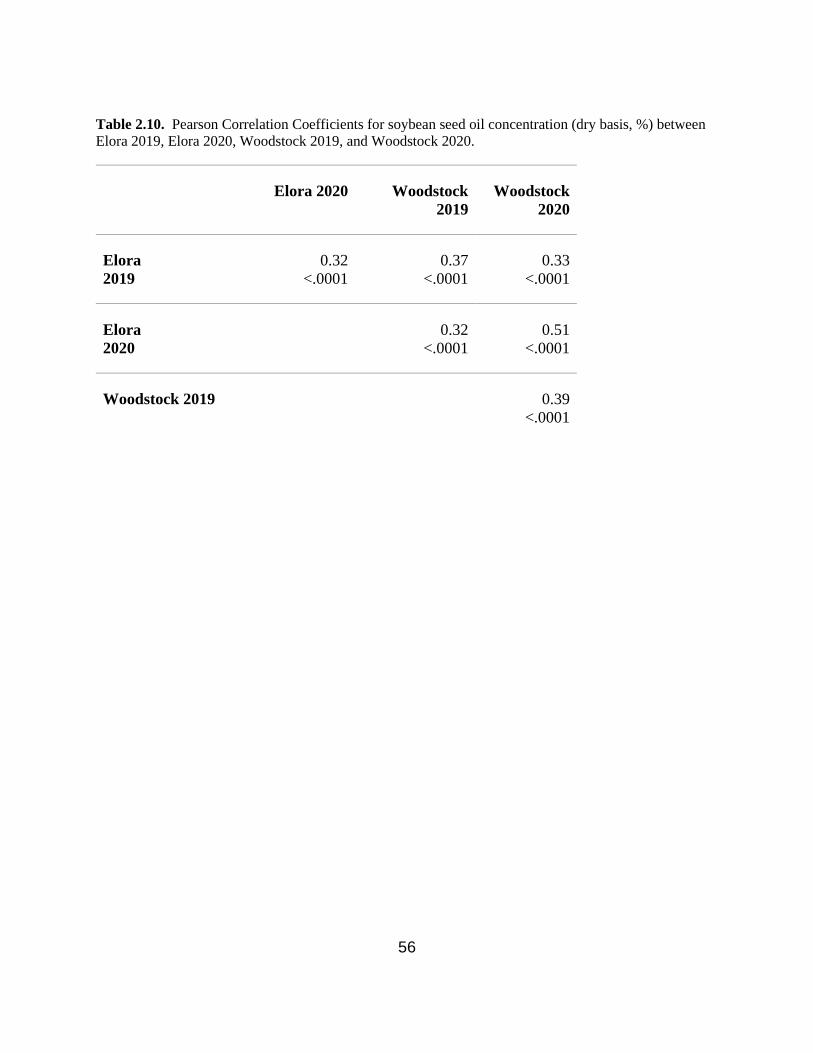
56
Table 2.10. Pearson Correlation Coefficients for soybean seed oil concentration (dry basis, %) between
Elora 2019, Elora 2020, Woodstock 2019, and Woodstock 2020.
Elora 2020 Woodstock
2019
Woodstock
2020
Elora
2019
0.32
<.0001
0.37
<.0001
0.33
<.0001
Elora
2020
0.32
<.0001
0.51
<.0001
Woodstock 2019 0.39
<.0001
57
Chapter 3. GWAS of Soybean Germplasm derived from Canadian x
Chinese Crosses to mine for seed yield, seed oil and seed protein
alleles
Abstract
Genome-wide association study (GWAS) has emerged in the past decade as a viable tool for
identifying beneficial alleles from a genomic diversity panel. In an ongoing effort to improve
soybean [(Glycine max (L.) Merr.], which is the third largest field crop in Canada, a GWAS was
conducted to identify novel alleles underlying seed yield and seed quality and agronomic traits.
The genomic panel consisted of 200 genotypes including lines derived from several generations
of bi-parental crosses between elite Canadian x Chinese cultivars (CD-CH). The genomic diversity
panel was field evaluated at two field locations in Ontario in 2019 and 2020. Genotyping-by-
sequencing (GBS) was conducted on DNA extracted leaf tissue. GWAS was conducted with 27,
911 SNP markers using the rMVP package in R, with Fixed and random model Circulating
Probability Unification (FarmCPU), on the following traits: seed yield, seed protein concentration,
seed oil concentration, plant height, 100-seed weight, days-to-maturity, and lodging score. A
genomic PCA matrix (P) and a genomic kinship (VanRaden) matrix (K) were used to capture the
population structure and relatedness. Three seed yield QTL, one seed oil QTL and one seed protein
QTL were identified. A candidate gene search identified a putative gene for each of the three traits,
i.e., soybean seed yield, seed oil concentration and seed protein concentration. The results of this
GWAS study provide insight into potentially valuable genetic resources residing in Chinese elite
cultivars that breeders may use to further improve soybean seed yield and seed quality traits.
58
3.1. Introduction
GWAS, though a relatively novel tool in the disciplines of plant breeding and molecular
biology, has seen widespread adoption in crops such as soybean, sorghum, capsicum, maize etc.
(Morris et al. 2012; Wang et al. 2012; Zhang et al. 2015, 2018a; Contreras-Soto et al. 2017; Han
et al. 2018). GWAS was reported to have better precision at identifying candidate genes compared
to other methods (Qi et al. 2014). The effect of population structure, kinship, and the extent of LD
on GWAS have all been highlighted to reduce its accuracy and efficiency of QTL detection (Street
and Ingvarsson 2010; Weir 2010; Korte 2013). However, improvements to GWAS design to
address these issues of kinship, population structure and spurious associations can be made through
adjustments to the model, adjustment of False Discovery Rate (FDR), and the use of modified
kinship and population structure matrices (Hyun et al. 2008; VanRaden 2008; Wang et al. 2012;
Li et al. 2013; Brzyski et al. 2017). Such modifications to GWAS design, along with more recent
advancements in software, allow for more robust detection of significant marker-trait association
discovery (Takeuchi et al. 2013; Tang et al. 2016; Kichaev et al. 2017; Qi et al. 2020; Yin et al.
2021).
There has been a growing concern regarding the narrowness of the North American
soybean germplasm with its potentially detrimental implications highlighted as a calls-to-action
(Gizlice et al. 1993; Kisha et al. 1998; Fu et al. 2007; Iquira et al. 2010; Mikel et al. 2010;
Barabaschi et al. 2012). The recurrent use of a small population of elite commercial cultivars in
breeding programs has been suggested to have exacerbated this problem (Mikel et al. 2010;
Keilwagen et al. 2014). Exotic or under-utilized germplasm has emerged as a desirable source of

59
novel genetic variation that could help breeders overcome these concerns (Sneller et al. 2005; Fox
et al. 2015; Wang et al. 2017; Kofsky et al. 2018; Gaire et al. 2020; Kilian et al. 2020). However,
the use of exotic germplasm has yet to be widely adopted despite a growing body of literature in
support of the use of under-utilized germplasm, as well as occurrences of positive contributions
from exotic or under-utilized germplasm sources (Palomeque et al. 2009b, a, 2010; Kim et al.
2011; Rossi et al. 2013; Akpertey et al. 2014; Bellaloui et al. 2017). One concern that has been
expressed is the hesitancy by breeders to dilute the genetic gains made in breeding programs by
potentially breaking up selection signatures (Grainger and Rajcan, 2014; Grainger et al., 2018; and
I. Rajcan, personal communication).
The limited understanding of how to properly evaluate the contributions from exotic
parents, especially given the quantitative nature of many desirable traits, as well as the
environmental factors that influence plant performance, has prevented the widespread use of exotic
germplasm (Palomeque et al. 2009a). To understand the role of environment and properly evaluate
soybean lines derived from elite adapted x elite exotic crosses, a bi-parental RIL population
derived from high-yielding Canadian cultivar ‘OAC Millennium’ and an elite Chinese cultivar
‘Heinong 38’ was evaluated by Palomeque et al. (2009a). Seven seed yield QTL, of which five
were universal, and two that were environment-specific were identified (Satt100, Satt162, Satt277,
Sat_126, Satt139-Sat_042, Satt194-SOYGPA, and Satt259-Satt576) (Palomeque et al. 2009a).
However, in a subsequent study, the authors were unable to validate these seven seed yield QTL
in a RIL population derived from Pioneer 9071; a high-yielding Canadian cultivar, and # 8902; a
high-yielding elite Chinese cultivar (Palomeque et al. 2010). The seed yield QTL tagged by
Satt162 was also found to be linked to three QTL associated with lodging, 100 seed weight and
60
number of pods per node each (Palomeque et al. 2009b). The authors reported validating this QTL
for lodging (Palomeque et al. 2010). Furthermore, Rossi et al. (2013) evaluated two RIL
populations derived from high-yielding Canadian cultivars and elite Chinese cultivars (OAC
Millennium x Heinong 38, and Pioneer 9071 x #8902) in Canada, United States, and China and
was able to identify two yield QTL in the first population and one yield QTL in the second
population, across all environments. It was also reported that yield QTL co-localized with
agronomic trait QTL. It should be highlighted that these studies were conducted using bi-parental
populations. GWAS, therefore, could potentially help identify novel QTL associated with seed
yield and other agronomic traits, while also facilitating the evaluation of the performance of exotic
cultivars in a genomic diversity panel.
The objective of this study was to identify novel alleles related to soybean seed yield, seed
protein and seed oil concentration, as well as agronomic traits, in a genomic panel of diverse
genotypes through GWAS. The panel included elite commercial cultivars developed at the
University of Guelph, progeny lines derived from crosses between elite adapted Canadian x elite
exotic Chinese cultivars, elite Chinese cultivars developed at the Chinese Academy of Sciences,
Heilongjiang Academy of Agricultural Sciences (HAAS), Jilin Academy of Agricultural Sciences
(JAAS), Liaoning Academy of Agricultural Sciences (LAAS), , and Northeast Agricultural
University (NAU), as well as other experimental lines developed at the University of Guelph.
61
3.2. Materials and methods
3.2.1. Plant materials
The genomic diversity panel consisted of 200 genotypes of elite Canadian (CD) cultivars
(n=59), elite Chinese (CH) cultivars (n=53), Canadian x Chinese (CD-CH) progeny lines (n=88)
(Appendix 1. Table S1.). All soybean lines were replicated twice per environment, in a nearest
neighbor Randomized Complete Block Design (nn-RCBD) with lines randomly assigned and
evaluated at each location (ERS, WRS) across two years (2019, 2020), as described in detail in the
previous chapter.
3.2.2. DNA extraction
Of the 200 lines included in the original panel, only 192 were included in GWAS
(Appendix 1. Table S1.). The genotypes that were excluded were Canadian cultivars and are listed
in Supplement S1. The following agronomic trait data was collected from each field season, along
with seed yield at harvest, 100 seed weight and seed oil and protein concentrations: emergence
score, plant height, days-to-maturity, and lodging score.
Leaf tissue was collected into labeled 10 ml plant-tissue collection tubes. One to two young
leaves were collected into each tube. These tubes were then transported on ice back to the Soybean
Research Laboratory at the University of Guelph in Guelph, ON. Leaf tissue samples were freeze
dried with a Labonco FreeZone® freeze dry system (Savant Moduly, Kansas City, MO, USA) for
a period of 24 hours and stored at -4ºC.
62
Genomic DNA was extracted from samples of freeze-dried leaf tissue by using
NucleoSpin® Plant II DNA extraction kit by Macherey-Nagel using the manufacturer’s
guidelines. Extracted DNA samples were spot tested with a NanoDrop 8000 machine
(ThermoFisher Scientific, Waltham, MA, USA) to check for protein/RNA contamination and to
verify the quality of genomic DNA. DNA concentration was established with the QuBit 4 DNA
Analyzer (ThermoFisher Scientific, Waltham, MA, USA) and was standardized to 10 ng/µl. A
precise volume of 10µl was pipetted out to two 96-well semi-skirted PCR plates, which were sent
to Plateforme d’analyses génomiques [Institut de Biologie Intégrative et des Systèmes (IBIS)],
Université Laval (Quebec, QC, Canada) for Genotyping-by-Sequencing (GBS) and SNP-calling.
3.2.3. Gentoyping and SNP Calling
GBS was conducted following the methods and recommendations outlined by Elshire et
al. (2011) and Sonah et al. (2013). The GBS library was created with ApeKI restriction enzyme
digestion. 158 million single end reads were generated with an Ion Torrent Proton System
(ThermoFisher Scientific Inc. USA). These were processed using the Fast-GBS.v2 pipeline as
described by Torkamaneh et al. (2020). FASTQ files were demultiplexed, trimmed and then
mapped against the soybean reference genome (Williams82 (Gmax_275_Wm82.a2.v1)) (Schmutz
et al. 2010) with an average success rate of 94.4% SNP identification from the mapped reads.
Reads were removed if i) they were multi-allelic, ii) the overall read quality (QUAL) score was
<20, iii) the mapping quality (MQ) score was <30, iv) read depth was <2, and v) missing data
>80%. Missing data imputation was performed using BEAGLE v5.1 (Browning et al. 2018)
following the protocol laid out by Torkamaneh and Belzile (2015).
63
3.2.4. GWAS
GWAS was conducted using the rMVP package in R (Yin et al. 2021) utilizing Fixed and
random model Circulating Probability Unification (FarmCPU) (Liu et al. 2016) on the following
traits: seed yield, seed protein concentration, seed oil concentration, plant height, 100-seed weight,
days-to-maturity, and lodging score. The FarmCPU model uses multiple loci linear mixed model
(MLMM), and incorporates multiple markers simultaneously as covariates in a stepwise MLM to
partially remove the confounding between testing markers and kinship (Liu et al. 2016). A
genomic PCA matrix (P) and a genomic kinship (VanRaden) matrix (K) were used to capture the
population structure and relatedness among individuals in the panel (Hyun et al. 2008; VanRaden
2008; Li et al. 2013). Genomic Association and Prediction Integrated Tool (GAPIT) (Lipka et al.
2012) was used to capture the LD decay of the SNP panel (Tang et al. 2016). An adjusted p value
(q value) was used to ensure a false discovery rate (FDR) < 0.05 and to establish a significance
threshold (Wang et al. 2012; Brzyski et al. 2017).
3.2.5. Candidate Gene Search
SNP markers significantly associated with a trait identified through GWAS were compared
to previously reported markers and genes annotated in Glyma1.1, Glyma1.0 and NCBI RefSeq
gene models in SoyBase Genome Browser (http://soybase.org) following similar methodology to
Zhang et al. (2015) to determine potential candidate genes. A length of 250 kb was added or
removed from either end of the significant marker to locate potential regions for comparison based
on the LD rate of the current population. In selecting candidate genes, the following criteria was
used: i) genes of known function in soybean related to the trait under study, ii) genes with function-
known orthologs in Arabidopsis related to the trait under study, and iii) genes pinpointed by the
64
peak SNPs. Putative candidate genes were subsequently researched in the literature for
verification.
3.3. Results
3.3.1. Genotyping and SNP Calling
A total of 158 million single-end reads were generated by GBS using the Ion Torrent Proton
system. These reads were then mapped against the soybean reference genome (Williams82
(Gmax_275_Wm82.a2.v1)) (Schmutz et al. 2010) with an average success rate of 94.4%. From a
total of 119,065 SNPs identified from mapping, 31, 931 SNPs remained after filtering as described.
A final number of 27,911 SNP markers were retained for GWAS.
3.3.2. GWAS and candidate gene search
GWAS was carried out using combined environment LSMEANS generated from the
analysis reported in the previous chapter, with a total of 27,911 SNP markers used for the following
traits: soybean seed yield, seed protein concentration, seed oil concentration, plant height, 100 seed
weight, days to maturity and lodging score.
Two major subpopulations, presumably corresponding to the Canadian and Chinese
dichotomy were identified (Figure 3.1). The kinship matrix revealed a low level of genetic
relatedness among the 200 genotypes, based on which a model including P+K terms was
determined to be the best of fit (Figure 3.2). The LD decay (r2) of the population was observed to
be half its maximum value at 250 Kb (Figure 3.3). Genomic SNP coverage for the panel of 200
soybean genotypes is depicted in figure 3.4. Evidently, the extent of LD decay varied among the
65
different chromosome regions, resulting in uneven coverage and some regions with no SNPs
identified.
SNP markers that were significantly associated with the traits of interest are listed in table
3.1 and table 3.2. The Manhattan plots and the corresponding QQ plots for these traits are depicted
in Figures 3.5 and 3.6. In total, 16 significant marker-trait associations were identified. Of these,
only the SNPs significantly associated with soybean seed yield (3 SNP), seed protein concentration
(1 SNP), and seed oil concentrations (1 SNP) were selected for candidate gene searching. The
significant SNP markers associated with the agronomic traits were excluded from candidate gene
search due to resource limitations and details of those traits being out-of-scope for the current
study. For the agronomic traits, a total of four SNPs were identified for 100 seed weight, two SNPs
for days to maturity, two for lodging score and one SNP for plant height.
The effect magnitudes of the minor allele on seed yield ranged from -111.2% to 162.9%
(Table 3.1, Figure 3.5). One SNP was significantly associated with seed yield on Chr 5
(S05_27809193) while two were detected on Chr 14 (S14_5870227 and S14_5884688). However,
a candidate gene was identified for only S14_5884688, with an effect magnitude of -108.8 %
(Table 3.1). Glyma.14g072200 was reported to encode inositol-pentakisphosphate 2-kinase 1 and
was identified as a potential candidate gene based on its function and proximity to S14_5884688.
For seed protein concentration, a single SNP on Chr 5 (S05_3040140) was identified as
significantly associated, with an effect magnitude of 0.86%. Glyma05g03760, which encodes
proprotein convertase subtilisin/kexin was identified as a potential candidate gene for
S05_3040140 (Table 3.1, Figure 3.5).
66
For seed oil concentration, a single SNP on Chr 19 (S19_43240106) (Table 3.1, Figure
3.5), with an effect magnitude of -0.40 % was identified through FarmCPU. Glyma.19g171000,
which encodes zinc finger FYVE domain containing protein was identified as the potential
candidate gene for S19_43240106.
Allele distribution among the different genotypic groups for the significant marker-trait
associations for seed yield, oil and protein concentration QTL was obtained from hapmap files and
compared against phenotype. Based on allele frequency, phenotypic data, and effect magnitudes
of the minor allele for the significant marker-trait associations identified from FarmCPU, it is
likely that both the Canadian and Chinese genotypic groups may have potentially contributed the
favourable allele to the seed yield QTL S14_5870227, S14_5884688, S05_27809193 and the
favourable allele for protein concentration QTL (S05_3040140) in the CD-CH group (Table 3.3).
The Canadian genotypic group was identified as likely to have been the major contributor of the
favourable allele for the seed oil QTL (S19_43240106) in the CD-CH group (Table 3.3).
For 100-seed weight, significant SNP-trait associations were detected in Chr 17
(S17_14271552) and Chr 18 (S18_2625222, S18_3536348 and S18_3820958) (Table 3.2, Figure
3.6). The effect magnitudes of the minor allele ranged from -0.85 % to -1.27 % for this trait. Chr
18 also contained one of the two significant SNP associations for days-to-maturity
(S18_17449562), with the other SNP located on Chr 15 (S15_46719323) for days-to-maturity
(Table 3.2, Figure 3.6). The effect magnitudes ranged from 4.86 % to 6.38 % for this trait (Table
3.2).

67
Only a single significant SNP was identified for plant height on Chr 5 (S05_4738203) with
an effect of -4.19 %. Lastly, two SNPs were identified on Chr 9 (S09_38461706) and Chr 19
(S19_39376171) for lodging, with effect magnitudes of 0.12 % and 0.13 % (Table 3.2, Figure 3.6).
3.4. Discussion
Three putative candidate genes were identified for seed yield, seed protein concentration
and seed oil concentration through FarmCPU. All the seed quality trait QTL identified in the
current study appeared novel. Both Canadian and Chinese germplasm were identified to have
contributed potentially beneficial alleles to both seed yield and seed protein QTL in the CD-CH
group. This provides further support to the beneficial nature of exotic germplasm. Moreover, the
observed allele distribution among the CD-CH group implies further opportunities for increasing
seed yield and seed quality traits, especially as indicated for the seed yield QTL identified on
chromosome 5. Validation of these QTL in these populations would be necessary in future studies
to confirm their effect in these traits. The QTL identified for seed oil concentration was only 1,275
kb away from Pal19, a QTL identified by Smallwood et al. (2017) for palmitic acid. Results of
this GWAS, along with the results reported in the previous chapter, lend further credence to the
utility of exotic germplasm as a source of novel genetic variety for continued crop improvement.
Yield gain, modified seed protein and seed oil profiles etc. will continue to be focal points for
breeders for decades to come (Smallwood 2015; Zhang et al. 2015; Bruce et al. 2019). Therefore,
the identification of these candidate genes and novel putative QTL provides a potential new source
of desirable genetics for further study and investigation.
The candidate gene identified for seed yield, Glyma14g072200, encodes inositol-
pentakisphosphate 2-kinase 1, whose expression was reported by Jin et al. (2021) to be down-
68
regulated during seed development stage 5. Jin et al. (2021) elucidated the effects of mutations in
MIPS1 and IPK1 genes on global changes in the gene expression profiles of developing soybean
seeds. The authors reported that these genes were involved phytic acid metabolism. Low phytic
acid content is desired by breeders due to the negative effects associated with its digestion in
humans and animals alike (Jin et al. 2021). Though the QTL of large effect is identified, tracking
down the causal gene is a tedious and time-consuming task. In addition, a single large-effect QTL
often breaks down into multiple, intricately linked QTL of smaller, and sometimes opposite effects
on the phenotype (Doerge 2002; Flint and Mackay 2009).
For soybean seed protein concentration, Glyma05g03760, which encodes proprotein
convertase subtilisin/kexin was identified as a potential candidate gene. This gene model was
reported to be a close homolog to the Arabidopsis thaliana gene AtSBT1.6 (Clarke et al. 2015).
The subtilase family proteases are serine peptidases and may be involved in nonselective
degradation of proteins, or as proprotein convertases, involved in a range of processes including
peptide hormone processing, plant interactions with microorganisms, seed germination and
distribution of stomata (Schaller et al. 2012). Furthermore, Clarke et al. (2015) reported that
Glyma05g03760 was identified to be involved in the symbiosome, which is rhizobia enclosed in a
plant-derived membrane to form organelle-like structures (Clarke et al. 2015; De La Peña et al.
2018).
Glyma19g171000 was identified as the candidate gene for seed oil concentration. This
putative gene encodes zinc finger FYVE domain containing protein that was identified by
Smallwood (2015) as a potential candidate for Pal19 QTL reported in their study. The zinc FYVE
finger domain, named after the four proteins Fab1, YOTB/ZK632.12, Vac1, and EEA1, is a highly

69
conserved domain that binds to phosphatidylinositol 3-phosphate that is found on endosomes
(Stenmark et al. 1996, 2002). The given location of Pal19 was only 1,275 kb distance away from
the position of S19_43240106, which makes it quite likely that they co-locate with the same
putative gene. In their study. Pal19 was one of the QTL identified for palmitic acid, which suggests
that the QTL identified by the current study may co-localize with the same gene. Furthermore,
Hyten et al. (2004) also reported identifying a QTL for palmitic acid in the same region.
Additionally, this gene was also identified as being expressed in conferring resistance to
Phytophthora sojae (Stasko 2018). Further investigation could potentially validate the underlying
gene responsible for this valuable trait rendering great benefit to future breeders. Though the effect
of the alternate allele at S14_5884688 had a strong negative effect on seed yield, it is quite likely
that a single large-effect QTL could consist of multiple, closely linked QTL of smaller, and
sometimes opposite effects on the phenotype as reported in literature (Doerge 2002; Flint and
Mackay 2009).
The extent of LD has been reported in literature to be a critical factor in mapping
resolution, affecting the number of markers required for adequate coverage of the genome for
GWAS (Nordborg et al. 2002; Clark et al. 2007; Weir 2008; MacKay et al. 2009; Viana et al.
2017). The variation of LD decay observed in different regions of the chromosomes infer that there
were potentially missed true trait-QTL associations. Furthermore, the LD decay observed in the
current study follows close to values reported in the literature for soybean (Greenspan and Geiger
2004; Zhang et al. 2015, 2018a). Clark et al. (2007) suggested that roughly one marker per kb was
sufficient for genomic coverage for predominantly self-pollinating crops. A total of 28,750 SNP
markers would have been required for appropriate SNP coverage for the current study as per Shultz
70
et al. (2006). Since a total of 27,911 SNP markers were retained for GWAS after processing, the
number of SNPs retained was deemed adequate (Jorgenson and Witte 2006; Shultz et al. 2006;
Torkamaneh and Belzile 2015). Genome-wide SNP coverage observed in the current study was
low with large gaps (Figure 3.4), therefore better SNP coverage with fewer chromosomal gaps
may to help identify more trait-QTL associations in the future. He et al. (2017) provided
suggestions on how to improve GWAS for low levels of polymorphisms and shortened LD decay
distance. Further refinement could be achieved by using LD block mapping (Bandillo et al. 2015),
inclusion of haplotype blocks (Greenspan and Geiger 2004; Contreras-Soto et al. 2017), SNPLDBs
(He et al. 2017), and the inclusion of RILs in the GWAS panel to help maximize the heritability
of QTL (Viana et al. 2017). These could all help improve the robustness of trait-QTL associations
and increase the rate of detection. Furthermore, Mohammadi et al. (2020) provide additional steps
to improve detection of true marker-trait associations through GWAS and validate QTL.
To the best of our knowledge, the current study is the first to investigate a genomic panel
consisting of elite Canadian, Chinese, and Canadian x Chinese progeny soybean lines in a GWAS
design to identify QTL for soybean seed yield, seed oil and protein concentrations. The results of
this study build upon the findings reported by previous authors (Palomeque et al. 2009b, a, 2010;
Rossi 2011; Rossi et al. 2013). The current study was able to identify novel QTL for seed yield,
seed oil and seed protein concentration, as well as agronomic traits. Though the latter were
excluded from the candidate gene search, future studies, with the inclusion of these traits along
with improved SNP coverage or alternative approaches, such as high-density mapping, could help
to overcome the limitations of the current study. In conclusion, the current study contributes to the
71
growing body of literature furthering our understanding of the true potential of exotic germplasm
and the genetics underlying seed quality and agronomic traits in soybean.

72
Table 3.1. Significant associated genomic regions for soybean seed yield, seed protein and seed
oil concentrations detected in combined-year GWAS analysis.
aThe effect of the minor allele on the respective trait. b NA, not available in database.
Trait Peak SNP ID
(Chr_Position
(bp))
Effecta
%
SE P-
Value
Candidate
Gene
Role
Seed Yield S05_27809193 162.9 37.1 1.89E
-05
NAb NA
S14_5870227 -111.2 25.4 1.98E
-05
NA NA
S14_5884688 -108.8 25.2 2.54E
-05
Glyma.14g072
200
Inositol-
pentakisphospha
te 2-kinase 1
Protein
Concentration
S05_3040140 0.86 0.19 1.99E
-05
Glyma.05g037
60
Subtilisin/kexin-
related serine
protease
Oil
Concentration
S19_43240106 -0.40 0.09 3.08E
-05
Glyma.19g171
000
Zinc finger
FYVE domain
containing
protein

74
Table 3.2. Significant associated genomic regions for the agronomic traits:100 seed weight, days-
to-maturity, plant height and lodging score detected in combined-year GWAS analysis.
Trait Peak SNP ID
(Chr_Position(bp)
)
Chr POS Effecta
%
SE P-value
Seed
Weight
S17_14271552 17 1427155
2
-1.27 0.29 2.53E-05
S18_2625222 18 2625222 -1.12 0.24 8.53E-06
S18_3536348 18 3536348 -1.03 0.22 4.38E-06
S18_3820958 18 3820958 -0.85 0.19 1.09E-05
Days to
Maturity
S15_46719323 15 4671932
3
4.867 1.12 2.48E-05
S18_17449562 18 1744956
2
6.38 1.46 2.20E-05
Plant
Height
S05_4738203 5 4738203 -4.19 0.94 1.35E-05
Lodging
Score
S09_38461706 9 3846170
6
0.12 0.03 2.65E-05
S19_39376171 19 3937617
1
0.12 0.03 4.16E-06
aThe effect of the minor allele on agronomic trait

75
Table 3.3. Distribution of alleles in Canadian, Chinese, and CD-CH germplasm for soybean seed
yield, seed oil and protein concentration QTL.
Trait/QTL Genotypic Group1 frequency of the
favourable allele2
favourable
allele
Yield S14_5884688 G
Canadian 20.34%
Chinese 18.87%
CD-CH 50.00%
S14_5870227 A
Canadian 20.34%
Chinese 20.75%
CD-CH 50.00%
S05_27809193 T Canadian 8.47%
Chinese 5.66%
CD-CH 9.09%
Protein Concentration S05_3040140 A Canadian 35.59%
Chinese 22.64%
CD-CH 43.18%
Oil Concentration S19_43240106 A Canadian 57.63%
Chinese 11.32%
CD-CH 35.234%
1number of soybean cultivars within each genotypic group that constituted the 200-member
GWAS panel: Canadian (n = 59), Chinese (n = 53), and CD-CH (n = 88) 2Frequency of the favourable allele within each genotypic group. Favourable allele as determined
based on estimated SNP effects from FarmCPU.
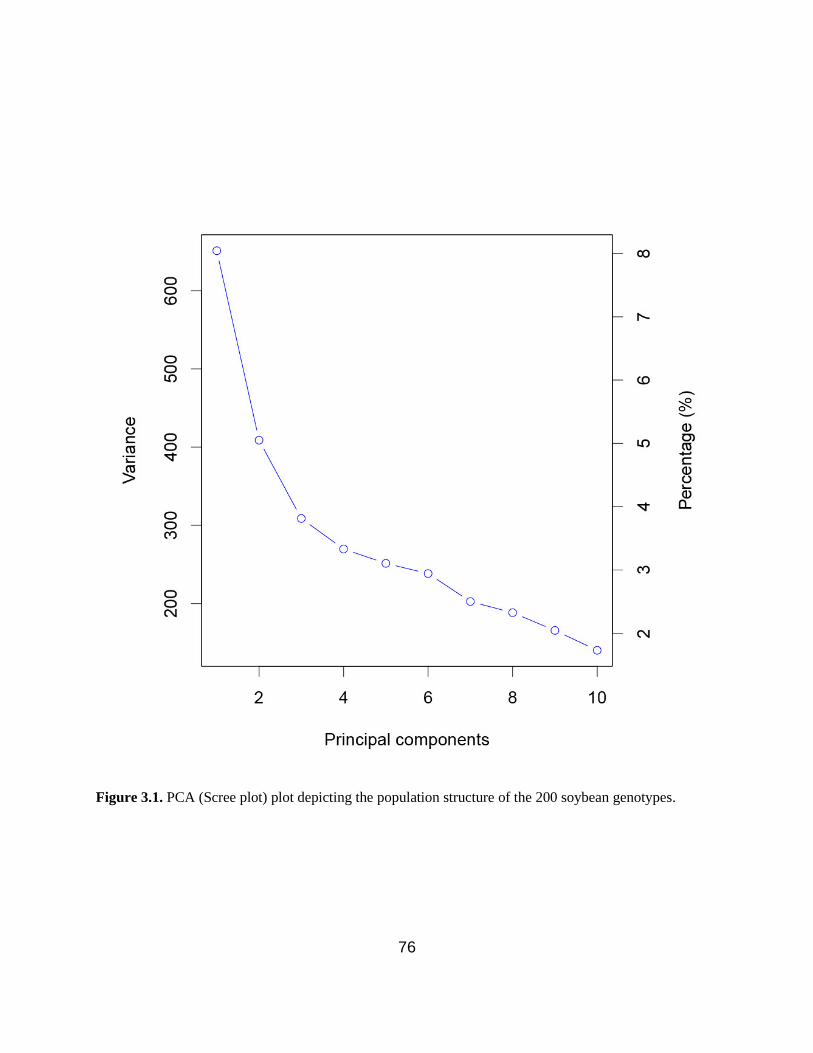
76
Figure 3.1. PCA (Scree plot) plot depicting the population structure of the 200 soybean genotypes.

77
Figure 3.2. The heatmap of the kinship matrix pf 200 soybean genotypes of the current GWAS.
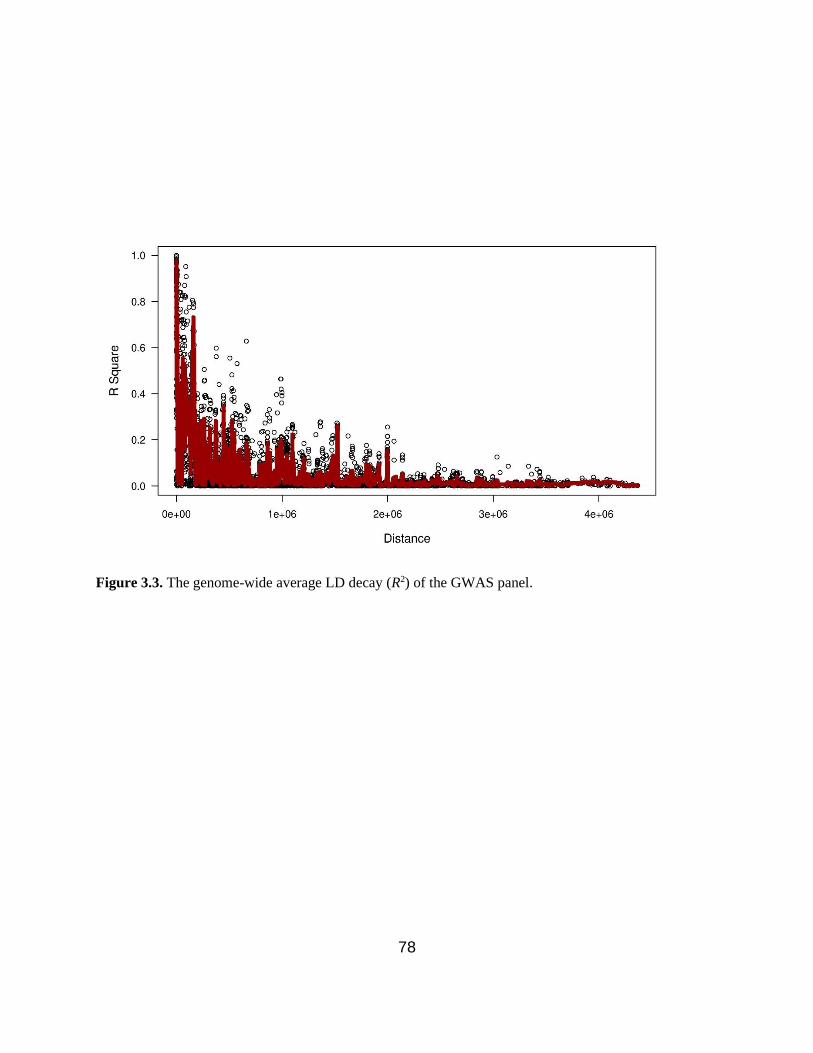
78
Figure 3.3. The genome-wide average LD decay (R2) of the GWAS panel.
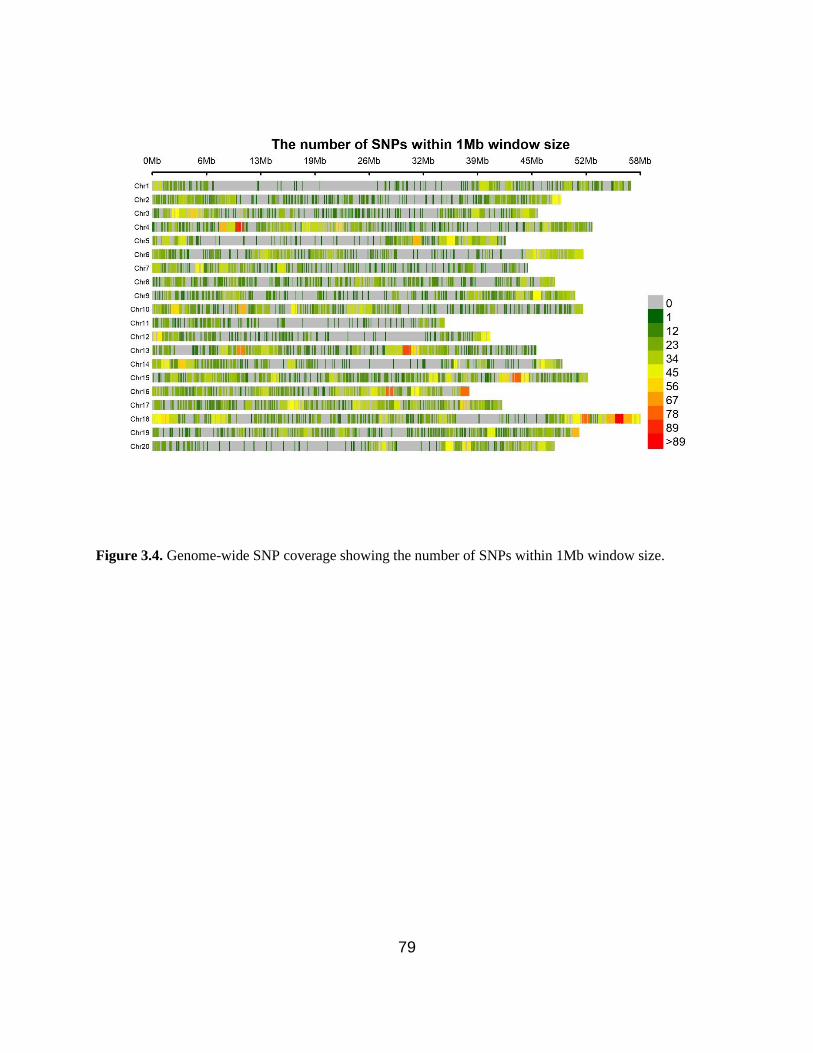
79
Figure 3.4. Genome-wide SNP coverage showing the number of SNPs within 1Mb window size.
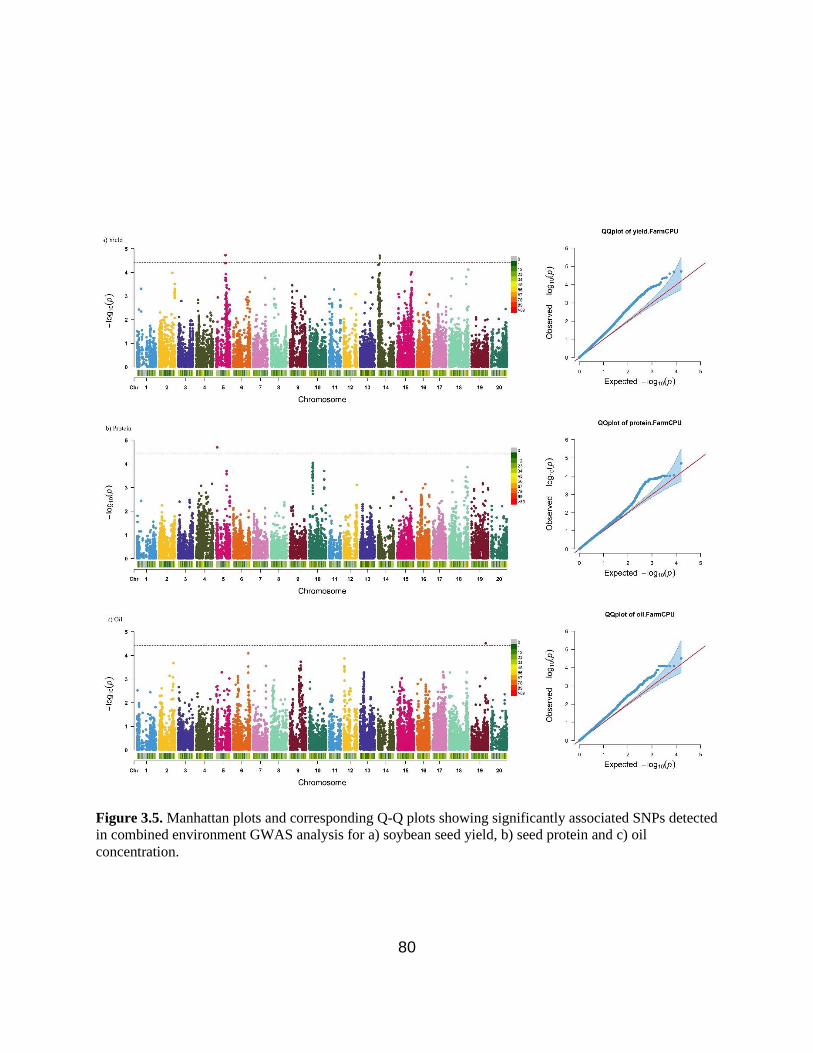
80
Figure 3.5. Manhattan plots and corresponding Q-Q plots showing significantly associated SNPs detected
in combined environment GWAS analysis for a) soybean seed yield, b) seed protein and c) oil
concentration.
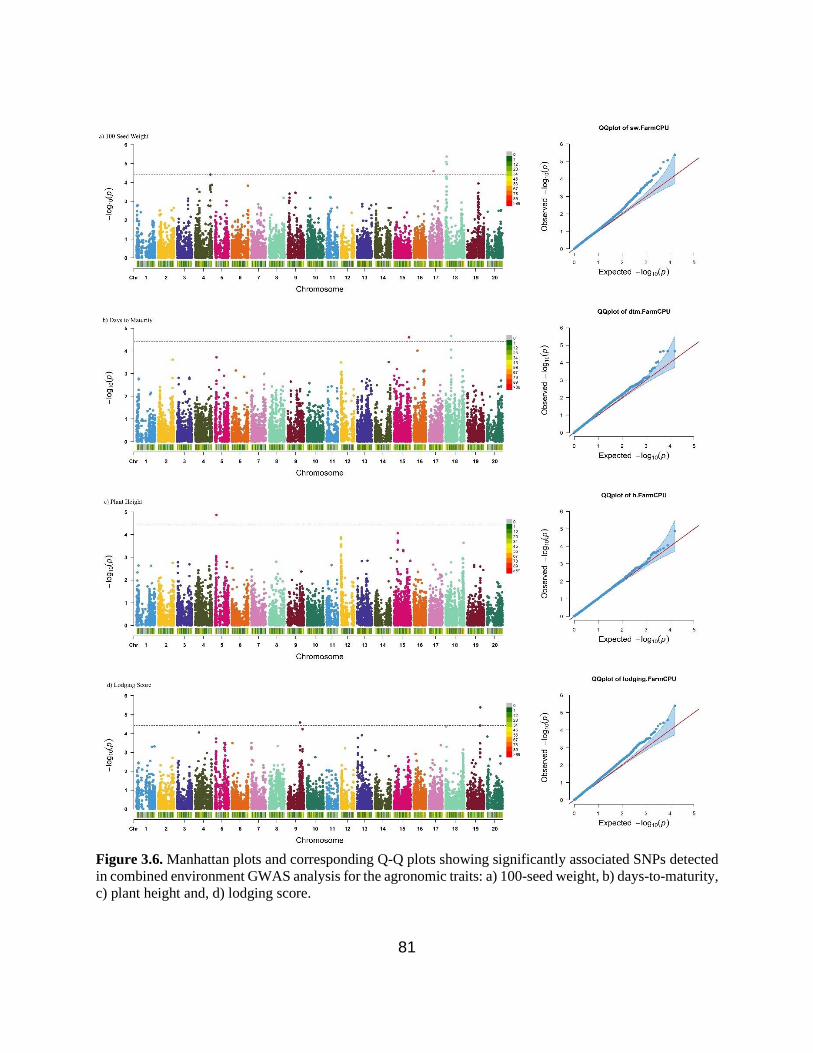
81
Figure 3.6. Manhattan plots and corresponding Q-Q plots showing significantly associated SNPs detected
in combined environment GWAS analysis for the agronomic traits: a) 100-seed weight, b) days-to-maturity,
c) plant height and, d) lodging score.
82
Chapter 4: General Discussion and Conclusions
4.1. General summary
Exotic germplasm has emerged as a viable solution to concerns regarding the narrow
genetic basis of the North American soybean germplasm, whereas 35 accessions represent 90% of
the genetics (Kisha et al. 1998; Sneller et al. 2005; Fox et al. 2015; Wang et al. 2017; Kofsky et
al. 2018; Gaire et al. 2020; Kilian et al. 2020). The adoption of exotic germplasm by breeders,
however, has been hampered by a lack of understanding on how to properly use and evaluate the
contributions of the exotic parents (Palomeque et al. 2009a).
To understand the role of environment and properly evaluate soybean lines derived from
elite adapted x elite exotic crosses, recombinant inbred soybean lines (RILs) derived from crosses
between elite adapted Canadian x elite exotic Chinese cultivars (CD-CH) were evaluated in
different environments (Palomeque et al. 2009b, a, 2010; Rossi et al. 2013). Significant variation
for seed yield and differential performance were observed in Canada and China among
recombinant inbred soybean lines (RILs) derived from crosses between elite adapted Canadian x
elite exotic Chinese cultivars (CD-CH) (Palomeque et al. 2009b, a, 2010; Rossi et al. 2013).
Building further upon these findings, the current thesis hypothesized that CD-CH lines contained
beneficial novel genetic variation for soybean seed yield, seed oil and protein, and traits of
agronomic interest that go beyond the individual Chines parent as reported earlier (Palomeque et
al. 2009b, a, 2010; Rossi et al. 2013in 2013). It was further hypothesized that alleles and genes
associated with soybean seed yield, seed protein, seed oil, and agronomic traits present in the
83
germplasm of populations derived from CD-CH lines would be identified in a genomic diversity
panel using GBS derived SNPs and GWAS.
The objective of this thesis was to identify novel alleles related to soybean seed yield, seed
protein and seed oil concentration, as well as agronomic traits from a genomic diversity panel. The
panel was evaluated in the field at Elora and Woodstock, ON, Canada, during 2019 and 2020. The
CD-CH group outperformed all others for seed yield, with a mean seed yield of 2582 kg/ha. For
seed oil and seed protein concentrations, however, Canadian cultivars outperformed both the CD-
CH and Chinese groups, having an average seed oil concentration of 20.4% and 41.2% of seed
protein. However, for either trait, the CD-CH group was not significantly different in performance
from the Canadian genotypic group.
Three putative candidate genes were identified for seed yield (Glyma.14g072200), seed
protein concentration (Glyma05g03760) and seed oil concentration (Glyma.19g171000). All the
QTL identified in the current study were novel, however, the QTL identified for seed oil
concentration was only 1,275 kb away from Pal19, a QTL identified by Smallwood et al. (2017)
for palmitic acid.
The Canadian genotypic group was deduced to have contributed the favourable allele at
the oil concentration QTL. Both groups appeared to have contributed beneficial alleles to seed
yield QTL, as well as the seed protein QTL. The allele distribution observed in the CD-CH group
provides further opportunity for yield and seed quality trait improvement in these cultivars.
To the best of our knowledge, this thesis is the first to report on a GWAS conducted on a
diversity panel that included advanced progeny lines derived from the progeny of crosses involving

84
elite adapted Canadian x elite exotic Chinese cultivars (CD-CH). The seed yield potential of CD-
CH group observed in this thesis provides further evidence to the potentially beneficial
contributions from exotic elite germplasm for continued improvement of seed yield, and
presumptively seed quality, biotic and abiotic stress resistance.
4.2. Limitations
Due to poor germination, lack of sufficient seed quantities, and machine or combine error,
several cultivars were excluded from the final analysis. Furthermore, not all 200 genotypes were
evaluated each year at each location. The first year of field evaluations consisted of a reduced
number of genotypes per location, largely excluding the Chinese cultivars from field trials due to
poor seed germination or lack of sufficient seed quantities. The uneven number of soybean
cultivars in each year limited the statistical comparisons between different genotypic groups across
years.
The SNP density coverage reported in the current study implies that potential true trait-
marker associations may have been missed. Although QTL were identified successfully in this
study for both seed quality and agronomic traits, better SNP density could help improve the number
of QTL identified per trait. Furthermore, evaluating the same genomic panel in more than two
environments could help better account for the combination of genotypic (G) and Genotype x
Environment (G x E) effects potentially accounting for the variation observed.
4.3. Future directions
The practice of good science relies on replication and verification of results. Therefore, the
inclusion of more environments or replications, and the inclusion of all genotypes at each location

85
for at least two field years could help reduce the unexplained variation, estimate G and GxE effects
more accurately, and evaluate the performance of the three key genotypic diversity groups
included in this study: Canadian, CD-CH and Chinese cultivars.
Additionally, a high-density QTL mapping study should be conducted to get better SNP
coverage and identify more QTL for yield, seed quality and agronomic traits. Validation of the
QTL identified in this thesis through haplotype study could help elucidate the genetic background
of CD-CH lines. Moreover, the expansion of traits under study, going beyond seed yield, seed oil
and seed protein would be imperative to address the growing demand for varied end uses of
soybean. The GWAS panel provides an opportunity for the latter in the future.

86
References
Akpertey A, Belaffif M, Graef GL, et al (2014) Effects of selective genetic introgression from
wild soybean to soybean. Crop Sci 54:2683–2695. doi: 10.2135/cropsci2014.03.0189
Bandillo N, Jarquin D, Song Q, et al (2015) A Population Structure and Genome‐Wide
Association Analysis on the USDA Soybean Germplasm Collection. Plant Genome 8:. doi:
10.3835/plantgenome2015.04.0024
Barabaschi D, Guerra D, Lacrima K, et al (2012) Emerging knowledge from genome sequencing
of crop species. Mol Biotechnol 50:250–266. doi: 10.1007/s12033-011-9443-1
Bellaloui N, Smith JR, Mengistu A, et al (2017) Evaluation of exotically-derived soybean
breeding lines for seed yield, germination, damage, and composition under dryland
production in the Midsouthern USA. Front Plant Sci 8:1–20. doi: 10.3389/fpls.2017.00176
Bernardo R (2009) Genomewide selection for rapid introgression of exotic germplasm in maize.
Crop Sci 49:419–425. doi: 10.2135/cropsci2008.08.0452
Bernatzky R, Tanksley SD (1986) Toward a saturated linkage map in tomato based on isozymes
and random cDNA sequences. Genetics 112:887–898
Bilyeu KD, Beuselinck PR (2005) Genetic divergence between North American ancestral
soybean lines and introductions with resistance to soybean cyst nematode revealed by
chloroplast haplotype. J Hered 96:593–599. doi: 10.1093/jhered/esi087
Browning BL, Zhou Y, Browning SR (2018) A One-Penny Imputed Genome from Next-
Generation Reference Panels. Am J Hum Genet 103:338–348. doi:
10.1016/j.ajhg.2018.07.015
Bruce RW, Grainger CM, Ficht A, et al (2019) Trends in soybean trait improvement over
generations of selective breeding. Crop Sci 59:1870–1879. doi:
10.2135/cropsci2018.11.0664
Brzyski D, Peterson CB, Sobczyk P, et al (2017) Controlling the rate of GWAS false discoveries.
Genetics 205:61–75. doi: 10.1534/genetics.116.193987
Cai Z, Cheng Y, Ma Z, et al (2018) Fine-mapping of QTLs for individual and total isoflavone
content in soybean (Glycine max L.) using a high-density genetic map. Theor Appl Genet
131:555–568. doi: 10.1007/s00122-017-3018-x
Camp MJ, Meek D, West M, et al (2018) Generalized Linear Mixed Model Estimation Using
Proc Glimmix: Results From Simulations When the Data and Model Match, and When the
Model Is Misspecified. Conf Appl Stat Agric. doi: 10.4148/2475-7772.1064
87
Chang F, Guo C, Sun F, et al (2018a) Genome-wide association studies for dynamic plant height
and number of nodes on the main stem in summer sowing soybeans. Front Plant Sci 9:1–13.
doi: 10.3389/fpls.2018.01184
Chang M, He L, Cai L (2018b) Chapter 6 An Overview of Genome-Wide Association Studies.
1754:97–108
Chung J, Babka HL, Graef GL, et al (2003) The seed protein, oil, and yield QTL on soybean
linkage group I. Crop Sci 43:1053–1067. doi: 10.2135/cropsci2003.1053
Clark RM, Schweikert G, Toomajian C, et al (2007) Common Sequence Polymorphisms Shaping
Genetic Diversity in Arabidopsis thaliana. Science (80- ) 317:338–342. doi:
10.1126/science.1138632
Clarke VC, Loughlin PC, Gavrin A, et al (2015) Proteomic analysis of the soybean symbiosome
identifies new symbiotic proteins. Mol Cell Proteomics 14:1301–1322. doi:
10.1074/mcp.M114.043166
Concibido VC, La Vallee B, Mclaird P, et al (2003) Introgression of a quantitative trait locus for
yield from Glycine soja into commercial soybean cultivars. Theor Appl Genet 106:575–
582. doi: 10.1007/s00122-002-1071-5
Contreras-Soto RI, Mora F, De Oliveira MAR, et al (2017) A genome-wide association study for
agronomic traits in soybean using SNP markers and SNP-Based haplotype analysis. PLoS
One 12:1–22. doi: 10.1371/journal.pone.0171105
Costa JM, Kronstad WE (1994) Association of Grain Protein Concentration and Selected Traits
in Hard Red Winter Wheat Populations in the Pacific Northwest. Crop Sci 34:1234. doi:
10.2135/cropsci1994.0011183X003400050017x
Cowling WA, Li L, Siddique KHM, et al (2017) Evolving gene banks: Improving diverse
populations of crop and exotic germplasm with optimal contribution selection. J Exp Bot
68:1927–1939. doi: 10.1093/jxb/erw406
Cui Z, Thomas E, Carter J, Burton J (2000) Genetic diversity patterns in North American Public
Soybean Cultivars based on Coefficient of Parentage. Crop Sci ence 40:1780–1793. doi:
10.2135/cropsci1996.0011183X003600030038x
De La Peña TC, Fedorova E, Pueyo JJ, Mercedes Lucas M (2018) The symbiosome: Legume
and rhizobia co-evolution toward a nitrogen-fixing organelle? Front Plant Sci 8:1–26. doi:
10.3389/fpls.2017.02229
Delannay X, Rodgers DM, Palmer RG (1983) Relative Genetic Contributions Among Ancestral
Lines to North American Soybean Cultivars1. Crop Sci 23:944. doi:
10.2135/cropsci1983.0011183X002300050031x
88
Diers BW, Specht J, Rainey KM, et al (2018) Genetic Architecture of Soybean Yield and
Agronomic Traits. G3&#58; Genes|Genomes|Genetics 8:3367–3375. doi:
10.1534/g3.118.200332
Doerge RW (2002) Mapping and analysis of quantitative trait loci in experimental populations.
Nat Rev Genet 3:43–52. doi: 10.1038/nrg703
Ehlers JD, Foster KW (1993) Introgression of agronomic characters from exotic cowpea
germplasm into blackeye bean. F Crop Res 35:43–50. doi: 10.1016/0378-4290(93)90135-A
Elshire RJ, Glaubitz JC, Sun Q, et al (2011) A robust, simple genotyping-by-sequencing (GBS)
approach for high diversity species. PLoS One 6:1–10. doi: 10.1371/journal.pone.0019379
Ernpig LT, Fehr WR (1971) Evaluation of Methods for Generation Advance in Bulk Hybrid
Soybean Populations. 1–4
Eskandari M, Cober ER, Rajcan I (2013) Genetic control of soybean seed oil: II. QTL and genes
that increase oil concentration without decreasing protein or with increased seed yield.
Theor Appl Genet 126:1677–1687. doi: 10.1007/s00122-013-2083-z
Fallen BD, Rainey K, Sams CE, et al (2012) Evaluation of agronomic and seed characteristics in
elevated oleic acid soybean lines in the south-Eastern US. JAOCS, J Am Oil Chem Soc
89:1333–1343. doi: 10.1007/s11746-012-2026-x
FAO (2020) Food Security and Nutrition in the World. IEEE J Sel Top Appl Earth Obs Remote
Sens 320
Feng L, Burton JW, Carter TE, et al (2011) Genetic analysis of populations derived from matings
of southern and northern soybean cultivars. Crop Sci 51:2479–2488. doi:
10.2135/cropsci2010.12.0718
Ficht AM (2018) Genetic Analysis of Sucrose Concentration in Soybean Seeds Using a
Historical Soybean Genomic Panel. University of Guelph In
Flint J, Mackay TFC (2009) Genetic architecture of quantitative traits in mice, flies, and humans.
Genome Res 19:723–733. doi: 10.1101/gr.086660.108
Fox CM, Cary T, Nelson R, Diers BW (2015) Confirmation of a seed yield QTL in soybean.
Crop Sci 55:992–998. doi: 10.2135/cropsci2014.10.0688
Friedman M, Brandon DL (2001) Nutritional and health benefits of soy proteins. J Agric Food
Chem 49:1069–1086. doi: 10.1021/jf0009246
Friedrichs MR, Burton JW, Brownie C (2016) Heterosis and genetic variance in soybean
recombinant inbred line populations. Crop Sci 56:2072–2079. doi:
10.2135/cropsci2015.11.0702
89
Fu Y, Peterson G, Morrison M (2007) Genetic Diversity of Canadian Soybean Cultivars and
Exotic Germplasm ... Crop Sci 47:1947–1953. doi: 10.2135/cropsci2006.12.0843
Gaire R, Ohm H, Brown-Guedira G, Mohammadi M (2020) Identification of regions under
selection and loci controlling agronomic traits in a soft red winter wheat population. Plant
Genome 13:1–18. doi: 10.1002/tpg2.20031
Garcia del Moral LF, Boujenna A, Yanez JA, et al (2000) Forage production, grain yield, and
protein content in dual-purpose triticale grown for both grain and forage (multiple letters).
Agron J 92:1042–1045
Gizlice Z, Carter TE, Burton JW (1994) Genetic Base for North American Public Soybean
Cultivars Released between 1947 and 1988. 34:. doi:
10.2135/cropsci1994.0011183X003400050001x
Gizlice Z, Carter TE, Burton JW (1993) Genetic Diversity in North American Soybean: I.
Multivariate Analysis of Founding Stock and Relation to Coefficient of Parentage. Crop Sci
33:614. doi: 10.2135/cropsci1993.0011183X003300030038x
Greenspan G, Geiger D (2004) Model-based inference of haplotype block variation. J Comput
Biol 11:493–504. doi: 10.1089/1066527041410300
Guzman PS, Diers BW, Neece DJ, et al (2007) QTL associated with yield in three backcross-
derived populations of soybean. Crop Sci 47:111–122. doi: 10.2135/cropsci2006.01.0003
Hallauer AR (2007) History, contribution, and future of quantitative genetics in plant breeding:
Lessons from maize. Crop Sci 47:. doi: 10.2135/cropsci2007.04.0002IPBS
Hamblin MT, Jannink J-L (2011) Factors Affecting the Power of Haplotype Markers in
Association Studies. Plant Genome 4:145–153. doi: 10.3835/plantgenome2011.03.0008
Han K, Lee HY, Ro NY, et al (2018) QTL mapping and GWAS reveal candidate genes
controlling capsaicinoid content in Capsicum. Plant Biotechnol J 16:1546–1558. doi:
10.1111/pbi.12894
Han Y, Zhao X, Liu D, et al (2016) Domestication footprints anchor genomic regions of
agronomic importance in soybeans. New Phytol 209:871–884. doi: 10.1111/nph.13626
He J, Meng S, Zhao T, et al (2017) An innovative procedure of genome-wide association
analysis fits studies on germplasm population and plant breeding. Theor Appl Genet
130:2327–2343. doi: 10.1007/s00122-017-2962-9
Hegstad JM, Nelson RL, Renny-Byfield S, et al (2019) Introgression of novel genetic diversity
to improve soybean yield. Theor Appl Genet 132:2541–2552. doi: 10.1007/s00122-019-
03369-2

90
Hoffmann L, Rooney WL, Ciampitti I, Prasad V (2018) Sorghum Improvement for Yield. 1–16.
doi: 10.2134/agronmonogr58.2014.0055
Hymowitz T, Harlan JR (1983) Introduction of soybean to North America by Samuel Bowen in
1765. Econ Bot 37:371–379. doi: 10.1007/BF02904196
Hyten DL, Cregan PB, Specht JE, et al (2014) A genome-wide association study of seed protein
and oil content in soybean. BMC Genomics 15:1. doi: 10.1186/1471-2164-15-1
Hyten DL, Pantalone VR, Saxton AM, et al (2004) Molecular mapping and identification of
soybean fatty acid modifier quantitative trait loci. JAOCS, J Am Oil Chem Soc 81:1115–
1118. doi: 10.1007/s11746-004-1027-z
Hyten DL, Song Q, Zhu Y, et al (2006) Impact of genetic bottlenecks on soybean genome
diversity. Proc Natl Acad Sci U S A 103:16666–16671. doi: 10.1073/pnas.0604379103
Hyun MK, Zaitlen NA, Wade CM, et al (2008) Efficient control of population structure in model
organism association mapping. Genetics 178:1709–1723. doi: 10.1534/genetics.107.080101
Ininda J, Fehr WR, Cianzio SR, Schnebly SR (1996) Genetic gain in soybean populations with
different percentages of plant introduction parentage. Crop Sci 36:1470–1472. doi:
10.2135/cropsci1996.0011183X003600060008x
Iquira E, Gagnon E, Belzile F (2010) Comparison of genetic diversity between Canadian adapted
genotypes and exotic germplasm of soybean. Genome 53:337–345. doi: 10.1139/G10-009
Isabela Rodrigues J da S, Mi-, Fábio Demolinari de, et al (2016) QTL mapping for yield
components and agronomic traits in a Brazilian soybean population. Crop Breed Appl
Biotechnol 16:265–273
Jeong SC, Moon JK, Park SK, et al (2018) Genetic Diversity Patterns and Domestication Origin
of Soybean. bioRxiv. doi: 10.1101/369421
Jiménez-Gómez J (2011) Next generation quantitative genetics in plants. Front Plant Sci 2:1–10.
doi: 10.3389/fpls.2011.00077
Jin H, Yu X, Yang Q, et al (2021) Transcriptome analysis identifies differentially expressed
genes in the progenies of a cross between two low phytic acid soybean mutants. Sci Rep
11:8740. doi: 10.1038/s41598-021-88055-4
Jorgenson E, Witte JS (2006) Coverage and power in genomewide association studies. Am J
Hum Genet 78:884–888. doi: 10.1086/503751
Kabelka EA, Diers BW, Fehr WR, et al (2004) Putative Alleles for Increased Yield from
Soybean Plant Introductions. Crop Sci 44:784. doi: 10.2135/cropsci2004.7840
91
Karikari B, Wang Z, Zhou Y, et al (2020) Identification of quantitative trait nucleotides and
candidate genes for soybean seed weight by multiple models of genome-wide association
study. BMC Plant Biol 20:1–14. doi: 10.1186/s12870-020-02604-z
Keilwagen J, Kilian B, Özkan H, et al (2014) Separating the wheat from the chaff - A strategy to
utilize plant genetic resources from ex situ genebanks. Sci Rep 4:14–18. doi:
10.1038/srep05231
Kichaev G, Bhatia G, Loh P-R, et al (2017) Leveraging polygenic functional enrichment to
improve GWAS power. bioRxiv 104:65–75. doi: 10.1101/222265
Kilian B, Dempewolf H, Guarino L, et al (2020) Crop Science special issue: Adapting
agriculture to climate change: A walk on the wild side . Crop Sci 1–5. doi:
10.1002/csc2.20418
Kim KS, Diers BW, Hyten DL, et al (2012) Identification of positive yield QTL alleles from
exotic soybean germplasm in two backcross populations. Theor Appl Genet 125:1353–
1369. doi: 10.1007/s00122-012-1944-1
Kim M, Hyten DL, Niblack TL, Diers BW (2011) Stacking resistance alleles from wild and
domestic soybean sources improves soybean cyst nematode resistance. Crop Sci 51:934–
943. doi: 10.2135/cropsci2010.08.0459
Kinney AJ (1996) Development of genetically engineered soybean oils for food applications. J
Food Lipids 3:273–292. doi: 10.1111/j.1745-4522.1996.tb00074.x
Kinney AJ, Clemente TE (2005) Modifying soybean oil for enhanced performance in biodiesel
blends. Fuel Process Technol 86:1137–1147. doi: 10.1016/j.fuproc.2004.11.008
Kisha TJ, Diers BW, Hoyt JM, Sneller CH (1998) Genetic diversity among soybean plant
introductions and North American germplasm. Crop Sci 38:1669–1680. doi:
10.2135/cropsci1998.0011183X003800060042x
Koester RP, Skoneczka JA, Cary TR, et al (2014) Historical gains in soybean (Glycine max
Merr.) seed yield are driven by linear increases in light interception, energy conversion, and
partitioning efficiencies. J Exp Bot 65:3311–3321. doi: 10.1093/jxb/eru187
Kofsky J, Zhang H, Song BH (2018) The untapped genetic reservoir: The past, current, and
future applications of the wild soybean (Glycine soja). Front Plant Sci 9:. doi:
10.3389/fpls.2018.00949
Kong F, Yuan X, Lu S, et al (2018) Quantitative Trait Locus Mapping of Flowering Time and
Maturity in Soybean Using Next-Generation Sequencing-Based Analysis. Front Plant Sci
9:1–20. doi: 10.3389/fpls.2018.00995
Korte A (2013) The advantages and limitations of trait analysis with GWAS : a review Self-

92
fertilisation makes Arabidopsis particularly well suited to GWAS. Plant Methods 9:29
Lee S, Van K, Sung M, et al (2019) Genome-wide association study of seed protein, oil and
amino acid contents in soybean from maturity groups I to IV. Theor Appl Genet 132:1639–
1659. doi: 10.1007/s00122-019-03304-5
Lee WK, Kim N, Kim J, et al (2013) Dynamic genetic features of chromosomes revealed by
comparison of soybean genetic and sequence-based physical maps. Theor Appl Genet
126:1103–1119. doi: 10.1007/s00122-012-2039-8
Li H, Peng Z, Yang X, et al (2013) Genome-wide association study dissects the genetic
architecture of oil biosynthesis in maize kernels. Nat Genet 45:43–50. doi: 10.1038/ng.2484
Li Y, Willer C, Sanna S, Abecasis G (2009) Genotype Imputation. Annu Rev Genomics Hum
Genet 10:387–406. doi: 10.1146/annurev.genom.9.081307.164242
Liang H, Xu L, Yu Y, et al (2016) Identification of QTLs with main, epistatic and QTL by
environment interaction effects for seed shape and hundred-seed weight in soybean across
multiple years. J Genet 95:475–477. doi: 10.1007/s12041-016-0648-8
Lipka AE, Tian F, Wang Q, et al (2012) GAPIT: Genome association and prediction integrated
tool. Bioinformatics 28:2397–2399. doi: 10.1093/bioinformatics/bts444
Liu X, Huang M, Fan B, et al (2016) Iterative Usage of Fixed and Random Effect Models for
Powerful and Efficient Genome-Wide Association Studies. PLOS Genet 12:e1005767. doi:
10.1371/journal.pgen.1005767
Longin CFH, Reif JC (2014) Redesigning the exploitation of wheat genetic resources. Trends
Plant Sci 19:631–636. doi: 10.1016/j.tplants.2014.06.012
Lule VK, Garg S, Pophaly SD, et al (2015) “Potential health benefits of lunasin: A multifaceted
soy-derived bioactive peptide.” J Food Sci 80:C485–C494. doi: 10.1111/1750-3841.12786
MacKay TFC, Stone EA, Ayroles JF (2009) The genetics of quantitative traits: Challenges and
prospects. Nat Rev Genet 10:565–577. doi: 10.1038/nrg2612
McCue P, Shetty K (2004) Health benefits of soy isoflavonoids and strategies for enhancement:
A review. Crit Rev Food Sci Nutr 44:361–367. doi: 10.1080/10408690490509591
Messina M (2016) Soy and health update: Evaluation of the clinical and epidemiologic literature.
Nutrients 8:. doi: 10.3390/nu8120754
Messina MJ (1999) Legumes and soybeans : overview of their nutritional profiles and. Am J Clin
Nutr 70:439–450
Mickelbart M V., Hasegawa PM, Bailey-Serres J (2015) Genetic mechanisms of abiotic stress
93
tolerance that translate to crop yield stability. Nat. Rev. Genet. 16:237–251
Mikel MA, Diers BW, Nelson RL, Smith HH (2010) Genetic diversity and agronomic
improvement of north american soybean germplasm. Crop Sci 50:1220–1228. doi:
10.2135/cropsci2009.08.0456
Mimura M, Coyne CJ, Bambuck MW, Lumpkin TA (2007) SSR diversity of vegetable soybean
[Glycine max (L.) Merr.]. Genet Resour Crop Evol 54:497–508. doi: 10.1007/s10722-006-
0006-4
Mittal G, Jiang Y, Kakuda Y, et al (2004) Saponins from Edible Legumes: Chemistry,
Processing, and Health Benefits. J Med Food 7:67–78. doi: 10.1089/109662004322984734
Mohammadi M, Xavier A, Beckett T, et al (2020) Identification, deployment, and transferability
of quantitative trait loci from genome-wide association studies in plants. Curr Plant Biol
24:100145. doi: 10.1016/j.cpb.2020.100145
Morris GP, Ramu P, Deshpande SP, et al (2012) Population genomic and genome-wide
association studies of agroclimatic traits in sorghum. Proc Natl Acad Sci 110:453–458. doi:
10.1073/pnas.1215985110
Nelson R, Jarquin D, Lorenz A, et al (2015) A Population Structure and Genome-Wide
Association Analysis on the USDA Soybean Germplasm Collection. Plant Genome 8:0. doi:
10.3835/plantgenome2015.04.0024
Nielsen DM, Zaykin D (2001) Association mapping : where we ’ ve been , where we ’ re going.
Drugs 89–97. doi: 10.1586/14737159.1.3.334
Nordborg M, Tavar S, Nordborg M (2002) Magnus and Tavaré 2002 - Linkage disequilibrium,
what history has to tell us. . 18:83–90
Nurminsky D (2005) Selective Sweep. In: Selective Sweep. Landes Bioscience/Eurekah.com
Ochanda N, Yu J, Bramel PJ, et al (2009) Selection before backcross during exotic germplasm
introgression. F Crop Res 112:37–42. doi: 10.1016/j.fcr.2009.01.012
Oliver S (2013) What does a changing climate mean for Canadian agriculture ?
Ontario GF of (2020) Market Trends Report - December & January - Grain Farmers of Ontario.
https://gfo.ca/market-trends/market-trends-report-december-january/
Palomeque L, Li-Jun L, Li W, et al (2009a) QTL in mega-environments: I. Universal and
specific seed yield QTL detected in a population derived from a cross of high-yielding
adapted × high-yielding exotic soybean lines. Theor Appl Genet 119:417–427. doi:
10.1007/s00122-009-1049-7
94
Palomeque L, Li-Jun L, Li W, et al (2009b) QTL in mega-environments: II. Agronomic trait
QTL co-localized with seed yield QTL detected in a population derived from a cross of
high-yielding adapted ?? high-yielding exotic soybean lines. Theor Appl Genet 119:429–
436. doi: 10.1007/s00122-009-1048-8
Palomeque L, Liu LJ, Li W, et al (2010) Validation of mega-environment universal and specific
QTL associated with seed yield and agronomic traits in soybeans. Theor Appl Genet
120:997–1003. doi: 10.1007/s00122-009-1227-7
Pan L, He J, Zhao T, et al (2018) Efficient QTL detection of flowering date in a soybean RIL
population using the novel restricted two-stage multi-locus GWAS procedure. Theor Appl
Genet 131:2581–2599. doi: 10.1007/s00122-018-3174-7
Pantalone VR, Stefaniak TR, Hyten DL, et al (2004) Seed quality QTL in a prominent soybean
population. Theor Appl Genet 109:552–561. doi: 10.1007/s00122-004-1661-5
Patil, S.S., Naik, M.R., Patil, A.B., and Ghodke UR (2011) Genetic Diversity in Soybean. Legum
Res 34:68–70. doi: 10.1360/zd-2013-43-6-1064
Patil G, Mian R, Vuong T, et al (2017) Molecular mapping and genomics of soybean seed
protein: a review and perspective for the future. Theor Appl Genet 130:1975–1991. doi:
10.1007/s00122-017-2955-8
Patil G, Vuong TD, Kale S, et al (2018) Dissecting genomic hotspots underlying seed protein,
oil, and sucrose content in an interspecific mapping population of soybean using high-
density linkage mapping. Plant Biotechnol J 16:1939–1953. doi: 10.1111/pbi.12929
Pettersson D, Pontoppi K (2013) Soybean Meal and The Potential for Upgrading Its Feeding
Value by Enzyme Supplementation. In: Soybean - Bio-Active Compounds. InTech
Posadas LG, Eskridge KM, Graef GL (2014) Elite performance for grain yield from unadapted
exotic soybean germplasm in three cycles of a recurrent selection experiment. Crop Sci
54:2536–2546. doi: 10.2135/cropsci2014.01.0090
Qi Z, Huang L, Zhu R, et al (2014) A high-density genetic map for soybean based on specific
length amplified fragment sequencing. PLoS One 9:1–6. doi: 10.1371/journal.pone.0104871
Qi Z, Song J, Zhang K, et al (2020) Identification of QTNs Controlling 100-Seed Weight in
Soybean Using Multilocus Genome-Wide Association Studies. Front Genet 11:1–12. doi:
10.3389/fgene.2020.00689
Ray DK, Mueller ND, West PC, Foley JA (2013) Yield Trends Are Insufficient to Double
Global Crop Production by 2050. PLoS One 8:. doi: 10.1371/journal.pone.0066428
Rossi ME (2011) Adaptation to Mega-environments: Introgression of novel alleles for yield
using Canadian x Chinese crosses in Soybean. America (NY) 120
95
Rossi ME, Orf JH, Liu LJ, et al (2013) Genetic basis of soybean adaptation to North American
vs. Asian mega-environments in two independent populations from Canadian × Chinese
crosses. Theor Appl Genet 126:1809–1823. doi: 10.1007/s00122-013-2094-9
Sandhu SK, Pal L, Kaur J, Bhatia D (2019) Genome wide association studies for yield and its
component traits under terminal heat stress in Indian mustard (Brassica juncea L.).
Euphytica 215:1–15. doi: 10.1007/s10681-019-2489-z
Schaller A, Stintzi A, Graff L (2012) Subtilases - versatile tools for protein turnover, plant
development, and interactions with the environment. Physiol Plant 145:52–66. doi:
10.1111/j.1399-3054.2011.01529.x
Schmutz J, Cannon SB, Schlueter J, et al (2010) Genome sequence of the palaeopolyploid
soybean. Nature 463:178–183. doi: 10.1038/nature08670
Schreiber M, Stein N, Mascher M (2018) Genomic approaches for studying crop evolution.
Genome Biol 19:1–15. doi: 10.1186/s13059-018-1528-8
Shoemaker RC, Specht JE (1995) Integration of the soybean molecular and classical genetic
linkage groups. Crop Sci 35:436–446. doi: 10.2135/cropsci1995.0011183X003500020027x
Shultz JL, Kurunam D, Shopinski K, et al (2006) The Soybean Genome Database (SoyGD): a
browser for display of duplicated, polyploid, regions and sequence tagged sites on the
integrated physical and genetic maps of Glycine max. Nucleic Acids Res 34:758–765. doi:
10.1093/nar/gkj050
Shurtleff W, Aoyagi A (2010) History of Soybeans and Soyfood in Canada (1831-2010)
Simmonds NW (1995) The relation between yield and protein in cereal grain. J Sci Food Agric
67:309–315. doi: 10.1002/jsfa.2740670306
Smallwood CJ (2015) Molecular Breeding Strategies for Improvement} of Complex Traits in
Soybean
Smallwood CJ, Gillman JD, Saxton AM, et al (2017) Identifying and exploring significant
genomic regions associated with soybean yield, seed fatty acids, protein and oil. J Crop Sci
Biotechnol 20:243–253. doi: 10.1007/s12892-017-0020-0
Sneller CH, Nelson RL, Carter TE, Cui Z (2005) Genetic Diversity in Crop Improvement. J Crop
Improv 14:103–144. doi: 10.1300/J411v14n01_06
Sonah H, Bastien M, Iquira E, et al (2013) An Improved Genotyping by Sequencing (GBS)
Approach Offering Increased Versatility and Efficiency of SNP Discovery and Genotyping.
PLoS One 8:e54603. doi: 10.1371/journal.pone.0054603
Song QJ, Marek LF, Shoemaker RC, et al (2004) A new integrated genetic linkage map of the

96
soybean. Theor Appl Genet 109:122–128. doi: 10.1007/s00122-004-1602-3
St. Martin SK, Asiam M (1986) Performance of Progeny of Adapted and Plant Introduction
Soybean Lines1. Crop Sci 26:753. doi: 10.2135/cropsci1986.0011183X002600040026x
Stasko AK (2018) Functional Gene Analysis of Resistance QTL towards Phytophthora sojae on
Soybean Chromosome 19
Statistics Canada (2020) Estimated areas, yield, production, average farm price and total farm
value of principal field crops, in metric and imperial units
Stenmark H, Aasland R, Driscoll PC (2002) The phosphatidylinositol 3-phosphate-binding
FYVE finger. FEBS Lett 513:77–84. doi: 10.1016/S0014-5793(01)03308-7
Stenmark H, Aasland R, Toh BH, D’Arrigo A (1996) Endosomal localization of the autoantigen
EEA1 is mediated by a zinc- binding FYVE finger. J Biol Chem 271:24048–24054. doi:
10.1074/jbc.271.39.24048
Street NR, Ingvarsson PK (2010) Association genetics of complex traits in plants. New Phytol
189:909–922. doi: 10.1111/j.1469-8137.2010.03593.x
Takeuchi Y, Nishimura Y, Yoshikawa T, et al (2013) Genome-Wide Association Studies and
Genomic Prediction. Humana Press, Totowa, NJ
Tang Y, Liu X, Wang J, et al (2016) GAPIT Version 2: An Enhanced Integrated Tool for
Genomic Association and Prediction. Plant Genome 9:. doi:
10.3835/plantgenome2015.11.0120
Teng W, Feng L, Li W, et al (2017) Dissection of the genetic architecture for soybean seed
weight across multiple environments. Crop Pasture Sci 68:358–365. doi: 10.1071/CP16462
Tilman D, Balzer C, Hill J, Befort BL (2011) Global food demand and the sustainable
intensification of agriculture. Proc Natl Acad Sci U S A 108:20260–20264. doi:
10.1073/pnas.1116437108
Torkamaneh D, Belzile F (2015) Scanning and filling: Ultra-dense SNP genotyping combining
genotyping-by-sequencing, SNP array and whole-genome resequencing data. PLoS One
10:1–16. doi: 10.1371/journal.pone.0131533
Torkamaneh D, Laroche J, Belzile F (2020) Fast-gbs v2.0: An analysis toolkit for genotyping-
by-sequencing data. Genome 63:577–581. doi: 10.1139/gen-2020-0077
VanRaden PM (2008) Efficient methods to compute genomic predictions. J Dairy Sci 91:4414–
4423. doi: 10.3168/jds.2007-0980
Vello NA, Fehr WR, Bahrenfus JB (1984) Genetic Variability and Agronomic Performance of
97
Soybean Populations Developed from Plant Introductions1. Crop Sci 24:511. doi:
10.2135/cropsci1984.0011183X002400030020x
Viana JMS, Mundim GB, Pereira HD, et al (2017) Efficiency of genome-wide association
studies in random cross populations. Mol Breed 37:. doi: 10.1007/s11032-017-0703-z
Wang C, Hu S, Gardner C, Lübberstedt T (2017) Emerging Avenues for Utilization of Exotic
Germplasm. Trends Plant Sci 22:624–637. doi: 10.1016/j.tplants.2017.04.002
Wang J, Chu S, Zhang H, et al (2016) Development and application of a novel genome-wide
SNP array reveals domestication history in soybean. Sci Rep 6:1–10. doi:
10.1038/srep20728
Wang M, Yan J, Zhao J, et al (2012) Genome-wide association study (GWAS) of resistance to
head smut in maize. Plant Sci 196:125–131. doi: 10.1016/j.plantsci.2012.08.004
Wang Y, Li Y, Wu H, et al (2018) Genotyping of Soybean Cultivars With Medium-Density
Array Reveals the Population Structure and QTNs Underlying Maturity and Seed Traits.
Front Plant Sci 9:. doi: 10.3389/fpls.2018.00610
Wei W, Mesquita ACO, Figueiró A de A, et al (2017) Genome-wide association mapping of
resistance to a Brazilian isolate of Sclerotinia sclerotiorum in soybean genotypes mostly
from Brazil. BMC Genomics 18:1–16. doi: 10.1186/s12864-017-4160-1
Weir BS (2008) Linkage Disequilibrium and Association Mapping. Annu Rev Genomics Hum
Genet 9:129–142. doi: 10.1146/annurev.genom.9.081307.164347
Weir BS (2010) Statistical genetic issues for genome-wide association studies. Genome 53:869–
875. doi: 10.1139/G10-062
Whiting RM, Torabi S, Lukens L, Eskandari M (2020) Genomic regions associated with
important seed quality traits in food-grade soybeans. BMC Plant Biol 20:1–14. doi:
10.1186/s12870-020-02681-0
Willis S (2003) The use of Soybean Meal and Full Fat Soybean Meal by the Animal Feed
Industry. 12th Aust Soybean Conf 1–8
Wu X, Ren C, Joshi T, et al (2010) SNP discovery by high-throughput sequencing in soybean.
BMC Genomics 11:. doi: 10.1186/1471-2164-11-469
Yin L, Zhang H, Tang Z, et al (2021) rMVP: A Memory-efficient, Visualization-enhanced, and
Parallel-accelerated tool for Genome-Wide Association Study. Genomics Proteomics
Bioinformatics. doi: 10.1016/j.gpb.2020.10.007
Zatybekov A, Abugalieva S, Didorenko S, et al (2017) GWAS of agronomic traits in soybean
collection included in breeding pool in Kazakhstan. BMC Plant Biol 17:. doi:
98
10.1186/s12870-017-1125-0
Zhang J, Song Q, Cregan PB, et al (2015) Genome-wide association study for flowering time,
maturity dates and plant height in early maturing soybean (Glycine max) germplasm. BMC
Genomics 16:1–11. doi: 10.1186/s12864-015-1441-4
Zhang J, Wang X, Lu Y, et al (2018a) Genome-wide Scan for Seed Composition Provides
Insights into Soybean Quality Improvement and the Impacts of Domestication and
Breeding. Mol Plant 11:460–472. doi: 10.1016/j.molp.2017.12.016
Zhang K, Liu S, Li W, et al (2018b) Identification of QTNs controlling seed protein content in
soybean using multi-locus genome-wide association studies. Front Plant Sci 871:1–14. doi:
10.3389/fpls.2018.01690
Zhang Y, Li W, Lin Y, et al (2018c) Construction of a high-density genetic map and mapping of
QTLs for soybean (Glycine max) agronomic and seed quality traits by specific length
amplified fragment sequencing. BMC Genomics 19:1–14. doi: 10.1186/s12864-018-5035-9
Zhang YM, Jia Z, Dunwell JM (2019) Editorial: The applications of new multi-locus gwas
methodologies in the genetic dissection of complex traits. Front Plant Sci 10:1–6. doi:
10.3389/fpls.2019.00100
Zhaoming Q, Xiaoying Z, Huidong Q, et al (2017) Identification and validation of major QTLs
and epistatic interactions for seed oil content in soybeans under multiple environments
based on a high-density map. Euphytica 213:1–14. doi: 10.1007/s10681-017-1952-y
Zhe Y, Lauer JG, Borges R, de Leon N (2010) Effects of genotype × environment interaction on
agronomic traits in soybean. Crop Sci 50:696–702. doi: 10.2135/cropsci2008.12.0742
Zhou Z, Jiang Y, Wang Z, et al (2015) Resequencing 302 wild and cultivated accessions
identifies genes related to domestication and improvement in soybean. Nat Biotechnol
33:408–414. doi: 10.1038/nbt.3096
Zhu C, Gore M, Buckler ES, Yu J (2008) Status and Prospects of Association Mapping in Plants.
Plant Genome 1:5–20. doi: 10.3835/plantgenome2008.02.0089
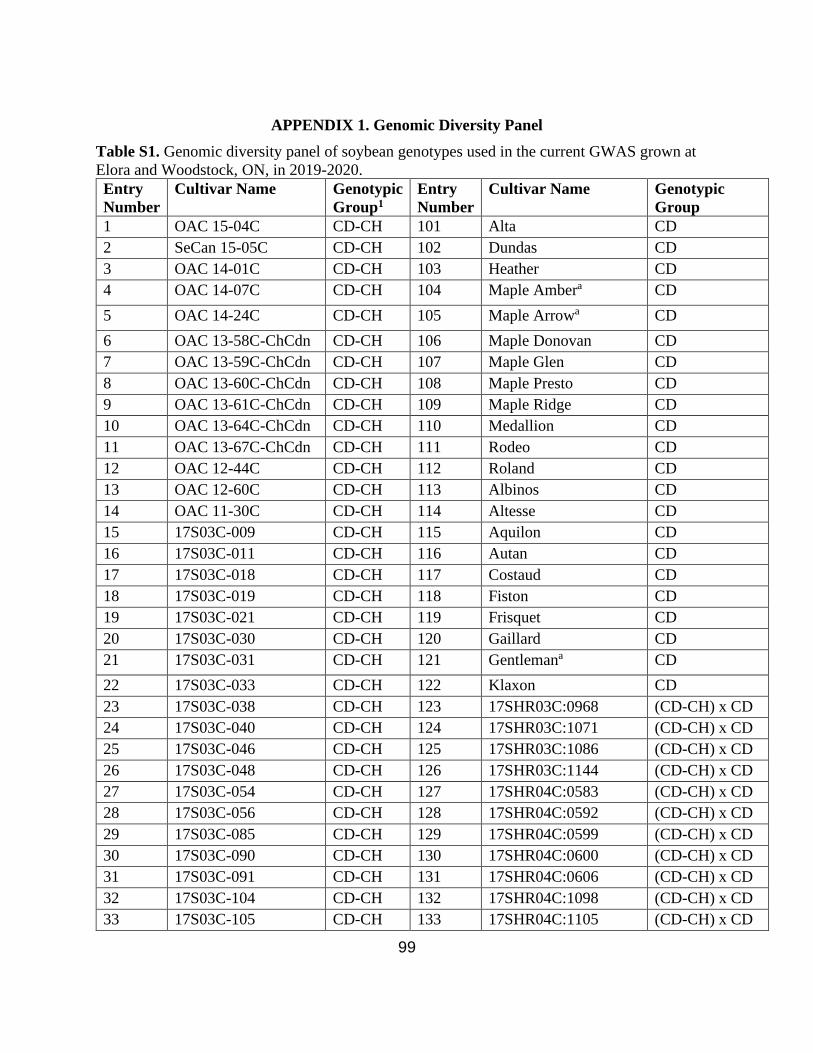
99
APPENDIX 1. Genomic Diversity Panel
Table S1. Genomic diversity panel of soybean genotypes used in the current GWAS grown at
Elora and Woodstock, ON, in 2019-2020.
Entry
Number
Cultivar Name Genotypic
Group1
Entry
Number
Cultivar Name Genotypic
Group
1 OAC 15-04C CD-CH 101 Alta CD
2 SeCan 15-05C CD-CH 102 Dundas CD
3 OAC 14-01C CD-CH 103 Heather CD
4 OAC 14-07C CD-CH 104 Maple Ambera CD
5 OAC 14-24C CD-CH 105 Maple Arrowa CD
6 OAC 13-58C-ChCdn CD-CH 106 Maple Donovan CD
7 OAC 13-59C-ChCdn CD-CH 107 Maple Glen CD
8 OAC 13-60C-ChCdn CD-CH 108 Maple Presto CD
9 OAC 13-61C-ChCdn CD-CH 109 Maple Ridge CD
10 OAC 13-64C-ChCdn CD-CH 110 Medallion CD
11 OAC 13-67C-ChCdn CD-CH 111 Rodeo CD
12 OAC 12-44C CD-CH 112 Roland CD
13 OAC 12-60C CD-CH 113 Albinos CD
14 OAC 11-30C CD-CH 114 Altesse CD
15 17S03C-009 CD-CH 115 Aquilon CD
16 17S03C-011 CD-CH 116 Autan CD
17 17S03C-018 CD-CH 117 Costaud CD
18 17S03C-019 CD-CH 118 Fiston CD
19 17S03C-021 CD-CH 119 Frisquet CD
20 17S03C-030 CD-CH 120 Gaillard CD
21 17S03C-031 CD-CH 121 Gentlemana CD
22 17S03C-033 CD-CH 122 Klaxon CD
23 17S03C-038 CD-CH 123 17SHR03C:0968 (CD-CH) x CD
24 17S03C-040 CD-CH 124 17SHR03C:1071 (CD-CH) x CD
25 17S03C-046 CD-CH 125 17SHR03C:1086 (CD-CH) x CD
26 17S03C-048 CD-CH 126 17SHR03C:1144 (CD-CH) x CD
27 17S03C-054 CD-CH 127 17SHR04C:0583 (CD-CH) x CD
28 17S03C-056 CD-CH 128 17SHR04C:0592 (CD-CH) x CD
29 17S03C-085 CD-CH 129 17SHR04C:0599 (CD-CH) x CD
30 17S03C-090 CD-CH 130 17SHR04C:0600 (CD-CH) x CD
31 17S03C-091 CD-CH 131 17SHR04C:0606 (CD-CH) x CD
32 17S03C-104 CD-CH 132 17SHR04C:1098 (CD-CH) x CD
33 17S03C-105 CD-CH 133 17SHR04C:1105 (CD-CH) x CD
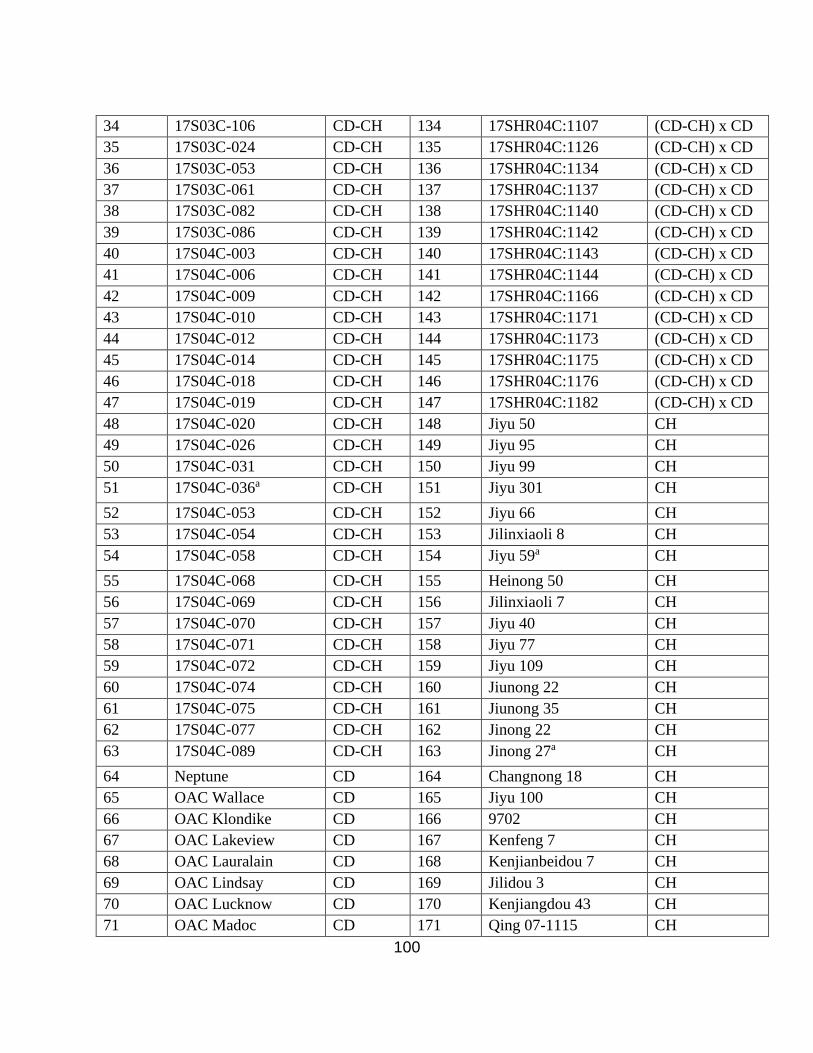
100
34 17S03C-106 CD-CH 134 17SHR04C:1107 (CD-CH) x CD
35 17S03C-024 CD-CH 135 17SHR04C:1126 (CD-CH) x CD
36 17S03C-053 CD-CH 136 17SHR04C:1134 (CD-CH) x CD
37 17S03C-061 CD-CH 137 17SHR04C:1137 (CD-CH) x CD
38 17S03C-082 CD-CH 138 17SHR04C:1140 (CD-CH) x CD
39 17S03C-086 CD-CH 139 17SHR04C:1142 (CD-CH) x CD
40 17S04C-003 CD-CH 140 17SHR04C:1143 (CD-CH) x CD
41 17S04C-006 CD-CH 141 17SHR04C:1144 (CD-CH) x CD
42 17S04C-009 CD-CH 142 17SHR04C:1166 (CD-CH) x CD
43 17S04C-010 CD-CH 143 17SHR04C:1171 (CD-CH) x CD
44 17S04C-012 CD-CH 144 17SHR04C:1173 (CD-CH) x CD
45 17S04C-014 CD-CH 145 17SHR04C:1175 (CD-CH) x CD
46 17S04C-018 CD-CH 146 17SHR04C:1176 (CD-CH) x CD
47 17S04C-019 CD-CH 147 17SHR04C:1182 (CD-CH) x CD
48 17S04C-020 CD-CH 148 Jiyu 50 CH
49 17S04C-026 CD-CH 149 Jiyu 95 CH
50 17S04C-031 CD-CH 150 Jiyu 99 CH
51 17S04C-036a CD-CH 151 Jiyu 301 CH
52 17S04C-053 CD-CH 152 Jiyu 66 CH
53 17S04C-054 CD-CH 153 Jilinxiaoli 8 CH
54 17S04C-058 CD-CH 154 Jiyu 59a CH
55 17S04C-068 CD-CH 155 Heinong 50 CH
56 17S04C-069 CD-CH 156 Jilinxiaoli 7 CH
57 17S04C-070 CD-CH 157 Jiyu 40 CH
58 17S04C-071 CD-CH 158 Jiyu 77 CH
59 17S04C-072 CD-CH 159 Jiyu 109 CH
60 17S04C-074 CD-CH 160 Jiunong 22 CH
61 17S04C-075 CD-CH 161 Jiunong 35 CH
62 17S04C-077 CD-CH 162 Jinong 22 CH
63 17S04C-089 CD-CH 163 Jinong 27a CH
64 Neptune CD 164 Changnong 18 CH
65 OAC Wallace CD 165 Jiyu 100 CH
66 OAC Klondike CD 166 9702 CH
67 OAC Lakeview CD 167 Kenfeng 7 CH
68 OAC Lauralain CD 168 Kenjianbeidou 7 CH
69 OAC Lindsay CD 169 Jilidou 3 CH
70 OAC Lucknow CD 170 Kenjiangdou 43 CH
71 OAC Madoc CD 171 Qing 07-1115 CH
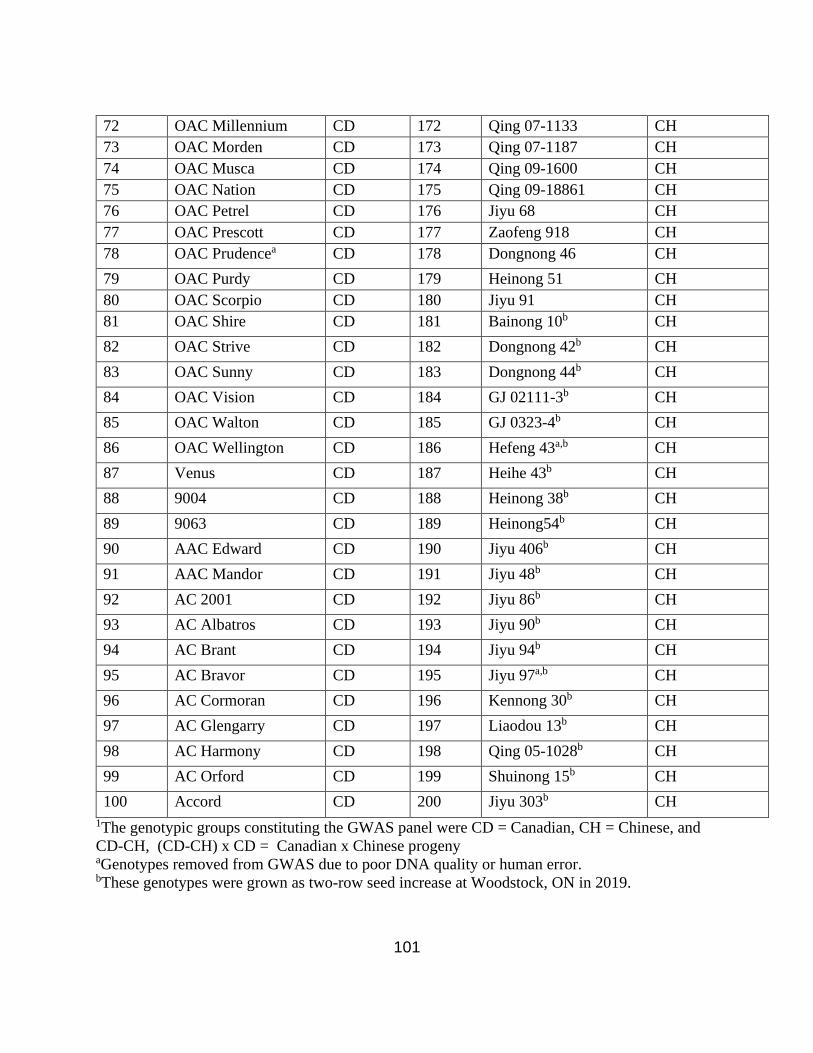
101
72 OAC Millennium CD 172 Qing 07-1133 CH
73 OAC Morden CD 173 Qing 07-1187 CH
74 OAC Musca CD 174 Qing 09-1600 CH
75 OAC Nation CD 175 Qing 09-18861 CH
76 OAC Petrel CD 176 Jiyu 68 CH
77 OAC Prescott CD 177 Zaofeng 918 CH
78 OAC Prudencea CD 178 Dongnong 46 CH
79 OAC Purdy CD 179 Heinong 51 CH
80 OAC Scorpio CD 180 Jiyu 91 CH
81 OAC Shire CD 181 Bainong 10b CH
82 OAC Strive CD 182 Dongnong 42b CH
83 OAC Sunny CD 183 Dongnong 44b CH
84 OAC Vision CD 184 GJ 02111-3b CH
85 OAC Walton CD 185 GJ 0323-4b CH
86 OAC Wellington CD 186 Hefeng 43a,b CH
87 Venus CD 187 Heihe 43b CH
88 9004 CD 188 Heinong 38b CH
89 9063 CD 189 Heinong54b CH
90 AAC Edward CD 190 Jiyu 406b CH
91 AAC Mandor CD 191 Jiyu 48b CH
92 AC 2001 CD 192 Jiyu 86b CH
93 AC Albatros CD 193 Jiyu 90b CH
94 AC Brant CD 194 Jiyu 94b CH
95 AC Bravor CD 195 Jiyu 97a,b CH
96 AC Cormoran CD 196 Kennong 30b CH
97 AC Glengarry CD 197 Liaodou 13b CH
98 AC Harmony CD 198 Qing 05-1028b CH
99 AC Orford CD 199 Shuinong 15b CH
100 Accord CD 200 Jiyu 303b CH
1The genotypic groups constituting the GWAS panel were CD = Canadian, CH = Chinese, and
CD-CH, (CD-CH) x CD = Canadian x Chinese progeny
aGenotypes removed from GWAS due to poor DNA quality or human error. bThese genotypes were grown as two-row seed increase at Woodstock, ON in 2019.
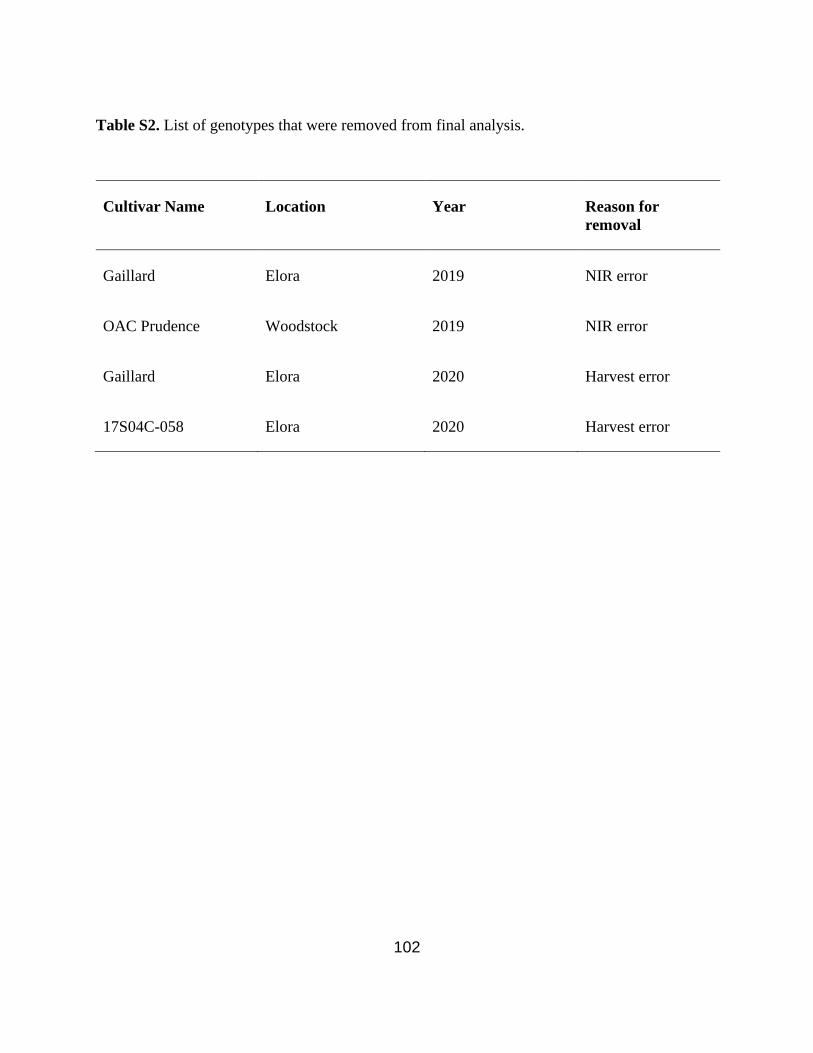
102
Table S2. List of genotypes that were removed from final analysis.
Cultivar Name Location Year Reason for
removal
Gaillard Elora 2019 NIR error
OAC Prudence Woodstock 2019 NIR error
Gaillard Elora 2020 Harvest error
17S04C-058 Elora 2020 Harvest error