soybean (glycine max) urease: steady state kinetics...
TRANSCRIPT

1
Research Article
Soybean (Glycine max) urease: steady state kinetics, stability and thermal
inactivation studies
Sandeep Kumar
School of Biotechnology, Faculty of Science, Banaras Hindu University, Varanasi 221005, India.
Corresponding Author: Sandeep Kumar. Tel: +91-121-2888539; Fax: +91-121-2888515;
E-mail: [email protected]
Present address: Department of Biochemistry & Physiology, College of Biotechnology, Sardar
Vallabhbhai Patel University of Agriculture & Technology, Modipuram, Meerut 250110, India
Running title: Thermal inactivation of soybean urease
Received: April 23, 2017 Accepted: June 20, 2017 Published: June 25, 2017
Journal of Proteins and Proteomics
2
Abstract
The soybean (Glycine max) urease was characterized with respect to kinetic parameters, stability
studies and thermal inactivation. The stability temperature and stability pH of the purified urease
was found to be 4 °C and 7.6, respectively. The optimum pH and optimum temperature were 7.0 oC and 65 oC, respectively. The energy of activation (Ea) was 15.40 kJ/mol. Further, the Km and
Vmax were determined by Lineweaver Burk plot and the values were 2.70 ± 0.10 mM and 2.85
x102 µmol NH3/min/mg protein, respectively. Thermal inactivation studies at 65 oC, revealed the
mono-phasic kinetics, which indicated the loss in activity in single phase. However, at higher
temperatures (70 oC, 75 oC and 77 oC), the kinetic pattern was mainly bi-phasic. At 80 oC, there
was complete loss in activity thereby showing the denaturation of enzyme. Thermal inactivation
studies strongly support the oligomeric nature of urease.
Key words: Glycine max; soybean; thermal inactivation; urease
3
Introduction
Urease (EC 3.5.1.5) catalyzes the hydrolysis of urea to ammonia and CO2. A variety of
ureases are found in bacteria, fungi, higher plants, and in soil as a soil enzyme (Mobley and
Hausinger, 1989). Urease was first reported from the leaves of legume, soybean (Takeuchi,
1909). Urease has been found to have a high specificity for its primary substrate, urea (Smith et
al., 1993), although it is known that acetamide, formamide, N-methyl urea, semicarbazide and
hydroxy urea all serve as substrate (albeit poorly) for jack bean urease (Andrews et al., 1984;
Blakeley and Zerner, 1984). The amino acid profiles of urease from jack bean and soybean are
very similar with high methionine content (Milton and Taylor, 1969; Polacco and Havir, 1979).
The presence of two isozymes for urease has been reported in soybean (Holland et al., 1987).
Ubiquitous urease is synthesized in all organs (constitutively expressed) but it appears to be most
active in young tissues (Polacco and Winkler, 1984; Polacco et al., 1985; Holland et al., 1987;
Polacco et al., 1989). Embryo-specific urease is synthesized exclusively in the developing
embryos, although roots of young soybean plant retain considerable embryo-specific urease
derived from the embryonic axis (Torisky and Polacco, 1990).
The plant and fungal ureases are homo-oligomeric proteins (consist of identical subunits),
while the bacterial ureases are multimers formed from a complex of two or three subunits
(Mobley et al., 1995; Tange and Niwa, 1997). Significant amino acid similarities have been
observed between all known ureases. Amino-terminal residues of the monomers of plant and
fungal enzymes are similar to the small subunits of bacterial enzymes (e.g., UreA of H. pylori).
The large subunits of bacterial ureases (e.g., UreB of H. pylori) resemble the carboxy-terminal
portions of plant and fungal subunits. The high sequence similarity indicates that all ureases are
variants of the same enzyme and are likely to possess similar tertiary structures and catalytic
mechanisms (Mobley et al., 1995). This conclusion is supported by the available biochemical
and structural data obtained for the best-characterized ureases, e.g., from jack bean (Hirai et al.,
1993) and K. aerogenes (Jabri et al., 1995). Jack bean urease exists as a homotrimer able to
aggregate to a homohexamer (Hirai et al., 1993). Bacterial ureases possess structures similar to
the jack bean urease. They are either trimers or hexamers of subunit complexes. They can also
exist in aggregated forms. The stoichiometry of subunits (1:1 for ureases from Helicobacter sp.
or 1:1:1 for most bacterial ureases, including the urease from K. aerogenes) is always
maintained. The catalytic site is located in subunit UreC of the K. aerogenes enzyme and in the
4
respective regions of ureases from other organisms. Each catalytic subunit contains the active
site with two nickel ions that, in the case of crystallized K. aerogenes urease, were shown to be
3.5 Å apart (Jabri et al., 1995). In this enzyme, one nickel atom is bound to two histidine
residues (His246 and His272), while the second nickel atom is bound to three residues: two
histidines (His134 and His136) and aspartic acid (Asp360). Additionally, a carbamate ligand derived
from Lys217 bridges the two nickel ions (Mobley et al., 1995).
The objective of the present study was to characterize soybean urease biochemically
including its kinetic aspects and stability and thermal inactivation studies, which have not been
investigated as of yet. Most of the work on ureases has been reported from microbes and very
few reports are available on ureases from plant sources. Therefore in that direction, the current
studies were undertaken to further refine the enzyme’s catalytic mechanism and other kinetic
details for a better understanding of plant ureases in general. Our previous reports on soybean
and pigeonpea urease, along with the current investigation, have further added and refined the
overall details of catalytic mechanism and role of various inhibitors in medicine, agriculture and
environment (Kumar and Kayastha, 2010a; 2010b; 2010c; 2012; Kumar, 2015; Kumar et al.,
2015; Kumar, 2016, Lehari et al., 2015).
Materials and methods
Chemicals and enzyme
Bovine serum albumin (BSA), Tris, and urea (enzyme grade) were purchased from Sigma
Chemicals Co., St. Louis, USA. Nessler’s reagent, Na2EDTA, and trichloroacetic acid (TCA)
were from HiMedia, India. All other chemicals were of analytical grade obtained from either
SRL or Merck, India. All the solutions were prepared in Milli Q (Millipore, USA) water. The
urease was purified from the mature seeds of soybean to apparent homogeneity by the method of
Polacco and Havir (1979) with minor modifications. The specific activity of the final preparation
was 270 units/mg of protein.
Urease activity assay
5
Urease (0.87 μg/mL) was assayed by determining the amount of ammonia liberated in a
fixed time interval on incubating the enzyme and urea (Das et al., 2002). A blank without
enzyme was run side by side and correction was applied for the same. The Nessler’s reagent was
calibrated with standard ammonium chloride solution. An enzyme unit has been defined as the
amount of urease required to liberate 1 µmol of ammonia per min under our test conditions (0.1
M urea, 0.05 M Tris-acetate buffer, pH 7.0, 37 ºC).
Protein estimation
Protein content of urease preparation was estimated by the method of Lowry et al.,
(1951) using bovine serum albumin as standard.
Stability studies
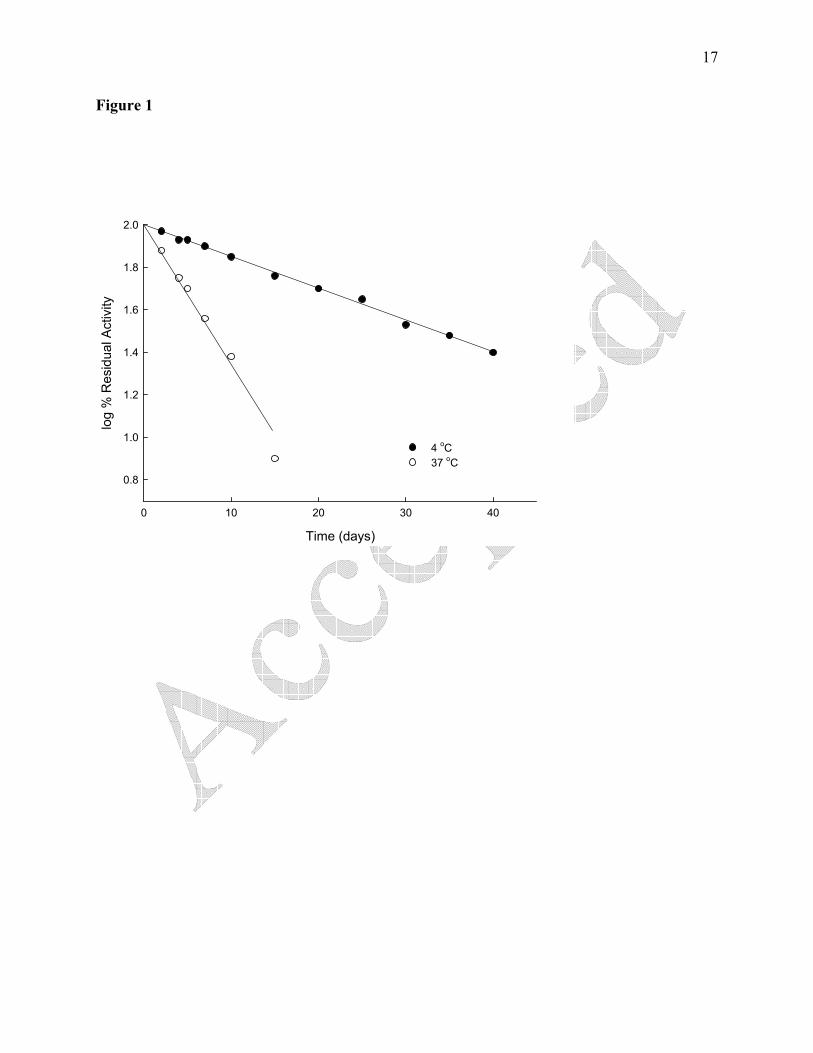
The stability temperature of purified urease was determined by storing the urease (0.87
μg/mL) at 4 oC and 37 oC, separately and performing the activity assay for residual activity at the
regular intervals. Furthermore, the stability pH was determined by incubating urease at various
pH (7.0, 7.6 and 8.0) overnight at 4 oC and then assayed next day for the residual activity. 0.1 M
Tris-acetate buffer was used for stability studies. The purified urease was always stored in 50
mM Tris acetate buffer, pH 7.6 at 4 °C containing 1 mM β-ME.
Steady state kinetics
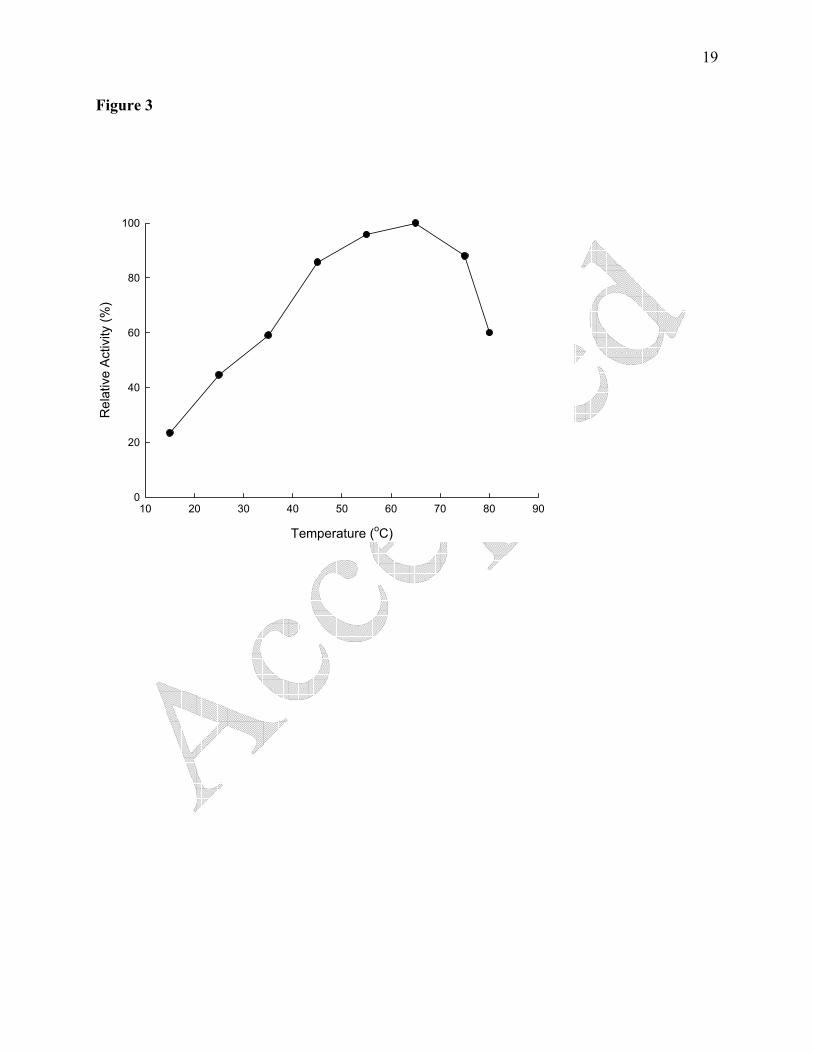
The effect of temperature was studied by varying the temperature from 15 oC to 80 oC in
a multi-temp (Pharmacia, Sweden) water bath during activity assay. The percent relative activity
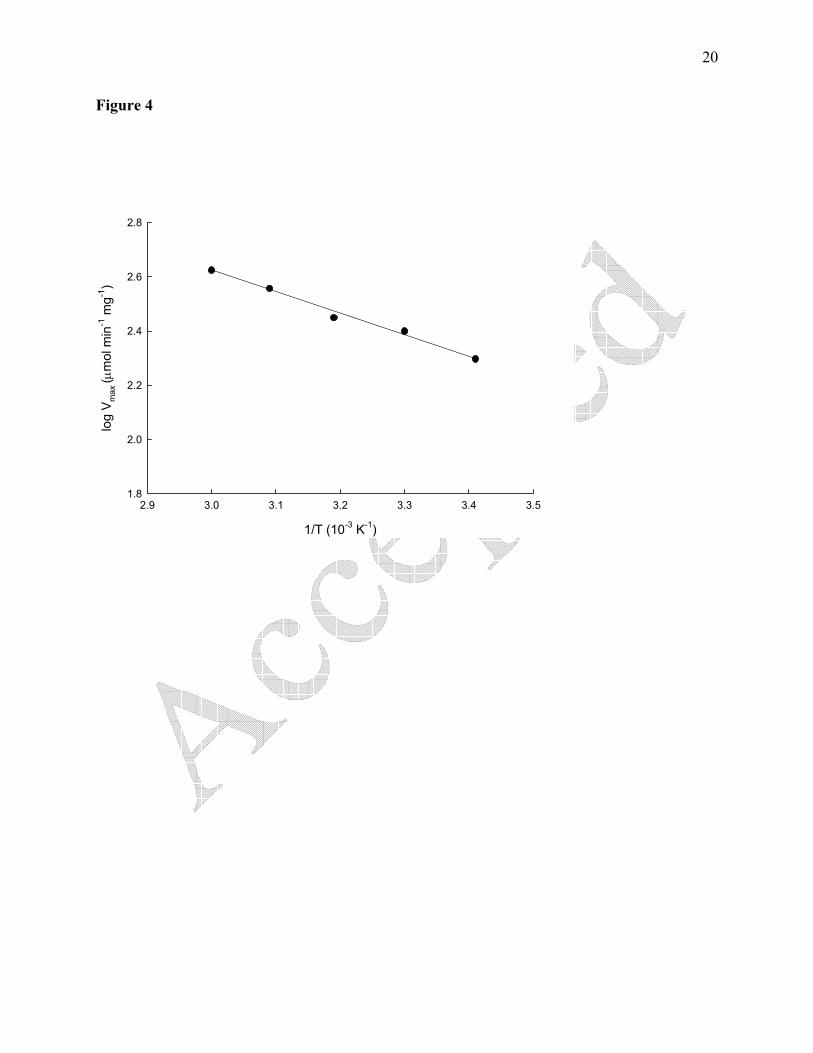
was plotted against temperature. The data of optimum temperature was selected in the
temperature range 20-60 oC and were replotted in the form of Arrhenius graph to determine the
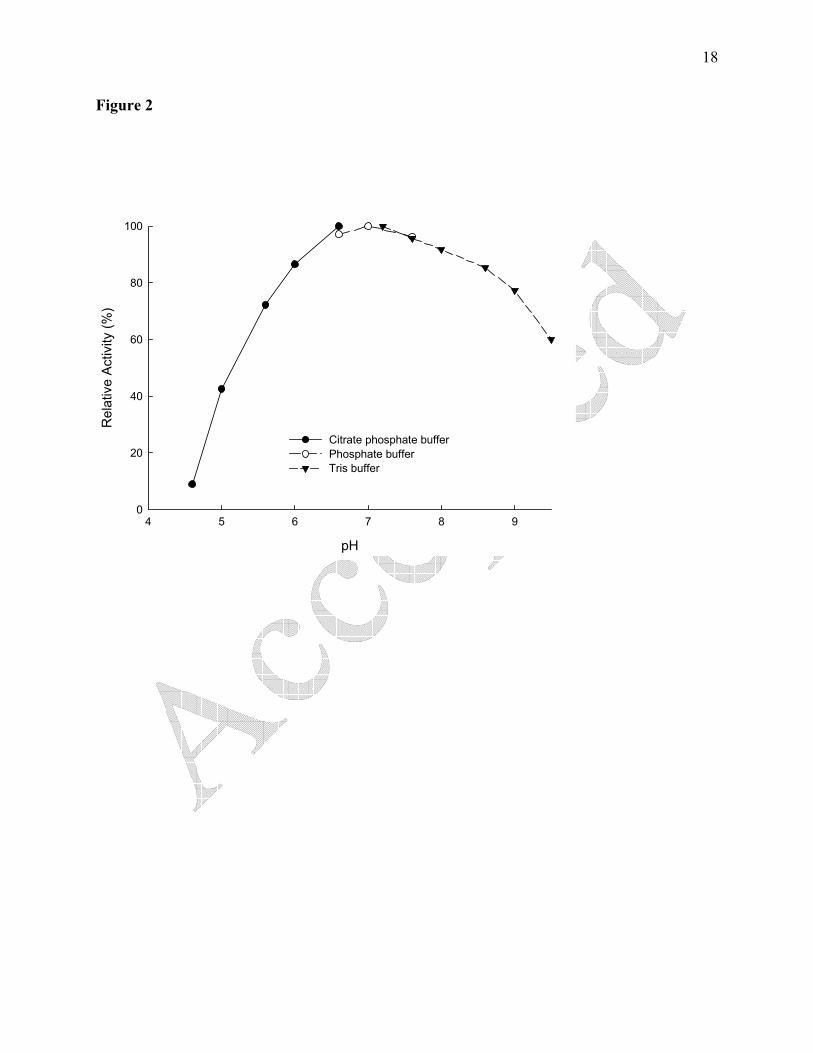
energy of activation (Ea). The optimum pH was determined by using the three buffer systems,
viz., citrate-phosphate buffer (pH 4.6-6.6), phosphate buffer (pH 6.6-7.6) and Tris buffer (pH
7.2-9.5). The activity assay was performed at the different pH and percent relative activity was
determined. For studying the effect of substrate concentrations, the activity assay was performed
at different substrate concentrations (1-40 mM urea). The velocities were determined and plotted
against respective substrate concentrations. The Lineweaver-Burk plot was drawn to determine
the Km.
6
Thermal inactivation studies
Urease (0.5 mg/mL) in 0.1 M Tris acetate buffer, pH 7.6, was incubated in a water bath at
desired temperatures for a fixed period. The enzyme aliquots withdrawn at different time
intervals were rapidly cooled in ice water and were assayed for residual activity. The activity
measurement of the sample was executed after 5 min storage in ice water. The experiments were
carried out at four different temperatures, such as 65 oC, 70 oC, 75 oC and 77 oC. Equation (1) was
used to analyze the data and the values of t1/2, k and amplitude were determined at the indicated
temperatures.
Analysis of the kinetic data
With time-dependent inactivation, the data was plotted as log percent residual activity
versus time. The time-course of inactivation was found to consistent with Equation (1) and
therefore the data was processed and analyzed in accordance with the following equation:
At = Afast e-kfast.t + Aslow e-kslow.t Equation (1)
where At is the fraction residual activity at time t, Afast and Aslow are amplitudes (expressed as
percent of the starting activity) and kfast and kslow are the rate constants of the fast and the slow
phases, respectively. Initial estimates of the rate constants and amplitudes were obtained from
the semi-log plots as described earlier (Kayastha and Gupta, 1987).
Results and Discussion
Enzyme stability studies
Ureases from several sources have been found to be inactivated by heavy metals
(Magana-Plaza et al., 1971; Mahadevan et al., 1977; Nakano et al., 1984; Glemzha et al., 1986;
Blanchard et al., 1988) and by oxidation (Lister, 1956; Magana-Plaza et al., 1971; Mahadevan et
al., 1976); therefore, during the purification process 1 mM each of EDTA and β-ME were found
most appropriate to preserve the enzyme activity. The purified urease was always stored in 0.1 M
Tris-acetate, pH 7.6 at 4 °C containing 1 mM β-ME, and it was observed that it retained nearly
50% of the original activity after 20 days. Ureaplasma urealyticum urease was fully stable for
7
more than 20 days when stored at 4 °C in pH 7.2 buffer containing 1% bovine serum albumin; it
is not clear whether the added albumin was required (Stemke et al., 1987). Further, purified
urease was stored in 0.1 M Tris-acetate buffers, pH 7.6 separately at two different temperatures,
4 oC and 37 oC for 40 days. The semi-log plot of percent residual activity versus number of days
shows the t1/2 value at 20 days for urease at 4 oC and 5 days for that stored at 37 oC (Figure 1).
The stability pH was determined by incubating the urease in 0.1 M Tris acetate buffer, 4 oC at
three different pHs, viz., 7.0, 7.6 and 8.0. Maximum urease activity was observed when enzyme
was stored in 0.1 M Tris acetate buffer, pH 7.6. The pH and temperature stabilities for several
ureases have been reported. Activity was irreversibly lost when ureases from Arthrobacter
oxydans and Bacillus pasteurii were exposed to pH values below 5.0 and 5.2, respectively
(Larson and Kallio, 1954; Schneider and Kaltwasser, 1984). Full activity was retained after 5 h at
30 °C for Brevibacterium ammoniagenes for pH values between 5 and 10, with sharp decreases
in activity at each pH extreme (Nakano et al., 1984). In general, ureases are quite stable in the
presence of EDTA and thiol protectants when they are not subjected to pH extremes or high
temperature.
Steady state kinetics
The optimum pH was found to be 7.0 (Figure 2). It has been shown that the rate of
hydrolysis of urea by pigeonpea urease was maximum at pH 7.3 among various pH in the range
5.0-8.5 (Das et al., 2002). The soybean urease retained only 50% of the activity at pH 5.3 as
compared to that observed at pH 7.0. Pigeonpea urease was shown to be only 50% as efficient at
pH 5.0 as compared to its activity at pH 7.3 whereas, jack bean urease (Blakeley and Zerner,
1984) has 68% activity at pH 5.2 compared to its activity at pH 7.0. Evidently from the Figure 2,
it is clear that soybean urease shows broad optimum pH ranging from 6.5 to 8.0. Watermelon
urease showed a sharp pH optimum at 8.0 (Prakash and Bhushan, 1997), while the optimum pH
for mulberry leaf urease is 9.0 (Hirayama et al., 2000). With the exception of a small group of
acid ureases (Kakimoto et al., 1989; 1990; Yamazaki et al., 1990), most ureases possess an
optimum pH of near neutrality and are often irreversibly denatured by exposure to pH values
below 5. An important point to be made with regard to examination of the pH optima for these
enzymes is that urease is inhibited by several common buffers, including phosphate (Todd and
Hausinger, 1989) and boric acid (Breitenbach and Hausinger, 1988).
8
The results of effect of temperature on urease catalyzed reaction and Arrhenius plot are
shown in Figure 3 and 4, respectively. The temperature optimum was at 65 ºC and beyond that
there was drop in activity. The Ea and Q10 values were found to be 15.40 kJ/mol and 1.32,
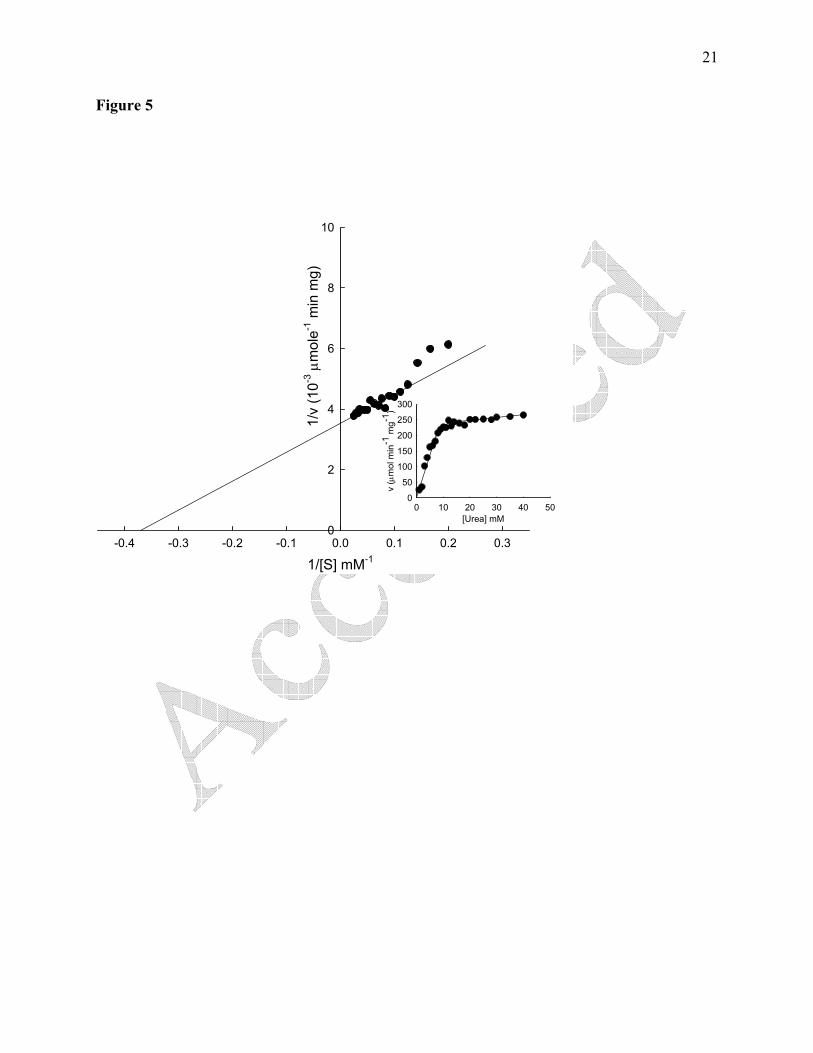
respectively. The Lineweaver-Burk plot was drawn to calculate the Km and the value was 2.70 ±
0.10 mM (Figure 5). The Km value of pigeonpea urease for its substrate, urea has been reported
at 3.0 ± 0.2 mM (Das et al., 2002). The kinetic studies on jack bean urease have shown the Km at
2.9 - 3.3 mM (Blakeley et al., 1969; Blakeley and Zerner, 1984). An apparent Km of 0.85 mM for
soybean leaf urease (Kerr et al., 1983) and a Km of 19-476 mM for soybean seed urease has been
reported depending on the buffer systems chosen (Talsky and Klunker, 1967). From mulberry
leaf urease Km of urea was reported to be 0.16 mM; the value being the lowest among the plant
ureases purified so far (Hirayama et al., 2000). The Vmax for soybean urease was found to be 2.85
x 102 µmol NH3/min/mg of protein at standard assay conditions as mentioned. Individual
bacterial ureases possess Km values ranging from 0.1 to >100 mM urea (Mobley and Hausinger,
1989). A range of Km values have been reported for Bacillus pasteurii (Larson and Kallio, 1954),
Brevibacterium ammoniagenes (Nakano et al., 1984), and Providencia rettgeri (Magana-Plaza et
al., 1971); because the Km values reported varied with buffer and pH conditions. In contrast,
ureases from K. aerogenes (Todd and Hausinger, 1987) and Proteus mirabilis (Breitenbach and
Hausinger, 1988) exhibited nearly pH-independent Km values within the pH range of 5 to 11,
when non-inhibitory buffers were used. Different strains of the same species may possess very
different Km values; for example, various strains of Proteus mirabilis exhibited Km values
ranging from 13 to 60 mM (Breitenbach and Hausinger, 1988).
It is known that acetamide, formamide, N-methylurea, semicarbazide, and hydroxyurea
all serve (albeit poorly) as substrates for jack bean urease (Andrews et al., 1984; Blakeley and
Zerner, 1984). It has been shown that the urea Km values of purified ureases agree quite well with
the values observed for crude cell extracts (Mobley and Hausinger, 1989). The different urea
concentrations were prepared and activity assay was performed. The initial velocities were
determined and plotted against respective urea concentrations. Soybean ureases exhibited simple
Michaelis-Menten kinetics as is evident from the velocity versus substrate concentration curve
(Figure 5; inset). No substrate inhibition or allosteric behavior was observed.
Thermal inactivation studies
9
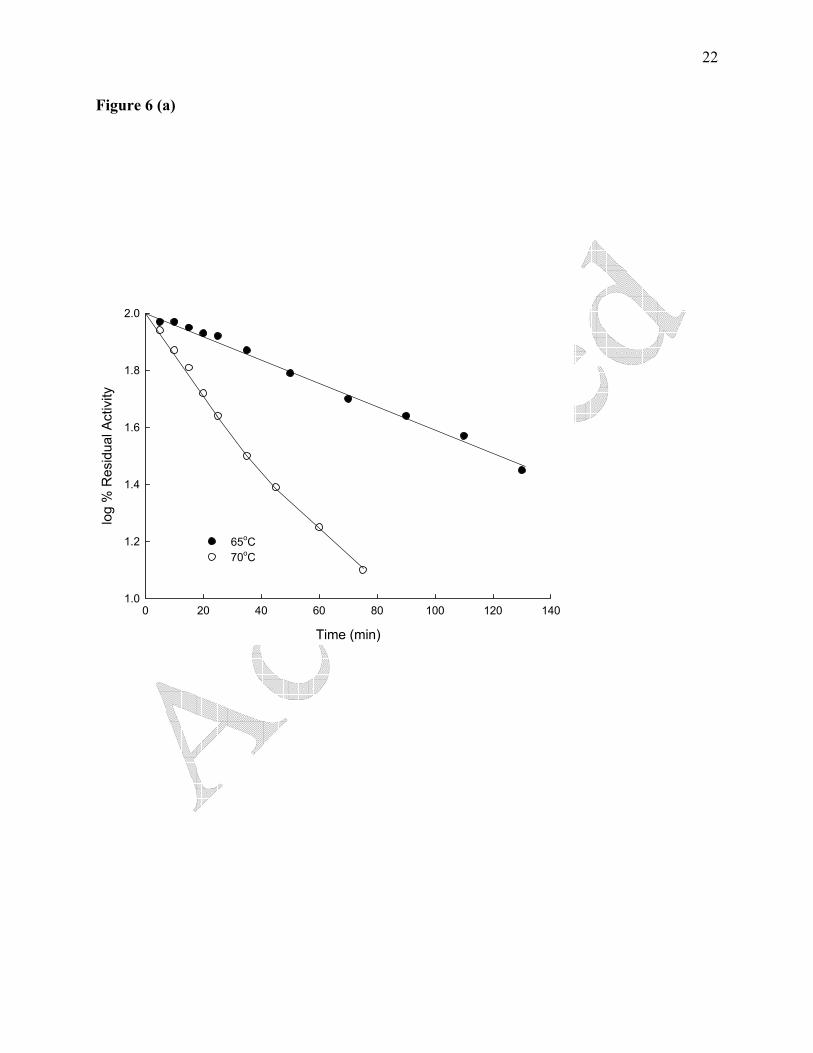
The results of thermal inactivation are shown in Figure 6. At 65 oC, the enzyme
exhibited first order kinetics (monophasic) with single exponential decay in enzyme activity
(Figure 6a). The fifty percent loss in activity (t1/2) was observed after 73 min of incubation at
the indicated temperature. The result of thermal inactivation at 70 ºC has been shown in Figure
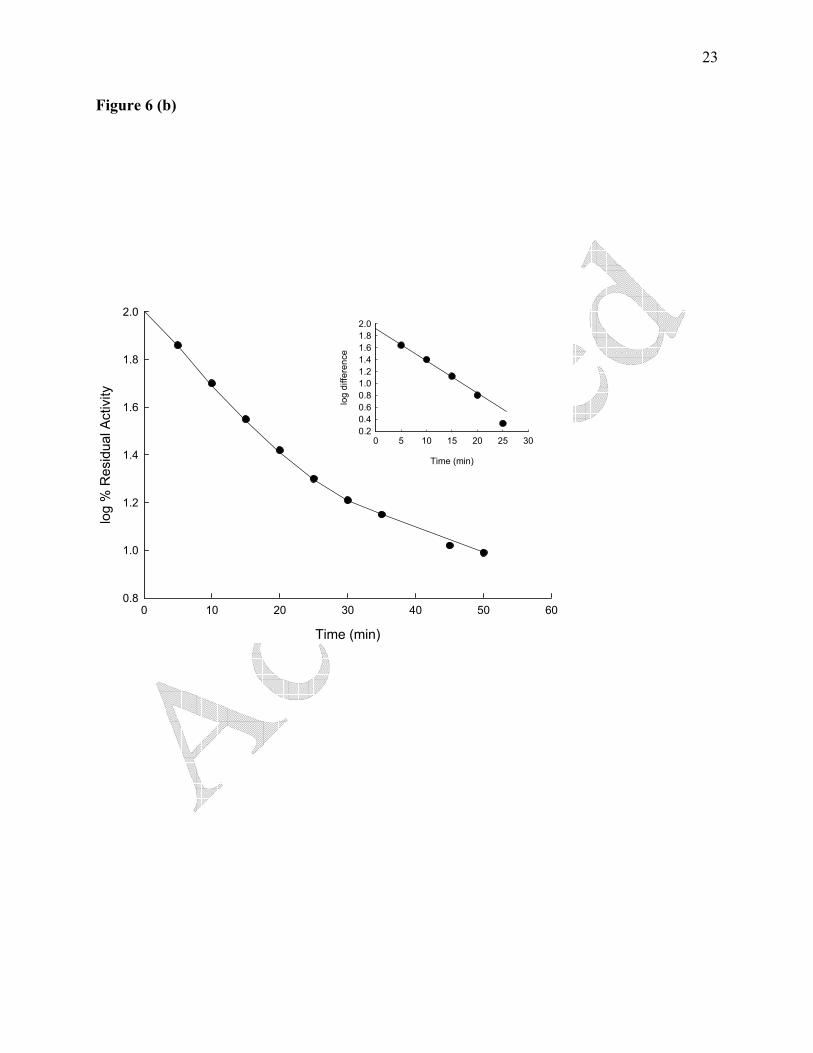
6a. Interestingly, at 70 oC, a transition from monophasic to biphasic kinetics was observed
(Figure 6b). From the figure, it is clear that the time course of loss in activity occurs in two
distinct phases namely, fast phase and slow phase. The amplitude of the fast phase was only
37%, while that of the slow phase was 63%; thereby indicating that most of loss occurs in the
slow phase.
Further at higher temperatures viz., 75 and 77 oC (Figure 6 b,c), biphasic kinetics was
observed in both the cases. At temperature 75 oC, the rate constant for the fast phase was 5.5
times greater than that of the slow phase. The amplitude of fast phase was also higher (68%).
There was increase in amplitude (76%) of fast phase when the urease was incubated at 77 oC.
When studies were carried out at 80 oC, the kinetic pattern was in first-order (monophasic; fast
phase only) and the respective values of rate constant and amplitude were much higher (k =
0.690 min-1, amplitude = 100%) (Figure 6c). Evidently it is clear from all the figures (6a,b,c)
and the Table 2.1 that with temperature the amplitude of fast phase increases until it reaches
100% at 80 oC and the slow phase is missing. During these studies a variation in the kinetic
pattern (monophasic to biphasic and then again to monophasic) was observed at various
temperatures. At 65 oC the activity was lost in single phase (slow phase only) and the kinetics
was monophasic. At temperatures between 70 oC to 77 oC the pattern of kinetics was biphasic
with two distinct phases namely, fast and slow phase. At higher temperatures (above 80 oC) the
kinetics was again monophasic but with much higher rate (fast phase only; slow phase
diminishes). Earlier similar studies were carried out by various workers (Godjevargova and
Dimov, 1997; Rejikumar and Devi, 1998; Chen and Chiu, 2000), where only slight deviation
from first-order kinetics was detected. They observed that the acceleration of inactivation
process with temperature led to disguised first-order kinetics. It is well known that first-order
kinetics corresponding to a one-step irreversible transition of native form is suitable for small,
monomeric enzymes whereas, for oligomeric enzymes having a more complex quaternary
structure and high molecular weight, the existence of intermediate forms and deviation from
first-order kinetics can be expected.
10
Thermal inactivation studies strongly support the oligomeric nature of urease, which is
also suggested by earlier workers (Polacco and Havir, 1979). It is possible that soybean urease
dissociates into smaller aggregates when incubated at different temperatures during thermal
inactivation studies and exhibits variations in their kinetic pattern may be due to their complex
quaternary structure and high molecular weight. Several oligomer-to-monomer pathways of the
native hexamer have been suggested for urease. Some authors declared that the hexamer can
dissociate into two active trimers and further into six monomers (Lencki et al., 1992; Hirai et
al., 1993). Lencki et al., (1992) assumed that the hexamer was transformed in two series
reversible reaction steps into a stable trimer that then similarly dissociated into an inactive
monomer. Omar and Beauregard (1995), who investigated the unfolding of jack bean urease by
fluorescence emission spectroscopy, found that native urease dissociated into an active, folded
dimer. The dimer, depending on the conditions, could then be further dissociated either into an
active or inactive monomer. Possibly, a similar mechanism may be affecting the decay of
soybean urease too.
Acknowledgements
Facilities provided by School of Biotechnology are gratefully acknowledged. S. K. is
thankful to Council for Scientific and Industrial Research, New Delhi, India for financial support
in the form of Junior and Senior Research Fellowships.
Abbreviations
LB plot, Lineweaver-Burk plot; H. pylori, Helicobacter pylori; K. aerogenes, Klebsiella
aerogenes; BSA, bovine serum albumin; Tris, Tris-(hydroxymethyl) aminomethane; NR,
Nessler’s reagent; Na2EDTA , disodium ethylenediaminetetraacetate dehydrate; TCA, Trichloro
acetic acid; β-ME, β-mercaptoethanol; SH, sulfhydryl; Vmax, Maximal velocity; Km, Michaelis-
Menten constant.
Conflict of interest
The author declares that there is no conflict of interest.

11
References
Andrews, R.K., Blakeley, R.L. and Zerner, B. (1984) Urea and urease. In: Advances in Inorganic
Biochemistry (Eds, Eichhorn G.L. and Marzilli L.G.) Elsevier, New York, vol l, pp 245-283.
Blakeley, R.L., Webb, E.C. and Zerner, B. (1969) Jack bean urease (EC 3.5.1.5). A new
purification and reliable rate assay. Biochemistry 8, 1984-1990.
Blakeley, R.L. and Zerner, B. (1984) Jack bean urease: The first nickel enzyme. J. Mol. Cat. 23,
263-292.
Blanchard, A., Razin, S., Kenny, G.E. and Barile, M.F. (1988) Characteristics of Ureaplasma
urealyticum urease. J. Bacteriol. 170, 2692-2697.
Breitenbach, J.M. and Hausinger, R.P. (1988) Proteus mirabilis urease. Partial purification and
inhibition by boric acid and boronic acids. Biochem. J. 250, 917-920.
Chen, J. and Chiu, S. (2000) A poly (N-isopropylacrylamide-co-N-acryloxysuccinimide-co-2-
hydroxyethyl methacrylate) composite hydrogel membrane for urease immobilization to enhance
urea hydrolysis rate by temperature swing. Enz. Microb. Technol. 26, 359-367.
Das, N., Kayastha, A.M. and Srivastava, P.K. (2002) Purification and characterization of urease
from dehusked pigeonpea (Cajanus cajan L.) seeds. Phytochemistry 61, 513-521.
Glemzha, A.A., Kovzan, V.B. and Yuodvalkite, D.V. (1986) Urease from Staphylococcus
saprophyticus. Some properties and inhibition by metal ions. Biochemistry 49, 1741-1745.
Godjevargova, T. and Dimov, A. (1997) Immobilization of urease onto membranes of modified
acrylonitrile copolymer. J. Membr. Sci. 135, 93-98.
Hirai, M., Kawai-Hirai, R., Hirai, T. and Ueki, T. (1993) Structural change of jack bean urease
induced by addition of surfactants studied with synchrotron-radiation small-angle X-ray
scattering. Eur. J. Biochem. 215, 55-61.
Hirayama, C., Sugimura, M., Saito, H. and Nakamura, M. (2000) Purification and properties of
urease from leaf of mulberry, Morus alba. Phytochemistry 53, 325-330.
Holland, M.A., Griffin, J.D., Meyer-Bothling, L.E. and Polacco, J.C. (1987) Developmental
genetics of the soybean urease isozymes. Develop. Genet. 8, 375-387.
12
Jabri, E., Carr, M.B., Hausinger, R.P. and Karplus, P.A. (1995) The crystal structure of urease
from Klebsiella aerogenes. Science 268, 998-1004.
Kakimoto, S., Sumino, Y., Akiyama, S.I. and Nakao, Y. (1989) Purification and characterization
of acid urease from Lactobacillus reuteri. Agric. Biol. Chem. 53, 1119-1125.
Kakimoto, S., Sumino, Y., Kawahara, K., Yamazaki, E. and Nakatsui, I. (1990) Purification and
characterization of acid urease from Lactobacillus fermentum. Appl. Microbiol. Biotechnol. 32,
538-543.
Kayastha, A.M. and Gupta, A.K. (1987) An easy method to determine the kinetic parameters of
biphasic reactions. Biochem. Edu. 15, 135-136.
Kerr, P.S., Bievins, D.G., Rapp, B.J. and Randall, D.D. (1983) Soybean leaf urease: comparison
with seed urease. Physiol. Plant. 57, 339-342.
Kumar, S. and Kayastha, A.M. (2010a) Acetohydroxamic acid: a competitive inhibitor of urease
from soybean (Glycine max). J. Proteins Proteomics 1, 3-8
Kumar, S. and Kayastha, A.M. (2010b) Inhibition studies of soybean (Glycine max) urease with
heavy metals, sodium salts of mineral acids, boric acid and boronic acids. J. Enz. Inhibit. Med.
Chem. 25, 646-652
Kumar, S. and Kayastha, A.M. (2010c) Soybean (Glycine max) urease: role of sulfhydryl groups
in urea catalysis. Plant Phys. Biochem. 48, 746-750
Kumar S. and Kayastha, A.M. (2012) Studies of histidine residues in soybean (Glycine max)
urease. Protein Pept. Lett. 19, 657-666
Kumar, S. (2015) Plant ureases: physiological significance, role in agriculture and industrial
applications - a review. South Asian J. Food. Tech. Environ. 1, 105-115
Kumar, S. (2016) Effects of thiols on the activity of soybean (Glycine max) urease. South Asian
J. Food. Tech. Environ. 2, 299-303
Larson, A.D. and Kallio, R.E. (1954) Purification and properties of bacterial urease. J. Bacteriol.
68, 67-73.

13
Lehari, K., Kumar, S. and Kumar, P. (2015) Kinetics of thermal inactivation and inhibition
studies of pigeonpea urease (Cajanus cajan). South Asian J. Food. Tech. Environ. 1(3&4), 242-
249.
Lencki, W.R., Arul, J. and Neufeld, R.J. (1992) Effect of subunit dissociation, denaturation,
aggregation, coagulation, and decomposition on enzyme inactivation kinetics. II. Biphasic and
grace period behavior. Biotechnol. Bioeng. 40. 427-434.
Lister, A.J. (1956) The kinetics of urease activity in Corynebacterium renale. J. Gen. Microbiol.
14, 478-484.
Lowry, O.H., Rosebrough, N.J., Farr, A.L. and Randall, R.J. (1951) Protein measurement with
the Folin phenol reagent. J. Biol. Chem. 193. 265-275.
Magana-Plaza, I., Montes, C. and Ruiz-Herrera, J. (1971) Purification and biochemical
characteristics of urease from Proteus rettgeri. Biochim. Biophys. Acta 242, 230-237.
Mahadevan, S., Sauer, F. and Erfle, J.D. (1976) Studies on bovine rumen bacterial urease. J.
Animal. Sci. 42, 745-753.
Mahadevan, S., Sauer, F.D. and Erfle, J.D. (1977) Purification and properties of urease from
bovine rumen. Biochem. J. 163. 495-501.
Milton. J.M. and Taylor, I.E. (1969) The amino acid composition of jack-bean urease. Biochem.
J. 113. 678-680.
Mobley, H.L., Island, M.D. and Hausinger, R.P. (1995) Molecular biology of microbial ureases.
Microbiol. Mol. Biol. Rev. 59, 451-480.
Mobley, H.L. and Hausinger, R.P. (1989) Microbial ureases: significance, regulation, and
molecular characterization. Microbiol. Mol. Biol. Rev.53, 85-108.
Nakano. H., Takenishi, S. and Watanabe, V. (1984) Purification and properties of urease from
Brevibacterium ammoniagenes. Agric. Biol. Chem. 48, 1495-1502.
Omar, S. and Beauregard, M. (1995) Dissociation and unfolding of jack bean urease studied by
fluorescence emission spectroscopy. J. Biotechnol. 39, 221-228.
Polacco, J.C. and Havir, E.A. (1979) Comparisons of soybean urease isolated from seed and
tissue culture. J. Biol. Chem. 254, 1707-1715.
14
Polacco, J.C., Judd, A.K., Dybing, J.K. and Cianzio, S.R. (1989) A new mutant class of soybean
lacks urease in leaves but not in leaf derived callus or in roots. Mol. Gen. Genet. 217, 257-262.
Polacco, J.C., Krueger, R.W. and Winkler, R.G. (1985) Structure and possible ureide degrading
function of the ubiquitous urease of soybean. Plant Physiol. 79, 794-800.
Polacco, J.C. and Winkler, R.G. (1984) Soybean Leaf Urease: A Seed Enzyme? Plant Physiol.
74, 800-803.
Prakash, O. and Bhushan, G. (1997) Isolation, purification and partial characterization of urease
from seeds of watermelon (Citrullus vulgaris). J. Plant Biochem. Biotechnol. 6, 45-47.
Rejikumar, S. and Devi, S. (1998) Preparation and characterization of urease bound on
crosslinked poly(vinyl alcohol). J. Mol. Catal. B Enzym. 4, 61-66.
Schneider, J. and Kaltwasser, H. (1984) Urease from Arthrobacter oxydans, a nickel-containing
enzyme. Arch. Microbiol. 139, 355-360.
Smith, P.T., Douglas, A.K.J. and Goodman, N. (1993) Isolation and characterization of urease
from Aspergillus niger. J. Gen. Microbiol. 139, 957-962.
Stemke, G.W., Robertson, J.A. and Nhan, M. (1987) Purification of urease from Ureaplasma
urealyticum. Can. J. Microbiol. 33, 857-862.
Takeuchi, T. (1909) On the occurrence of urease in higher plants. J. Coll. Ar. Imp. Univ. 1, 1-14.
Talsky, G. and Klunker, G. (1967) On the temperature dependency of enzymatic reactions, IV.
Hydrolysis of urea by urease. Hoppe-Seyler’s Z. Physiol. Chem. 348, 1372-1376.
Tange, Y. and Niwa, O. (1997) Identification of the ure1+ gene encoding urease in fission yeast.
Curr. Genet. 32, 244-246.
Todd, M.J. and Hausinger, R.P. (1989) Competitive inhibitors of Klebsiella aerogenes urease.
Mechanisms of interaction with the nickel active site. J. Biol. Chem. 264,15835-15842.
Todd, M.J. and Hausinger, R.P. (1987) Purification and characterization of the nickel-containing
multicomponent urease from Klebsiella aerogenes. J. Biol. Chem. 262, 5963-5967.
Torisky, R.S. and Polacco, J.C. (1990) Soybean roots retain the seed urease isozyme synthesized
during embryo development. Plant Physiol. 94, 681-689.
15
Yamazaki, E., Kurasawa, T., Kakimoto, S., Sumino, Y. and Nakatsui, I. (1990) Characteristics of
acid urease from Streptococcus mitior. Agric, Biol, Chem. 54, 2433-2435.
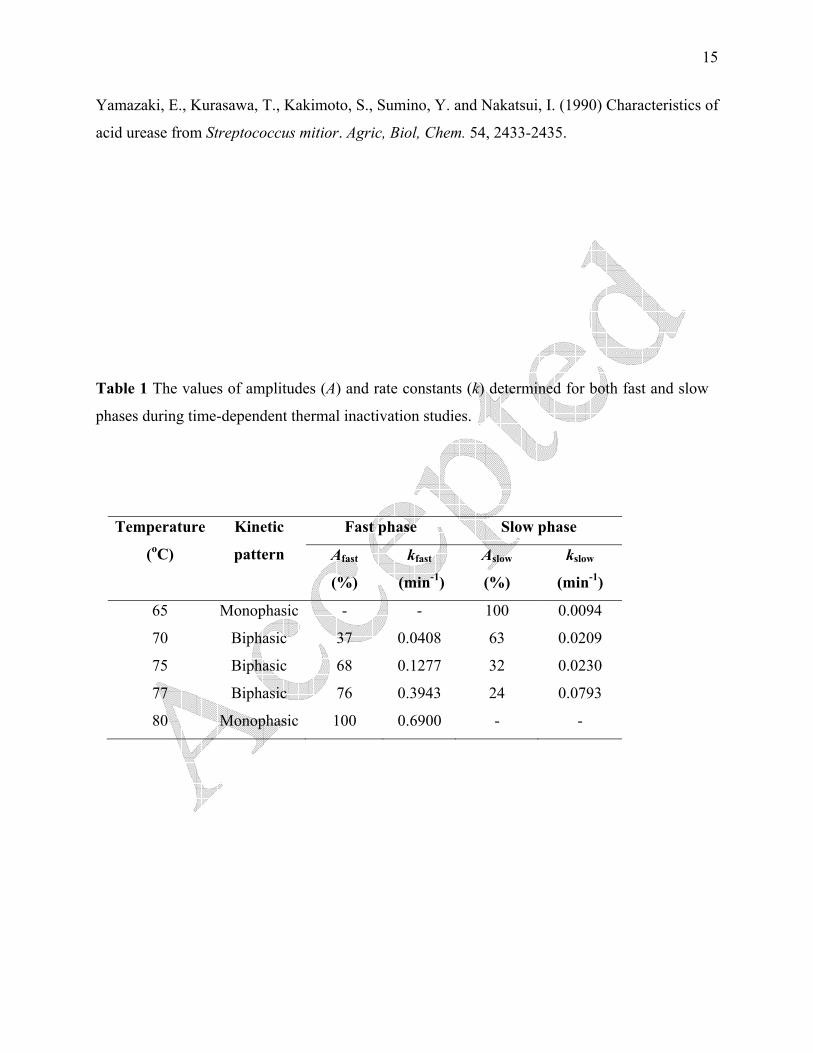
Table 1 The values of amplitudes (A) and rate constants (k) determined for both fast and slow
phases during time-dependent thermal inactivation studies.
Temperature
(oC)
Kinetic
pattern
Fast phase Slow phase
Afast
(%)
kfast
(min-1)
Aslow
(%)
kslow
(min-1)
65 Monophasic - - 100 0.0094
70 Biphasic 37 0.0408 63 0.0209
75 Biphasic 68 0.1277 32 0.0230
77 Biphasic 76 0.3943 24 0.0793
80 Monophasic 100 0.6900 - -

16
FIGURE LEGENDS
Figure 1. Comparing the storage stability of soybean urease at 4 oC and 37 oC. Suitably diluted
urease (0.87 μg/mL) was assayed at standard conditions after incubating at the indicated
temperatures. Each experimental point represents the mean of three determinations.
Figure 2. Determining the optimum pH of soybean urease. Suitably diluted urease (0.87 μg/mL)
was assayed at various pH under standard assay conditions. Each experimental point represents
the mean of three determinations.
Figure 3. Determining the optimum temperature of soybean urease. Suitably diluted urease (0.87
μg/mL) was assayed at various temperatures. Each experimental point represents the mean of
three determinations.
Figure 4. Determining the activation energy (Ea) from Arrhenious plot. Data from Figure 3 was
replotted in the temperature range 20-60 oC.
Figure 5. Determining the kinetic parameters, Km and Vmax from Lineweaver-Burk plot. Inset
shows the effect of substrate concentration on the activity of soybean urease. Suitably diluted
urease (0.87 μg/mL) was assayed in the presence of varying concentrations of urea (1-40 mM)
and at standard conditions. Each experimental point represents the mean of three determinations.
Figure 6. (a,b,c). Thermal inactivation studies of soybean urease at various temperatures.
Suitably diluted urease (0.87 μg/mL) was assayed at standard conditions after incubating at the
indicated temperatures. Each experimental point represents the mean of three determinations.
17
Figure 1
Time (days)
0 10 20 30 40
log
% R
esid
ual A
ctiv
ity
0.8
1.0
1.2
1.4
1.6
1.8
2.0
4 oC 37 oC
18
Figure 2
pH
4 5 6 7 8 9
Rel
ativ
e A
ctiv
ity (%
)
0
20
40
60
80
100
Citrate phosphate bufferPhosphate bufferTris buffer
19
Figure 3
Temperature (oC)
10 20 30 40 50 60 70 80 90
Rel
ativ
e Ac
tivity
(%)
0
20
40
60
80
100
20
Figure 4
1/T (10-3 K-1)
2.9 3.0 3.1 3.2 3.3 3.4 3.5
log
Vm
ax (µ
mol
min
-1 m
g-1)
1.8
2.0
2.2
2.4
2.6
2.8
21
Figure 5
1/[S] mM-1-0.4 -0.3 -0.2 -0.1 0.0 0.1 0.2 0.3
1/v
(10-3
µm
ole-1
min
mg)
0
2
4
6
8
10
[Urea] mM0 10 20 30 40 50
v (µ
mol
min
-1 m
g-1)
0
50
100
150
200
250
300
22
Figure 6 (a)
Time (min)
0 20 40 60 80 100 120 140
log
% R
esid
ual A
ctiv
ity
1.0
1.2
1.4
1.6
1.8
2.0
65oC70oC
23
Figure 6 (b)
Time (min)
0 10 20 30 40 50 60
log
% R
esid
ual A
ctiv
ity
0.8
1.0
1.2
1.4
1.6
1.8
2.0
Time (min)
0 5 10 15 20 25 30
log
diffe
renc
e
0.20.40.60.81.01.21.41.61.82.0

24
Figure 6 (c)
Time (min)
0 2 4 6 8 10
log
% R
esid
ual A
ctiv
ity
0.8
1.0
1.2
1.4
1.6
1.8
2.0
77 oC80 oC
Time (min)
0.5 1.0 1.5 2.0 2.5 3.0 3.5 4.0 4.5lo
g di
ffere
nce
0.6
0.8
1.0
1.2
1.4
1.6
1.8